CANADA: PULSE AND SPECIAL CROPS OUTLOOK - SeedQuest
CANADA: PULSE AND SPECIAL CROPS OUTLOOK - SeedQuest
CANADA: PULSE AND SPECIAL CROPS OUTLOOK - SeedQuest
You also want an ePaper? Increase the reach of your titles
YUMPU automatically turns print PDFs into web optimized ePapers that Google loves.
<strong>CANADA</strong>: <strong>PULSE</strong> <strong>AND</strong> <strong>SPECIAL</strong> <strong>CROPS</strong> <strong>OUTLOOK</strong> September 17, 2008<br />
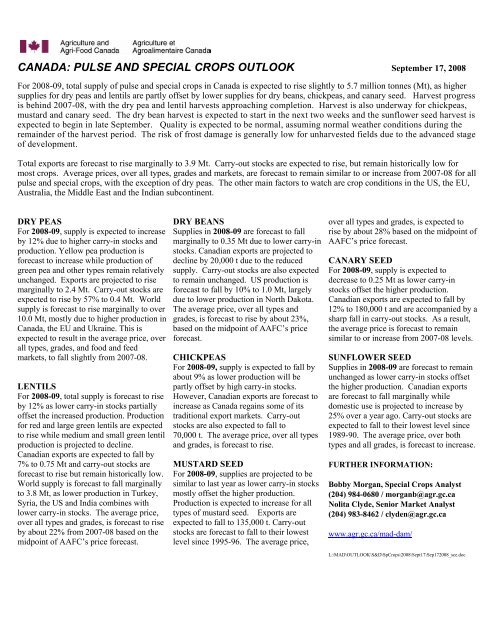
For 2008-09, total supply of pulse and special crops in Canada is expected to rise slightly to 5.7 million tonnes (Mt), as higher<br />
supplies for dry peas and lentils are partly offset by lower supplies for dry beans, chickpeas, and canary seed. Harvest progress<br />
is behind 2007-08, with the dry pea and lentil harvests approaching completion. Harvest is also underway for chickpeas,<br />
mustard and canary seed. The dry bean harvest is expected to start in the next two weeks and the sunflower seed harvest is<br />
expected to begin in late September. Quality is expected to be normal, assuming normal weather conditions during the<br />
remainder of the harvest period. The risk of frost damage is generally low for unharvested fields due to the advanced stage<br />
of development.<br />
Total exports are forecast to rise marginally to 3.9 Mt. Carry-out stocks are expected to rise, but remain historically low for<br />
most crops. Average prices, over all types, grades and markets, are forecast to remain similar to or increase from 2007-08 for all<br />
pulse and special crops, with the exception of dry peas. The other main factors to watch are crop conditions in the US, the EU,<br />
Australia, the Middle East and the Indian subcontinent.<br />
DRY PEAS<br />
For 2008-09, supply is expected to increase<br />
by 12% due to higher carry-in stocks and<br />
production. Yellow pea production is<br />
forecast to increase while production of<br />
green pea and other types remain relatively<br />
unchanged. Exports are projected to rise<br />
marginally to 2.4 Mt. Carry-out stocks are<br />
expected to rise by 57% to 0.4 Mt. World<br />
supply is forecast to rise marginally to over<br />
10.0 Mt, mostly due to higher production in<br />
Canada, the EU and Ukraine. This is<br />
expected to result in the average price, over<br />
all types, grades, and food and feed<br />
markets, to fall slightly from 2007-08.<br />
LENTILS<br />
For 2008-09, total supply is forecast to rise<br />
by 12% as lower carry-in stocks partially<br />
offset the increased production. Production<br />
for red and large green lentils are expected<br />
to rise while medium and small green lentil<br />
production is projected to decline.<br />
Canadian exports are expected to fall by<br />
7% to 0.75 Mt and carry-out stocks are<br />
forecast to rise but remain historically low.<br />
World supply is forecast to fall marginally<br />
to 3.8 Mt, as lower production in Turkey,<br />
Syria, the US and India combines with<br />
lower carry-in stocks. The average price,<br />
over all types and grades, is forecast to rise<br />
by about 22% from 2007-08 based on the<br />
midpoint of AAFC’s price forecast.<br />
DRY BEANS<br />
Supplies in 2008-09 are forecast to fall<br />
marginally to 0.35 Mt due to lower carry-in<br />
stocks. Canadian exports are projected to<br />
decline by 20,000 t due to the reduced<br />
supply. Carry-out stocks are also expected<br />
to remain unchanged. US production is<br />
forecast to fall by 10% to 1.0 Mt, largely<br />
due to lower production in North Dakota.<br />
The average price, over all types and<br />
grades, is forecast to rise by about 23%,<br />
based on the midpoint of AAFC’s price<br />
forecast.<br />
CHICKPEAS<br />
For 2008-09, supply is expected to fall by<br />
about 9% as lower production will be<br />
partly offset by high carry-in stocks.<br />
However, Canadian exports are forecast to<br />
increase as Canada regains some of its<br />
traditional export markets. Carry-out<br />
stocks are also expected to fall to<br />
70,000 t. The average price, over all types<br />
and grades, is forecast to rise.<br />
MUSTARD SEED<br />
For 2008-09, supplies are projected to be<br />
similar to last year as lower carry-in stocks<br />
mostly offset the higher production.<br />
Production is expected to increase for all<br />
types of mustard seed. Exports are<br />
expected to fall to 135,000 t. Carry-out<br />
stocks are forecast to fall to their lowest<br />
level since 1995-96. The average price,<br />
over all types and grades, is expected to<br />
rise by about 28% based on the midpoint of<br />
AAFC’s price forecast.<br />
CANARY SEED<br />
For 2008-09, supply is expected to<br />
decrease to 0.25 Mt as lower carry-in<br />
stocks offset the higher production.<br />
Canadian exports are expected to fall by<br />
12% to 180,000 t and are accompanied by a<br />
sharp fall in carry-out stocks. As a result,<br />
the average price is forecast to remain<br />
similar to or increase from 2007-08 levels.<br />
SUNFLOWER SEED<br />
Supplies in 2008-09 are forecast to remain<br />
unchanged as lower carry-in stocks offset<br />
the higher production. Canadian exports<br />
are forecast to fall marginally while<br />
domestic use is projected to increase by<br />
25% over a year ago. Carry-out stocks are<br />
expected to fall to their lowest level since<br />
1989-90. The average price, over both<br />
types and all grades, is forecast to increase.<br />
FURTHER INFORMATION:<br />
Bobby Morgan, Special Crops Analyst<br />
(204) 984-0680 / morganb@agr.gc.ca<br />
Nolita Clyde, Senior Market Analyst<br />
(204) 983-8462 / clyden@agr.gc.ca<br />
www.agr.gc.ca/mad-dam/<br />
L:\MAD\<strong>OUTLOOK</strong>\S&D\SpCrops\2008\Sept17\Sep172008_sce.doc
<strong>CANADA</strong>: <strong>PULSE</strong>S <strong>AND</strong> <strong>SPECIAL</strong> <strong>CROPS</strong> SUPPLY <strong>AND</strong> DISPOSITION September 17, 2008<br />
Grain and<br />
Area<br />
Seeded<br />
Area<br />
Harvested Yield Production Imports (b)<br />
Total<br />
Supply Exports (b)<br />
Total<br />
Domestic Use<br />
(d)<br />
Carry-out<br />
Stocks<br />
Stocks-to-<br />
Use Ratio<br />
Average<br />
Price (e)<br />
Crop Year (a) thousand ha t/ha --------------------------------thousand metric tonnes--------------------------------- % $/t<br />
Dry Peas<br />
2005-2006 1,303 1,267 2.36 2,994 76 3,665 2,567 658 440 14 120<br />
2006-2007 1,261 1,231 2.05 2,520 60 3,020 1,969 846 205 7 180<br />
2007-2008f 1,469 1,443 2.03 2,935 37 3,177 2,201 721 255 9 305<br />
2008-2009f 1,536 1,495 2.19 3,272 35 3,562 2,350 812 400 13 270-300<br />
Lentils<br />
2005-2006 803 785 1.48 1,164 8 1,417 671 271 475 50 230<br />
2006-2007 516 504 1.25 630 13 1,118 852 127 139 14 310<br />
2007-2008f 540 534 1.26 674 9 822 810 -39 51 7 635<br />
2008-2009f 631 623 1.39 863 6 920 750 125 45 5 760-790<br />
Dry Beans<br />
2005-2006 192 172 1.85 318 39 362 284 48 30 9 495<br />
2006-2007 178 176 2.12 373 41 444 349 55 40 10 520<br />
2007-2008f 153 153 1.82 277 50 367 295 52 20 6 725<br />
2008-2009f 147 141 1.99 281 45 346 275 51 20 6 875-905<br />
Chickpeas<br />
2005-2006 79 73 1.42 104 7 158 64 81 13 9 490<br />
2006-2007 129 128 1.27 163 5 181 115 56 10 6 550<br />
2007-2008f 174 174 1.29 225 8 243 68 83 92 61 560<br />
2008-2009f 83 83 1.48 123 5 220 85 65 70 47 570-600<br />
Mustard Seed<br />
2005-2006 194 188 0.98 184 0 378 133 55 190 101 265<br />
2006-2007 134 130 0.83 108 1 299 153 55 91 44 380<br />
2007-2008f 176 176 0.65 114 1 206 168 11 27 15 695<br />
2008-2009f 198 186 0.95 177 0 204 135 49 20 11 875-905<br />
Canary Seed<br />
2005-2006 184 182 1.25 227 0 395 185 20 190 93 195<br />
2006-2007 136 131 1.02 133 0 323 178 25 120 59 335<br />
2007-2008f 178 174 0.93 162 0 282 204 11 67 31 560<br />
2008-2009f 164 160 1.12 179 0 246 180 26 40 19 560-590<br />
Sunflower Seed<br />
2005-2006 87 71 1.18 84 26 125 46 52 27 28 345<br />
2006-2007 77 77 2.04 157 12 196 121 57 18 10 395<br />
2007-2008f 81 79 1.58 125 17 160 112 36 12 8 585<br />
2008-2009f 71 71 1.82 129 19 160 105 45 10 7 630-660<br />
Total Pulses and Special Crops (c)<br />
2005-2006 2,842 2,738 1.85 5,075 156 6,500 3,950 1,185 1,365<br />
2006-2007 2,431 2,377 1.72 4,084 132 5,581 3,737 1,221 623<br />
2007-2008f 2,771 2,732 1.65 4,512 122 5,257 3,858 875 524<br />
2008-2009f 2,830 2,759 1.82 5,024 110 5,658 3,880 1,173 605<br />
(a) August-July crop year.<br />
(b) Excludes products.<br />
(c) Includes Pulses (dry peas, lentils, dry beans, chick peas) and Special Crops (mustard seed, canary seed, sunflower seed)<br />
(d) Includes food, feed, seed, waste and dockage. Total domestic use is calculated residually.<br />
(e) Producer price, FOB plant. Average over all types, grades and markets.<br />
f: forecast, Agriculture and Agri-Food Canada, September 17, 2008<br />
Source: Statistics Canada and industry consultations.


