Part IIB – Industry Empirical Studies Lecture 8: Contracts, Incentives ...
Part IIB – Industry Empirical Studies Lecture 8: Contracts, Incentives ...
Part IIB – Industry Empirical Studies Lecture 8: Contracts, Incentives ...

You also want an ePaper? Increase the reach of your titles
YUMPU automatically turns print PDFs into web optimized ePapers that Google loves.
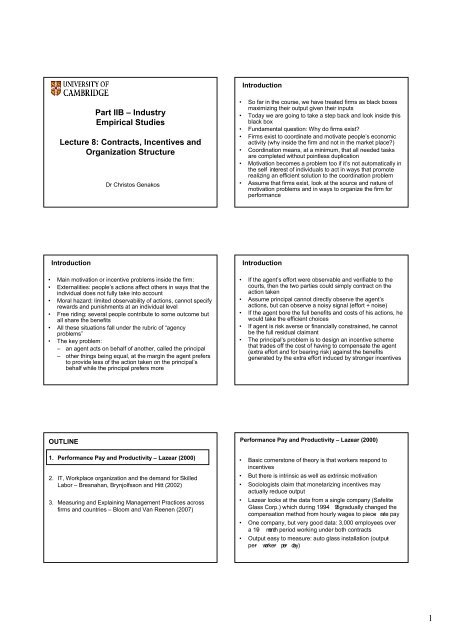
Introduction<br />
<strong>Part</strong> <strong>IIB</strong> <strong>–</strong> <strong>Industry</strong><br />
<strong>Empirical</strong> <strong>Studies</strong><br />
<strong>Lecture</strong> 8: <strong>Contracts</strong>, <strong>Incentives</strong> and<br />
Organization Structure<br />
Dr Christos Genakos<br />
• So far in the course, we have treated firms as black boxes<br />
maximizing their output given their inputs<br />
• Today we are going to take a step back and look inside this<br />
black box<br />
• Fundamental question: Why do firms exist?<br />
• Firms exist to coordinate and motivate people’s economic<br />
activity (why inside the firm and not in the market place?)<br />
• Coordination means, at a minimum, that all needed tasks<br />
are completed without pointless duplication<br />
• Motivation becomes a problem too if it’s not automatically in<br />
the self- interest of individuals to act in ways that promote<br />
realizing an efficient solution to the coordination problem<br />
• Assume that firms exist, look at the source and nature of<br />
motivation problems and in ways to organize the firm for<br />
performance<br />
Introduction<br />
• Main motivation or incentive problems inside the firm:<br />
• Externalities: people’s actions affect others in ways that the<br />
individual does not fully take into account<br />
• Moral hazard: limited observability of actions, cannot specify<br />
rewards and punishments at an individual level<br />
• Free riding: several people contribute to some outcome but<br />
all share the benefits<br />
• All these situations fall under the rubric of “agency<br />
problems”<br />
• The key problem:<br />
<strong>–</strong> an agent acts on behalf of another, called the principal<br />
<strong>–</strong> other things being equal, at the margin the agent prefers<br />
to provide less of the action taken on the principal’s<br />
behalf while the principal prefers more<br />
Introduction<br />
• If the agent’s effort were observable and verifiable to the<br />
courts, then the two parties could simply contract on the<br />
action taken<br />
• Assume principal cannot directly observe the agent’s<br />
actions, but can observe a noisy signal (effort + noise)<br />
• If the agent bore the full benefits and costs of his actions, he<br />
would take the efficient choices<br />
• If agent is risk averse or financially constrained, he cannot<br />
be the full residual claimant<br />
• The principal’s problem is to design an incentive scheme<br />
that trades off the cost of having to compensate the agent<br />
(extra effort and for bearing risk) against the benefits<br />
generated by the extra effort induced by stronger incentives<br />
OUTLINE Performance Pay and Productivity <strong>–</strong> Lazear (2000)<br />
1. Performance Pay and Productivity <strong>–</strong> Lazear (2000)<br />
2. IT, Workplace organization and the demand for Skilled<br />
Labor <strong>–</strong> Bresnahan, Brynjolfsson and Hitt (2002)<br />
3. Measuring and Explaining Management Practices across<br />
firms and countries <strong>–</strong> Bloom and Van Reenen (2007)<br />
• Basic cornerstone of theory is that workers respond to<br />
incentives<br />
• But there is intrinsic as well as extrinsic motivation<br />
• Sociologists claim that monetarizing incentives may<br />
actually reduce output<br />
• Lazear looks at the data from a single company (Safelite<br />
Glass Corp.) which during 1994- 95 gradually changed the<br />
compensation method from hourly wages to piece- rate pay<br />
• One company, but very good data: 3,000 employees over<br />
a 19- month period working under both contracts<br />
• Output easy to measure: auto glass installation (outputper-<br />
worker- per- day)<br />
1
Performance Pay and Productivity <strong>–</strong> Lazear (2000)<br />
Performance Pay and Productivity <strong>–</strong> Lazear (2000)<br />
The new contract offered a guarantee at approximately the<br />
former wage: paid W to anyone earned less than W under<br />
the piece rate, but paid the piece rate to all of those whose<br />
composition by the piece- rate formula would have<br />
exceeded W<br />
Theory tells us that:<br />
Effort does not decrease when the firm switches, and as<br />
long as there are some high ability workers, average effort<br />
increases<br />
A sufficient condition for the range of worker ability and<br />
output to rise after the switch is that some workers choose<br />
to work enough to be in the piece- rate range (variability of<br />
output is expected to rise)<br />
Data: information on approx. 3,000 workers producing before<br />
and after the switch in contracts, productivity: average<br />
number of units installed by a given worker during a given<br />
month<br />
Results:<br />
Performance Pay and Productivity <strong>–</strong> Lazear (2000)<br />
Discussion<br />
Results<br />
1. 44% gain in productivity when switch to piece rates<br />
2. Approximately half of the increase in productivity reflects<br />
an incentive effect<br />
3. Sorting accounts for the rest (new workers hired after the<br />
switch are more productive)<br />
4. Learning is important<br />
5. There is no Hawthorne effect (ANY change is likely to<br />
bring short term gains in productivity)<br />
6. Unlikely that the effect is spurious (rolled out<br />
geographically)<br />
7. Also wages rise 7%, so both capital and labor better off<br />
(not necessarily the case according to theory)!<br />
Output easily measured, quality problems readily detected<br />
and blame is assignable few similar workplaces<br />
If work is multi- tasking very expensive to provide explicit<br />
incentives for all tasks and if you give incentives only for<br />
some tasks people are going to do just that!<br />
People might start manilupating their performance<br />
measures (Oyer, 1998)<br />
Even worse workers might start sabotaging their coworkers<br />
(Garicano, Palacios- Huerta 05)<br />
Reputation and creating a “culture”<br />
OUTLINE<br />
1. Performance Pay and Productivity <strong>–</strong> Lazear (2000)<br />
2. IT, Workplace organization and the demand for Skilled<br />
Labor <strong>–</strong> Bresnahan, Brynjolfsson and Hitt (2002)<br />
3. Measuring and Explaining Management Practices across<br />
firms and countries <strong>–</strong> Bloom and Van Reenen (2007)<br />
IT, Workplace organization and Skilled Labor <strong>–</strong> Bresnahan,<br />
Brynjolfsson and Hitt (2002)<br />
Key concept: complementarity<br />
Two choice variables are complements when doing one of<br />
them increases the returns to doing the other<br />
Neither the investments nor the organizational changes might<br />
be worthwhile on their own, but together they have a huge<br />
positive effect on performance<br />
Background: Skill- biased technical change means that<br />
technical progress shifts demand towards more highly<br />
skilled workers relative to less skilled<br />
Not all technological revolutions were skilled biased, IT is!<br />
BBH question: How information technology is used in<br />
production?<br />
2
IT, Workplace organization and Skilled Labor <strong>–</strong> Bresnahan,<br />
Brynjolfsson and Hitt (2002)<br />
BBH: “Firms do not simply plug in computers or<br />
telecommunications equipment and achieve service quality or<br />
efficiency gains. Instead they go through a process of<br />
organizational redesign and make substantial changes to their<br />
product and service mix. This raises the possibility that<br />
computers affect labor demand not only directly, as has been<br />
previously studied, but indirectly through other firm-level<br />
changes.”<br />
In other words, to realise the IT benefits firms also need to<br />
invest in changes in organization practices and changes in<br />
products and services taken together<br />
IT, Workplace organization and Skilled Labor <strong>–</strong> Bresnahan,<br />
Brynjolfsson and Hitt (2002)<br />
Declines in IT prices increase adoption and use of IT <br />
increases the economic attractiveness of complementary<br />
investments in work organization and product & service<br />
innovations further increasing demand for IT<br />
Individually and collectively, these three innovations increase<br />
the relative demand for skilled labor<br />
Data:<br />
Panel of IT capital and mix over 1987- 1994<br />
Production function inputs and outputs over 1987- 1994<br />
Cross section survey of organization practices and labor force<br />
characteristics<br />
Approx. 300 large US firms<br />
IT, Workplace organization and Skilled Labor <strong>–</strong> Bresnahan,<br />
Brynjolfsson and Hitt (2002)<br />
Two empirical specifications. The short run input choice<br />
function:<br />
Qcit = f ( Qc′<br />
it<br />
, controls)<br />
where Q cit are firms’ choices that vary more easily as a function<br />
of the others c’ which are fixed or quasi- fixed at the firm<br />
level. Controls: firm size, industry, production process<br />
proxies<br />
They also estimate production functions of the form:<br />
( S − M ) f ( L , K , Q controls)<br />
log =<br />
it it<br />
it it cit;<br />
Dependent: Log (value added), plus interactions to capture<br />
complementarities<br />
IT, Workplace organization and Skilled Labor <strong>–</strong> Bresnahan,<br />
Brynjolfsson and Hitt (2002)<br />
Results:<br />
Evidence of complementarities, but also data limitations<br />
A firm high on all three axes (human capital, IT and work<br />
organization) has a 7% increase in productivity to a firm that<br />
is at the mean on all three, over and above the direct effect<br />
of higher IT capital<br />
Even more interestingly, when the authors changed the mix<br />
(high- low- high, etc), predicted productivity falls to worse<br />
than mean in all cases<br />
Low- low- low is exceptional as it has the same predicted<br />
productivity as the mean<br />
“Old style” firms, internal consistency, “coherent<br />
combination”<br />
OUTLINE<br />
1. Performance Pay and Productivity <strong>–</strong> Lazear (2000)<br />
2. IT, Workplace organization and the demand for Skilled<br />
Labor <strong>–</strong> Bresnahan, Brynjolfsson and Hitt (2002)<br />
3. Measuring and Explaining Management Practices<br />
across firms and countries <strong>–</strong> Bloom and Van Reenen<br />
(2007)<br />
Measuring and Explaining Management Practices across<br />
firms and countries <strong>–</strong> Bloom and Van Reenen (2007)<br />
Large persistent productivity spread across firms and<br />
countries<br />
People typically claim this is due to differences in<br />
“management”<br />
But what is the role of management?<br />
And why does it vary so much across firms and countries?<br />
3
STEPS TO TRY TO MEASURE MANAGEMENT<br />
1) Developing management practice scoring<br />
• Scorecard for 18 monitoring, targets and incentives practices<br />
• 45 minute phone interview of (manufacturing plant) managers<br />
2) Obtaining unbiased responses<br />
• “Double- blind”<br />
• Interviewers do not know company performance<br />
• Managers are not informed (in advance) they are scored<br />
3) Getting firms to participate in the interview<br />
• Introduced as “Lean- manufacturing” interview, no financials<br />
• Endorsement of Bundesbank ,UK Treasury, Banque de France<br />
• Run by 10 MBAs (loud, assertive & business experience)<br />
MONITORING - i.e. “HOW IS PERFORMANCE TRACKED?”<br />
Score<br />
(1): Measures<br />
tracked do not<br />
indicate directly<br />
if overall<br />
business<br />
objectives are<br />
being met.<br />
Certain<br />
processes aren’t<br />
tracked at all<br />
(3): Most key<br />
performance<br />
indicators<br />
are tracked<br />
formally.<br />
Tracking is<br />
overseen by<br />
senior<br />
management<br />
(5): Performance is<br />
continuously<br />
tracked and<br />
communicated,<br />
both formally and<br />
informally, to all<br />
staff using a range<br />
of visual<br />
management tools<br />
Note: All 18 dimensions and over 50 examples in Bloom & VanReenen (2006)<br />
MANAGEMENT SURVEY SAMPLE<br />
• US (290), UK, France and Germany (≈150 each)<br />
• Medium sized manufacturers (100 - 10,000 employees,<br />
median ≈ 600)<br />
• Medium sized because firm practices more homogeneous<br />
• Manufacturing as easier to measure productivity<br />
• Obtained 54% coverage rate from sampling frame<br />
• Response rates uncorrelated with performance measures<br />
INTERVAL VALIDATION OF THE SCORING<br />
• Re- interviewed 64 firms with different interviewers and managers<br />
Firm average scores (over 18 question)<br />
2 nd interview<br />
5<br />
4<br />
3<br />
`<br />
2<br />
• Firm- level average<br />
correlation of 0.759<br />
1<br />
1 2 3 4 5<br />
1 st interview<br />
EXTERNAL VALIDATION OF THE SCORING<br />
Performance<br />
measure<br />
country c<br />
c<br />
c c<br />
c c c c c<br />
y c c<br />
it<br />
= βMNGi<br />
+ α llit<br />
+ α kkit<br />
+ α mmit<br />
+ γ ' xit<br />
+<br />
management<br />
ln(capital) other controls<br />
(average z- scores) ln(labor) ln(materials)<br />
• Use up to 11 years of accounting data for 1994- 2004<br />
• Note <strong>–</strong> not a causal estimation, only an association<br />
u<br />
c<br />
it<br />
EXTERNAL VALIDATION: PRODUCTIVITY & PROFIT<br />
Dependent<br />
variable<br />
Sales<br />
(in Ln)<br />
Sales<br />
(in Ln)<br />
Sales<br />
(in Ln)<br />
ROCE<br />
Tobin Q<br />
(in Ln)<br />
Sales<br />
growth<br />
1<br />
Management i<br />
Estimation OLS OLS OLS OLS OLS OLS Probit<br />
Firms<br />
All All All All Quoted All All<br />
0.085 0.034<br />
0.042 2.469<br />
0.250 0.018<br />
(0.025) (0.011)<br />
(0.012) (0.688)<br />
(0.075)- (0.006)<br />
-0.200<br />
[0.026]<br />
Controls 1 No Yes Yes Yes Yes Yes Yes<br />
Ln(Labor) it<br />
0.999 0.539<br />
0.540 2.172<br />
0.209 -0.022<br />
(0.014) (0.021)<br />
(0.021) (1.202)<br />
(0.109) (0.011)<br />
0.233<br />
[0.045]<br />
0.103<br />
0.104 -0.148<br />
-0.029 0.024 -0.158<br />
Ln(Capital) it (0.013)<br />
(0.013) (0.899)<br />
(0.086) (0.008) [0.045]<br />
Ln(Materials) it<br />
0.362<br />
0.354 -0.439<br />
0.130 -0.010 -0.084<br />
(0.020)<br />
(0.020) (0.723)<br />
(0.050) (0.007) [0.231]<br />
Noise controls No No Yes Yes Yes Yes Yes<br />
Observations 6,267 5,350 5,350 5,089 2,635 4,777 709<br />
Firms<br />
732 709 709 690 374 702 709<br />
1<br />
Includes country, year, SIC3 industry, skills, hours, firm-age, and public/private<br />
Robust S.E.s in ( ) below. For probit p-values in [ ] below<br />
Exit<br />
4
FIRM LEVEL AVERAGE MANAGEMENT SCORES<br />
Density<br />
Density<br />
.6 0 .2 .4 .6 .8 1 1.2 0 .2 .4 .8 1 1.2<br />
France n=137 Germany<br />
n=157<br />
1 2 3 4 5<br />
UK<br />
n=154<br />
Density<br />
Density<br />
.6 0 .2 .4 .6 .8 1 1.2 0 .2 .4 .8 1 1.2<br />
1 2 3 4 5<br />
US<br />
n=290<br />
COUNTRY LEVEL MANAGEMENT SCORES*<br />
US<br />
Germany<br />
France<br />
UK<br />
3.14<br />
3.07<br />
3.35<br />
3.31<br />
Bad manufacturing management - a UK tradition?<br />
Typical UK managers?<br />
“Efficient management is the single most significant factor<br />
in the American productivity advantage”<br />
[Marshall Plan Anglo- American productivity mission, 1947]<br />
1 2 3 4 5<br />
1 2 3 4 5<br />
Measuring and Explaining Management Practices across<br />
firms and countries <strong>–</strong> Bloom and Van Reenen (2007)<br />
Demonstrate that two factors appear significant:<br />
Production market competition <strong>–</strong> positive effect<br />
Family managed firms <strong>–</strong> negative effect<br />
Family firm ownership but not management is fine<br />
Family ownership and management problematic, particularly<br />
under primo geniture CEO succession<br />
Competition and family- management important, explains<br />
about 50% of firm- level management tail; and between 1/3 to<br />
2/3 of US- Europe management gap:<br />
<strong>–</strong> Europe has lower levels of competition<br />
<strong>–</strong> UK & France also many more primo geniture family firms<br />
due to Norman legal origin & tradition<br />
Management Practices across Europe, the US and Asia <strong>–</strong><br />
Bloom, Genakos, Sadun and Van Reenen (2008)<br />
Extend this methodology to 13 different countries across<br />
Europe, US and Asia<br />
Interview more than 4,000 firms<br />
Data also on their production function inputs<br />
Is there a role for management practices? Historically there<br />
was no international management data<br />
LINKED TO PERFORMANCE IN ALL THE<br />
COUNTRIES (NOT JUST ANGLO-SAXON ONES)<br />
Labor Productivity<br />
Labor Productivity<br />
/em ployee (in logs) - b asi c labor p roductivity m easure - ra w num bers<br />
4 5 6 7<br />
/em ployee (in logs) - b asi c labor p roductivity m easure - ra w num bers<br />
3 4 5 6 7<br />
US & UK<br />
1 2 3 4 5<br />
Our management score - average across 18 questions<br />
Management<br />
Greece, Portugal & Italy<br />
1 2 3 4 5<br />
Our management score - average across 18 questions<br />
Management<br />
Labor Productivity<br />
/em ployee (in lo gs) - basic la bor prod uctivity m e asure - raw num bers<br />
2 4 6 8<br />
/em ployee (in logs) - b asi c labor p roductivity m easure - ra w num bers<br />
2 4 6 8<br />
Japan & China<br />
1 2 3 4 5<br />
Our management score - average across 18 questions<br />
France, Germany, Sweden & Poland<br />
Labor Productivity<br />
Management<br />
1 2 3 4 5<br />
Our management score - average across 18 questions<br />
Management<br />
HETEROGENEITY IN MANAGEMENT SCORES BY<br />
COUNTRY<br />
Average management score, by country<br />
U.S.<br />
Germany<br />
Sweden<br />
Japan<br />
Italy<br />
UK<br />
France<br />
Poland<br />
Portugal<br />
Greece<br />
China<br />
India<br />
2.73<br />
2.64<br />
2.63<br />
2.62<br />
3.00<br />
3.00<br />
2.99<br />
2.88<br />
3.30<br />
3.17<br />
3.15<br />
3.15<br />
3 statistically distinct<br />
groups appear<br />
<strong>–</strong> U.S., Germany,<br />
Sweden and<br />
Japan<br />
<strong>–</strong> Italy, U.K.,<br />
France, and<br />
Poland<br />
<strong>–</strong> Portugal,<br />
Greece, China<br />
and India<br />
5
BUT THE US IS NOT BEST AT EVERYTHING - THERE<br />
ARE NATIONAL STRENGTHS & WEAKNESSES<br />
Greece<br />
Portugal<br />
India<br />
China<br />
Italy<br />
France<br />
Sweden<br />
Poland<br />
Japan<br />
UK<br />
Germany<br />
US<br />
People management<br />
Operations management<br />
0 1 2 3 4<br />
The US is world<br />
leading in people<br />
management, but<br />
Germany, Sweden<br />
and Japan are<br />
better on average<br />
at operations<br />
management<br />
MULTINATIONALS ARE WELL RUN EVERYWHERE<br />
Greece<br />
India<br />
Portugal<br />
China<br />
Poland<br />
France<br />
UK<br />
Italy<br />
Germany<br />
Sweden<br />
Japan<br />
US<br />
Multinationals<br />
Domestic firms<br />
Multinational<br />
presence also<br />
appears to be<br />
linked with<br />
better<br />
management of<br />
domestic firms<br />
0 1 2 3 4<br />
THE AVERAGE MANAGER ALSO THINKS HIS FIRMS<br />
MANAGEMENT IS WELL ABOVE AVERAGE<br />
Share D en sity of firms<br />
0 .1 .2 .3<br />
“Worst<br />
Practice”<br />
Response to the Question<br />
“Excluding yourself, how would you<br />
rate your company’s management<br />
from 1 to 10, one being the worst<br />
and ten being the best?”<br />
“Average”<br />
1 2 3 4 5 6 7 8 9 1 0<br />
Management self-score<br />
“Best<br />
Practice”<br />
AND THIS OVER-SCORING OCCURS IN EVERY<br />
COUNTRY IN OUR SAMPLE<br />
China<br />
Greece<br />
India<br />
Portugal<br />
Poland<br />
Italy<br />
France<br />
UK<br />
Japan<br />
Sweden<br />
Germany<br />
US<br />
0 1 2 3 4<br />
Actual score<br />
Self score*<br />
* Divided by 2 to normalize to a similar scale<br />
SUMMARY<br />
1. Innovative survey tool to collect management practice data<br />
for over 4000 firms across 13 countries<br />
2. Better management practices are strongly associated with<br />
superior firm performance<br />
3. Significant within country variation in management practices<br />
4. Key factors that can potentially explain this heterogeneity<br />
include: competition, type of ownership, MNE’s, skills,<br />
regulation and education.<br />
<strong>Contracts</strong>, <strong>Incentives</strong> and Organization Structure:<br />
References<br />
* Lazear, E. (2000) “Performance Pay and Productivity”,<br />
American Economic Review, 90:1346-61.<br />
* Bresnahan, T., Brynjolfsson, E. and L. Hitt (2002) “Information<br />
Technology, Workplace Organizationa dn the Demand for Skilled<br />
Labor: Firm-level evidence”, Quarterly Journal of Economics,<br />
February 339-376.<br />
* Bloom, N. and Van Reenen, J. (2007) “Measuring and<br />
Explaining Management Practices across firms and countries”,<br />
Quarterly Journal of Economics, November 1351-1408.<br />
It was hard work but…?<br />
6