A Numerical Analysis of R-EDFA for Long Haul Optical Fiber ...
A Numerical Analysis of R-EDFA for Long Haul Optical Fiber ...
A Numerical Analysis of R-EDFA for Long Haul Optical Fiber ...

You also want an ePaper? Increase the reach of your titles
YUMPU automatically turns print PDFs into web optimized ePapers that Google loves.
SETIT 2007<br />
4 th International Conference: Sciences <strong>of</strong> Electronic,<br />
Technologies <strong>of</strong> In<strong>for</strong>mation and Telecommunications<br />
March 25-29, 2007 – TUNISIA<br />
A <strong>Numerical</strong> <strong>Analysis</strong> <strong>of</strong> R-<strong>EDFA</strong> <strong>for</strong> <strong>Long</strong> <strong>Haul</strong><br />
<strong>Optical</strong> <strong>Fiber</strong> Communication System<br />
Nadir Hossain 1a , V. Mishra 1 , A.A.R. Hairul 1 , F.M. Abbou 1 , A.R. Faidz 1 , S. M. M.<br />
Quadir 1 , M.H. Al-Mansoori 1 , M.A. Mahdi 2 and A.W. Naji 1b<br />
1 Institute <strong>of</strong> Photonics Research & Applications, Multimedia University,<br />
63100 Cyberjaya, Selangor, Malaysia.<br />
a) nadir.hossain05@mmu.edu.my, b) ahmed.wathik@mmu.edu.my<br />
2 Photonics and <strong>Fiber</strong> Optic Systems Laboratory, Faculty <strong>of</strong> Engineering, University Putra Malaysia,<br />
43400 UPM Serdang, Selangor, Malaysia.<br />
Abstract: This paper presents a simple and efficient design process <strong>of</strong> a remotely pumped optimized Erbium doped<br />
fiber amplifier (R-<strong>EDFA</strong>) <strong>for</strong> repeaterless long haul optical fiber communication system (OFCS) by the numerical<br />
analysis <strong>of</strong> <strong>EDFA</strong> rate equation model. The length <strong>of</strong> Erbium doped fiber (EDF) is optimized using very low remote<br />
pump power. The effect <strong>of</strong> pump power, signal power, signal wavelength and amplified spontaneous emission (ASE) on<br />
the gain and noise figure (NF) <strong>of</strong> R-<strong>EDFA</strong> is described in details using the numerical simulation <strong>of</strong> the <strong>EDFA</strong> rate<br />
equation model. Using these findings as well as considering high gain and low NF <strong>of</strong> R-<strong>EDFA</strong> as main design<br />
objectives, the designers are able to carry out the design <strong>of</strong> an optimized R-<strong>EDFA</strong> <strong>for</strong> long haul OFCS by following the<br />
proposed design process.<br />
Key words: Erbium-doped fiber amplifier, <strong>Optical</strong> fiber communication system, Remote pump power.<br />
INTRODUCTION<br />
The availability <strong>of</strong> practical laser diode pump<br />
sources have made <strong>EDFA</strong>s ideal <strong>for</strong> 1550 nm long<br />
haul OFCS [Olsson, N. A. 1989]. The attractive<br />
features <strong>of</strong> <strong>EDFA</strong>s consist in their high gain, wide<br />
optical bandwidth, high-output saturation, near<br />
quantum limited noise, low insertion loss,<br />
polarization-independence and immunity to<br />
saturation-induced crosstalk [Mao, Q., Wang, J., Sun,<br />
X. and Zhang, M. 1999]. The R-<strong>EDFA</strong>s are attractive<br />
choice in repeaterless long haul OFCS where the<br />
establishment <strong>of</strong> inline power station is difficult like<br />
undersea communication. Because <strong>of</strong> the high<br />
importance <strong>of</strong> R-<strong>EDFA</strong>s in modern repeaterless long<br />
haul OFCS, a detailed analysis tool is essential in<br />
order to obtain the results <strong>of</strong> the system per<strong>for</strong>mance.<br />
Both analytical models [Zech, H. 1995] [Desurvire, E.<br />
1996] and numerical models [Mao, Q., Wang, J., Sun,<br />
X. and Zhang, M. 1999] [Ko, K. Y., Demokan, M. S.<br />
and Tam, H. Y. 1994] [Zhang, X. and Mitchell, 2000]<br />
have been reported previously <strong>for</strong> <strong>EDFA</strong>. This paper<br />
focuses on the optimization <strong>of</strong> R-<strong>EDFA</strong>s <strong>for</strong><br />
repeaterless long haul OFCS by the numerical solution<br />
<strong>of</strong> rate equation model [Giles, C. R. and Desurvire, E.<br />
1991] <strong>of</strong> <strong>EDFA</strong>. In this regard a systematic design<br />
process with example is described.<br />
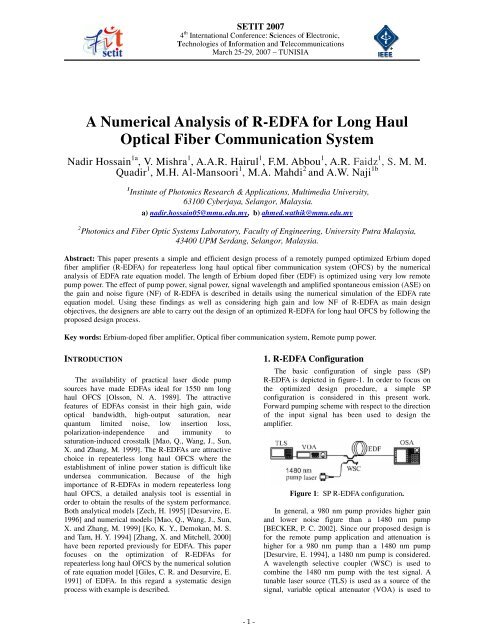
1. R-<strong>EDFA</strong> Configuration<br />
The basic configuration <strong>of</strong> single pass (SP)<br />
R-<strong>EDFA</strong> is depicted in figure-1. In order to focus on<br />
the optimized design procedure, a simple SP<br />
configuration is considered in this present work.<br />
Forward pumping scheme with respect to the direction<br />
<strong>of</strong> the input signal has been used to design the<br />
amplifier.<br />
Figure 1: SP R-<strong>EDFA</strong> configuration.<br />
In general, a 980 nm pump provides higher gain<br />
and lower noise figure than a 1480 nm pump<br />
[BECKER, P. C. 2002]. Since our proposed design is<br />
<strong>for</strong> the remote pump application and attenuation is<br />
higher <strong>for</strong> a 980 nm pump than a 1480 nm pump<br />
[Desurvire, E. 1994], a 1480 nm pump is considered.<br />
A wavelength selective coupler (WSC) is used to<br />
combine the 1480 nm pump with the test signal. A<br />
tunable laser source (TLS) is used as a source <strong>of</strong> the<br />
signal, variable optical attenuator (VOA) is used to<br />
- 1 -
SETIT2007<br />
attenuate the signal power as well as optical spectrum<br />
analyzer (OSA) is used to measure the amplified<br />
signal power and NF.<br />
2. Model<br />
Since the pumping at 1480 nm populates the upper<br />
amplifier level 4 I 13/2 <strong>of</strong> the Er 3+ ions directly, a two<br />
level transition between 4 I 15/2 - 4 I 13/2 is considered. We<br />
assume that the EDF medium is homogeneously<br />
broadened, ASE <strong>for</strong> polarization states as well as<br />
signal, pump and ASE are propagating in the<br />
fundamental mode. The population densities N 1 and<br />
N 2 <strong>of</strong> the 4 I 13/2 and 4 I 15/2 can be calculated as<br />
[Desurvire, E. 1994]:<br />
1+<br />
W21τ<br />
spon<br />
N 1 = ρ<br />
(1)<br />
1+ W + W τ + Rτ<br />
( 12 21)<br />
( 12 21)<br />
spon<br />
spon<br />
Rτ<br />
+ W12τ<br />
spon<br />
N 2 = ρ<br />
(2)<br />
1+ W + W τ + Rτ<br />
spon<br />
Where W 12 and W 21 are the up and down<br />
stimulated transition rates respectively, R is the<br />
pumping rate, τ is the fluorescence lifetime and by<br />
definition, ρ = N 1 + N 2 is the Er 3+ ion density per unit<br />
volume .Let us consider, σ<br />
SE<br />
( λ S<br />
), σ<br />
SA( λ S<br />
) ,<br />
σ<br />
PE<br />
( λ P<br />
), σ<br />
PA<br />
( λ P<br />
) are the emission and<br />
absorption cross sections at signal and pump<br />
frequencies V S and V P respectively. Γ<br />
S<br />
and ΓP<br />
are<br />
the overlap factor, representing the overlap between<br />
the erbium ions and the mode <strong>of</strong> the signal light field<br />
and pump light field respectively, and A is the<br />
effective cross-sectional area <strong>of</strong> the distribution <strong>of</strong><br />
erbium ions. The value <strong>of</strong> W 12 , W 21 and R can be<br />
calculated as:<br />
( ) -<br />
spon<br />
Γ<br />
W 12 = ⎡<br />
⎤<br />
⎦<br />
(3)<br />
σ<br />
SA<br />
λ<br />
S S<br />
PS +<br />
+<br />
PASE + PASE<br />
hVS<br />
A ⎣<br />
( )<br />
σ λ SE S<br />
ΓS<br />
⎡ PS + P + ASE + P<br />
−<br />
ASE<br />
hVS<br />
A ⎣<br />
W 21 = ⎤<br />
⎦<br />
(4)<br />
P<br />
+ Γ<br />
Pσ<br />
P ( λP<br />
)<br />
R = (5)<br />
+<br />
dP p<br />
dz<br />
dP S<br />
dz<br />
+<br />
dP ASE<br />
dz<br />
hV A<br />
P<br />
Where h is the Plank constant, P<br />
S<br />
is the signal<br />
+<br />
power, P<br />
P<br />
is the <strong>for</strong>ward pump power as well as<br />
+<br />
−<br />
P<br />
ASE<br />
and P<br />
ASE<br />
are the <strong>for</strong>ward and backward<br />
spontaneous emission spectrum <strong>of</strong> SP R-<strong>EDFA</strong>. The<br />
equations describing the spatial development<br />
+ +<br />
−<br />
<strong>of</strong> P<br />
S<br />
, P<br />
P<br />
, PASE<br />
and P<br />
ASE<br />
can be written as based on<br />
the Giles and Desurvire model [Giles, C. R. and<br />
Desurvire, E. 1991]:<br />
( PE ( P ) PA ( P ) )<br />
= P Γ σ λ N −σ λ N − α P (6)<br />
+ +<br />
p p 2 1 p p<br />
= PS Γ<br />
S ( σ<br />
SE ( λS ) N<br />
2<br />
− σ<br />
SA ( λ<br />
S ) N<br />
1 ) − α<br />
S<br />
PS<br />
(7)<br />
+<br />
PASE Γ<br />
S ( σ<br />
SE ( λS ) N<br />
2<br />
− σ<br />
SA ( λS<br />
) N1<br />
=<br />
)<br />
+<br />
+ 2σ ( λ ) N Γ hV ∆v − α P<br />
(8)<br />
SE S 2 S S S ASE<br />
- 2 -<br />
−<br />
− −PASE ΓS ( σ<br />
SE ( λS ) N<br />
2<br />
− σ<br />
SA ( λS<br />
) N1<br />
)<br />
−<br />
+ 2σ ( λ ) N Γ hV ∆ v + α P<br />
dP ASE<br />
dz<br />
= (9)<br />
ηN2<br />
ηSP<br />
=<br />
ηN<br />
− N<br />
SE S 2 S S S ASE<br />
Where z is the co-ordinate along the <strong>EDFA</strong>. The<br />
second term on the right hand side <strong>of</strong> equation (8) and<br />
(9) is the spontaneous noise power produced in the<br />
amplifier per unit length within the amplifier<br />
homogeneous bandwidth ∆v <strong>for</strong> both polarization<br />
states and α<br />
S<br />
and α<br />
P<br />
represents the internal signal<br />
and pump loss term <strong>of</strong> the amplifier respectively.<br />
Noise figure is closely related to ASE, which is<br />
generated by through spontaneous emission and the<br />
number <strong>of</strong> spontaneous photons are given by<br />
[BECKER, P. C. 2002]:<br />
2 1<br />
Where η<br />
SP<br />
is known as the spontaneous<br />
σ<br />
SE<br />
emission factor and η = . The noise figure <strong>of</strong><br />
σ<br />
SP R-<strong>EDFA</strong> (NF( λ<br />
S )) at the signal wavelength λ<br />
S<br />
can be calculated as:<br />
1+ 2 ηSP[ G −1]<br />
NF( λ<br />
S ) = G<br />
(11)<br />
SA<br />
(10)<br />
Where G is the gain <strong>of</strong> SP R-<strong>EDFA</strong>. For high gain<br />
condition (G>20 dB) equation can be written as<br />
[Desurvire, E. 1994]:<br />
NF(<br />
λ ) ≈ 2 SP<br />
S<br />
η (12)<br />
3. <strong>Numerical</strong> Resolution<br />
The first order differential equations (6) – (9) are<br />
two boundary value problem. First we have used<br />
Runge-Kutta method to obtain a set <strong>of</strong> approximate<br />
solution and then relaxation method is used to make<br />
iterative adjustment to the solution. Initially we have<br />
per<strong>for</strong>med the integration from z = 0 to z = L, without<br />
considering<br />
− +<br />
+<br />
P<br />
ASE<br />
, i.e. P<br />
P<br />
(z = 0) = P<br />
P_initial<br />
(initial<br />
pump power to R-<strong>EDFA</strong>), P<br />
S<br />
(z = 0) = P<br />
+<br />
S_initial<br />
(initial signal power to R-<strong>EDFA</strong>) and P<br />
ASE<br />
(z = 0)<br />
= 0 as the initial boundary value. The whole set <strong>of</strong><br />
−<br />
equation including P are then integrated from z =<br />
−<br />
ASE<br />
ASE<br />
L to z = 0 with P (z = L) = 0. For the accuracy <strong>of</strong><br />
these quasisolutions we repeated the same procedure<br />
using relaxation method to make iterative adjustment<br />
to the solution. The EDF parameters used to simulate<br />
the model is shown in Table – I.<br />
S<br />
σ<br />
SA<br />
λ S = 2.910556003 X10 -25 m 2<br />
λ<br />
p = 1480 nm. σ<br />
SE λ S<br />
) = 4.118853202 X10 -25 m 2<br />
Γ<br />
S = 0.74 σ<br />
PA λ P<br />
= 2.787671233 X10 -25 m 2<br />
Γ<br />
P = 0.77 σ<br />
PE<br />
( λ P<br />
) = 0.810563905 X10 -25 m 2<br />
A = 1.633 X ∆v = 3100 GHz (25 nm)<br />
10 -11 m 2<br />
ρ = 300 ppm τ<br />
Spon = 0.0102 seconds<br />
α<br />
S =0.20 dB/Km α<br />
P = 0.24 dB/Km<br />
λ =1550 nm. ( )<br />
TABLE 1: EDF PARAMETERS FOR SIMULATION.
SETIT2007<br />
4. Results and Discussion<br />
In case <strong>of</strong> remotely pumped repeaterless long haul<br />
OFCS, location <strong>of</strong> the R-<strong>EDFA</strong> is far away from the<br />
remote pump source and <strong>for</strong> this reason the necessity<br />
<strong>of</strong> very low pump power is essential. Initially the<br />
designers need to determine the available pump power<br />
at the input <strong>of</strong> the R-<strong>EDFA</strong>. A very low remote pump<br />
power <strong>of</strong> 10 mW is considered at the input <strong>of</strong> the R-<br />
<strong>EDFA</strong> in this work. Now the length <strong>of</strong> the EDF is<br />
needed to be optimized with respect to the input pump<br />
power to achieve maximum gain and low NF. Upper<br />
(N2) and ground (N1) state population can be<br />
calculated with respect to the various EDF lengths<br />
from the numerical simulation. Figure -2 shows the<br />
population density in per cubic meter in the upper<br />
state and ground state as a function <strong>of</strong> position along a<br />
20 m long EDF using 10 mW pump power.<br />
and injected signal power <strong>of</strong> -35 dBm. Referring to<br />
figure 3, signal gain increases upto the length <strong>of</strong> 19<br />
meter and after the 19 meter it begins to reduce again<br />
which justifies the findings in figure - 2.<br />
Figure 3: Signal gain as a function <strong>of</strong> EDF length at<br />
1550 nm using 10 mW <strong>of</strong> pump power and injected<br />
signal power <strong>of</strong> -35 dBm.<br />
Figure -4 shows the signal gain and NF in dB as a<br />
function <strong>of</strong> pump power in mW using a 19 m long<br />
EDF at 1550 nm signal wavelength. From this figure,<br />
gain values are gradually increased and NF values are<br />
gradually decreased with the increment <strong>of</strong> pump<br />
power. This is because the population inversion<br />
increases with the increment <strong>of</strong> pump power.<br />
Figure 2: Population in the upper state (N2) and<br />
ground state (N1) as a function <strong>of</strong> position along a 20<br />
m long EDF at 1550 nm using 10 mW <strong>of</strong> pump power<br />
and injected signal power <strong>of</strong> -35 dBm.<br />
From this figure, after 19 meter length, upper state<br />
population is less than the ground state population. For<br />
this reason, if we use an EDF <strong>of</strong> length more than 19<br />
meter then the portion <strong>of</strong> the EDF that exceeds 19<br />
meter remains unpumped. This unpumped portion <strong>of</strong><br />
the EDF absorbs the signal and degrades the system<br />
per<strong>for</strong>mance. Moreover because <strong>of</strong> the additional<br />
length <strong>of</strong> EDF, backward ASE travels over a longer<br />
distance and become much higher at the beginning <strong>of</strong><br />
the EDF. So an EDF <strong>of</strong> length more than 19 meter<br />
causes higher backward ASE which depletes the<br />
inversion and robs gain at the expense <strong>of</strong> the signal.<br />
On the other hand, if an EDF <strong>of</strong> length less than 19<br />
meter is used <strong>for</strong> the proposed remotely pumped SP<br />
<strong>EDFA</strong> configuration then a portion <strong>of</strong> the pump power<br />
will remain unused which can causes more population<br />
inversion and hence the increment <strong>of</strong> the gain. For<br />
these reasons an EDF length <strong>of</strong> 19 meter is chosen as<br />
an optimized length <strong>for</strong> the proposed remotely<br />
pumped SP <strong>EDFA</strong> configuration.<br />
Figure -3 shows the signal gain as a function <strong>of</strong><br />
EDF length at 1550 nm using 10 mW <strong>of</strong> pump power<br />
Figure 4: Signal gain and NF in dB as a function <strong>of</strong><br />
pump power in mW using a 19 m long EDF at 1550<br />
nm signal wavelength and injected signal power <strong>of</strong> -35<br />
dBm.<br />
After certain pump power, upper state population<br />
reaches almost to a constant level and <strong>for</strong> this reason<br />
after a certain pump power gain and NF values<br />
become saturated which is noticed in the figure -4.<br />
Figure -5 shows that the gain values are gradually<br />
decreased and NF values are increased dramatically<br />
with the increment <strong>of</strong> signal power.<br />
- 3 -
SETIT2007<br />
5. Conclusion<br />
The physical bases <strong>of</strong> R-<strong>EDFA</strong> in long haul OFCS<br />
has described in details. The effects <strong>of</strong> pump power,<br />
signal power and signal wavelength on the gain and<br />
noise figure <strong>of</strong> the R-<strong>EDFA</strong> have analyzed using the<br />
numerical simulation. These numerical results will<br />
play an important role to design a practical C-band R-<br />
<strong>EDFA</strong> <strong>for</strong> the long haul OFCS from the point <strong>of</strong> view<br />
<strong>of</strong> optimal design <strong>of</strong> R-<strong>EDFA</strong>.<br />
ACKNOWLEDGEMENT<br />
Figure 5: Signal gain and NF in dB as a function <strong>of</strong><br />
signal power in dBm using a 19 m long EDF at 1550<br />
nm signal wavelength and injected pump power <strong>of</strong> 10<br />
mW.<br />
At higher input signal power levels, the strong<br />
signal significantly depletes the inversion and the<br />
pump is not able to replenish it as a result the gain<br />
decreases and NF increases rapidly with signal power.<br />
Figure -6 shows the signal gain in dB as a function <strong>of</strong><br />
signal wavelength <strong>for</strong> the pump powers indicated on<br />
the graphs and signal input power -35 dBm using a 19<br />
m long EDF. From this figure, gain <strong>for</strong> 1530 nm is<br />
high due to its higher emission cross section. The<br />
spectral shapes <strong>of</strong> the gain change nonuni<strong>for</strong>mly with<br />
the changes in pump power. In particular, as pump<br />
powers decrease, signals near 1530 nm will<br />
experience a drop in gain much more significant than<br />
that <strong>for</strong> signals near 1550 nm as shown in figure 6.<br />
Figure 6: Signal gain in dB as a function <strong>of</strong> signal<br />
wavelength (signal power input -35 dBm), <strong>for</strong> the<br />
pump powers indicated on the graphs using a 19 m<br />
long EDF.<br />
The authors wish to thank the application<br />
engineers <strong>of</strong> <strong>Fiber</strong>core Ltd, UK <strong>for</strong> the EDF<br />
parameters and all the members <strong>of</strong> Institute <strong>of</strong><br />
Photonics Research & Applications (IPRA),<br />
Multimedia University, Malaysia <strong>for</strong> helpful<br />
discussion.<br />
REFERENCES<br />
[BECKER, P. C. 2002] “Erbium-Doped <strong>Fiber</strong><br />
Amplifiers”, NY: Academic Press.<br />
[Desurvire, E. 1994] “Erbium-Doped <strong>Fiber</strong><br />
Amplifiers”, NY: John Wiley & Sons, Inc.<br />
[Desurvire, E. 1996] “An explicit Analytical Solution<br />
<strong>for</strong> the Transcendental Equation Describing Saturated<br />
Erbium-Doped <strong>Fiber</strong> Amplifier” <strong>Optical</strong> <strong>Fiber</strong><br />
Technology, Vol. 2, pp. 367-377.<br />
[Giles, C. R. and Desurvire, E. 1991] “Propagation<br />
<strong>of</strong> Signal and Noise in Concatenated Erbium Doped<br />
<strong>Fiber</strong> <strong>Optical</strong> Amplifiers”, IEEE Journal <strong>of</strong> Lightwave<br />
Technology, Vol. 9, No. 2, pp. 147-154.<br />
[Ko, K. Y., Demokan, M. S. and Tam, H. Y. 1994]<br />
“Transient <strong>Analysis</strong> <strong>of</strong> Erbium-Doped <strong>Fiber</strong> Amplifier”,<br />
IEEE Photonics Technology Letters, Vol. 6, No. 12, pp.<br />
1436-1438.<br />
[Mao, Q., Wang, J., Sun, X. and Zhang, M. 1999]<br />
“A theoretical analysis <strong>of</strong> amplification characteristics<br />
<strong>of</strong> bi-directional erbium doped fiber amplifiers with<br />
single erbium-doped fiber”, Optics Communication,<br />
Vol. 159, pp. 149-157.<br />
[Olsson, N. A. 1989] “Lightwave systems with<br />
optical amplifiers”, IEEE Journal <strong>of</strong> Lightwave<br />
Technology, Vol. 7, No. 7, pp. 1071-1082.<br />
[Zech, H. 1995] “Theoretical Investigation <strong>of</strong> the Gain<br />
Pr<strong>of</strong>ile <strong>of</strong> Erbium-Doped <strong>Fiber</strong> Amplifiers”, <strong>Optical</strong><br />
<strong>Fiber</strong> Technology, Vol. 1, pp. 327-330.<br />
[Zhang, X. and Mitchell, A. 2000] “A Simple Black<br />
Box Model <strong>for</strong> Erbium-Doped <strong>Fiber</strong> Amplifier”, IEEE<br />
Photonics Technology Letters, Vol. 12, No. 1, pp. 28-<br />
30.<br />
- 4 -