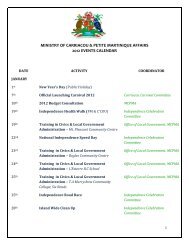
THE NATIONAL ENERGY POLICY OF GRENADA - Government of ...
THE NATIONAL ENERGY POLICY OF GRENADA - Government of ...
THE NATIONAL ENERGY POLICY OF GRENADA - Government of ...

Create successful ePaper yourself
Turn your PDF publications into a flip-book with our unique Google optimized e-Paper software.
<strong>GRENADA</strong><br />
2OVERVIEW<br />
<strong>OF</strong> <strong>THE</strong><br />
<strong>ENERGY</strong><br />
SITUATION<br />
2.1 <strong>THE</strong> GLOBAL SETTING<br />
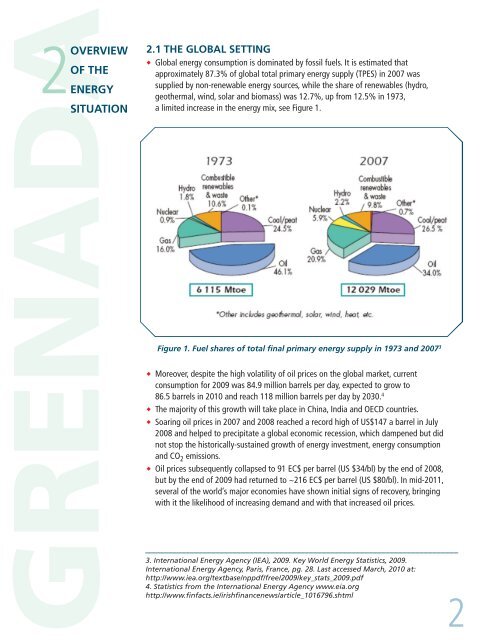
◆ Global energy consumption is dominated by fossil fuels. It is estimated that<br />
approximately 87.3% <strong>of</strong> global total primary energy supply (TPES) in 2007 was<br />
supplied by non-renewable energy sources, while the share <strong>of</strong> renewables (hydro,<br />
geothermal, wind, solar and biomass) was 12.7%, up from 12.5% in 1973,<br />
a limited increase in the energy mix, see Figure 1.<br />
Figure 1. Fuel shares <strong>of</strong> total final primary energy supply in 1973 and 2007 3<br />
◆ Moreover, despite the high volatility <strong>of</strong> oil prices on the global market, current<br />
consumption for 2009 was 84.9 million barrels per day, expected to grow to<br />
86.5 barrels in 2010 and reach 118 million barrels per day by 2030. 4<br />
◆ The majority <strong>of</strong> this growth will take place in China, India and OECD countries.<br />
◆ Soaring oil prices in 2007 and 2008 reached a record high <strong>of</strong> US$147 a barrel in July<br />
2008 and helped to precipitate a global economic recession, which dampened but did<br />
not stop the historically-sustained growth <strong>of</strong> energy investment, energy consumption<br />
and CO 2 emissions.<br />
◆ Oil prices subsequently collapsed to 91 EC$ per barrel (US $34/bl) by the end <strong>of</strong> 2008,<br />
but by the end <strong>of</strong> 2009 had returned to ~216 EC$ per barrel (US $80/bl). In mid-2011,<br />
several <strong>of</strong> the world’s major economies have shown initial signs <strong>of</strong> recovery, bringing<br />
with it the likelihood <strong>of</strong> increasing demand and with that increased oil prices.<br />
3. International Energy Agency (IEA), 2009. Key World Energy Statistics, 2009.<br />
International Energy Agency, Paris, France, pg. 28. Last accessed March, 2010 at:<br />
http://www.iea.org/textbase/nppdf/free/2009/key_stats_2009.pdf<br />
4. Statistics from the International Energy Agency www.eia.org<br />
http://www.finfacts.ie/irishfinancenews/article_1016796.shtml<br />
2