Uranium as an Alternative to Fossil Fuel
Uranium as an Alternative to Fossil Fuel
Uranium as an Alternative to Fossil Fuel

Create successful ePaper yourself
Turn your PDF publications into a flip-book with our unique Google optimized e-Paper software.
Sh<strong>an</strong>non Wild<br />
Stage 2 Geology<br />
<strong>Ur<strong>an</strong>ium</strong> <strong>as</strong> <strong>an</strong> <strong>Alternative</strong> <strong>to</strong> <strong>Fossil</strong> <strong>Fuel</strong><br />
How enriched <strong>Ur<strong>an</strong>ium</strong> c<strong>an</strong> be used <strong>to</strong> generate electricity<br />
There are m<strong>an</strong>y countries in the world that now use nuclear power <strong>to</strong> produce some of their<br />
electricity. This is how ur<strong>an</strong>ium is used in the process of producing electricity:<br />
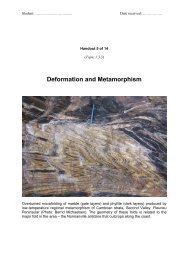
Fig. 1 diagram of a nuclear power pl<strong>an</strong>t<br />
The diagram above is of a nuclear power pl<strong>an</strong>t. The Core is the central part of the reac<strong>to</strong>r;<br />
this is where the fission reaction takes place. The cool<strong>an</strong>t circulates the core <strong>an</strong>d absorbs<br />
heat which is produced by fission, cool<strong>an</strong>t then p<strong>as</strong>ses through the steam genera<strong>to</strong>r. The<br />
steam genera<strong>to</strong>r contains water so when the cool<strong>an</strong>t p<strong>as</strong>ses through its heat on the water<br />
creates steam. This steam turns the turbines which turn the genera<strong>to</strong>r so that it produces<br />
electricity.<br />
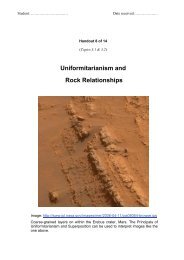
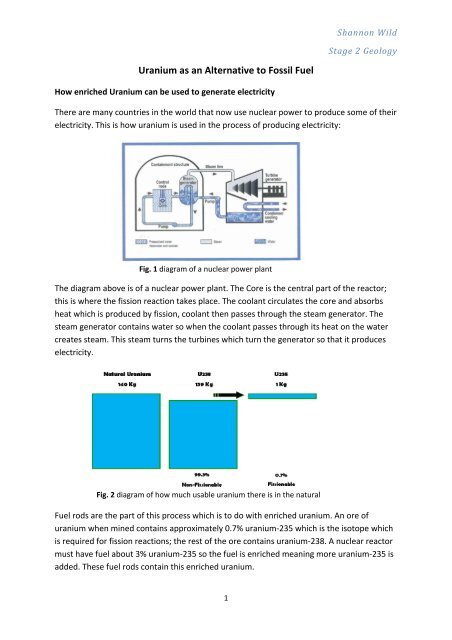
Fig. 2 diagram of how much usable ur<strong>an</strong>ium there is in the natural<br />
<strong>Fuel</strong> rods are the part of this process which is <strong>to</strong> do with enriched ur<strong>an</strong>ium. An ore of<br />
ur<strong>an</strong>ium when mined contains approximately 0.7% ur<strong>an</strong>ium‐235 which is the iso<strong>to</strong>pe which<br />
is required for fission reactions; the rest of the ore contains ur<strong>an</strong>ium‐238. A nuclear reac<strong>to</strong>r<br />
must have fuel about 3% ur<strong>an</strong>ium‐235 so the fuel is enriched me<strong>an</strong>ing more ur<strong>an</strong>ium‐235 is<br />
added. These fuel rods contain this enriched ur<strong>an</strong>ium.<br />
1
Sh<strong>an</strong>non Wild<br />
Stage 2 Geology<br />
Safety<br />
When first looking at the safety of nuclear power it is e<strong>as</strong>y <strong>to</strong> see how m<strong>an</strong>y people take one<br />
look at incidents such <strong>as</strong> Chernobyl or Three Mile Isl<strong>an</strong>d <strong>an</strong>d au<strong>to</strong>matically perceive nuclear<br />
power <strong>as</strong> bad. Though it h<strong>as</strong> <strong>to</strong> be pointed out that from the Chernobyl incident 1000<br />
people c<strong>an</strong> be expected <strong>to</strong> die over the next 50 year. It must be noted though that 10,000 a<br />
year die from black lung related dise<strong>as</strong>es from coal every year. It is clear <strong>to</strong> see that nuclear<br />
isn’t <strong>as</strong> bad <strong>as</strong> the media seem <strong>to</strong> be portraying it.<br />
Over half of the capital costs for nuclear power are put <strong>to</strong>wards bettering the safety of the<br />
pl<strong>an</strong>t. There are even strict rules in which the comp<strong>an</strong>y must comply with so that the<br />
community <strong>an</strong>d their works are kept safe, not complying with these could leave them with<br />
huge fines or even having <strong>to</strong> close down the pl<strong>an</strong>t. The table below from the World Nuclear<br />
Association show just how much we have <strong>to</strong> worry about immediate fatalities due <strong>to</strong><br />
nuclear pl<strong>an</strong>ts; we have a lot more <strong>to</strong> worry about with coal.<br />
<strong>Fuel</strong><br />
Immediate fatalities<br />
1970-92<br />
Who?<br />
Normalised <strong>to</strong> deaths<br />
per TWy electricity<br />
Coal 6400 workers 342<br />
Natural g<strong>as</strong> 1200<br />
workers &<br />
public<br />
Hydro 4000 public 883<br />
Nuclear 31 workers 8<br />
Fig. 3 table of fatalities from coal <strong>an</strong>d nuclear pl<strong>an</strong>ts<br />
Generally we tend <strong>to</strong> think of nuclear power <strong>as</strong> more of a safety hazard because the<br />
ur<strong>an</strong>ium <strong>an</strong>d therefore radiation. Most people are under the perception that coal doesn’t<br />
rele<strong>as</strong>e <strong>an</strong>y radiation, but in fact it does. The combustion of coal rele<strong>as</strong>es m<strong>an</strong>y naturally<br />
radioactive materials, which is not a good sign seeing <strong>as</strong> coal combustion h<strong>as</strong> been rising<br />
rapidly over the years. So coal <strong>an</strong>d nuclear are on a par in that department.<br />
85<br />
The graph, right, show the amount of<br />
immediate deaths of the m<strong>an</strong>y main<br />
electricity genera<strong>to</strong>rs. It h<strong>as</strong> coal <strong>an</strong>d<br />
nuclear power <strong>an</strong>d shows that coal<br />
h<strong>as</strong> a far greater number of deaths<br />
th<strong>an</strong> nuclear in all the are<strong>as</strong><br />
2<br />
Fig. 4 graph of immediate fatalities
Sh<strong>an</strong>non Wild<br />
Stage 2 Geology<br />
The l<strong>as</strong>t <strong>as</strong>pect of<br />
safety is w<strong>as</strong>te<br />
disposal <strong>an</strong>d is it<br />
safe in coal <strong>an</strong>d<br />
nuclear power. One<br />
of the main<br />
concerns of nuclear<br />
power are its<br />
w<strong>as</strong>tes. The w<strong>as</strong>te<br />
of nuclear power<br />
Fig. 5 diagram of w<strong>as</strong>tes of coal <strong>an</strong>d nuclear power<br />
pl<strong>an</strong>ts is the most<br />
radioactive part of the process. We don’t need <strong>to</strong> be concerned about this though <strong>as</strong> hardly<br />
<strong>an</strong>y w<strong>as</strong>te is actually produced <strong>as</strong> shown in the above<br />
diagram. There is definitely not enough yet <strong>to</strong> discard, by<br />
the time there is enough we may even have the<br />
technology <strong>to</strong> re‐use this w<strong>as</strong>te or spent fuel. All the<br />
spent fuel now is kept quite safely in a water t<strong>an</strong>k similar<br />
the one shown right. It is carefully kept in copper coated<br />
c<strong>an</strong>isters; therefore there should be no concern over<br />
the<br />
nuclear w<strong>as</strong>te.<br />
Fig. 6 a nuclear w<strong>as</strong>te s<strong>to</strong>rage t<strong>an</strong>k<br />
It seems that all <strong>as</strong>pects of nuclear power safety seem <strong>to</strong> far out way coal especially when<br />
you look at all the d<strong>an</strong>gers in the coal mining industry. As seen in the diagram below<br />
from<br />
NMA, the light blue line represents fatalities; although the fata<br />
l<br />
ities have generally<br />
decre<strong>as</strong>ed over the years in<br />
2006 there w<strong>as</strong> a signific<br />
<strong>an</strong>t<br />
incre<strong>as</strong>e. This is likely <strong>to</strong><br />
happen again <strong>as</strong> china is<br />
building more <strong>an</strong>d more<br />
coal mines. Consequently<br />
there are a lot more cave<br />
ins every year. This is<br />
something that just doesn’t<br />
happen with the ur<strong>an</strong>ium<br />
mining industry.<br />
Fig. 7 graph of coal mining fatalities<br />
3
Sh<strong>an</strong>non Wild<br />
Stage 2 Geology<br />
Econo mics<br />
<strong>Fuel</strong><br />
The fuel costs of nuclear power a signific<strong>an</strong>tly lower th<strong>an</strong> the cost of coal which is surprising<br />
since there is a much extensive process in preparing ur<strong>an</strong>ium. The main tipping fac<strong>to</strong>r in<br />
coals cost is the tr<strong>an</strong>sport of it. A signific<strong>an</strong>tly la rger amount of coal is needed so it c<strong>an</strong><br />
produce the same energy <strong>as</strong> nuclear does with a small amount.<br />
Cost ‐<br />
Coal $11/Mw‐hr Nuclear $5/Mw‐hr<br />
Capital Costs<br />
This includes initial construction <strong>an</strong>d modifications of the pl<strong>an</strong>t. For nuclear these costs are<br />
quite high <strong>as</strong> they need <strong>to</strong> comply with very strict safety regulations. Although the capital<br />
costs of coal are also signific<strong>an</strong>tly higher <strong>as</strong> well because scrubbers are required so that the<br />
air remains minimally polluted. Other power sources would not have <strong>to</strong> concern themselves<br />
with these types of costs.<br />
Cost ‐<br />
Coal $9/Mw‐hr Nuclear $9/Mw‐hr<br />
Operating <strong>an</strong>d Mainten<strong>an</strong>ce<br />
The everyday cost of operating a nuclear power pl<strong>an</strong>t include: labour <strong>an</strong>d overheads,<br />
expendable materials, NRC <strong>an</strong>d state fees <strong>an</strong>d local property taxes. Coal power pl<strong>an</strong>ts also<br />
have <strong>to</strong> pay all these costs but things such <strong>as</strong> fees are signific<strong>an</strong>tly less.<br />
Cost ‐<br />
Coal $9.1/Mw‐hr<br />
Nuclear $11/Mw‐hr<br />
Decommissioning <strong>an</strong>d W<strong>as</strong>te Costs<br />
The w<strong>as</strong>te product of a coal pl<strong>an</strong>t is <strong>as</strong>h, this cost no money <strong>to</strong> dispose of. On the other<br />
h<strong>an</strong>d the w<strong>as</strong>te product of nuclear power costs <strong>to</strong> s<strong>to</strong>re <strong>as</strong> it is high level w<strong>as</strong>te. It also<br />
incurs a fee from the Department of Energy (DOE) <strong>as</strong> it is high level w<strong>as</strong>te.<br />
This cost also includes the res<strong>to</strong>ration of t he site so it essentially is the same <strong>as</strong> before the<br />
pl<strong>an</strong>t w<strong>as</strong> set up. This generally takes about 20 years.<br />
Cost ‐<br />
Coal $0/Mw‐hr<br />
Nuclear $5/Mw‐hr<br />
The table opposite compares the<br />
costs nuclear versus coal for<br />
similar age <strong>an</strong>d size pl<strong>an</strong>ts:<br />
(10 $/Mw‐hr = 1 cent/kw‐hr)<br />
As you c<strong>an</strong> see by the <strong>to</strong>tal the<br />
overall cost are very similar<br />
Item Cost Element Nuclear Coal<br />
$/Mw‐hr $/Mw‐hr<br />
1 <strong>Fuel</strong> 5.0 11.0<br />
2 Operating & Mainten<strong>an</strong>ce ‐ Labour & Materials 6.0 5.0<br />
3 Pensions, Insur<strong>an</strong>ce, Taxes 1.0 1.0<br />
4 Regula<strong>to</strong>ry Fees 1.0 0.1<br />
5 Property Taxes 2.0 2.0<br />
6 Capital 9.0 9.0<br />
7 Decommissioning & DOE w<strong>as</strong>te costs 5.0 0.0<br />
8 Administrative / overheads 1.0 1.0<br />
Total 30.0 29.1<br />
Fig. 8 table of costs of each process for coal <strong>an</strong>d nuclear power<br />
4
Sh<strong>an</strong>non Wild<br />
Stage 2 Geology<br />
Greenhouse G<strong>as</strong> Emissions<br />
Nuclear power pl<strong>an</strong>ts emit very little green house g<strong>as</strong> emissions over their life cycle. They<br />
are in fact comparable powers such <strong>as</strong> wind <strong>an</strong>d hydro <strong>an</strong>d produce far less emissions th<strong>an</strong><br />
coal fired pl<strong>an</strong>ts.<br />
The chart below put <strong>to</strong>gether by NEI shows the m<strong>as</strong>sive difference between the greenhouse<br />
g<strong>as</strong> emissions of coal <strong>an</strong>d that of nuclear over the whole of their life cycles:<br />
Generation<br />
Option<br />
Greenhouse<br />
g<strong>as</strong><br />
emissions<br />
gram equiv.<br />
(in<br />
CO2/kWh)<br />
Sulfur dioxide<br />
emissions (in<br />
milligrams/kWh)<br />
Nitrogen oxide<br />
emissions (in<br />
milligrams/kWh)<br />
NMVOC<br />
(in<br />
milligrams<br />
/kWh**)<br />
Particulate<br />
matter (in<br />
milligrams<br />
/kWh)<br />
Hydropower 2 – 48 5 – 60 3 – 42 0 5<br />
Nuclear 2 – 59 3 – 50 2 – 100 0 2<br />
Wind 7 – 124 21 – 87 14 – 50 0 5 – 35<br />
Solar<br />
pho<strong>to</strong>voltaic<br />
Biom<strong>as</strong>s<br />
forestry<br />
w<strong>as</strong>te<br />
combustion<br />
Natural g<strong>as</strong><br />
(combined<br />
cycle)<br />
Coal –<br />
modern<br />
pl<strong>an</strong>t<br />
13 – 731 24 – 490 16 – 340 70 12 – 190<br />
15 – 101 12 – 140 701 – 1,950 0 217 – 320<br />
389 – 511 4 – 15,000[*] 13 – 1,500 72 – 164 1 – 10<br />
790 – 1,182 700 – 32,321 700 – 5,273 18 – 29 30 – 663<br />
Fig. 9 table of greenhouse g<strong>as</strong> emissions<br />
The chart shows that nuclear is one of the smallest emitters but coal is in fact the largest<br />
emitter <strong>an</strong>d that is on a modern pl<strong>an</strong>t. The bad coal situation may be halted in the future<br />
though due <strong>to</strong> the extensive research which is going in<strong>to</strong> geo‐sequestration or cle<strong>an</strong> coal<br />
energy. Though this may get the CO 2 out of the atmosphere s<strong>to</strong>ring it in rock may lead <strong>to</strong><br />
some cat<strong>as</strong>trophic accidents <strong>an</strong>d leakages. This still doesn’t help the situation now <strong>as</strong> coal<br />
pl<strong>an</strong>ts still keep emitting a rather large amount or greenhouse g<strong>as</strong>.<br />
5
Sh<strong>an</strong>non Wild<br />
Stage 2 Geology<br />
The graph below from the World Nuclear Association also consolidates the fact that coal is<br />
the largest emitter of greenhouse g<strong>as</strong>. The graph also shows that nuclear power doesn’t<br />
emit <strong>an</strong>y emission directly but still does emit some indirectly through its life cycle. The<br />
emissions from the life cycle are those emitted by <strong>an</strong>ything but the production of the power<br />
from the pl<strong>an</strong>t.<br />
Fig. 10 graph of greenhouse g<strong>as</strong> emissions<br />
There are m<strong>an</strong>y different components of the ur<strong>an</strong>ium cycle. The greenhouse g<strong>as</strong> emissions<br />
are rele<strong>as</strong>ed from all parts of this except the actual nuclear pl<strong>an</strong>t when operating <strong>to</strong> produce<br />
the electricity. Although only a maximum of 21 grams of CO 2 /KWh are rele<strong>as</strong>ed.<br />
On the other h<strong>an</strong>d most of the emissions from coal are actually from the burning of coal.<br />
That h<strong>as</strong> <strong>to</strong> be done <strong>to</strong> produce the power so there will always be emissions coming from<br />
coal. Where<strong>as</strong> nuclear will only have emissions being produced when the pl<strong>an</strong>ts have <strong>to</strong> be<br />
made.<br />
Comparison (for maximum emissions, grams CO2/KWh)<br />
C OAL<br />
NUCLEAR<br />
DIRECT EMISSIONS 1017 0<br />
EMISSIONS THRUOGH LIFE CYCLE 289 21<br />
6
Sh<strong>an</strong>non Wild<br />
Stage 2 Geology<br />
D<strong>an</strong>ger of Proliferation of Nuclear Weapons<br />
M<strong>an</strong>y people seem <strong>to</strong> be under the mistaken idea that coal power is much better that<br />
nuclear because there is no risk of weapons being made. This is just a m<strong>as</strong>sively big<br />
misconception because there is just no likely hood of a Nuclear power station de<strong>to</strong>nation<br />
like a bomb. The main re<strong>as</strong>on for this is that the ur<strong>an</strong>ium h<strong>as</strong>n’t being enriched enough <strong>to</strong><br />
create a large enough reaction <strong>to</strong> cause this type of thing. The reaction of the ur<strong>an</strong>ium also<br />
in a nuclear pl<strong>an</strong>t is created under controlled conditions where <strong>as</strong> bombs just aren’t.<br />
It is possible but unlikely that the ur<strong>an</strong>ium which is <strong>to</strong> be used <strong>as</strong> fuel for a nuclear power<br />
pl<strong>an</strong>t could be secretly enriched again so that it c<strong>an</strong> be used <strong>to</strong> make nuclear bombs.<br />
Because of this Australia h<strong>as</strong> everyone which we sell ur<strong>an</strong>ium <strong>to</strong> sign <strong>an</strong> agreement so that<br />
they won’t, that is why we won’t sell <strong>to</strong> Russia. This is one of the m<strong>an</strong>y re<strong>as</strong>ons why coal<br />
power is still very popular throughout the public, especially in Australia.<br />
The graph right from the APS shows the<br />
countries in the world that have nuclear<br />
weapons <strong>an</strong>d a rough guide if who will<br />
have them. If a country is going <strong>to</strong> have<br />
nuclear weapons they will regardless of<br />
whether they have a nuclear power pl<strong>an</strong>t<br />
or not. It is illogical <strong>to</strong> think that the two<br />
come h<strong>an</strong>d in h<strong>an</strong>d. If a county is going <strong>to</strong><br />
enrich ur<strong>an</strong>ium <strong>to</strong> <strong>an</strong> amount that is used<br />
for a nuclear powered weapon they will<br />
do that <strong>to</strong> start with <strong>an</strong>d not use ur<strong>an</strong>ium<br />
already destined for the power pl<strong>an</strong>t.<br />
Fig. 11 graph of countries with nuclear weapons<br />
7
Sh<strong>an</strong>non Wild<br />
Stage 2 Geology<br />
References<br />
Websites<br />
The Virtual Nuclear Tourist 1996‐2006, Cost Comparison for Nuclear vs.<br />
September 2008, <br />
Coal, viewed 16 th<br />
Cabreza N.A, Nuclear Power VS. Other Sources of Power, viewed 18 th September 2008,<br />
< http://www.nuc.berkeley.edu/thyd/ne161/ncabreza/sources.html><br />
How Stuff Works 1998‐2008, How Stuff Works, viewed 16 th September 2008,<br />
<br />
Nuclear Energy Institute, Life‐Cycle<br />
<br />
Emissions Analysis, viewed 27 th September 2008,<br />
World Nuclear Association 2008, Safety of Nuclear Power Reac<strong>to</strong>rs, viewed 24 th September<br />
2008, <br />
National Mining Association 2008, Safety, viewed 24th September, <br />
Federation of Americ<strong>an</strong> Scientists 2001, The Search for Proliferation‐Resist<strong>an</strong>t Nuclear<br />
Power, viewed 27 th September, <br />
PowerPoint’s<br />
Dr. D. Boreham 2007, <strong>Ur<strong>an</strong>ium</strong> for Power <strong>an</strong>d Medicine, viewed 16 th September 2008,<br />
McM<strong>as</strong>ter<br />
University Radiation Biology Labora<strong>to</strong>ry<br />
Mitchell S 2007, <strong>Ur<strong>an</strong>ium</strong> <strong>an</strong>d Nuclear Power, viewed 18 th September 2008, Toro Energy<br />
Limited<br />
8