Chicago Board of Trade - Interconti, Limited
Chicago Board of Trade - Interconti, Limited
Chicago Board of Trade - Interconti, Limited

You also want an ePaper? Increase the reach of your titles
YUMPU automatically turns print PDFs into web optimized ePapers that Google loves.
The Efficiencies <strong>of</strong> the Futures<br />
Markets…<br />
Domestic and international corporations, banks,<br />
insurance companies, mutual fund managers,<br />
and trading firms use the futures markets to<br />
manage their continuous exposure to price<br />
changes. Futures markets make it possible for<br />
these hedgers to transfer that risk exposure to<br />
other market participants. Speculators assume<br />
risk in anticipation <strong>of</strong> making a pr<strong>of</strong>it; in doing<br />
so, they add liquidity to the market.<br />
In a market without these risk-takers, hedgers<br />
would find it difficult to agree on a price,<br />
because sellers or short hedgers want the<br />
highest possible price while buyers or long<br />
hedgers want the lowest possible price. When<br />
speculators enter the marketplace, the number<br />
<strong>of</strong> ready buyers and sellers increases, and<br />
hedgers are no longer limited by the hedging<br />
needs <strong>of</strong> others.<br />
In addition to providing liquidity, speculators<br />
help to ensure the stability <strong>of</strong> the market. For<br />
example, by selling futures when prices are<br />
high, speculators decrease demand and help<br />
to lower prices. By purchasing futures when<br />
prices are low, they add to demand and help<br />
to raise prices. The volatile price swings that<br />
might otherwise occur are thus tempered by<br />
active trading.<br />
Table 2: Performance <strong>of</strong> Selected Asset Classes 1995-2004*<br />
International Managed<br />
Year Stocks 4 Futures 1 Bonds 2 U. S. Stocks 3<br />
1995 9.4 13.6 30.7 37.6<br />
1996 4.4 9.1 -0.4 22.9<br />
1997 0.3 10.9 14.9 33.4<br />
1998 18.2 7.0 13.5 28.6<br />
1999 25.3 -1.2 -8.7 21.0<br />
2000 -15.2 7.9 20.1 -9.1<br />
2001 -22.6 0.8 4.6 -11.9<br />
2002 -17.5 12.4 17.2 -22.1<br />
2003 35.3 8.7 2.1 28.7<br />
2004 17.6 3.3 8.0 10.9<br />
Compound<br />
Return 3.9% 7.2% 9.7% 12.1%<br />
Source: The Barclay Trading Group, Ltd.<br />
*Based on monthly data from 1995-2004 on an annualized basis<br />
(as percentage <strong>of</strong> annual return)<br />
1<br />
Managed Futures: Barclay CTA Index<br />
2<br />
Bonds: Lehman Brothers Treasury Bond Index<br />
3<br />
U.S. Stocks: S&P 500 Total Return Index<br />
4<br />
International Stocks: MSCI EAFE ® Index (U.S. Dollars) Source<br />
MSCI. All rights reserved. All material is property <strong>of</strong> MSCI. Use<br />
and duplication subject to contract with MSCI.<br />
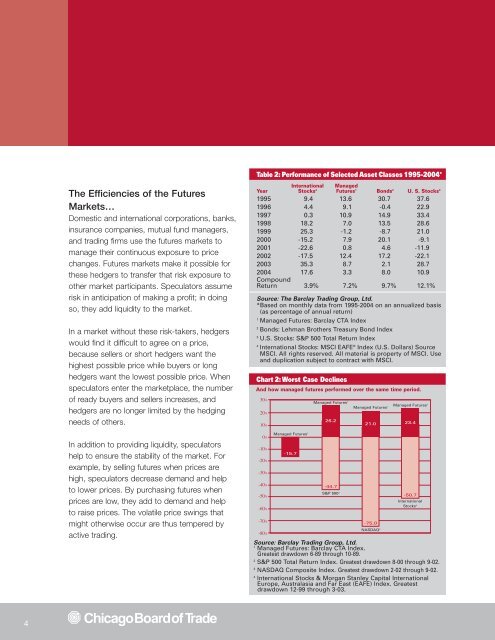
Chart 2: Worst Case Declines<br />
And how managed futures performed over the same time period.<br />
30%<br />
20%<br />
10%<br />
0%<br />
-10%<br />
-20%<br />
-30%<br />
-40%<br />
-50%<br />
-60%<br />
-70%<br />
-80%<br />
Managed Futures 1<br />
Managed Futures 1<br />
26.2<br />
21.0<br />
23.4<br />
-15.7<br />
-44.7<br />
S&P 500 2 -50.7<br />
International<br />
Stocks 4<br />
NASDAQ 3<br />
-75.0<br />
Source: Barclay Trading Group, Ltd.<br />
1<br />
Managed Futures: Barclay CTA Index.<br />
Greatest drawdown 6-89 through 10-89.<br />
2<br />
S&P 500 Total Return Index. Greatest drawdown 8-00 through 9-02.<br />
3<br />
NASDAQ Composite Index. Greatest drawdown 2-02 through 9-02.<br />
4<br />
International Stocks & Morgan Stanley Capital International<br />
Europe, Australasia and Far East (EAFE) Index. Greatest<br />
drawdown 12-99 through 3-03.<br />
4
![Definitions & Concepts... [PDF] - Cycles Research Institute](https://img.yumpu.com/26387731/1/190x245/definitions-concepts-pdf-cycles-research-institute.jpg?quality=85)