Chicago Board of Trade - Interconti, Limited
Chicago Board of Trade - Interconti, Limited
Chicago Board of Trade - Interconti, Limited

You also want an ePaper? Increase the reach of your titles
YUMPU automatically turns print PDFs into web optimized ePapers that Google loves.
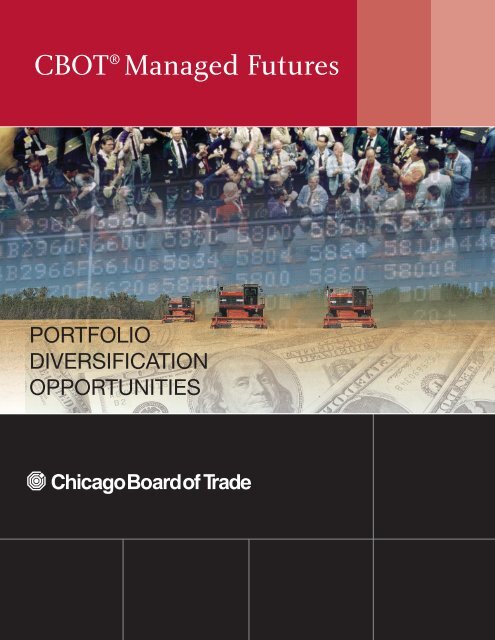
CBOT ® Managed Futures<br />
PORTFOLIO<br />
DIVERSIFICATION<br />
OPPORTUNITIES
“ Portfolios . . . including judicious investments . . . in leveraged managed futures<br />
accounts show substantially less risk at every possible level <strong>of</strong> expected return<br />
than portfolios <strong>of</strong> stocks (or stocks and bonds) alone.”<br />
Dr. John Lintner<br />
Harvard University
Intro<br />
What Are Managed Futures?<br />
Investment management pr<strong>of</strong>essionals have been using managed futures for more than 30 years.<br />
More recently, institutional investors such as corporate and public pension funds, endowments and<br />
trusts, and banks have made managed futures part <strong>of</strong> a well-diversified portfolio. In 2004, it was<br />
estimated that over $130 billion was under management by trading advisors.<br />
The growing use <strong>of</strong> managed futures by these investors may be due to increased institutional use<br />
<strong>of</strong> the futures markets. Portfolio managers have become more familiar with futures contracts.<br />
Additionally, investors want greater diversity in their portfolios. They seek to increase portfolio<br />
exposure to international investments and nonfinancial sectors, an objective that is easily<br />
accomplished through the use <strong>of</strong> global futures markets.<br />
The term managed futures describes an industry made up <strong>of</strong> pr<strong>of</strong>essional money managers known<br />
as commodity trading advisors (CTAs). These trading advisors manage client assets on a discretionary<br />
basis using global futures markets as an investment medium. Trading advisors take positions based<br />
on expected pr<strong>of</strong>it potential.<br />
For the purposes <strong>of</strong> this booklet, managed futures do not include futures accounts where futures<br />
are used in risk-management programs or hedge funds. Those funds may have as their purpose to<br />
dynamically adjust the duration <strong>of</strong> a bond portfolio or to hedge the currency exposure <strong>of</strong> a foreign<br />
equity portfolio.<br />
i
Four Benefits <strong>of</strong> Managed Futures<br />
Managed futures, by their very nature, are a<br />
diversified investment opportunity. Trading advisors<br />
have the ability to trade in over 150 different<br />
markets worldwide. Many funds further diversify<br />
by using several trading advisors with different<br />
trading approaches.<br />
The benefits <strong>of</strong> managed futures within<br />
a well-balanced portfolio include:<br />
• opportunity for reduced portfolio volatility risk<br />
• potential for enhanced portfolio returns<br />
• ability to pr<strong>of</strong>it in any economic environment<br />
• opportunity to participate easily in global markets<br />
1. Reduced Portfolio Volatility Risk<br />
The primary benefit <strong>of</strong> adding a managed futures<br />
component to a diversified investment portfolio is<br />
that it may decrease portfolio volatility risk. This<br />
risk-reduction contribution to the portfolio is possible<br />
because <strong>of</strong> the low to slightly negative correlation<br />
<strong>of</strong> managed futures with equities and bonds. One<br />
<strong>of</strong> the key tenets <strong>of</strong> Modern Portfolio Theory, as<br />
developed by the Nobel Prize economist Dr. Harry<br />
M. Markowitz, is that more efficient investment<br />
portfolios can be created by diversifying among<br />
asset categories with low to negative correlations.<br />
Table 1 compares the correlations between<br />
managed futures, bonds, and domestic stocks<br />
from January 1995 through December 2004. As<br />
you can see, managed futures are essentially<br />
uncorrelated to the other asset classes.<br />
Table 1: Correlation <strong>of</strong> Selected Asset Classes 1995-2004*<br />
Managed<br />
Futures Bonds U.S. Stocks<br />
Managed Futures 1 1.00<br />
Bonds 2 0.41 1.00<br />
U.S. Stocks 3 -0.11 -0.10 1.00<br />
Source: The Barclay Trading Group, Ltd.<br />
*Based on monthly data from 1995-2004<br />
1<br />
Managed Futures: Barclay CTA Index<br />
2<br />
Bonds: Lehman Brothers Long-Term U.S. Treasury Index<br />
3<br />
U.S. Stocks: S&P 500 Total Return Index<br />
2. Potential for Enhanced Portfolio Returns<br />
While managed futures can decrease portfolio<br />
risk, they can also simultaneously enhance overall<br />
portfolio performance. For example, chart 1 shows<br />
that adding managed futures to a traditional<br />
portfolio improves overall investment quality. This<br />
is substantiated by an extensive bank <strong>of</strong> academic<br />
research, beginning with the landmark study <strong>of</strong> Dr.<br />
John Lintner <strong>of</strong> Harvard University, in which he wrote<br />
that “the combined portfolios <strong>of</strong> stocks (or stocks<br />
and bonds) after including judicious investments…<br />
in leveraged managed futures accounts show<br />
substantially less risk at every possible level<br />
<strong>of</strong> expected return than portfolios <strong>of</strong> stocks<br />
(or stocks and bonds) alone.” 1<br />
Table 2 shows that when viewed as an<br />
independent investment, managed futures have<br />
compared favorably with U.S. stocks and bonds,<br />
as well as international stocks, in 2003 and 2004.<br />
1<br />
Lintner, John, “The Potential Role <strong>of</strong> Managed Commodity Financial Futures Accounts (and/or Funds) in Portfolios <strong>of</strong> Stocks and Bonds,”<br />
Annual Conference <strong>of</strong> Financial Analysts Federation, May 1983.<br />
2
In addition, the potential for higher returns using<br />
managed futures compares well with other asset<br />
classes in terms <strong>of</strong> risk. One way to compare<br />
risk is to measure the magnitude <strong>of</strong> the worst<br />
cumulative loss in value <strong>of</strong> an investment from any<br />
peak in performance to the subsequent low. This<br />
worst-case, peak-to-valley scenario is called a<br />
drawdown in the futures industry. Chart 2 shows<br />
that managed futures outperformed U.S. and<br />
international stocks during the worst peak-to-valley<br />
drawdowns <strong>of</strong> the S&P 500 ® , the NASDAQ ® , and<br />
the MSCI ® Europe, Australasia, and Far East<br />
(EAFE ® ) Index.<br />
3. Ability to Pr<strong>of</strong>it in Any Economic Environment<br />
Managed futures trading advisors can take<br />
advantage <strong>of</strong> price trends. They can buy futures<br />
positions in anticipation <strong>of</strong> a rising market or sell<br />
futures positions if they anticipate a falling market.<br />
For example, during periods <strong>of</strong> hyperinflation, hard<br />
commodities such as gold, silver, oil, grains, and<br />
livestock tend to do well, as do the major world<br />
currencies. During deflationary times, futures<br />
provide an opportunity to pr<strong>of</strong>it by selling into a<br />
declining market with the expectation <strong>of</strong> buying,<br />
or closing out the position, at a lower price. Trading<br />
advisors can even use strategies employing options<br />
on futures contracts that allow for pr<strong>of</strong>it potential in<br />
flat or neutral markets.<br />
4. Ease <strong>of</strong> Global Diversification<br />
The establishment <strong>of</strong> global futures exchanges<br />
and the accompanying increase in actively traded<br />
contract <strong>of</strong>ferings (see table 3) have allowed trading<br />
advisors to diversify their portfolios by geography<br />
as well as by product. For example, managed<br />
futures accounts can participate in at least 150<br />
different markets worldwide, including stock<br />
indexes, financial instruments, agricultural<br />
products, precious and nonferrous metals,<br />
currencies, and energy products. Trading<br />
advisors thus have ample opportunity for pr<strong>of</strong>it<br />
potential and risk reduction among a broad array<br />
<strong>of</strong> noncorrelated markets.<br />
Chart 1: Potential Impact <strong>of</strong> Managed Futures on the Traditional Portfolio Jan.1980 - Dec. 2004<br />
Annualized Return<br />
12.8%<br />
12.6%<br />
Annualized Return (%)<br />
12.4% 12.4<br />
12.2%<br />
Chart 1: Potential Impact <strong>of</strong> Managed Futures on the Traditional<br />
37.5% Stocks<br />
37.5% Bonds<br />
25% Managed Futures<br />
45% Stocks<br />
45% Bonds<br />
10% Managed Futures<br />
28% Stocks<br />
28% Bonds<br />
44% Managed Futures<br />
Portfolio Jan. 1980- Dec. 2004<br />
Traditional Portfolio<br />
50% Stocks<br />
50% Bonds<br />
0% Managed Futures<br />
12.0%<br />
12.0<br />
9.5<br />
Source:<br />
9.5%<br />
10.0<br />
10% 10.5%<br />
11.0<br />
11% 11.5%<br />
Barclay<br />
Trading<br />
Group,<br />
Ltd.,<br />
Managed<br />
Futures:<br />
Barclay<br />
Annualized Standard Deviation (%)<br />
CTA Index;<br />
Bonds:<br />
Long-Term Treasury<br />
Annualized Standard Deviation<br />
Source:<br />
Barclay Trading Group, Ltd., Managed Futures: Barclay CTA Index; Bonds: Lehman Brothers Long-Term Treasury Index; Stocks: S&P 500 Total Return Index<br />
Lehman<br />
Brothers<br />
Index;<br />
Stocks:<br />
S& P<br />
500<br />
Total<br />
Return<br />
Index<br />
3
The Efficiencies <strong>of</strong> the Futures<br />
Markets…<br />
Domestic and international corporations, banks,<br />
insurance companies, mutual fund managers,<br />
and trading firms use the futures markets to<br />
manage their continuous exposure to price<br />
changes. Futures markets make it possible for<br />
these hedgers to transfer that risk exposure to<br />
other market participants. Speculators assume<br />
risk in anticipation <strong>of</strong> making a pr<strong>of</strong>it; in doing<br />
so, they add liquidity to the market.<br />
In a market without these risk-takers, hedgers<br />
would find it difficult to agree on a price,<br />
because sellers or short hedgers want the<br />
highest possible price while buyers or long<br />
hedgers want the lowest possible price. When<br />
speculators enter the marketplace, the number<br />
<strong>of</strong> ready buyers and sellers increases, and<br />
hedgers are no longer limited by the hedging<br />
needs <strong>of</strong> others.<br />
In addition to providing liquidity, speculators<br />
help to ensure the stability <strong>of</strong> the market. For<br />
example, by selling futures when prices are<br />
high, speculators decrease demand and help<br />
to lower prices. By purchasing futures when<br />
prices are low, they add to demand and help<br />
to raise prices. The volatile price swings that<br />
might otherwise occur are thus tempered by<br />
active trading.<br />
Table 2: Performance <strong>of</strong> Selected Asset Classes 1995-2004*<br />
International Managed<br />
Year Stocks 4 Futures 1 Bonds 2 U. S. Stocks 3<br />
1995 9.4 13.6 30.7 37.6<br />
1996 4.4 9.1 -0.4 22.9<br />
1997 0.3 10.9 14.9 33.4<br />
1998 18.2 7.0 13.5 28.6<br />
1999 25.3 -1.2 -8.7 21.0<br />
2000 -15.2 7.9 20.1 -9.1<br />
2001 -22.6 0.8 4.6 -11.9<br />
2002 -17.5 12.4 17.2 -22.1<br />
2003 35.3 8.7 2.1 28.7<br />
2004 17.6 3.3 8.0 10.9<br />
Compound<br />
Return 3.9% 7.2% 9.7% 12.1%<br />
Source: The Barclay Trading Group, Ltd.<br />
*Based on monthly data from 1995-2004 on an annualized basis<br />
(as percentage <strong>of</strong> annual return)<br />
1<br />
Managed Futures: Barclay CTA Index<br />
2<br />
Bonds: Lehman Brothers Treasury Bond Index<br />
3<br />
U.S. Stocks: S&P 500 Total Return Index<br />
4<br />
International Stocks: MSCI EAFE ® Index (U.S. Dollars) Source<br />
MSCI. All rights reserved. All material is property <strong>of</strong> MSCI. Use<br />
and duplication subject to contract with MSCI.<br />
Chart 2: Worst Case Declines<br />
And how managed futures performed over the same time period.<br />
30%<br />
20%<br />
10%<br />
0%<br />
-10%<br />
-20%<br />
-30%<br />
-40%<br />
-50%<br />
-60%<br />
-70%<br />
-80%<br />
Managed Futures 1<br />
Managed Futures 1<br />
26.2<br />
21.0<br />
23.4<br />
-15.7<br />
-44.7<br />
S&P 500 2 -50.7<br />
International<br />
Stocks 4<br />
NASDAQ 3<br />
-75.0<br />
Source: Barclay Trading Group, Ltd.<br />
1<br />
Managed Futures: Barclay CTA Index.<br />
Greatest drawdown 6-89 through 10-89.<br />
2<br />
S&P 500 Total Return Index. Greatest drawdown 8-00 through 9-02.<br />
3<br />
NASDAQ Composite Index. Greatest drawdown 2-02 through 9-02.<br />
4<br />
International Stocks & Morgan Stanley Capital International<br />
Europe, Australasia and Far East (EAFE) Index. Greatest<br />
drawdown 12-99 through 3-03.<br />
4
…Benefit Those Who Use Managed Futures<br />
Managed futures trading advisors can benefit from<br />
the structural efficiencies <strong>of</strong> the futures markets.<br />
Liquid markets facilitate entering and exiting<br />
market positions. For example, the average daily<br />
trading volume in the 10-year U.S. Treasury note<br />
futures contract was about 750,000 as <strong>of</strong> 2004.<br />
With a notional value <strong>of</strong> $100,000 per contract, this<br />
volume represents an average daily transfer <strong>of</strong> about<br />
$75 billion. This depth <strong>of</strong> liquidity usually allows<br />
traders to enter or exit the Treasury note futures<br />
market at the minimum price change <strong>of</strong> one tick.<br />
<strong>Trade</strong>rs in futures may benefit from transaction<br />
costs lower than those for comparable cash<br />
market transactions. For example, the transaction<br />
fee charged for one stock index contract is<br />
substantially less than the transaction fee for trading<br />
an equal dollar amount <strong>of</strong> stock. Typically, this cost<br />
is 1/10 to 1/20 <strong>of</strong> the comparable cash market<br />
execution cost.<br />
Lower market impact costs also benefit the futures<br />
trader. Large-block equity orders sent to the stock<br />
exchange <strong>of</strong>ten create a supply-demand imbalance<br />
that increases the bid-ask differential and the cost<br />
<strong>of</strong> the trade. The effect <strong>of</strong> a comparable dollar<br />
order executed in the futures market is usually<br />
less significant. This is understandable when one<br />
considers the greater liquidity <strong>of</strong> stock index futures,<br />
where the daily dollar volume is concentrated in a<br />
single standardized contract representing a basket<br />
<strong>of</strong> stocks. In contrast, the daily dollar volume at a<br />
stock exchange is distributed over many stocks.<br />
Table 3: Most Actively-<strong>Trade</strong>d Futures Contracts — Global Futures with Trading Volume Over 10 Million in 2004<br />
<strong>Chicago</strong> <strong>Board</strong> <strong>of</strong> <strong>Trade</strong> (CBOT)<br />
US Treasury Bonds<br />
US 10-year Treasury Notes<br />
US 5-year Treasury Notes<br />
30-Day Federal Funds<br />
CBOT mini-sized Dow<br />
Corn<br />
Soybeans<br />
<strong>Chicago</strong> Mercantile Exchange (CME)<br />
3-month Eurodollar<br />
S&P 500 Index<br />
E-mini S&P 500<br />
E-mini NASDAQ 100<br />
E-mini Russell 2000<br />
Euro FX<br />
New York Mercantile Exchange (NYMEX)<br />
Crude Oil<br />
Natural Gas<br />
Heating Oil<br />
Unleaded Gasoline<br />
Gold 100 oz.<br />
Eurex (formerly DTB and SOFFEX)<br />
DAX<br />
DJ Euro Stoxx 50<br />
Euro-BUND<br />
Euro-BOBL<br />
Euro-SCHATZ<br />
London International Financial Futures<br />
and Options Exchange (LIFFE)<br />
3-month Euribor<br />
3-month Sterling<br />
Long Gilt<br />
Universal Stock<br />
FTSE 100 Index<br />
Bolsa de Mercadorias<br />
& Futuros (BM&F)<br />
Interbank Deposit<br />
FRA on ID x US Dollar Spread<br />
US Dollar<br />
London Metal Exchange<br />
(LME)<br />
High Grade Primary Aluminum<br />
Copper – Grade A<br />
Tokyo Commodity Exchange (TOCOM)<br />
Gold<br />
Gasoline<br />
Dalian Commodity Exchange (DCE)<br />
Soybeans<br />
Soybean Meal<br />
National Stock Exchange<br />
<strong>of</strong> India (NSE)<br />
S&P CNX Nifty<br />
Single Stock<br />
International Petroleum Exchange (IPE)<br />
Brent Crude Oil<br />
Sydney Futures Exchange (SFE)<br />
3-year Treasury Bonds<br />
ParisBourse (formerly MATIF and MONEP)<br />
Shanghai Futures Exchange (SHFE)<br />
Source: CBOT ® Market Data Products & Information<br />
CAC 40 10 Euro<br />
Copper<br />
Korea Futures Exchange (KOFEX) KOSPI 200<br />
Mexican Derivatives Exchange (MexDer) 28-day Interbank Deposit<br />
5
The disciplined use <strong>of</strong> leverage enables traders to<br />
control large dollar amounts in the futures markets<br />
with a comparatively small amount <strong>of</strong> capital. To<br />
ensure performance <strong>of</strong> the terms <strong>of</strong> the futures<br />
contract, both the buyer and seller are required to<br />
deposit a performance bond margin in an account<br />
at their brokerage firms. (Note that in the futures<br />
industry, the term margin represents a security<br />
deposit, whereas in the stock market, margin<br />
represents a down payment.) The amount <strong>of</strong><br />
daily maintenance margin required by brokerage<br />
firms fluctuates with the daily value <strong>of</strong> the<br />
futures position.<br />
Types <strong>of</strong> Investment Opportunities<br />
According to the Barclay Trading Group, Ltd.<br />
in 2004, it was estimated that over $130 billion<br />
was under management by futures trading<br />
advisors worldwide. Currently, there are three<br />
primary categories <strong>of</strong> managed futures.<br />
Individual Accounts are usually opened by<br />
institutional investors or high net worth<br />
individuals. These funds usually require a<br />
substantial capital investment so that the advisor<br />
can diversify trading among a variety <strong>of</strong> market<br />
positions. An individual account enables<br />
institutional investors to customize accounts to<br />
their specifications. For example, certain markets<br />
may be emphasized or excluded. Contract terms<br />
may include specific termination language and<br />
financial management requirements.<br />
Private Pools commingle money from several<br />
investors, usually into a limited partnership. Most<br />
<strong>of</strong> these pools have minimum investments ranging<br />
from approximately $25,000 to $250,000.<br />
These futures partnerships usually allow for<br />
admission-redemption on a monthly or quarterly<br />
basis. The main advantage <strong>of</strong> private pools is<br />
the economy <strong>of</strong> scale that can be achieved for<br />
middle-sized investors. A pool also may be<br />
structured with multiple trading advisors with<br />
different trading approaches, providing the investor<br />
with maximum diversification. Because <strong>of</strong> lower<br />
administrative and marketing costs, private<br />
pools have historically performed better than<br />
public funds.<br />
Public Funds or Pools provide a way for small<br />
investors to participate in an investment vehicle<br />
usually reserved for large investors.<br />
Participants in the Managed<br />
Futures Industry<br />
There are several types <strong>of</strong> industry participants<br />
qualified to assist interested investors. Keep in<br />
mind that any <strong>of</strong> these participants may, and <strong>of</strong>ten<br />
do, act in more than one capacity.<br />
Commodity Trading Advisors (CTAs) are<br />
responsible for the actual trading <strong>of</strong> managed<br />
accounts. There are approximately 800 CTAs<br />
registered with the National Futures Association<br />
(NFA), which is the self-regulatory organization for<br />
futures and options markets. The two major types<br />
<strong>of</strong> advisors are technical traders and fundamental<br />
traders. Technical traders may use computer<br />
s<strong>of</strong>tware programs to follow pricing trends and<br />
6
Evaluating Risk from an Investor’s Perspective<br />
Investors should understand that there are risks<br />
associated with trading futures and options on futures.<br />
The Commodity Futures Trading Commission (CFTC)<br />
requires that prospective customers be provided with<br />
risk-disclosure statements which should be carefully<br />
reviewed. Past performance is not necessarily an indicator<br />
<strong>of</strong> future results.<br />
Potential investors will want to become familiar with<br />
industry definitions for evaluating the risk-return element<br />
<strong>of</strong> managed futures performance. The following equations,<br />
with some variations, are <strong>of</strong>ten used.<br />
Measure <strong>of</strong> Volatility<br />
Standard Deviation: The dispersion (distance) <strong>of</strong><br />
observations (performance data) from the mean (or<br />
average) observation. This measure is <strong>of</strong>ten expressed<br />
as a percentage on an annualized basis.<br />
Measure <strong>of</strong> Capital Loss<br />
Largest Cumulative Decline or Maximum Drawdown:<br />
The largest cumulative percentage (peak-to-valley) decline<br />
in capital <strong>of</strong> a trading account or portfolio. This measure<br />
<strong>of</strong> risk identifies the worst-case scenario for a managed<br />
futures investment within a given time period.<br />
Measure <strong>of</strong> Risk-Adjusted Return<br />
Sharpe Ratio: A ratio that represents a rate <strong>of</strong> return<br />
adjusted for risk, calculated as follows:<br />
Annualized rate <strong>of</strong> return – Risk-free Rate <strong>of</strong> return<br />
Annualized standard deviation<br />
Chart 3: Volatility <strong>of</strong> U.S. Equities, Commodities, and Interest Rate Instruments<br />
Monthly Price Volatility, 1992-2004<br />
45<br />
40<br />
35<br />
30<br />
Volatility<br />
25<br />
20<br />
15<br />
10<br />
5<br />
0<br />
Jan-92<br />
Jun-92<br />
Nov-92<br />
Apr-93<br />
Sep-93<br />
Feb-94<br />
Jul-94<br />
Dec-94<br />
May-95<br />
Oct-95<br />
Mar-96<br />
Aug-96<br />
Jan-97<br />
Jun-97<br />
Nov-97<br />
Apr-98<br />
Sep-98<br />
Feb-99<br />
Jul-99<br />
Dec-99<br />
May-00<br />
Oct-00<br />
Mar-01<br />
Aug-01<br />
Jan-02<br />
Jun-02<br />
Nov-02<br />
Apr-03<br />
Sep-03<br />
Feb-04<br />
Jul-04<br />
Dec-04<br />
Source: <strong>Chicago</strong> <strong>Board</strong> <strong>of</strong> <strong>Trade</strong><br />
Date<br />
U.S. Stocks, Dow Jones Industrial Average SM Commodity Markets, Dow Jones-AIG Commodity Index SM 10-Year Treasury Notes<br />
7
perform quantitative analysis. Fundamental<br />
traders forecast prices by analysis <strong>of</strong> supply and<br />
demand factors and other market information.<br />
Either trading style can be successful, and<br />
many advisors incorporate elements <strong>of</strong><br />
both approaches.<br />
Futures Commission Merchants (FCMs)<br />
are the brokerage firms that execute, clear,<br />
and carry CTA-directed trades on the various<br />
exchanges. Many <strong>of</strong> these firms also act as<br />
CPOs and trading managers, providing<br />
administrative reports on investment performance.<br />
Additionally, they may <strong>of</strong>fer customers managed<br />
futures funds to help diversify their portfolios.<br />
Commodity Pool Operators (CPOs)<br />
assemble public funds or private pools. In the<br />
United States, these are usually in the form <strong>of</strong><br />
limited partnerships. There are approximately<br />
1,500 CPOs registered with the NFA. Most<br />
commodity pool operators hire independent<br />
CTAs to make the daily trading decisions. The<br />
CPO may distribute the product directly or act as<br />
a wholesaler to the broker-dealer community.<br />
Investment Consultants can be a valuable<br />
institutional investor resource for learning about<br />
managed futures alternatives and in helping to<br />
implement the managed fund program. They<br />
can assist in selecting the type <strong>of</strong> fund program<br />
and management team that would be best<br />
suited for the specific needs <strong>of</strong> the institution.<br />
Some consultants also monitor day-to-day<br />
trading operations (e.g., margins and daily<br />
mark-to-market positions) on behalf <strong>of</strong> their<br />
institutional clients.<br />
Trading Managers are available to assist<br />
institutional investors in selecting CTAs. These<br />
managers have developed sophisticated<br />
methods <strong>of</strong> analyzing CTA performance records<br />
so that they can recommend and structure<br />
a portfolio <strong>of</strong> trading advisors whose historic<br />
performance records have a low correlation<br />
with each other. These trading managers may<br />
develop and market their own proprietary<br />
products or they may administer funds raised<br />
by other entities, such as brokerage firms.<br />
Assessing Performance from an<br />
Investor’s Perspective<br />
There are several indexes that measure<br />
managed futures performance. Investors may<br />
wish to review each index to determine which<br />
one provides the most appropriate performance<br />
criteria for their needs.<br />
The following is a list <strong>of</strong> some <strong>of</strong> the more<br />
familiar indexes:<br />
Managed Futures Indexes* (Actively Managed)<br />
Barclay CTA Index<br />
MLM (Mount Lucas Management) Index<br />
CISDM Managed Futures Benchmark Series<br />
Commodity Market Indexes (Passive)<br />
Reuters-CRB ® Total Return Index<br />
Goldman Sachs Commodity Index (GSCI ® )<br />
Dow Jones-AIG Commodity Index SM (DJ-AIGCI SM )<br />
* Contact information on inside <strong>of</strong> back page.<br />
8
How the Fee Structure for<br />
Managed Futures Works<br />
Total management fees in the managed futures<br />
industry tend to be higher than those in the<br />
equities market. These fees, however, may be<br />
partially <strong>of</strong>fset by the lower commission costs<br />
for comparable dollar transactions in the futures<br />
industry. While management fees do vary by the<br />
type <strong>of</strong> managed futures account and may be<br />
negotiable, there is a general fee structure.<br />
Investors should understand that performance<br />
information for a managed futures account<br />
or fund is almost always expressed net <strong>of</strong> all<br />
such fees.<br />
Typically, the trading advisor or trading manager is<br />
compensated by receiving a flat management fee<br />
based on assets under management in addition<br />
to a performance “incentive” fee based on pr<strong>of</strong>its<br />
in the account. The performance fee is almost<br />
always calculated net <strong>of</strong> all costs to the account,<br />
such as management fees and commissions.<br />
The performance fee is thus based on net trading<br />
pr<strong>of</strong>its, which are usually paid only if the account<br />
or fund exceeds previously established net<br />
asset values.<br />
A few trading managers assume the “netting<br />
risk,” whereby the performance results <strong>of</strong> all<br />
trading advisors in the account are netted before<br />
the investor is charged a performance fee. The<br />
trading manager assumes the netting risk by<br />
paying each CTA according to his or her<br />
individual performance.<br />
In addition to management and performance<br />
fees, an account or fund pays transaction costs<br />
or brokerage commissions. These expenses<br />
reflect the cost <strong>of</strong> executing and clearing<br />
futures and generally are calculated on a<br />
per-round-turn basis.<br />
Investor Safety Is Paramount in the<br />
Futures Market<br />
Protecting the interests <strong>of</strong> all participants in the<br />
futures market is the responsibility <strong>of</strong> exchange<br />
and industry members as well as federal<br />
regulators. Working together, they ensure<br />
the financial and market integrity required<br />
by investors.<br />
A brief overview <strong>of</strong> the <strong>Chicago</strong> <strong>Board</strong> <strong>of</strong> <strong>Trade</strong><br />
(CBOT ® ) and it’s clearing service provider will<br />
illustrate why the credit risk <strong>of</strong> exchange-traded<br />
products is minimal for futures investors.<br />
The Market Integrity <strong>of</strong> the CBOT…<br />
CBOT rules and regulations are designed to<br />
support competitive, efficient, and liquid markets.<br />
These rules and regulations are reviewed<br />
continuously by the CBOT and are periodically<br />
amended to reflect the needs <strong>of</strong> market users.<br />
Making sure that these trading practices and<br />
regulations are followed is the responsibility<br />
<strong>of</strong> the CBOT’s Office <strong>of</strong> Investigations and<br />
Audits (OIA). The OIA staff works to prevent<br />
trading irregularities and investigate possible<br />
violations <strong>of</strong> exchange and industry regulations.<br />
The activities <strong>of</strong> the department include<br />
daily on-site surveillance <strong>of</strong> trading activity,<br />
continuous monitoring <strong>of</strong> member firms’ trading<br />
practices with state-<strong>of</strong>-the-art technology, and<br />
prompt, thorough investigations <strong>of</strong> any<br />
customer complaints.<br />
9
…Combined with the Financial Integrity<br />
<strong>of</strong> Clearing<br />
Clearing operations are another mechanism<br />
used by exchanges to uphold the integrity<br />
<strong>of</strong> the futures markets. The clearing service<br />
provider (CSP) for the CBOT acts as a<br />
guarantor to clearing member firms for trades<br />
it maintains, reconciles all clearing member<br />
firm accounts each day to ensure that all<br />
gains have been credited and all losses have<br />
been collected, and sets and adjusts clearing<br />
member firm margins for changing<br />
market conditions.<br />
The CSP settles the account <strong>of</strong> each member<br />
firm at the end <strong>of</strong> the trading day, balancing<br />
quantities <strong>of</strong> contracts bought with those sold.<br />
In clearing trades, the CSP substitutes itself<br />
as the opposite party in each transaction,<br />
essentially eliminating counterparty credit risk.<br />
It interposes itself as the buyer to every clearing<br />
member seller and the seller to every clearing<br />
member buyer and becomes, in effect, a party<br />
to every clearing member transaction. Because<br />
<strong>of</strong> this substitution, it is no longer necessary for<br />
the buyer (or seller) to find the original seller (or<br />
buyer) when one wishes to <strong>of</strong>fset a position.<br />
The market participant merely executes an<br />
equal and opposite transaction, usually with<br />
an entirely different party, and ends up with<br />
a net zero position.<br />
firms must maintain against their position in<br />
each commodity. These margins are set by the<br />
CSP margin committee and governors. They<br />
are separate from the margins that individual<br />
holders <strong>of</strong> commodities accounts are required<br />
to deposit with brokers by exchange regulation.<br />
The CSP settles its accounts daily. As<br />
closing or settlement prices change the value<br />
<strong>of</strong> outstanding futures positions, the CSP<br />
collects from those who have lost money as<br />
a result <strong>of</strong> price changes and credits the<br />
funds immediately to the accounts <strong>of</strong> those<br />
who have gained. Thus, before each trading<br />
day begins, all <strong>of</strong> the previous day’s losses<br />
have been collected and all gains have been<br />
paid or credited. In this way, the CSP<br />
maintains very tight control over margins<br />
as prices fluctuate and ensures that sufficient<br />
margin money is on deposit at all times.<br />
One <strong>of</strong> the most important financial safeguards<br />
in ensuring performance on futures contracts is<br />
the clearing margin, which clearing member<br />
10
For More Information about the Futures Market<br />
The <strong>Chicago</strong> <strong>Board</strong> <strong>of</strong> <strong>Trade</strong> is dedicated to helping investors learn more about the benefits<br />
<strong>of</strong> using the futures market. It thus <strong>of</strong>fers a wide variety <strong>of</strong> educational publications and<br />
research materials which can be reviewed and ordered online at www.cbot.com.<br />
For More Information about Managed Futures<br />
Contact the sources listed here for information account, and other topics related to managed futures.<br />
Regulatory Agencies<br />
Commodity Futures Trading<br />
Commission (CFTC)<br />
Three Lafayette Centre<br />
1155 21st Street, NW<br />
Washington, DC 20581<br />
202-418-5000 / Fax: 202-418-5521<br />
www.cftc.gov<br />
National Futures Association (NFA)<br />
200 West Madison Street, Suite 1600<br />
<strong>Chicago</strong>, IL 60606-3447<br />
312-781-1300 / Fax: 312-781-1467<br />
http://www.nfa.futures.org<br />
Industry Associations<br />
Managed Funds Association (MFA)<br />
2025 M Street NW, Suite 800<br />
Washington, DC 20036-3309<br />
202-367-1140 / Fax: 202-367-2140<br />
www.mfainfo.org<br />
Futures Industry Association (FIA)<br />
2001 Pennsylvania Avenue NW, Suite 600<br />
Washington, DC 20006-1807<br />
202-466-5460 / Fax: 202-296-3184<br />
www.futuresindustry.org<br />
Reporting Services<br />
Barclay Trading Group, Ltd.<br />
2094 185th Street, Suite 1B<br />
Fairfield, IA 52556<br />
641-472-3456 / Fax: 641-472-9514<br />
www.barclaygrp.com<br />
International <strong>Trade</strong>rs Research, Inc.<br />
1020 Prospect Street, Suite 405<br />
LaJolla, CA 92037<br />
858-459-0818 / Fax: 858-459-0819<br />
www.managedfutures.com<br />
Mount Lucas Management Corporation<br />
47 Hulfish Street, Suite 510<br />
Princeton, NJ 08542<br />
1-800-545-0071<br />
www.mtlucas.com<br />
Managed Account Reports (MAR)<br />
1250 Broadway, 26th Floor<br />
New York, NY 10001<br />
212-213-6202 / Fax: 212-213-1870<br />
www.marhedge.com<br />
11
Business Development<br />
141 W. Jackson Boulevard<br />
<strong>Chicago</strong>, IL 60604-2994<br />
312-341-7955 • fax: 312-341-3027<br />
New York Office<br />
One Exchange Plaza<br />
55 Broadway, Suite 2602<br />
New York NY 10006<br />
212-943-0102 • fax: 212-943-0109<br />
Europe Office<br />
St. Michael’s House<br />
1 George Yard<br />
London EC3V 9DH<br />
United Kingdom<br />
44-20-7929-0021 • fax: 44-20-7929-0558<br />
Latin America Contact<br />
52-55-5605-1136 • fax: 52-55-5605-4381<br />
www.cbot.com<br />
©2005 <strong>Chicago</strong> <strong>Board</strong> <strong>of</strong> <strong>Trade</strong>. All rights reserved.<br />
The information herein is taken from sources believed to be reliable. However, it is intended for purposes <strong>of</strong> information and education only and is not guaranteed by the<br />
<strong>Chicago</strong> <strong>Board</strong> <strong>of</strong> <strong>Trade</strong> as to accuracy, completeness, nor any trading result, and does not constitute trading advise or constitute a solicitation <strong>of</strong> the purchase or sale <strong>of</strong><br />
any futures or options. The Rules and Regulations <strong>of</strong> the <strong>Chicago</strong> <strong>Board</strong> <strong>of</strong> <strong>Trade</strong> should be consulted as the authoritative source on all current contract specifications and<br />
regulations.<br />
“Dow Jones,” “The Dow,” “Dow Jones Industrial Average,” and “DJIA” are service marks <strong>of</strong> Dow Jones & Company, Inc. and have been licensed for use for certain purposes<br />
by the <strong>Board</strong> <strong>of</strong> <strong>Trade</strong> <strong>of</strong> the City <strong>of</strong> <strong>Chicago</strong>, Inc. (CBOT). The CBOT futures and futures options contracts based on Dow Jones’ Indexes are not<br />
sponsored, endorsed, sold, or promoted by Dow Jones, and Dow Jones makes no representation regarding the advisability <strong>of</strong> trading in such products.<br />
“Dow Jones,” “AIG,” “Dow Jones-AIG Commodity Index,” and “DJ-AIGCI” are service marks <strong>of</strong> Dow Jones SM & Company, Inc. and American International Group, Inc. (AIG),<br />
as the case may be, and have been licensed for use for certain purposes by the CBOT ® . Futures based on the Dow SM Jones-AIG Commodity Index are not sponsored,<br />
endorsed, or promoted by Dow Jones, AIG, AIG International Inc. (AIGI), or any <strong>of</strong> their respective subsidiaries or affiliates, and none <strong>of</strong> Dow Jones, AIG, AIGI, or any <strong>of</strong><br />
their respective subsidiaries or affiliates, makes any representation regarding the advisability <strong>of</strong> investing in such product(s).<br />
EM 35-2R2 11.01.10000 05-110120
![Definitions & Concepts... [PDF] - Cycles Research Institute](https://img.yumpu.com/26387731/1/190x245/definitions-concepts-pdf-cycles-research-institute.jpg?quality=85)