Managed Futures - Schindler Trading
Managed Futures - Schindler Trading
Managed Futures - Schindler Trading

Create successful ePaper yourself
Turn your PDF publications into a flip-book with our unique Google optimized e-Paper software.
Evaluating Risk from an Investor’s Perspective<br />
Investors should understand that there are risks<br />
associated with trading futures and options on futures.<br />
The Commodity <strong>Futures</strong> <strong>Trading</strong> Commission (CFTC)<br />
requires that prospective customers be provided with<br />
risk-disclosure statements which should be carefully<br />
reviewed. Past performance is not necessarily an<br />
indicator of future results.<br />
Potential investors will want to become familiar<br />
with industry definitions for evaluating the risk-return<br />
element of managed futures performance. The following<br />
equations, with some variations, are often used.<br />
Measure of Volatility<br />
Standard Deviation: The dispersion (distance) of<br />
observations (performance data) from the mean (or<br />
average) observation. This measure is often expressed<br />
as a percentage on an annualized basis.<br />
Measure of Capital Loss<br />
Largest Cumulative Decline or Maximum Drawdown:<br />
The largest cumulative percentage (peak-to-valley)<br />
decline in capital of a trading account or portfolio. This<br />
measure of risk identifies the worst-case scenario for a<br />
managed futures investment within a given time period.<br />
Measure of Risk-Adjusted Return<br />
Sharpe Ratio: A ratio that represents a rate of return<br />
adjusted for risk, calculated as follows:<br />
Annual rate of return - Risk-free rate of return<br />
Annualized standard deviation<br />
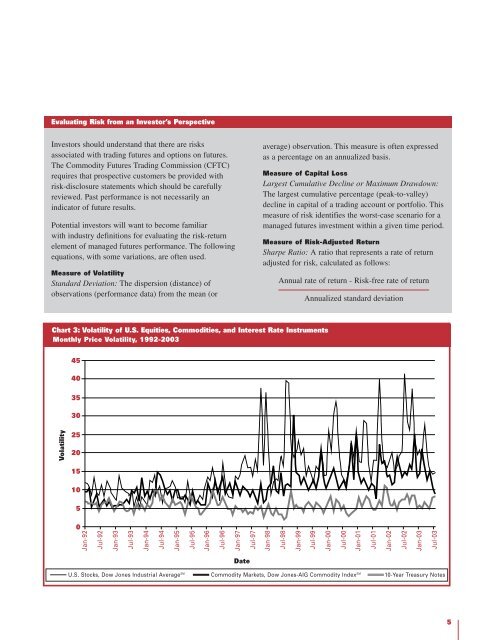
Chart 3: Volatility of U.S. Equities, Commodities, and Interest Rate Instruments<br />
Monthly Price Volatility, 1992-2003<br />
45<br />
40<br />
35<br />
30<br />
Volatility<br />
25<br />
20<br />
15<br />
10<br />
5<br />
0<br />
Jan-92<br />
Jul-92<br />
Jan-93<br />
Jul-93<br />
Jan-94<br />
Jul-94<br />
Jan-95<br />
Jul-95<br />
Jan-96<br />
Jul-96<br />
Jan-97<br />
Jul-97<br />
Jan-98<br />
Jul-98<br />
Jan-99<br />
Jul-99<br />
Jan-00<br />
Jul-00<br />
Jan-01<br />
Jul-01<br />
Jan-02<br />
Jul-02<br />
Jan-03<br />
Jul-03<br />
Date<br />
U.S. Stocks, Dow Jones Industrial Average SM Commodity Markets, Dow Jones-AIG Commodity Index SM 10-Year Treasury Notes<br />
5
![Definitions & Concepts... [PDF] - Cycles Research Institute](https://img.yumpu.com/26387731/1/190x245/definitions-concepts-pdf-cycles-research-institute.jpg?quality=85)