Masters of the Climate: Innovative farmers ... - South West NRM
Masters of the Climate: Innovative farmers ... - South West NRM
Masters of the Climate: Innovative farmers ... - South West NRM

You also want an ePaper? Increase the reach of your titles
YUMPU automatically turns print PDFs into web optimized ePapers that Google loves.
By Dr Barry White<br />
Research Coordinator<br />
Managing <strong>Climate</strong> Variability Program<br />
Land & Water Australia<br />
The <strong>Masters</strong> <strong>of</strong> <strong>the</strong> <strong>Climate</strong> case<br />
studies drew out a number <strong>of</strong> tools<br />
that participants are using to manage<br />
for climate variability. This article<br />
explains how some <strong>of</strong> those tools can<br />
contribute to improved climate risk<br />
management.The information on use<br />
<strong>of</strong> seasonal forecasts is necessarily<br />
general and should be checked for its<br />
relevance in particular situations.<br />
SOI<br />
40<br />
30<br />
20<br />
10<br />
0<br />
-10<br />
-20<br />
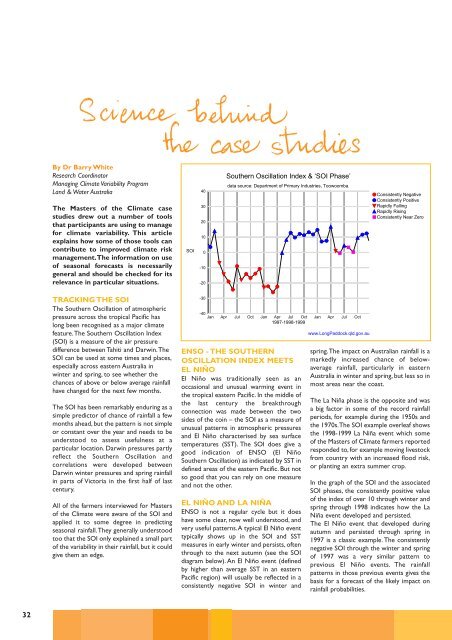
Sou<strong>the</strong>rn Oscillation Index & ‘SOI Phase’<br />
data source: Department <strong>of</strong> Primary Industries, Toowoomba.<br />
Consistently Negative<br />
Consistently Positive<br />
Rapidly Falling<br />
Rapidly Rising<br />
Consistently Near Zero<br />
TRACKING THE SOI<br />
The Sou<strong>the</strong>rn Oscillation <strong>of</strong> atmospheric<br />
pressure across <strong>the</strong> tropical Pacific has<br />
long been recognised as a major climate<br />
feature.The Sou<strong>the</strong>rn Oscillation Index<br />
(SOI) is a measure <strong>of</strong> <strong>the</strong> air pressure<br />
difference between Tahiti and Darwin.The<br />
SOI can be used at some times and places,<br />
especially across eastern Australia in<br />
winter and spring, to see whe<strong>the</strong>r <strong>the</strong><br />
chances <strong>of</strong> above or below average rainfall<br />
have changed for <strong>the</strong> next few months.<br />
The SOI has been remarkably enduring as a<br />
simple predictor <strong>of</strong> chance <strong>of</strong> rainfall a few<br />
months ahead, but <strong>the</strong> pattern is not simple<br />
or constant over <strong>the</strong> year and needs to be<br />
understood to assess usefulness at a<br />
particular location. Darwin pressures partly<br />
reflect <strong>the</strong> Sou<strong>the</strong>rn Oscillation and<br />
correlations were developed between<br />
Darwin winter pressures and spring rainfall<br />
in parts <strong>of</strong> Victoria in <strong>the</strong> first half <strong>of</strong> last<br />
century.<br />
All <strong>of</strong> <strong>the</strong> <strong>farmers</strong> interviewed for <strong>Masters</strong><br />
<strong>of</strong> <strong>the</strong> <strong>Climate</strong> were aware <strong>of</strong> <strong>the</strong> SOI and<br />
applied it to some degree in predicting<br />
seasonal rainfall.They generally understood<br />
too that <strong>the</strong> SOI only explained a small part<br />
<strong>of</strong> <strong>the</strong> variability in <strong>the</strong>ir rainfall, but it could<br />
give <strong>the</strong>m an edge.<br />
-30<br />
-40<br />
Jan Apr Jul Oct Jan Apr Jul Oct Jan Apr Jul Oct<br />
1997-1998-1999<br />
ENSO - THE SOUTHERN<br />
OSCILLATION INDEX MEETS<br />
EL NIÑO<br />
El Niño was traditionally seen as an<br />
occasional and unusual warming event in<br />
<strong>the</strong> tropical eastern Pacific. In <strong>the</strong> middle <strong>of</strong><br />
<strong>the</strong> last century <strong>the</strong> breakthrough<br />
connection was made between <strong>the</strong> two<br />
sides <strong>of</strong> <strong>the</strong> coin – <strong>the</strong> SOI as a measure <strong>of</strong><br />
unusual patterns in atmospheric pressures<br />
and El Niño characterised by sea surface<br />
temperatures (SST). The SOI does give a<br />
good indication <strong>of</strong> ENSO (El Niño<br />
Sou<strong>the</strong>rn Oscillation) as indicated by SST in<br />
defined areas <strong>of</strong> <strong>the</strong> eastern Pacific. But not<br />
so good that you can rely on one measure<br />
and not <strong>the</strong> o<strong>the</strong>r.<br />
EL NIÑO AND LA NIÑA<br />
ENSO is not a regular cycle but it does<br />
have some clear, now well understood, and<br />
very useful patterns.A typical El Niño event<br />
typically shows up in <strong>the</strong> SOI and SST<br />
measures in early winter and persists, <strong>of</strong>ten<br />
through to <strong>the</strong> next autumn (see <strong>the</strong> SOI<br />
diagram below). An El Niño event (defined<br />
by higher than average SST in an eastern<br />
Pacific region) will usually be reflected in a<br />
consistently negative SOI in winter and<br />
www.LongPaddock.qld.gov.au<br />
spring.The impact on Australian rainfall is a<br />
markedly increased chance <strong>of</strong> belowaverage<br />
rainfall, particularly in eastern<br />
Australia in winter and spring, but less so in<br />
most areas near <strong>the</strong> coast.<br />
The La Niña phase is <strong>the</strong> opposite and was<br />
a big factor in some <strong>of</strong> <strong>the</strong> record rainfall<br />
periods, for example during <strong>the</strong> 1950s and<br />
<strong>the</strong> 1970s.The SOI example overleaf shows<br />
<strong>the</strong> 1998-1999 La Niña event which some<br />
<strong>of</strong> <strong>the</strong> <strong>Masters</strong> <strong>of</strong> <strong>Climate</strong> <strong>farmers</strong> reported<br />
responded to, for example moving livestock<br />
from country with an increased flood risk,<br />
or planting an extra summer crop.<br />
In <strong>the</strong> graph <strong>of</strong> <strong>the</strong> SOI and <strong>the</strong> associated<br />
SOI phases, <strong>the</strong> consistently positive value<br />
<strong>of</strong> <strong>the</strong> index <strong>of</strong> over 10 through winter and<br />
spring through 1998 indicates how <strong>the</strong> La<br />
Niña event developed and persisted.<br />
The El Niño event that developed during<br />
autumn and persisted through spring in<br />
1997 is a classic example. The consistently<br />
negative SOI through <strong>the</strong> winter and spring<br />
<strong>of</strong> 1997 was a very similar pattern to<br />
previous El Niño events. The rainfall<br />
patterns in those previous events gives <strong>the</strong><br />
basis for a forecast <strong>of</strong> <strong>the</strong> likely impact on<br />
rainfall probabilities.<br />
32