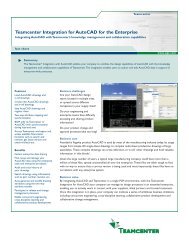
Teamcenter Reporting and Analytics
Teamcenter Reporting and Analytics
Teamcenter Reporting and Analytics

You also want an ePaper? Increase the reach of your titles
YUMPU automatically turns print PDFs into web optimized ePapers that Google loves.
fact sheet<br />
<strong>Teamcenter</strong><br />
Features<br />
Scalable, pure web-based open<br />
architecture<br />
Web browser client<br />
Platform <strong>and</strong> database<br />
independence<br />
“Data cubes” that eliminate the<br />
need for data-warehouse or<br />
data-mart<br />
Tight integration with <strong>Teamcenter</strong><br />
applications<br />
Open, flexible data input formats,<br />
including application-specific APIs,<br />
relational database, XML, flat file,<br />
Excel <strong>and</strong> “star-schema” data<br />
Intuitive user interface for Mapper<br />
module <strong>and</strong> end-user centric<br />
BuildNPlay module<br />
Powerful integrated scheduler as<br />
part of BuildNPlay<br />
Configurable role-based access<br />
privileges to core features <strong>and</strong><br />
functionality<br />
Load management capabilities for<br />
source data production servers<br />
Storage for snapshot analysis or<br />
cached analysis<br />
Visual identification of exceptional<br />
values defined by user-specified<br />
rules<br />
Flexible ad hoc report generation<br />
Output analysis in HTML, XML,<br />
Excel, PDF <strong>and</strong> email formats<br />
Hierarchical data presentation with<br />
drill-up <strong>and</strong> drill-down flexibility<br />
Integrated graph, as well as graph<br />
<strong>and</strong> cube capabilities, for easy<br />
display <strong>and</strong> dynamic analysis<br />
Users can leverage <strong>Reporting</strong> <strong>and</strong> <strong>Analytics</strong>’<br />
web-browser client <strong>and</strong> cache analysis<br />
techniques to perform “snapshot” business<br />
analyses <strong>and</strong> generate ad-hoc reports – as<br />
well as to support trend analysis/reporting.<br />
<strong>Reporting</strong> <strong>and</strong> <strong>Analytics</strong> leverages underlying<br />
caching <strong>and</strong> data cube techniques to reduce<br />
system overhead <strong>and</strong> thereby lower<br />
ownership cost. These techniques enable<br />
users to utilize the same data for different<br />
types of analyses.<br />
An integrated scheduler optimizes operations by enabling users to run reports immediately, periodically<br />
or at later times. Users can request reports by type while basing appropriate variations on data<br />
selections. In addition, users can perform trend analysis of data gathered from multiple applications.<br />
Use cases<br />
Complex report generation <strong>and</strong> analysis. <strong>Reporting</strong> <strong>and</strong> <strong>Analytics</strong> can be used to produce a variety of<br />
complex reports, including:<br />
• Detailed BOM/part list reports<br />
• BTP package status reports<br />
• BOM comparison reports<br />
• Part failure analysis reports<br />
• ITAR reports<br />
• Process status <strong>and</strong> performance reports<br />
• Orphan part reports<br />
<strong>Reporting</strong> <strong>and</strong> <strong>Analytics</strong>’ users leverage <strong>Teamcenter</strong>’s core application-specific object model <strong>and</strong><br />
intuitive user interface to map <strong>Teamcenter</strong>-managed objects, relationships <strong>and</strong> attributes into flexible<br />
business queries.<br />
Customized analytics <strong>and</strong> <strong>Teamcenter</strong>’s drill-through capability. <strong>Reporting</strong> <strong>and</strong> <strong>Analytics</strong> can be used to perform<br />
a variety of customized analytics, including:<br />
• Organization-specific process status<br />
metrics <strong>and</strong> KPIs<br />
• Multi-level root-cause analysis<br />
• Mean time between failure (MTBF) analysis<br />
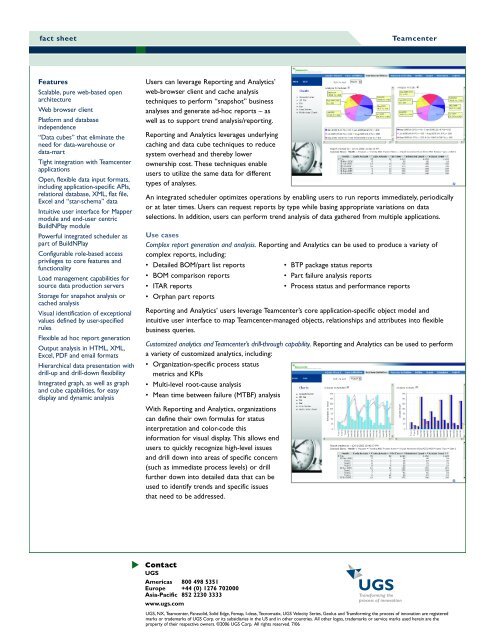
With <strong>Reporting</strong> <strong>and</strong> <strong>Analytics</strong>, organizations<br />
can define their own formulas for status<br />
interpretation <strong>and</strong> color-code this<br />
information for visual display. This allows end<br />
users to quickly recognize high-level issues<br />
<strong>and</strong> drill down into areas of specific concern<br />
(such as immediate process levels) or drill<br />
further down into detailed data that can be<br />
used to identify trends <strong>and</strong> specific issues<br />
that need to be addressed.<br />
Contact<br />
UGS<br />
Americas 800 498 5351<br />
Europe +44 (0) 1276 702000<br />
Asia-Pacific 852 2230 3333<br />
www.ugs.com<br />
UGS, NX, <strong>Teamcenter</strong>, Parasolid, Solid Edge, Femap, I-deas, Tecnomatix, UGS Velocity Series, Geolus <strong>and</strong> Transforming the process of innovation are registered<br />
marks or trademarks of UGS Corp. or its subsidiaries in the US <strong>and</strong> in other countries. All other logos, trademarks or service marks used herein are the<br />
property of their respective owners. ©2006 UGS Corp. All rights reserved. 7/06