Panel Data Analysis, Josef Brüderl - Sowi
Panel Data Analysis, Josef Brüderl - Sowi
Panel Data Analysis, Josef Brüderl - Sowi

Create successful ePaper yourself
Turn your PDF publications into a flip-book with our unique Google optimized e-Paper software.
<strong>Panel</strong> <strong>Data</strong> <strong>Analysis</strong>, <strong>Josef</strong> Brüderl 18<br />
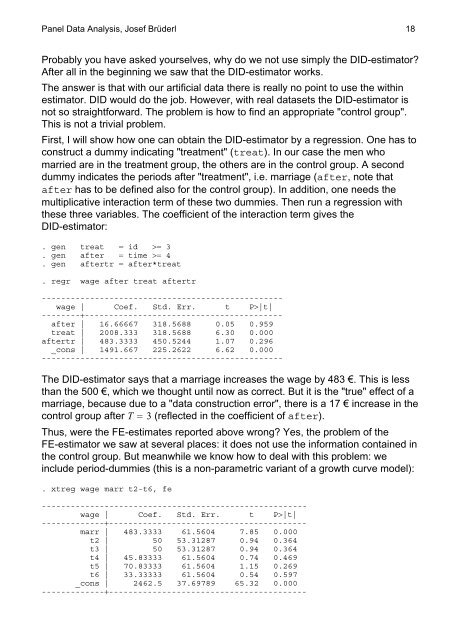
Probably you have asked yourselves, why do we not use simply the DID-estimator?<br />
After all in the beginning we saw that the DID-estimator works.<br />
The answer is that with our artificial data there is really no point to use the within<br />
estimator. DID would do the job. However, with real datasets the DID-estimator is<br />
not so straightforward. The problem is how to find an appropriate "control group".<br />
This is not a trivial problem.<br />
First, I will show how one can obtain the DID-estimator by a regression. One has to<br />
construct a dummy indicating "treatment" (treat). In our case the men who<br />
married are in the treatment group, the others are in the control group. A second<br />
dummy indicates the periods after "treatment", i.e. marriage (after, note that<br />
after has to be defined also for the control group). In addition, one needs the<br />
multiplicative interaction term of these two dummies. Then run a regression with<br />
these three variables. The coefficient of the interaction term gives the<br />
DID-estimator:<br />
. gen treat id 3<br />
. gen after time 4<br />
. gen aftertr after*treat<br />
. regr wage after treat aftertr<br />
--------------------------------------------------<br />
wage | Coef. Std. Err. t P|t|<br />
-------------------------------------------------<br />
after | 16.66667 318.5688 0.05 0.959<br />
treat | 2008.333 318.5688 6.30 0.000<br />
aftertr | 483.3333 450.5244 1.07 0.296<br />
_cons | 1491.667 225.2622 6.62 0.000<br />
--------------------------------------------------<br />
The DID-estimator says that a marriage increases the wage by 483 €. This is less<br />
than the 500 €, which we thought until now as correct. But it is the "true" effect of a<br />
marriage, because due to a "data construction error", there is a 17 € increase in the<br />
control group after T 3 (reflected in the coefficient of after).<br />
Thus, were the FE-estimates reported above wrong? Yes, the problem of the<br />
FE-estimator we saw at several places: it does not use the information contained in<br />
the control group. But meanwhile we know how to deal with this problem: we<br />
include period-dummies (this is a non-parametric variant of a growth curve model):<br />
. xtreg wage marr t2-t6, fe<br />
-------------------------------------------------------<br />
wage | Coef. Std. Err. t P|t|<br />
------------------------------------------------------<br />
marr | 483.3333 61.5604 7.85 0.000<br />
t2 | 50 53.31287 0.94 0.364<br />
t3 | 50 53.31287 0.94 0.364<br />
t4 | 45.83333 61.5604 0.74 0.469<br />
t5 | 70.83333 61.5604 1.15 0.269<br />
t6 | 33.33333 61.5604 0.54 0.597<br />
_cons | 2462.5 37.69789 65.32 0.000<br />
------------------------------------------------------