Panel Data Analysis, Josef Brüderl - Sowi
Panel Data Analysis, Josef Brüderl - Sowi
Panel Data Analysis, Josef Brüderl - Sowi

Create successful ePaper yourself
Turn your PDF publications into a flip-book with our unique Google optimized e-Paper software.
<strong>Panel</strong> <strong>Data</strong> <strong>Analysis</strong>, <strong>Josef</strong> Brüderl 4<br />
EURO per month<br />
0 1000 2000 3000 4000 5000<br />
1 2 3 4 5 6<br />
Time<br />
before marriage<br />
after marriage<br />
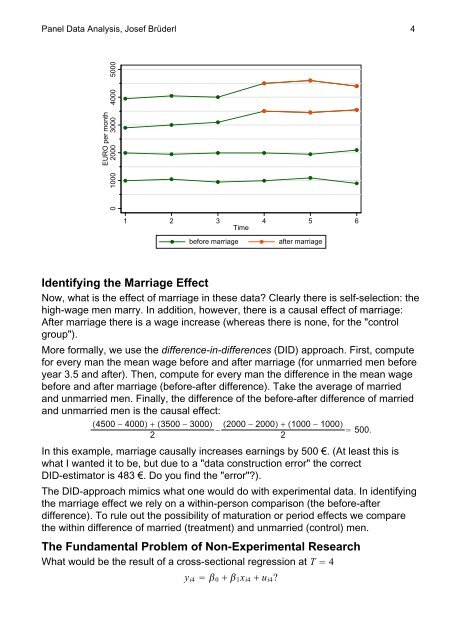
Identifying the Marriage Effect<br />
Now, what is the effect of marriage in these data? Clearly there is self-selection: the<br />
high-wage men marry. In addition, however, there is a causal effect of marriage:<br />
After marriage there is a wage increase (whereas there is none, for the "control<br />
group").<br />
More formally, we use the difference-in-differences (DID) approach. First, compute<br />
for every man the mean wage before and after marriage (for unmarried men before<br />
year 3.5 and after). Then, compute for every man the difference in the mean wage<br />
before and after marriage (before-after difference). Take the average of married<br />
and unmarried men. Finally, the difference of the before-after difference of married<br />
and unmarried men is the causal effect:<br />
4500 − 4000 3500 − 3000<br />
2<br />
−<br />
2000 − 2000 1000 − 1000<br />
2<br />
500.<br />
In this example, marriage causally increases earnings by 500 €. (At least this is<br />
what I wanted it to be, but due to a "data construction error" the correct<br />
DID-estimator is 483 €. Do you find the "error"?).<br />
The DID-approach mimics what one would do with experimental data. In identifying<br />
the marriage effect we rely on a within-person comparison (the before-after<br />
difference). To rule out the possibility of maturation or period effects we compare<br />
the within difference of married (treatment) and unmarried (control) men.<br />
The Fundamental Problem of Non-Experimental Research<br />
What would be the result of a cross-sectional regression at T 4<br />
y i4 0 1 x i4 u i4 ?