BIS guide for clinicians
BIS guide for clinicians
BIS guide for clinicians

Create successful ePaper yourself
Turn your PDF publications into a flip-book with our unique Google optimized e-Paper software.
the correlation between all the frequencies within the signal,<br />
bispectral analysis yields an additional EEG facet of brain<br />
activity. 1<br />
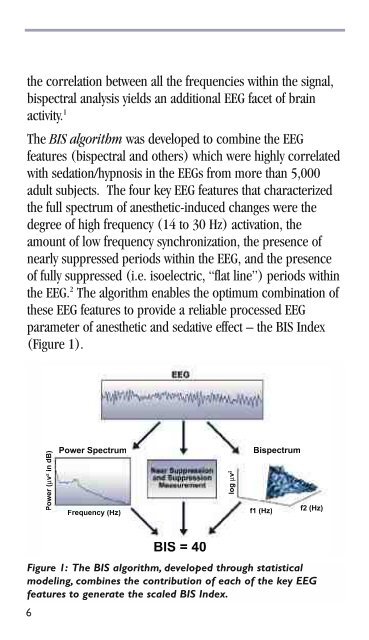
The <strong>BIS</strong> algorithm was developed to combine the EEG<br />
features (bispectral and others) which were highly correlated<br />
with sedation/hypnosis in the EEGs from more than 5,000<br />
adult subjects. The four key EEG features that characterized<br />
the full spectrum of anesthetic-induced changes were the<br />
degree of high frequency (14 to 30 Hz) activation, the<br />
amount of low frequency synchronization, the presence of<br />
nearly suppressed periods within the EEG, and the presence<br />
of fully suppressed (i.e. isoelectric, “flat line”) periods within<br />
the EEG. 2 The algorithm enables the optimum combination of<br />
these EEG features to provide a reliable processed EEG<br />
parameter of anesthetic and sedative effect – the <strong>BIS</strong> Index<br />
(Figure 1).<br />
Figure 1: The <strong>BIS</strong> algorithm, developed through statistical<br />
modeling, combines the contribution of each of the key EEG<br />
features to generate the scaled <strong>BIS</strong> Index.<br />
6