Parvin Branch and Tarkiln Branch, Vineland, NJ Subwatershed ...
Parvin Branch and Tarkiln Branch, Vineland, NJ Subwatershed ...
Parvin Branch and Tarkiln Branch, Vineland, NJ Subwatershed ...

Create successful ePaper yourself
Turn your PDF publications into a flip-book with our unique Google optimized e-Paper software.
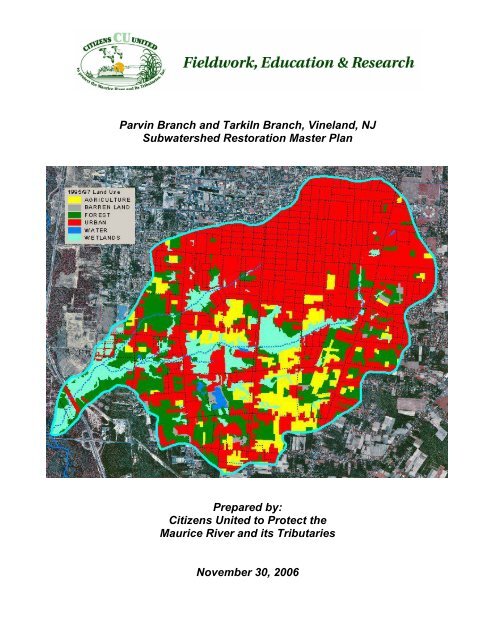
<strong>Parvin</strong> <strong>Branch</strong> <strong>and</strong> <strong>Tarkiln</strong> <strong>Branch</strong>, Vinel<strong>and</strong>, <strong>NJ</strong><br />
<strong>Subwatershed</strong> Restoration Master Plan<br />
Prepared by:<br />
Citizens United to Protect the<br />
Maurice River <strong>and</strong> its Tributaries<br />
November 30, 2006
2<br />
Forward<br />
In the summer of 2000, my wife Julie <strong>and</strong> I attended a New Jersey Conservation Foundation l<strong>and</strong><br />
preservation rally where the goal was to identify important conservation l<strong>and</strong>s that would be beneficial<br />
to buy for permanent preservation in Southern New Jersey. Jane Galetto, President of Citizens United<br />
to Protect the Maurice River, told us how special the natural l<strong>and</strong>s were where Muddy Run flows from<br />
<strong>Parvin</strong> State Park (not to be confused with <strong>Parvin</strong>s <strong>Branch</strong>) into the Maurice River across from the City<br />
of Vinel<strong>and</strong>.<br />
Then one day that Fall, we decided to launch a canoe into the Maurice River <strong>and</strong> paddle upstream in<br />
search of a pristine aquatic ecosystem in the Union Lake Wildlife Management Area, <strong>and</strong> possibly see<br />
some threatened <strong>and</strong> endangered species. But in stark contrast to the clear water, full of different<br />
species of fish <strong>and</strong> beautiful aquatic vegetation in Muddy Run <strong>and</strong> the Maurice River, we ran into a<br />
huge cloudy orange <strong>and</strong> stinky discharge of water coming out of <strong>Parvin</strong>s <strong>Branch</strong> from the City of<br />
Vinel<strong>and</strong>.<br />
Having never seen anything of that magnitude or character in the many South Jersey streams I have<br />
experienced over the past 35 years, I decided to call the New Jersey Department of Environmental<br />
Protection (<strong>NJ</strong>DEP) Hot Line, file a complaint, get a case number, <strong>and</strong> get to the source of the stinky<br />
orange water polluting the Maurice River. So that is when <strong>and</strong> where this project started.<br />
The <strong>NJ</strong>DEP field inspector assigned to the case searched around the area for about 2 weeks looking<br />
for the source, <strong>and</strong> finally came to the un-substantiated conclusion that water was going underground<br />
through the old l<strong>and</strong>fill, collecting rust from old l<strong>and</strong>fill junk, <strong>and</strong> then belching up out of the ground<br />
all around the sewerage treatment plant. And since there was nothing anyone could do about the old<br />
l<strong>and</strong>fill, then there was nothing that could be done to further solve the mystery of the orange water.<br />
Meanwhile, this was about the time that Governor Christy Whitman was taking canoe rides in<br />
Southern New Jersey <strong>and</strong> promising $600,000 grants to county governments like Cumberl<strong>and</strong> County<br />
to start a “Watershed Management Process” to identify <strong>and</strong> stop nonpoint source pollutants from<br />
degrading our surface water quality.<br />
Since I did not find <strong>NJ</strong>DEP’s preliminary assessment about the orange water to be plausible, I<br />
decided to write to the Division of Watershed Management (DWM) <strong>and</strong> propose that they take a more<br />
in depth look at this pollution <strong>and</strong> try to figure out what was the cause <strong>and</strong> where was the source. My<br />
letter went out in the spring of 2001, <strong>and</strong> DWM took a close look at the request <strong>and</strong> decided to take<br />
some watershed management action.<br />
<strong>NJ</strong>DEP requested an environmental consultant, TRC OMNI Environmental, to take a look at the<br />
situation <strong>and</strong> propose a publicly funded study project to look at all possible sources for the whole<br />
stream system involved, all the way up into the City of Vinel<strong>and</strong>. So on September 11, 2001 (yes,<br />
9/11), I met in the field with 2 OMNI consultants, <strong>and</strong> the project planning process was started.<br />
A non-profit partner would be required to receive the grant funding, so I went to Jane Galetto <strong>and</strong><br />
asked for Citizens United (CU) to host the project, <strong>and</strong> I would then become the volunteer Water<br />
Quality Project Manager for Citizens United. Jane agreed, so then in May of 2002, <strong>NJ</strong>DEP<br />
Commissioner Bradley Campbell sent us a letter authorizing $56,400 to be granted to CU, with a<br />
condition that CU would have to contribute an additional $20,000 as a match.
3<br />
Fortunately the match could be from volunteer efforts, so I committed to contribute at least<br />
$20,000 of my time to manage the project. The project started on July 1, 2002, <strong>and</strong> followed a long<br />
<strong>and</strong> twisting course for the next 4 ½ years.<br />
Today, the orange stinky water is still pouring into the Maurice River just above Sherman Ave., 24<br />
hours a day, 7 days a week. A large partnership of interested parties have applied sound science to the<br />
causes of the orange water, as well as the identification <strong>and</strong> study of a number of other sources of<br />
water quality degradation in the <strong>Parvin</strong> <strong>and</strong> <strong>Tarkiln</strong> <strong>Branch</strong>es in the City of Vinel<strong>and</strong>.<br />
While the causes <strong>and</strong> the sources <strong>and</strong> the degree of water quality degradation were found to be<br />
complex <strong>and</strong> difficult to underst<strong>and</strong> <strong>and</strong> deal with, the application of watershed science <strong>and</strong> research to<br />
the conditions <strong>and</strong> problems has yielded many important facts <strong>and</strong> recommendations that should prove<br />
useful in underst<strong>and</strong>ing <strong>and</strong> acting to improve the water quality of this subwatershed.<br />
The City of Vinel<strong>and</strong>, like all municipalities in our state, must now meet new permit requirements<br />
to regulate stormwater runoff from paved streets <strong>and</strong> roads, roof tops, <strong>and</strong> other impervious surfaces.<br />
As the Water Quality Project Manager for Citizens United, it is my hope that the City of Vinel<strong>and</strong>,<br />
<strong>NJ</strong>DEP, Cumberl<strong>and</strong> County, <strong>and</strong> the general public will use this information <strong>and</strong> recommendations to<br />
manage stormwater runoff <strong>and</strong> l<strong>and</strong> use so that water quality in the <strong>Parvin</strong> <strong>and</strong> <strong>Tarkiln</strong> <strong>Branch</strong>es, <strong>and</strong><br />
the Maurice River, will be measurably improved in the future.<br />
Fred Akers<br />
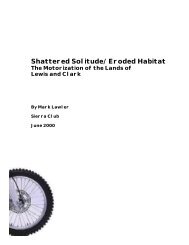
Orange water flowing from <strong>Parvin</strong>s <strong>Branch</strong> into the Maurice River above Sherman Avenue.
Acknowledgements<br />
4<br />
Special thanks to: Dr. Pete Kallin, Project Manager for TRC OMNI for his guidance <strong>and</strong><br />
continuity; Jane Galetto, President of Citizens United, for all her continued support <strong>and</strong><br />
encouragement; Dennis Palmer, Executive Director of the L<strong>and</strong>is Sewerage Authority, for hosting on<br />
site meetings <strong>and</strong> sampling; <strong>and</strong> Karen Ward, <strong>NJ</strong>DEP, for guiding all the accounting <strong>and</strong> paperwork<br />
associated with this 319h Grant.<br />
A rich diversity of people contributed to this project, <strong>and</strong> all involved are herby acknowledged <strong>and</strong><br />
sincerely thanked for their participation:<br />
Citizens United<br />
Jane Galetto<br />
Anthony W. Ficcaglia<br />
Gerry Barsotti<br />
John D’Orio<br />
Dom Barsotti<br />
Renee Scagnelli<br />
Tim Jacobson<br />
Julie Akers<br />
Steve Testa Upper Deerfield Boy Scout Troop 27<br />
TRC OMNI Environmental<br />
Peter Kallin<br />
Chris Obropta<br />
Katie Buckley<br />
Michael Wright<br />
Nicole Joy<br />
Jeremiah Bergstrom<br />
Amy Soli<br />
Greg Soska<br />
Jonathan Johnson<br />
L<strong>and</strong>is Sewerage Authority<br />
Dennis Palmer<br />
James Hughes<br />
Leslie Glessner<br />
New Jersey Department of Environmental Protection<br />
Larry Baier<br />
Ken Klipstein<br />
Mike Haberl<strong>and</strong><br />
Dave McPartl<strong>and</strong><br />
Jay Springer<br />
Karen Ward<br />
Danielle Donkersloot<br />
Kerry Pflugh<br />
Mark Ferco<br />
Lou Claudi
I. Introduction................................................................................................................7<br />
II. Watershed Characterization.....................................................................................9<br />
A. Watershed Inventory................................................................................................9<br />
1. Watershed Management Area 17.........................................................................9<br />
2. Maurice River Watershed..................................................................................10<br />
3. <strong>Parvin</strong> <strong>Branch</strong> <strong>and</strong> <strong>Tarkiln</strong> <strong>Branch</strong> Watershed ..................................................10<br />
B. GIS.........................................................................................................................11<br />
III. Watershed Assessment ............................................................................................12<br />
A. Sampling Stations ..................................................................................................12<br />
1. PB1 (<strong>Parvin</strong> <strong>Branch</strong> at South Orchard Road)....................................................13<br />
2. PB2 (<strong>Parvin</strong> <strong>Branch</strong> above confluence with Maurice River) ............................13<br />
3. TB1 (<strong>Tarkiln</strong> <strong>Branch</strong> at South Orchard Road) ..................................................14<br />
4. SEDN (<strong>Parvin</strong> <strong>Branch</strong>, North Bank 100 yards east of Route 55)......................14<br />
5. SEDS (<strong>Parvin</strong> <strong>Branch</strong>, South Bank 100 yards east of Route 55) ......................14<br />
6. GWN (<strong>Parvin</strong> <strong>Branch</strong>, North Bank 100 yards east of Route 55).......................14<br />
7. GWS ( <strong>Parvin</strong> <strong>Branch</strong>, South Bank 100 yards east of Route 55) ......................15<br />
B. Stream Visual Assessment Protocol ......................................................................15<br />
1. Methods .............................................................................................................15<br />
2. Results................................................................................................................17<br />
3. Stormwater Outlet Identification/Mapping........................................................19<br />
C. Chemical Evaluation..............................................................................................19<br />
1. Existing Data .....................................................................................................19<br />
2. Watershed Sampling..........................................................................................19<br />
3. Results................................................................................................................25<br />
D. Biological Analysis................................................................................................26<br />
1. Methods .............................................................................................................26<br />
2. Results................................................................................................................28<br />
IV. Recommendations....................................................................................................31<br />
A. Stormwater Management.......................................................................................31<br />
1. Conduct an Evaluation of Stormwater Phase II Compliance ............................31<br />
2. Enact a Stormwater Runoff Pollution Ordinance for New Development .........32<br />
3. Implement Stormwater BMPs ...........................................................................33<br />
4. Develop Training Sessions for Municipalities ..................................................33<br />
B. Riparian Area Management...................................................................................34<br />
1. Control Debris in Floodplains ...........................................................................34<br />
2. Manage Invasive Plants .....................................................................................34<br />
3. Enhance Natural Habitats ..................................................................................35<br />
4. Enact Stream Corridor/Greenway Management................................................35<br />
5. Manage Construction Sites................................................................................35<br />
6. Protect Watershed Easements along Surface Waters ........................................36<br />
7. Acquire <strong>and</strong> Protect Floodplain Property ..........................................................36<br />
C. Measurable Milestones ..........................................................................................37<br />
5
6<br />
APPENDICES<br />
Appendix A <strong>Parvin</strong>-<strong>Tarkiln</strong> Main <strong>Branch</strong> Reach Report page 38<br />
Appendix B <strong>Tarkiln</strong> <strong>Branch</strong> Reach Report page 40<br />
Appendix C <strong>Parvin</strong> <strong>Branch</strong> Reach Report page 42<br />
Appendix D Sampling Results Tables page 44<br />
Appendix E Dry Weather Sampling Results Concentration Graphs page 50<br />
Appendix F Benthic Macroinvertebrate Tables page 56<br />
Appendix G In-Situ Data Tables page 61<br />
Appendix H Stream Assessment Protocol (SVAP) <strong>and</strong> copy of page 65<br />
modified survey form<br />
Appendix I Quality Assurance Sampling Plan for <strong>Parvin</strong> Brook <strong>and</strong> page 110<br />
<strong>Tarkiln</strong> Brook Water Quality Assessment<br />
Appendix J <strong>Parvin</strong>-<strong>Tarkiln</strong> <strong>Branch</strong>es GIS page 111<br />
Appendix K OMNI WMA-17 Data GIS page 112<br />
Appendix L OMNI WMA-17 Characterization & Assessment page 113
I. INTRODUCTION<br />
7<br />
The <strong>Parvin</strong> <strong>Branch</strong> <strong>and</strong> <strong>Tarkiln</strong> <strong>Branch</strong> Watershed (<strong>Parvin</strong> & <strong>Tarkiln</strong> Watershed) covers<br />
approximately 9 square miles in the City of Vinel<strong>and</strong>, Cumberl<strong>and</strong> County, New Jersey. A significant<br />
impact on water quality within the watershed is the presence of iron oxides in the streambed, which<br />
degrades benthic habitat <strong>and</strong> fosters the growth of undesirable <strong>and</strong> odiferous algae. Substantial<br />
portions of the watershed are developed <strong>and</strong> contribute significant quantities of stormwater, sediment,<br />
<strong>and</strong> debris to the streams during rain events. Characterizing <strong>and</strong> locating the source of these<br />
contaminants <strong>and</strong> developing measures to control them will improve both water quality <strong>and</strong> aquatic<br />
habitat within the stream.<br />
In order to develop a restoration plan to address impacts to water quality in <strong>Parvin</strong> <strong>Branch</strong> <strong>and</strong><br />
<strong>Tarkiln</strong> <strong>Branch</strong>, Citizens United to Protect the Maurice River <strong>and</strong> its Tributaries (Citizens United),<br />
TRC Omni Environmental Corporation (TRC Omni), <strong>and</strong> other project partners completed an<br />
assessment of <strong>Parvin</strong> & <strong>Tarkiln</strong> Watershed. This study analyzed sediment, surface water <strong>and</strong><br />
groundwater samples to assess water quality. The data were used to identify probable sources of water<br />
quality degradation (including the iron oxides) in order to make recommendations for appropriate Best<br />
Management Practices (BMPs) to protect <strong>and</strong> improve water quality in this watershed. The endproduct<br />
of these studies is the <strong>Parvin</strong> <strong>Branch</strong> <strong>and</strong> <strong>Tarkiln</strong> <strong>Branch</strong> Watershed Restoration Master Plan.<br />
The Watershed Restoration Master Plan provides a defined strategy for implementing water<br />
quality improvement <strong>and</strong> protection projects in <strong>Parvin</strong> & <strong>Tarkiln</strong> Watershed. A watershed-wide<br />
assessment helps identify projects that address water quality issues <strong>and</strong> can be justified in grant<br />
applications to secure funding. This necessary planning process includes:<br />
‣ Assessment of riparian areas for needed stream bank stabilization,<br />
‣ Evaluation of existing impairments,<br />
‣ Identification of nonpoint source (NPS) pollution sources,<br />
‣ Recommended solutions to address water quality impairments, <strong>and</strong><br />
‣ Realistic timetables for implementing projects.<br />
The <strong>Parvin</strong> <strong>Branch</strong> <strong>and</strong> <strong>Tarkiln</strong> <strong>Branch</strong> Watershed Restoration Master Plan Project identifies <strong>and</strong><br />
prioritizes impaired riparian areas <strong>and</strong> recommends BMPs to improve the health <strong>and</strong> water quality of<br />
rivers, streams <strong>and</strong> lakes at the watershed level. This plan ranks NPS projects <strong>and</strong> provides costs<br />
associated with implementation of BMPs. The plan <strong>and</strong> recommendations will guide future restoration<br />
<strong>and</strong> planning efforts to best address impairments in the watershed.<br />
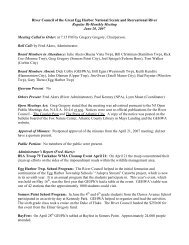
The <strong>Parvin</strong> & <strong>Tarkiln</strong> Watershed falls within Watershed Management Area (WMA) 17 <strong>and</strong> is a<br />
subwatershed of the Maurice River Watershed. WMA 17 consists of three major rivers: the Cohansey,<br />
Salem, <strong>and</strong> Maurice Rivers (Figure 1).
Figure 1. New Jersey’s Watershed<br />
Management Areas <strong>and</strong> WMA17<br />
8
II.<br />
WATERSHED CHARACTERIZATION<br />
A. Watershed Inventory<br />
1. Watershed Management Area 17<br />
WMA 17 is the largest watershed management area in New Jersey. It comprises 885 square<br />
miles <strong>and</strong> encompasses most of Cumberl<strong>and</strong> <strong>and</strong> Salem Counties <strong>and</strong> parts of Gloucester <strong>and</strong><br />
Atlantic Counties. WMA 17’s three major rivers, the Cohansey, Salem, <strong>and</strong> Maurice Rivers,<br />
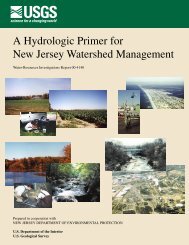
all drain to the Delaware River <strong>and</strong> Bay. <strong>Parvin</strong> <strong>Branch</strong> <strong>and</strong> <strong>Tarkiln</strong> <strong>Branch</strong> are tributaries to<br />
the Maurice River (Figure 2).<br />
9<br />
<strong>Parvin</strong> <strong>Subwatershed</strong>, HUC 14<br />
Figure 2. WMA 17, the Maurice River Watershed,<br />
<strong>and</strong> the <strong>Parvin</strong> & <strong>Tarkiln</strong> Watershed.
2. Maurice River Watershed<br />
10<br />
The Maurice River Watershed located in Cumberl<strong>and</strong> County is 386 square miles in<br />
size <strong>and</strong> approximately 50 miles in length. The Maurice River has five major tributaries:<br />
Scotl<strong>and</strong> Run, Manantico Creek, Muskee Creek, Muddy Run, <strong>and</strong> the Manumuskin River.<br />
Minor tributaries include White Marsh Run, Little Robin <strong>Branch</strong>, Blackwater <strong>Branch</strong>, Burnt<br />
Mill <strong>Branch</strong>, <strong>Parvin</strong> <strong>Branch</strong>, <strong>and</strong> <strong>Tarkiln</strong> <strong>Branch</strong>. The Maurice River Watershed also contains<br />
approximately 20 lakes, the largest of which is Union Lake in Millville, New Jersey. The<br />
primary l<strong>and</strong> use throughout this watershed is agriculture.<br />
3. <strong>Parvin</strong> <strong>Branch</strong> <strong>and</strong> <strong>Tarkiln</strong> <strong>Branch</strong> Watershed<br />
The <strong>Parvin</strong> & <strong>Tarkiln</strong> Watershed is 9 square miles in size. <strong>Tarkiln</strong> <strong>Branch</strong> is<br />
approximately 12,350 feet in length, <strong>and</strong> <strong>Parvin</strong> <strong>Branch</strong> (including its tributaries) is 30,000 feet<br />
in length. <strong>Tarkiln</strong> <strong>Branch</strong> converges with <strong>Parvin</strong> <strong>Branch</strong> upstream of the confluence of <strong>Parvin</strong><br />
<strong>Branch</strong> <strong>and</strong> the Maurice River.<br />
The <strong>Parvin</strong> & <strong>Tarkiln</strong> Watershed is located entirely within the City of Vinel<strong>and</strong>,<br />
Cumberl<strong>and</strong> County, New Jersey. The primary l<strong>and</strong> use in the watershed is urban<br />
development, but others include forests, wetl<strong>and</strong>s, <strong>and</strong> agriculture (Table 1).<br />
Table 1. <strong>Parvin</strong> & <strong>Tarkiln</strong> Watershed L<strong>and</strong> Use <strong>and</strong> Area a<br />
1995 L<strong>and</strong> Use Acres Square Miles % of Watershed<br />
Urban 3429.5 5.36 60.01<br />
Forest 1010.3 1.58 17.68<br />
Wetl<strong>and</strong>s 626.2 0.98 10.96<br />
Agriculture 566.6 0.89 9.92<br />
Barren L<strong>and</strong> 54.3 0.08 0.95<br />
Water 27.6 0.04 0.48<br />
Total 5714.5 8.93 100.00<br />
a) <strong>NJ</strong>DEP 1995/97 L<strong>and</strong> use/L<strong>and</strong> cover Update, Maurice, Salem <strong>and</strong> Cohansey Watershed Management Area,<br />
WMA 17.<br />
<strong>Parvin</strong> <strong>Branch</strong> <strong>and</strong> <strong>Tarkiln</strong> <strong>Branch</strong> are both classified by New Jersey Department of<br />
Environmental Protection (<strong>NJ</strong>DEP) as freshwater 2, non-trout/saline waters (FW2-NT/SE1).<br />
They are both considered to be Category 2 (C2) waters, which means they are not designated as<br />
outst<strong>and</strong>ing national resource waters or Category 1 (C1) waters for the purpose of<br />
implementing antidegradation policies. However, because parts of <strong>Parvin</strong> <strong>Branch</strong> <strong>and</strong> the<br />
<strong>Parvin</strong> & <strong>Tarkiln</strong> Watershed extend into the Union Lake Wildlife Management Area, <strong>Parvin</strong><br />
<strong>Branch</strong> <strong>and</strong> <strong>Tarkiln</strong> <strong>Branch</strong> are subject to the 300-foot buffer protection that applies to C1<br />
waters.<br />
<strong>NJ</strong>DEP evaluates biological <strong>and</strong> surface water quality data to determine the degree of<br />
impairment of waterbodies <strong>and</strong> to aid in the development of Total Maximum Daily Loads<br />
(TMDLs). To assess conditions in the <strong>Parvin</strong> & <strong>Tarkiln</strong> Watershed vicinity, <strong>NJ</strong>DEP uses two<br />
sampling stations that are part of its ambient biomonitoring network (AMNET) – stations<br />
AN0750 (<strong>Parvin</strong> <strong>Branch</strong> at Rt. 55 in Vinel<strong>and</strong>) <strong>and</strong> AN0751 (Maurice River at Sherman Ave.<br />
in Vinel<strong>and</strong>). <strong>NJ</strong>DEP classifies both stations as being in non-attainment for aquatic life.
B. GIS<br />
11<br />
Perhaps the most powerful aspect of this project was the integration of data into a<br />
Geographic Information System or GIS. With the information assembled in the GIS, project<br />
partners were able to present <strong>and</strong> summarize the assembled information, provide analyses aimed at<br />
identifying watershed restoration issues, <strong>and</strong> develop recommendations for implementation<br />
initiatives to correct real problems.<br />
The project partners identified <strong>and</strong> collected all available data for the watershed necessary<br />
to clearly describe the region, prepared a comprehensive analysis, <strong>and</strong> identified issues related to<br />
riparian areas. Specifically, we acquired existing data from various sources including GIS layers<br />
from the <strong>NJ</strong>DEP’s GIS database, <strong>NJ</strong>DEP aerial photographs, United States Geological Survey<br />
(USGS) quadrangles, USGS water quality data, Natural Resource Conservation Service (NRCS)<br />
Soils information, AMNET data, <strong>and</strong> County GIS datasets. Using ESRI’s ArcView GIS, the<br />
partners evaluated:<br />
‣ Watershed boundaries, streams, flood plains, major wetl<strong>and</strong> areas, municipal <strong>and</strong> county<br />
borders, <strong>and</strong> major roads;<br />
‣ L<strong>and</strong> use for the entire watershed;<br />
‣ Key open space areas;<br />
‣ Point source discharge locations;<br />
‣ Point source water quality <strong>and</strong> flow data from the last five years;<br />
‣ Available in-stream water quality <strong>and</strong> flow data collected over the last five years;<br />
‣ Biological survey monitoring locations <strong>and</strong> results;<br />
‣ Stream classifications; <strong>and</strong><br />
‣ Riparian corridor assessment data collected during the project.<br />
A comprehensive <strong>and</strong> user-friendly mapping system utilizing ArcView GIS to characterize<br />
the watershed has been developed. The GIS integrates mapping <strong>and</strong> various geographic data<br />
together in easy-to-underst<strong>and</strong> layers allowing for interpretation by the viewer.<br />
Figure 3
12<br />
III.<br />
WATERSHED ASSESSMENT<br />
A water quality monitoring plan was developed to gather additional physical, chemical, <strong>and</strong><br />
biological data to assess the health of the streams <strong>and</strong> identify impairments. The goal of the<br />
monitoring program was to identify likely impairment sources <strong>and</strong> then develop appropriate BMPs to<br />
address the causes, as the quality of existing data was not sufficient for BMP development. The<br />
monitoring program included: 1) macroinvertebrate sampling to assess the long-term health of the instream<br />
habitat; 2) chemical sampling to analyze short-term water quality; 3) a stream visual assessment<br />
protocol to help identify specific locations for future BMPs; <strong>and</strong> 4) h<strong>and</strong>-digging shallow wells to<br />
assess groundwater characteristics <strong>and</strong> gradients. Monitoring was performed under the guidance of a<br />
Quality Assurance/Quality Control (QA/QC) plan that was developed for the program.<br />
The primary goals of the study were to: 1) obtain current water quality data for comparison to<br />
existing <strong>and</strong> historical data; 2) assess water quality in <strong>Parvin</strong> <strong>Branch</strong>, <strong>Tarkiln</strong> <strong>Branch</strong>, <strong>and</strong> groundwater<br />
resources; <strong>and</strong> 3) identify the source of any detected impairments in order to develop BMPs to protect<br />
<strong>and</strong> improve water quality. A secondary goal was to determine the source of the reduced iron entering<br />
the stream via the shallow groundwater, resulting in orange precipitate <strong>and</strong> iron bacteria activity.<br />
The watershed was divided into 22 separate reaches, <strong>and</strong> volunteers were trained in the Stream<br />
Visual Assessment Protocol (SVAP). All the reaches were inspected, photographed, <strong>and</strong> assessed.<br />
All stormwater outfalls were identified for conditions <strong>and</strong> locations. The SVAP data collected,<br />
combined with the <strong>Parvin</strong> & <strong>Tarkiln</strong> Watershed Restoration Master Plan, provides the direction <strong>and</strong><br />
methodology to gather additional information of the physical conditions of the waterways needed to<br />
combine various data layers to prioritize specific projects for future implementation.<br />
A. Sampling Stations<br />
A total of three stream water column sampling stations (PB1, PB2, <strong>and</strong> TB1), two soil<br />
sampling stations (SEDN <strong>and</strong> SEDS), <strong>and</strong> two groundwater sampling stations (GWN <strong>and</strong> GWS)<br />
were established for this study (Appendix E). Each sampling station location was confirmed in the<br />
field with global positioning system (GPS) <strong>and</strong> marked with plastic flagging identifying the site<br />
<strong>and</strong> attached to an adjacent tree. The sampling sites <strong>and</strong> their locations are described in Table 2<br />
below.<br />
Table 2. <strong>Parvin</strong> & <strong>Tarkiln</strong> Watershed Sample Stations<br />
Site ID Site Name Location Latitude Longitude<br />
PB1 <strong>Parvin</strong> <strong>Branch</strong> <strong>Parvin</strong> <strong>Branch</strong> at South Orchard 335621.17 228834.98<br />
Road<br />
PB2 <strong>Parvin</strong> <strong>Branch</strong> <strong>Parvin</strong> <strong>Branch</strong> above confluence 330557.51 224913.65<br />
with Maurice River<br />
TB1 <strong>Tarkiln</strong> <strong>Branch</strong> <strong>Tarkiln</strong> <strong>Branch</strong> at South Orchard 335823.26 231297.04<br />
Road<br />
SEDN <strong>Parvin</strong> <strong>Branch</strong>, North Bank 433 yards east of Route 55 332502.56 228209.29<br />
(Sediment Station)<br />
SEDS <strong>Parvin</strong> <strong>Branch</strong>, South Bank 366 yards east of Route 55 332608.00 227673.74<br />
(Sediment Station)<br />
GWN <strong>Parvin</strong> <strong>Branch</strong>, North Bank 433 yards east of Route 55 332502.56 228209.29<br />
(Groundwater Station)<br />
GWS <strong>Parvin</strong> <strong>Branch</strong>, South Bank<br />
(Groundwater Station)<br />
366 yards east of Route 55 332608.00 227673.74
13<br />
1. PB1 (<strong>Parvin</strong> <strong>Branch</strong> at South Orchard Road)<br />
Site location is just upstream from South Orchard Road, which is a paved road with a<br />
concrete bridge. <strong>Parvin</strong> <strong>Branch</strong> is a second order stream at the sampling site with an altered<br />
stream channel 25 feet wide, situated between deciduous wooded wetl<strong>and</strong>s 100 feet or more<br />
wide on both sides. This location is about 2,400 feet upstream from the confluence with the<br />
<strong>Tarkiln</strong> <strong>Branch</strong>, <strong>and</strong> down stream from approximately 4 miles of second order stream <strong>and</strong> first<br />
order tributaries. Wetl<strong>and</strong>s, agriculture, <strong>and</strong> urban l<strong>and</strong> use with substantial impervious<br />
surfaces can be found upstream.<br />
The active channel depth is about 1 foot or less, <strong>and</strong> the bank full height is about 2.5<br />
feet with some near vertical bank slopes. The dominant substrate includes s<strong>and</strong>, silt <strong>and</strong> mud,<br />
<strong>and</strong> significant aquatic vegetation can be found in the water column. The water column is<br />
generally clear, with no orange particulates evident in the water or embedded in the substrate.<br />
The stream is connected to the deciduous wooded wetl<strong>and</strong> flood plain with low,<br />
moderately stable, well vegetated vertical banks. Shelter for aquatic life <strong>and</strong> pool substrate <strong>and</strong><br />
variability are suboptimal <strong>and</strong>/or marginal, with 50-80% of the stream affected by extensive<br />
sediment deposition. The channel has been straightened <strong>and</strong> altered to convey stormwater with<br />
little sinuosity, but there was no evidence of recent alteration <strong>and</strong> the existing vegetative<br />
protection of the bank was almost optimal.<br />
2. PB2 (<strong>Parvin</strong> <strong>Branch</strong> above confluence with Maurice River)<br />
This site is located at the bottom of the <strong>Parvin</strong> <strong>Branch</strong> HUC 14 about 300 ft upstream<br />
from the Maurice River. Over 8 miles of first <strong>and</strong> second order streams drain about 5700 acres<br />
(9 square miles) of mixed l<strong>and</strong> uses, mostly urban, past this site. Deciduous wooded wetl<strong>and</strong>s<br />
<strong>and</strong> forest extend for over 1000 feet on both sides of the stream, which is 14 feet wide at the<br />
sampling location.<br />
The active channel depth is about 1 foot or less, <strong>and</strong> the bank full height is about 3.0<br />
feet with some unusual braided connections to the flood plain. The channel downstream from<br />
the site was altered in the distant past causing marginal sinuosity, but upstream sinuosity is<br />
more natural. The dominant substrate includes gravel, s<strong>and</strong>, silt/mud, in roughly equal<br />
proportions.<br />
Channel flow, bank vegetative protection, <strong>and</strong> the riparian vegetative zone width are<br />
optimal with the exception of extensive invasive species. But the conditions of the banks are<br />
moderately unstable even with substantial vegetative protection, indicating a potential for<br />
“flashing” or high velocity flows.<br />
Shelter for fish <strong>and</strong> macroinvertebrates, pool substrate, <strong>and</strong> pool variability are extant<br />
but suboptimal. The in-stream habitat types are varied, including gravel bars, undercut banks,<br />
large woody debris, <strong>and</strong> silt imbedded areas. This location is strongly influenced by the iron<br />
water phenomena, <strong>and</strong> all in-stream objects have a significant degree of iron floc<br />
embeddedness. Any disturbance to the substrate creates a “cloud” of fine orange particles<br />
within the water column. There is no significant aquatic vegetation present, but some small<br />
amounts do occur at the shallow waters edge.
3. TB1 (<strong>Tarkiln</strong> <strong>Branch</strong> at South Orchard Road)<br />
14<br />
Site location is just upstream from South Orchard Road, which is a paved road with a<br />
concrete culvert. <strong>Tarkiln</strong> <strong>Branch</strong> is a first order stream at the sampling site with an altered<br />
stream channel 16 feet wide, situated in a 50% crown cover deciduous forest extending from<br />
100 feet to more than 300 feet on both sides. This location is about 3400 feet upstream from<br />
the confluence with the <strong>Parvin</strong> <strong>Branch</strong>, <strong>and</strong> down stream from approximately 1.7 miles of first<br />
order stream with no tributaries. The <strong>Tarkiln</strong> <strong>Branch</strong> drains a large urban area of the City of<br />
Vinel<strong>and</strong> with a high percentage of impervious surfaces <strong>and</strong> substantial stormwater discharge.<br />
The active channel depth is about 1 foot or less, <strong>and</strong> the bank full height is 3 to 4 feet or<br />
higher with some near vertical bank slopes. The dominant substrate includes s<strong>and</strong>, silt <strong>and</strong> mud,<br />
<strong>and</strong> more than 80% of the stream bottom is affected by extensive sediment deposition including<br />
mid-stream s<strong>and</strong> bars. The water column is generally clear, with no orange particulates evident<br />
in the water or imbedded in the substrate.<br />
The stream is disconnected from its flood plain with moderately unstable, well<br />
vegetated, vertical banks. Shelter for aquatic life <strong>and</strong> pool substrate <strong>and</strong> variability are<br />
marginal, <strong>and</strong> there is very little water in the channel with mostly deep st<strong>and</strong>ing pools separated<br />
by s<strong>and</strong> bars. The channel has been straightened <strong>and</strong> altered to convey stormwater with little<br />
sinuosity, <strong>and</strong> active erosion <strong>and</strong> down cutting could be observed. A very large debris dam is<br />
located just down stream from the site in a st<strong>and</strong>ing pool, which is indicative of stormwater<br />
flash flooding.<br />
4. SEDN (<strong>Parvin</strong> <strong>Branch</strong>, North Bank 100 yards east of Route 55)<br />
This site has a dual use for both sediment profiling <strong>and</strong> groundwater sampling. It is<br />
located 1300 feet east of Route 55 on the edge of forested wetl<strong>and</strong>s 200 feet from the L<strong>and</strong>is<br />
Sewerage Authority’s infiltration beds, 340 feet from the main stem of <strong>Parvin</strong> <strong>Branch</strong>, <strong>and</strong> 100<br />
feet up gradient from a flowing braid from <strong>Parvin</strong> <strong>Branch</strong>. There is a slight hill at this location,<br />
<strong>and</strong> the sampling site is on the southwest side of this hill close to the flood plain. This site is on<br />
the same side of the creek as the infiltration beds.<br />
5. SEDS (<strong>Parvin</strong> <strong>Branch</strong>, South Bank 100 yards east of Route 55)<br />
This site has a dual use for both sediment profiling <strong>and</strong> groundwater sampling. It is<br />
located 1100 feet east of Route 55 in a large patch of deciduous forested wetl<strong>and</strong>s flood plain<br />
700 feet from the L<strong>and</strong>is Sewerage Authority’s infiltration beds, 130 feet from the main stem of<br />
<strong>Parvin</strong> <strong>Branch</strong>, <strong>and</strong> 50 feet from a small braid from <strong>Parvin</strong> <strong>Branch</strong>. The topography is flat<br />
wetl<strong>and</strong>s with significant down cutting visible on the nearby stream segments. This site is<br />
located on the opposite bank from the infiltration beds.<br />
6. GWN (<strong>Parvin</strong> <strong>Branch</strong>, North Bank 100 yards east of Route 55)<br />
This site has a dual use for both sediment profiling <strong>and</strong> groundwater sampling. It is<br />
located 1300 feet east of Route 55 on the edge of forested wetl<strong>and</strong>s 200 feet from the L<strong>and</strong>is<br />
Sewerage Authority’s infiltration beds, 340 feet from the main stem of <strong>Parvin</strong> <strong>Branch</strong>, <strong>and</strong> 100<br />
feet up gradient from a flowing braid from <strong>Parvin</strong> <strong>Branch</strong>. There is a slight hill at this<br />
location, <strong>and</strong> the sampling site is on the southwest side of this hill close to the flood plain. This<br />
site is on the same side of the creek as the infiltration beds.
15<br />
7. GWS ( <strong>Parvin</strong> <strong>Branch</strong>, South Bank 100 yards east of Route 55)<br />
This site has a dual use for both sediment profiling <strong>and</strong> groundwater sampling. It is<br />
located 1100 feet east of Route 55 in a large patch of deciduous forested wetl<strong>and</strong>s flood plain<br />
700 feet from the L<strong>and</strong>is Sewerage Authority’s infiltration beds, 130 feet from the main stem of<br />
<strong>Parvin</strong> <strong>Branch</strong>, <strong>and</strong> 50 feet from a small braid from <strong>Parvin</strong> <strong>Branch</strong>. The topography is flat<br />
wetl<strong>and</strong>s with significant down cutting visible on the nearby stream segments. This site is<br />
located on the opposite bank from the infiltration beds.<br />
B. Stream Visual Assessment Protocol<br />
To assess riparian areas, a methodology based on the United States Department of<br />
Agriculture (USDA) “Stream Visual Assessment Protocol” (SVAP) was developed to provide for a<br />
rapid, systematic, quantitative assessment of riparian area conditions. A copy of this protocol is<br />
provided in Appendix H.<br />
1. Methods<br />
a. USDA SVAP<br />
The USDA Stream Visual Assessment Protocol provides a basic level of stream health<br />
evaluation. Conservation-minded citizens with little biological or hydrological training can<br />
successfully apply it for watershed assessment. The SVAP is the first level in a hierarchy of<br />
ecological assessment protocols established by the USDA <strong>and</strong> available in the Stream Ecological<br />
Assessment Field H<strong>and</strong>book.<br />
This protocol provides a reconnaissance level assessment based primarily on physical<br />
conditions within the assessment area. It may not detect some resource problems caused by factors<br />
located beyond the area being assessed. The use of higher tier methods (such as ambient<br />
biomonitoring) is required to more fully assess the ecological condition <strong>and</strong> to detect problems<br />
originating elsewhere in the watershed.<br />
The protocol ranks conditions for several elements using a scoring system from 1 (worst) to<br />
10 (best) for most parameters. The protocol clearly illustrates what type of conditions should<br />
receive which score, <strong>and</strong> all scores are then averaged to determine a final assessment of the overall<br />
condition of the stream. Below are the elements that are scored in the assessment process:<br />
‣ Channel Conditions: natural <strong>and</strong> stable vs. channelized <strong>and</strong>/or eroding.<br />
‣ Hydrologic Alteration: stream can access floodplain vs. incised/structured<br />
condition.<br />
‣ Riparian Zone: wide vegetated buffer vs. narrow, disturbed vegetated buffer.<br />
‣ Bank Stability: low, stable banks vs. actively eroding, failing banks.<br />
‣ Water Appearance: clear vs. turbid or muddy water appearance.<br />
‣ Nutrient Enrichment: clear water with diverse aquatic community vs. greenish<br />
water with dense macrophytic vegetation.<br />
‣ Barriers to Fish Movement: no barriers vs. dams, culverts or other structures.<br />
‣ In-stream Fish Cover: diverse cover (logs, boulders, pools, riffles, overhanging<br />
vegetation, etc.) vs. no cover.<br />
‣ Invertebrate Habitat: clean water with gravel/organic substrate vs. cloudy water<br />
with sediment-laden substrate.
16<br />
The scoring ranges used for assessment are as follows:<br />
< 6.0 Poor<br />
6.1 - 7.4 Fair<br />
7.5 - 8.9 Good<br />
> 9.0 Excellent<br />
In addition to completing the assessment protocol, the existing conditions were<br />
documented using photographs. An extensive library of photographs is contained in the<br />
reports attached to this document.<br />
b. Modified SVAP<br />
In order to create a more appropriate protocol to assess property conditions found in<br />
<strong>Parvin</strong> & <strong>Tarkiln</strong> Watershed, SVAP had to be adapted. Several items were added to the<br />
protocol to better indicate potential NPS pollution issues from developing <strong>and</strong> developed<br />
areas typical of New Jersey communities. The existing protocol was amended to include<br />
information such as GPS coordinates of the site, site ownership (public or private), l<strong>and</strong><br />
use, potential NPS sources, <strong>and</strong> BMP recommendations. These modifications afforded a<br />
more detailed <strong>and</strong> regionally specific assessment. A copy of the modified survey form is<br />
included in Appendix H.<br />
c. SVAP Surveys<br />
Next, a work plan was developed for conducting a comprehensive survey of the<br />
riparian areas in <strong>Parvin</strong> & <strong>Tarkiln</strong> Watershed. Aerial photographs, USGS topographic<br />
maps, soils data, <strong>and</strong> l<strong>and</strong> use maps were examined to plan the best survey routes <strong>and</strong> to<br />
identify initial areas of concern. The watershed was divided into smaller, manageable subwatersheds,<br />
<strong>and</strong> groups of volunteers were trained <strong>and</strong> assigned to conduct surveys of each<br />
of these sub-watersheds. The concept was to design an assessment program that uses local<br />
knowledge of the watershed combined with professional expertise in watershed planning<br />
<strong>and</strong> science.<br />
Using the protocol, impaired reaches were classified as to their degree of<br />
degradation in terms of bank erosion, bank stability, lack of vegetative buffer, health of fish<br />
habitat, etc., as well as obvious impacts from NPS pollution. Sites were photo-documented,<br />
<strong>and</strong> GPS coordinates were taken for each surveyed site. All the survey information for each<br />
site was entered into a MS Access <strong>and</strong> GIS database of the watershed. The database<br />
includes information about the following:<br />
‣ L<strong>and</strong> use,<br />
‣ Slopes,<br />
‣ Vegetation,<br />
‣ Wetl<strong>and</strong>s,<br />
‣ Stormwater discharge points,<br />
‣ Potential pollution sources, <strong>and</strong><br />
‣ Known recreational areas.
17<br />
The area of assessment included a 100-foot-wide buffer along both sides of the<br />
waterways. Once completed, the surveys provided up-to-date information on existing conditions<br />
<strong>and</strong> provided for a more detailed study of critical areas. Particular attention was paid to <strong>NJ</strong>DEP’s<br />
AMNET sites <strong>and</strong> identifying the causes of the impairments found at these sites.<br />
Two training sessions were held to train volunteers in the SVAP protocol, however <strong>NJ</strong>DEP<br />
requested that no assessments be conducted or data collected before the QAPP was approved. The<br />
length of the approval process resulted in some lost momentum on the part of the volunteer base.<br />
The resulting QAPP required a Tier C or D assessment so extra training was provided to the<br />
primary CU coordinator who ended up doing the data collections virtually single h<strong>and</strong>edly.<br />
While waiting for QAPP approval, several stream cleanup events were held <strong>and</strong> large<br />
quantities of debris were collected from various areas within the watershed by various Boy Scout<br />
Troops. Also, several “stream walk” surveys were conducted to identify issues such as improper<br />
trash h<strong>and</strong>ling near the stream corridor.<br />
2. Results<br />
Using the approved protocol, all stream reaches in the watershed were field surveyed <strong>and</strong><br />
photographed. Data was collected through the SVAP forms <strong>and</strong> pictures <strong>and</strong> linked to the GIS.<br />
Each stream reach characterized below represents approximately 2000 linear feet of stream <strong>and</strong><br />
each was evaluated as to adjacent l<strong>and</strong> uses, environmental features, stormwater outlets, <strong>and</strong> other<br />
unique features with significance regarding watershed impairments.<br />
a. <strong>Parvin</strong>-<strong>Tarkiln</strong> Main <strong>Branch</strong> Reaches (M1 through M3)<br />
The field surveys on the Main <strong>Branch</strong> occurred during two separate periods.<br />
Reaches M1 <strong>and</strong> M2 were surveyed in April 2005. Reach M1 is characterized as a<br />
historically channelized stream until it empties into an impounded area creating a pond.<br />
Below the pond, the stream becomes a braided channel <strong>and</strong> is closely connected with<br />
adjacent floodplain <strong>and</strong> wetl<strong>and</strong> areas. Downstream in the M2 reach, the stream again<br />
becomes channelized with visible entrenchment <strong>and</strong> eroding undercut banks limiting access<br />
to the floodplain for the stream.<br />
The survey of the M3 reach occurred in May 2004 <strong>and</strong> indicates that the<br />
channelized stream bed has begun to me<strong>and</strong>er <strong>and</strong> reconnect with adjacent floodplain <strong>and</strong><br />
wetl<strong>and</strong>s areas. Impacts to streambed stability due to flashy stormwater flows were noted.<br />
Throughout the reaches of the Main <strong>Branch</strong>, issues of flashy stormwater flows<br />
eroding <strong>and</strong> destabilizing the stream bed <strong>and</strong> channel were noted <strong>and</strong> concerns regarding<br />
water quality due to the visible iron flocculation <strong>and</strong> deposition were raised. Further details<br />
<strong>and</strong> photographs of conditions are contained in the <strong>Parvin</strong>-<strong>Tarkiln</strong> Main <strong>Branch</strong> Reach<br />
Report in Appendix A.<br />
b. <strong>Tarkiln</strong> <strong>Branch</strong> Reaches (T1 through T6)<br />
The <strong>Tarkiln</strong> stream reaches were surveyed multiple times over the course of three<br />
years beginning in May 2003 <strong>and</strong> ending in April 2005. This stream flows westerly nearly<br />
two miles from the community of Vinel<strong>and</strong> until it joins with the <strong>Parvin</strong> <strong>Branch</strong>. In its<br />
most upstream reaches (identified as T1 <strong>and</strong> T2) the <strong>Tarkiln</strong> <strong>Branch</strong> serves solely as a<br />
channelized stormwater conveyance with little base flow <strong>and</strong> multiple stormwater
18<br />
discharges <strong>and</strong> crossings within its urban setting. Once the stream flows through the<br />
culvert crossing at West Avenue in Vinel<strong>and</strong>, while still showing signs of a channelized<br />
stormwater conveyance, becomes connected to large areas of forested floodplain wetl<strong>and</strong>s.<br />
Segments of the stream allow for connection to these adjacent flood plain wetl<strong>and</strong>s while<br />
other segments exhibit signs of entrenchment <strong>and</strong> continue to be impacted by significant<br />
stormwater discharges.<br />
Major concerns in the <strong>Tarkiln</strong> <strong>Branch</strong> were noted regarding the need for removing<br />
<strong>and</strong> minimizing trash, debris <strong>and</strong> floatables as well as reconnecting the stream to floodplain<br />
wetl<strong>and</strong>s to improve water quality, flood plain storage, <strong>and</strong> groundwater recharge. Further<br />
details <strong>and</strong> photographs of conditions are contained in the <strong>Tarkiln</strong> <strong>Branch</strong> Reach Report in<br />
Appendix B.<br />
c. <strong>Parvin</strong> <strong>Branch</strong> Reaches (P1 through P13) Surveys<br />
The <strong>Parvin</strong> <strong>Branch</strong> reaches were surveyed multiple periods beginning in May 2004<br />
<strong>and</strong> ending in November 2006. This stream flows westerly nearly three miles from the<br />
community of Vinel<strong>and</strong> until it joins with the <strong>Tarkiln</strong> <strong>Branch</strong>. In its most upstream reaches<br />
(identified as P1 <strong>and</strong> P2) the <strong>Parvin</strong> <strong>Branch</strong> serves as a stormwater conveyance with little<br />
base flow <strong>and</strong> multiple stormwater discharges <strong>and</strong> crossings within its urban setting.<br />
Adjacent areas of undeveloped wooded wetl<strong>and</strong>s remain along portions of the stream, but<br />
the entrenched channel does not allow for connections to the adjacent flood plain areas.<br />
Numerous stormwater discharges were identified along with encroaching areas of<br />
development <strong>and</strong> large quantities of trash <strong>and</strong> debris. Little or no base flow was evident.<br />
As the <strong>Parvin</strong> <strong>Branch</strong> transitions from its urban headwaters into reaches P3 through<br />
P5, the channelized stream begins to me<strong>and</strong>er <strong>and</strong> at points reconnects to adjacent<br />
floodplain <strong>and</strong> wetl<strong>and</strong> areas. In addition, l<strong>and</strong> use near the stream begins to include<br />
agricultural l<strong>and</strong>s that sheet flow directly into floodplain areas. Woody debris<br />
accumulation is visible within the channel <strong>and</strong> base flows in the stream become evident.<br />
The stream then flows through 3 large box culverts beneath West Boulevard into the<br />
next set of reaches P6 through P10. This segment of the <strong>Parvin</strong> <strong>Branch</strong> flows through<br />
extensive forested floodplain wetl<strong>and</strong>s, but is impacted by multiple stormwater discharges<br />
from nearby industrial facilities through open ditches <strong>and</strong> a shallow pond. To the north of<br />
the stream, extensive agricultural fields direct surface runoff into floodplain <strong>and</strong> stream.<br />
Much of stream remains channelized <strong>and</strong> is disconnected from adjacent floodplain storage<br />
areas.<br />
As the stream flows into the final reaches (P11 through P13), the channel widens<br />
<strong>and</strong> has established floodplain benches <strong>and</strong> visible evidence of frequent connections to<br />
adjacent floodplain wetl<strong>and</strong>s <strong>and</strong> storage areas were observed. The channel begins to<br />
me<strong>and</strong>er through extensive floodplain wetl<strong>and</strong>s <strong>and</strong> as it nears its confluence with the<br />
<strong>Tarkiln</strong> <strong>Branch</strong>, steady base flows provide for aquatic habitat throughout the reach.<br />
Primary concerns for the <strong>Parvin</strong> <strong>Branch</strong> include stabilization of stormwater outlets<br />
discharging directly to the stream, large contributions of trash <strong>and</strong> debris, <strong>and</strong> impacts of<br />
agricultural activities in adjacent floodplain <strong>and</strong> wetl<strong>and</strong>s areas. Further details <strong>and</strong><br />
photographs of conditions are contained in the <strong>Parvin</strong> <strong>Branch</strong> Reach Report in Appendix<br />
C.
19<br />
3. Stormwater Outlet Identification/Mapping<br />
While conducting the SVAP analyses, GPS locations of stormwater outlets <strong>and</strong> a<br />
photographic inventory were completed. The data is contained in the GIS <strong>and</strong> includes GPS<br />
Point Files, <strong>and</strong> GPS Point Pictures. The GPS Point files contain an ArcView shapefile (<strong>NJ</strong><br />
State Plane projection) of the XY coordinates <strong>and</strong> physical attributes on the stream reach which<br />
includes stormwater outlet coordinates. The GPS Point Picture files contains digital<br />
photographs of those XY attributes (including pictures of stormwater outlets) with the .jpg file<br />
name of the photograph referenced to the identification number of each point in the shape file.<br />
C. Chemical Evaluation<br />
1. Existing Data<br />
TRC Omni <strong>and</strong> Citizens United obtained existing hydrologic <strong>and</strong> water quality data for<br />
the watershed from a number of resources including USGS, USEPA, <strong>and</strong> <strong>NJ</strong>DEP databases <strong>and</strong><br />
local stakeholders (e.g. L<strong>and</strong>is Sewerage Authority (LSA) <strong>and</strong> Cumberl<strong>and</strong> County College).<br />
Data was reviewed <strong>and</strong> incorporated into the <strong>Parvin</strong> & <strong>Tarkiln</strong> Watershed GIS. Analysis of the<br />
existing data included converting the data into electronic formats, completing a QA/QC review,<br />
<strong>and</strong> actually analyzing the data to identify trends <strong>and</strong>/or areas of concern. Existing data can be<br />
used both to determine current water quality <strong>and</strong> to establish a historical baseline against which<br />
to compare data collected during this new study.<br />
2. Watershed Sampling<br />
A monitoring plan was developed to gather surface water (<strong>Parvin</strong> <strong>Branch</strong> <strong>and</strong> <strong>Tarkiln</strong><br />
<strong>Branch</strong>) <strong>and</strong> groundwater quality data. The monitoring plan included <strong>NJ</strong>DEP-approved<br />
sampling protocols for collecting physical <strong>and</strong> chemical data in these resources. Appropriate<br />
protocols, sampling points, <strong>and</strong> schedules were selected for both wet weather (stormwater) <strong>and</strong><br />
dry weather (base flow) sampling. Chemical analyses were completed by <strong>NJ</strong>DEP-certified<br />
laboratories as well as by volunteers using field sampling kits. Local volunteer groups were<br />
instrumental in completing the physical <strong>and</strong> chemical assessments of the stream, including<br />
visual assessments of flow.<br />
Surface water, groundwater <strong>and</strong> sediment sampling occurred at <strong>Parvin</strong> <strong>Branch</strong> <strong>and</strong><br />
<strong>Tarkiln</strong> <strong>Branch</strong> from May 2005 to April 2006. During this time, Citizens United to Protect the<br />
Maurice River <strong>and</strong> its tributaries (CUPMRT) <strong>and</strong> TRC Omni collected eleven (11) sets of<br />
surface water samples at the three chemical <strong>and</strong> biological stations, PB1, PB2 <strong>and</strong> TB1, one (1)<br />
set of sediment samples from SEDS <strong>and</strong> SSN <strong>and</strong> three (3) sets of groundwater samples at<br />
monitoring wells GWN <strong>and</strong> GWS. In addition to this sample collection, CUPMRT performed<br />
some further in-situ measurements, including at reference sites on the Maurice River at<br />
Sherman <strong>and</strong> Almond Aves. (MS & MA). Table 3 details the sampling schedule.
Table 3: <strong>Parvin</strong> <strong>Branch</strong> <strong>and</strong> <strong>Tarkiln</strong> <strong>Branch</strong> Sampling Schedule<br />
20<br />
Date Sites In-situ Laboratory Data<br />
Data<br />
4/27/05 SEDN, SEDS Soil<br />
5/26/05 PB2, PB1, TB1 Yes Surface Water (dry)<br />
6/09/05 PB2, PB1, TB1 Yes Macroinvertebrates<br />
6/24/05 PB2, PB1, TB1, MS Yes Surface Water (dry)<br />
7/27/05 PB2, PB1, TB1, MS Yes Surface Water (dry)<br />
8/23/05 PB2, PB1, TB1, MS Yes Surface Water (dry)<br />
9/05/05 PB2, PB1, TB1, MS Yes Macroinvertebrates<br />
9/14/05 GWN, GWS Yes Groundwater<br />
9/23/05 PB2, MS, MA Yes None<br />
9/28/05 PB2, PB1, TB1, MS Yes Surface Water (marginal dry)<br />
9/29/05 PB2 Yes None<br />
11/14/05 PB2, PB1, TB1, MS, Yes Surface Water (dry)<br />
MA<br />
12/05/05 PB2, PB1, TB1, MS, Yes Surface Water (dry)<br />
MA<br />
12/22/05 GWN, GWS Yes Groundwater<br />
1/10/06 PB2, PB1, TB1, MS, Yes Surface Water (dry)<br />
MA<br />
2/16/06 PB2, PB1, TB1, MS, Yes Surface Water (dry)<br />
MA<br />
4/03/06 PB2, PB1, TB1, MS, Yes Surface Water (dry)<br />
MA<br />
4/24/06 PB2, PB1, TB1, MS, Yes Surface Water (marginal wet)<br />
MA<br />
5/30/06 MS, MA Yes None<br />
Chemical <strong>and</strong> biological sampling occurred at <strong>Parvin</strong> <strong>Branch</strong> <strong>and</strong> <strong>Tarkiln</strong> <strong>Branch</strong><br />
approximately once per month from May 26, 2005 to April 24, 2006. Eleven (11) sets of<br />
samples were collected in dry <strong>and</strong> wet weather conditions. Sites PB1 <strong>and</strong> TB1 are located<br />
upstream of the confluence of the <strong>Parvin</strong> <strong>Branch</strong> <strong>and</strong> <strong>Tarkiln</strong> Brook <strong>and</strong> were chosen to<br />
characterize the conditions immediately upstream of the area of concern. Station PB2 is<br />
located near the downstream end of the spatial extent immediately prior to the confluence of<br />
<strong>Parvin</strong> <strong>Branch</strong> <strong>and</strong> the Maurice River. Appendix I contains the QAPP which includes a map<br />
that shows the locations of the chemical <strong>and</strong> biological sampling stations. Timing <strong>and</strong> budget<br />
constraints made it difficult to complete all of the sampling described within the sampling plan,<br />
but every effort was made to execute as many events as possible that met the event type<br />
constraints.<br />
Nine (9) dry weather sample collection events were performed in accordance with the<br />
sampling plan when precipitation was less than 0.1 inches in the 72 hours prior to the event.<br />
One (1) sample collection event on September 28, 2005 was performed during marginal dry<br />
weather. Table 4 presents the dry weather events <strong>and</strong> corresponding precipitation <strong>and</strong> flow<br />
conditions. Precipitation <strong>and</strong> weather data was retrieved from the weather station at the<br />
Millville Airport from the wunderground website:<br />
(http://www.wunderground.com/history/airport/KMIV/).
Table 4. Dry weather sampling events<br />
21<br />
Date<br />
Cumulative 72 hour<br />
Precipitation (inches)<br />
Flow<br />
Description<br />
05/26/05 0.04 Medium<br />
06/24/05 0.00 Medium-Low<br />
07/27/05 0.13 Medium-Low<br />
08/23/05 0.00 Medium-Low<br />
9/28/05 0.38 Medium-Low<br />
11/14/05 0.00 Medium-Low<br />
12/05/05 0.00 Medium-Low<br />
01/10/06 0.00 Medium-Low<br />
02/16/06 0.00 Medium-Low<br />
04/03/06 0.03 Medium-Low<br />
Additionally, one marginal wet weather collection event was conducted on April 24,<br />
2006. During the 72 hours prior to this event, there was a cumulative rainfall of 1.13 inches.<br />
Most of this rainfall occurred on April 22, 2006, one day before samples were collected. Due<br />
to timing <strong>and</strong> feasibility issues, it was impossible to obtain a true wet weather event in<br />
accordance with the sampling plan.<br />
Citizens United preformed all the in-situ measurements for stream flow, pH, temperature,<br />
DO, specific conductance, <strong>and</strong> redox. Instrumentation used to perform in-situ measurements<br />
was properly calibrated in conformance with manufacture’s instructions, <strong>NJ</strong>DEP field sampling<br />
procedures, <strong>and</strong> EPA -B-97-003. This included the calibration of equipment before every<br />
sampling event <strong>and</strong> the disposal of all buffers after each calibration session. 13 sets of signed<br />
Chain of Custody documents were executed on the sample collection dates <strong>and</strong> are on file. All<br />
sampling containers were furnished by <strong>NJ</strong>AL. (See Appendix G for In-Situ data).<br />
Flow was measured as a visual assessment at the time of sampling for sites PB2, PB1,<br />
<strong>and</strong> TB1, using a scale of Low, Medium, or High. A staff gage was installed at PB2 <strong>and</strong> stage<br />
measurements were measured <strong>and</strong> recorded at this site. A USGS staff gage at the Sherman Ave<br />
site (MS) was read <strong>and</strong> recorded at the beginning of 10 QAPP sampling events, excluding the<br />
first sampling on April 24, 2005. There is a USGS Real Time flow gage at Almond Ave. (site<br />
MA). The online data for this site was not researched <strong>and</strong> recorded as part of the QAPP, but it<br />
is archived <strong>and</strong> available to the public by date online from the USGS at<br />
http://waterdata.usgs.gov/nj/nwis/uv?01411500. The flow data collected by Citizens United is<br />
shown in Table 5.<br />
pH <strong>and</strong> temperature were measured using an automatic temperature compensating,<br />
double junction, Oakton pH Testr 30 with a range of -1.00 to 15.00 pH, a resolution of 0.01 pH,<br />
<strong>and</strong> a relative accuracy of 0.01 pH. Calibration point buffers used for each sampling event<br />
were 4.01 pH <strong>and</strong> 7.0 pH. All buffers were used once for calibration <strong>and</strong> then disposed. For<br />
additional reference a LaMotte 1766 pH Tracer was calibrated <strong>and</strong> used in the field<br />
simultaneously with the Testr 30, <strong>and</strong> these measurements were recorded in the field log but<br />
not submitted as project data. pH data is summarized in Table 6.
22<br />
Table 5. In-Situ Flow Data<br />
Date PB2 PB1 TB1 MS<br />
Flow Stage Inches Flow Flow Stage Inches<br />
5/26/05 M 9 M M NR<br />
6/09/05 M NR M M NR<br />
6/24/05 M-L 6.5 M-L L 4.48<br />
7/27/05 M 5.5 L M-L 5.56<br />
8/23/05 M 5.0 L L- 5.30<br />
9/05/05 M 5.5 L- L- 5.20<br />
9/23/05 M 4.75 NR NR NR<br />
9/28/05 M 4.75 L- No Flow 5.15<br />
9/29/05 M NR NR NR NR<br />
11/14/05 M 6.75 M L 5.60<br />
12/05/05 M 10.5 M L+ 6.38<br />
1/10/06 M 9.5 M-L L 6.30<br />
2/16/06 M 10.5 M L 6.32<br />
4/03/05 M 5.5 M L-M 5.74<br />
4/24/06 M-H 12.25 M-H L-M 6.36<br />
5/30/06 NR NR NR NR 5.56<br />
Table 6. In-Situ pH<br />
Date PB2 -pH PB1-pH TB1-pH MS-pH MA-pH<br />
5/26/05 6.90 6.00 6.00<br />
6/09/05 6.10 6.40 6.40<br />
6/24/05 6.70 6.80 6.40 6.70<br />
7/27/05 6.30 6.00 6.00 6.00<br />
8/23/05 6.60 6.30 6.10 6.48<br />
9/05/05 6.80 6.30 6.30 6.58<br />
9/23/05 6.70 6.69 6.64<br />
9/28/05 6.53 6.00 dry 6.73<br />
9/29/05 6.50<br />
11/14/05 6.99 6.36 6.09 6.60 6.54<br />
12/05/05 6.85 6.34 6.11 6.39 6.28<br />
1/10/06 6.77 6.22 5.98 6.54 6.18<br />
2/16/06 6.87 6.19 5.98 6.77 6.45<br />
4/03/05 6.86 6.18 5.83 6.90 6.52<br />
4/24/06 6.77 6.48 6.41 6.77 6.31<br />
5/30/06 6.66 6.54
23<br />
For dissolved oxygen, Winkler Tritration was set as the reference st<strong>and</strong>ard for the<br />
project by July of 2005. CU used a LaMotte Model EDO Code 7414 Winkler Titration kit in<br />
the field to measure DO. All manufactures instructions were closely followed <strong>and</strong> the Sodium<br />
Thiosulfate solution was st<strong>and</strong>ardized daily prior to each sampling event. The Dissolved<br />
Oxygen sampling results are presented in Table 7.<br />
Date<br />
Table 7. In-Situ Dissolved Oxygen<br />
PB2 –DO PB1-DO TB1-DO<br />
(ppm) (ppm)<br />
(ppm)<br />
MA-DO<br />
(ppm)<br />
5/26/05 13.50 (mg/L) 6.30 (mg/L) 6.10 (mg/L)<br />
6/09/05 7.27 (mg/L) 8.10 (mg/L) 7.80 (mg/L)<br />
6/24/05 7.58 (mg/L) 6.80 (mg/L) 8.32 (mg/L)<br />
7/27/05 5.0 6.6 5.6<br />
8/23/05 5.5 6.8 4.4<br />
9/05/05 6.2 5.6 4.8<br />
9/28/05 5.0 5.6 dry<br />
11/14/05 6.0 4.8 1.6 8.0<br />
12/05/05 7.2 6.8 6.4 10.2<br />
1/10/06 6.8 6.8 8.1 9.2<br />
2/16/06 7.4 8.6 9.4 10.5<br />
4/03/05 6.8 8.2 8.2 9.0<br />
4/24/06 6.6 6.1 6.0 6.1<br />
Conductivity, or Specific Conductance (SC), was added to the In-Situ parameters by<br />
Citizens United to identify the potential presence of chloride, phosphate, <strong>and</strong> nitrate, in<br />
accordance with EPA 841-B-97-003, section 5.9. A temperature compensating LaMotte<br />
EC/TDS/SAL Tracer Code 1749 was used to measure conductivity. The conductivity range<br />
from 0 to 199.9 microseimens per centimeter (µ/cm) was used, <strong>and</strong> a st<strong>and</strong>ard buffer of 84<br />
microseimans per centimeter was used to calibrate the instrument prior to each sampling event.<br />
All buffers were used once <strong>and</strong> thrown out. For additional conductivity reference, a La Motte<br />
Code 1766 meter was used simultaneously during each sampling event with the 1749 meter,<br />
<strong>and</strong> these measurements were recorded in the filed notes but not in the final data. In-Situ<br />
conductivity data is recorded in Table 8.<br />
Oxygen Reduction Potential (ORP) was also added to the In-Situ parameters as a<br />
potential means to measure <strong>and</strong> compare redox gradients across the sampling sites. A double<br />
junction Oakton ORPTestr 10, 10BNC was used to test ORP at each site during each sampling<br />
event. The range was -999 mV to +1000 mV with a resolution of 1 mV <strong>and</strong> an accuracy of<br />
plus or minus 2 mV, <strong>and</strong> the manufacturer recommended that calibration of this instrument was<br />
not necessary. ORP results are presented in Table 9.
24<br />
Table 8. In-Situ Specific Conductance (µ/cm)<br />
Date PB2 -SC PB1-SC TB1-SC MS-SC MA-SC<br />
6/09/05 449.00 229.00 143.00<br />
8/23/05 600.00 221.00 78.60 149.30<br />
9/05/05 628.00 181.00 84.40 173.50<br />
9/23/05 608.00 155.10 95.10<br />
9/28/05 602.00 136.00 Dry 147.00<br />
9/29/05 615.00 157.50 110.40<br />
11/14/05 558.00 219.00 86.70 137.80 96.10<br />
12/05/05 459.00 168.80 72.90 139.00 100.80<br />
1/10/06 518.00 192.60 97.40 148.10 111.80<br />
2/16/06 504.00 212.00 130.10 133.40 105.00<br />
4/03/05 507.00 203.00 78.70 111.60 88.10<br />
4/24/06 237.00 96.00 130.00 149.20 97.00<br />
Table 9. In-Situ Oxygen Reduction Potential (ORP)<br />
Date PB2 -ORP PB1-ORP TB1-ORP MS-ORP MA-ORP<br />
9/05/05 20.00 138.00 81.00 58.00<br />
9/23/05 -9.00 75.00 140.00<br />
9/28/05 -16.00 116.00 Dry 64.00<br />
9/29/05 -3.00<br />
11/14/05 -7.00 102.00 94.00 76.00 111.00<br />
12/05/05 9.00 106.00 122.00 144.00 153.00<br />
1/10/06 5.00 103.00 123.00 76.00 145.00<br />
2/16/06 11.00 132.00 144.00 67.00 153.00<br />
4/03/05 25.00 151.00 173.00 89.00 160.00<br />
4/24/06 33.00 125.00 130.00 88.00 153.00<br />
5/30/06 85.00 130.00<br />
Stream bank soil material was collected from overburden material obtained during the<br />
initial h<strong>and</strong> digging of the groundwater wells on April 27, 2005. Soil samples were collected at<br />
sites SEDS <strong>and</strong> SEDN. Appendix I contains a map of the location of the soil sampling<br />
stations. Soil analysis stations were chosen to characterize potential impacts from these sources<br />
from the watershed drainage areas north <strong>and</strong> south of the area of concern.<br />
Samples of groundwater were obtained from the h<strong>and</strong> dug wells GWN <strong>and</strong> GWS on<br />
May 17, 2005, September 14, 2005 <strong>and</strong> December 22, 2005. Appendix I contains a map of the<br />
locations of these wells. Groundwater analysis stations were chosen to characterize potential<br />
impacts from these sources from the watershed drainage areas north <strong>and</strong> south of the area of<br />
concern.<br />
Detailed protocols for surface <strong>and</strong> groundwater sampling are available in the Quality<br />
Assurance Sampling Plan for <strong>Parvin</strong> <strong>Branch</strong> <strong>and</strong> <strong>Tarkiln</strong> Brook Water Quality Assessment<br />
prepared by Citizens United (March 2005) found in Appendix I.
3. Results<br />
a. Existing Data<br />
25<br />
WMA 17 Characterization & Assessment summary (Appendix L)<br />
b. Watershed Sampling<br />
Water quality was measured at PB1, PB2, <strong>and</strong> TB1 on 14 dates between May 2005<br />
<strong>and</strong> April 2006. Water samples were analyzed for a number of st<strong>and</strong>ard water quality<br />
parameters including nitrogen (nitrate <strong>and</strong> ammonia), phosphorus (total <strong>and</strong> dissolved),<br />
dissolved oxygen, solids (total dissolved <strong>and</strong> total suspended), iron, pH, conductivity, <strong>and</strong><br />
temperature. Results are in Appendix D <strong>and</strong> in the dry weather concentration figures found<br />
in Appendix E. Water quality was also measured in GWN <strong>and</strong> GWS on three dates in<br />
2005. Samples were analyzed for st<strong>and</strong>ard water quality parameters <strong>and</strong> priority pollutants.<br />
Results are in Appendix D.<br />
Sediment samples from SEDN <strong>and</strong> SEDS were analyzed once for priority<br />
pollutants <strong>and</strong> nutrients. Based on the results of the groundwater sampling, no significant<br />
contaminants were noted in the initial priority pollutant or metals scans. In accordance with<br />
the QAPP, no further samples were analyzed. Results are in Appendix D.<br />
Based on the water quality data, it is clear that PB1 <strong>and</strong> TB2 are stormwater<br />
dominated <strong>and</strong> the water quality reflects the urban nature of the watershed. PB1<br />
consistently has nitrate levels in the 8-10 mg/l range, especially during the warmer months.<br />
The source of this nitrate is possibly the agricultural fields along the stream just above this<br />
part of the watershed. The <strong>Tarkiln</strong> <strong>Branch</strong> in particular demonstrated very flashy hydrology<br />
<strong>and</strong> in fact dried up during drought periods. The first flush after a drought demonstrated<br />
high fecal coliform readings, probably reflecting the fact that many people were walking<br />
their dogs in the dry stream bed as well as normal wildlife use.<br />
At PB2, the stream is a groundwater dominated stream. The high iron content (~7<br />
mg/l) indicates a strong influence from reduced groundwater passing through high iron<br />
soils. The effect of the L<strong>and</strong>is infiltration beds is clearly evident. The groundwater on the<br />
north side of the stream is much higher in ammonia, TDS, <strong>and</strong> TKN than the groundwater<br />
on the south side <strong>and</strong> this is reflected in the surface water concentrations. This ammonia<br />
probably results from biodegradation of BOD from the discharge as well as biodegradation<br />
of some of the organic peat soils through which the groundwater passes. While the stream<br />
generally meets the water quality criteria for DO <strong>and</strong> TSS, it generally exceeds the criterion<br />
for total P. The source of this P is likely the groundwater, which has roughly the same<br />
levels. This phosphorous is likely not very bioavailable because of the high iron content<br />
<strong>and</strong> is probably bound in large part to the iron oxides in suspension.<br />
Specific Conductance at PB2 indicated a significant difference between this site <strong>and</strong><br />
all other sites. The average conductivity at PB2 was 524 µ/cm, with a high of 628 µ/cm<br />
<strong>and</strong> a low of 237 µ/cm. PB1 was the next highest site, with an average of 186 µ/cm, <strong>and</strong> a<br />
high of 229 µ/cm <strong>and</strong> a low of 96 µ/cm. The upstream unimpaired ecoregion reference site<br />
at Almond Ave. <strong>and</strong> the Maurice River had an average of 101 µ/cm, with a high of 111.8<br />
µ/cm <strong>and</strong> a low of 88.10 µ/cm.
26<br />
According to EPA 841-B-97-003, section 5.9, there are known connections between<br />
sewerage treatment plants <strong>and</strong> higher than natural conductivity from discharges of chloride,<br />
phosphate, <strong>and</strong> nitrate. The facts that site PB2 has treated sewerage infiltration beds<br />
discharging upstream to the water table in close proximity, the significant presence of<br />
ammonia, TDS, <strong>and</strong> TDK, <strong>and</strong> the significantly high specific conductance, all seem to<br />
indicate that there are direct hydrologic connections between the surface waters of <strong>Parvin</strong>s<br />
<strong>Branch</strong> <strong>and</strong> the continually recharging groundwaters from the L<strong>and</strong>is Sewerage Authority<br />
treatment plant.<br />
Another factor that has the potential to increase the degree of connectivity between<br />
ground water <strong>and</strong> surface water adjacent to the sewerage treatment plant is that the stream<br />
segments closest to the plant (T6, M1, <strong>and</strong> M2) are being continually down cut from<br />
powerful stormwater discharges from the urban impervious surfaces upstream. As the<br />
stream bottom is scoured away <strong>and</strong> lowered deeper into the water table, more surface area<br />
of the bed <strong>and</strong> the banks of the stream becomes accessible to receiving groundwater base<br />
flows.<br />
The stream segments T6, M1, M2, <strong>and</strong> M3 above <strong>and</strong> below PB2 were found to<br />
have a preponderance of orange turbid water with frequent occurrences of bright orange<br />
groundwater seeps from the stream bed <strong>and</strong> banks, <strong>and</strong> globular accumulations of orange<br />
matter that dispersed into turbid plumes in the water column when disturbed (see the SVAP<br />
report for the Main <strong>Branch</strong> Reaches, Appendix A). Work done by USGS in the Pocomoke<br />
River in Maryl<strong>and</strong> http://pubs.usgs.gov/of/2003/of03-346/ indicates that this turbidity could<br />
result primarily from iron oxyhydroxide floc due to precipitation of ferric compounds as<br />
ferrous-rich ground water emerges as stream base flow.<br />
This internal generated turbidity has nothing to do with runoff <strong>and</strong> sediment<br />
transport from upl<strong>and</strong> areas, <strong>and</strong> is described as an “authigenic precipitate”. While these<br />
iron precipitates can play a role in the behavior <strong>and</strong> cycling of P in the system, they can also<br />
impact biota in the system, such as aquatic plants <strong>and</strong> pollution sensitive aquatic insects.<br />
The iron precipitating in the river causes turbidity, which reduces light penetration to rooted<br />
aquatic vegetation, <strong>and</strong> may impact other organisms like filter feeding macroinvertebates by<br />
coating gills <strong>and</strong> interfering with oxygen transfer <strong>and</strong> food intake.<br />
D. Biological Analysis<br />
1. Methods<br />
a. AMNET Data<br />
<strong>NJ</strong>DEP maintains over 800 AMNET monitoring stations throughout New Jersey.<br />
There are two AMNET sampling sites in the vicinity of the <strong>Parvin</strong> & <strong>Tarkiln</strong> Watershed<br />
(Figure 3). Station AN0750 (<strong>Parvin</strong> <strong>Branch</strong>, Rt. 55, City of Vinel<strong>and</strong>, Cumberl<strong>and</strong> County,<br />
Millville Quad) is located within the <strong>Parvin</strong> & <strong>Tarkiln</strong> Watershed. Station AN0751<br />
(Maurice River, Sherman Ave., City of Vinel<strong>and</strong>, Cumberl<strong>and</strong> County, Millville Quad) is<br />
located just downstream of the confluence of the Maurice River <strong>and</strong> <strong>Parvin</strong> <strong>Branch</strong>. This<br />
station is just outside the boundary of the <strong>Parvin</strong> & <strong>Tarkiln</strong> Watershed, but is used to assess<br />
the impacts of <strong>Parvin</strong> <strong>Branch</strong> <strong>and</strong> <strong>Tarkiln</strong> <strong>Branch</strong> waters on the water quality of the<br />
Maurice River. Water quality data from the AMNET stations was obtained <strong>and</strong> included in<br />
the <strong>Parvin</strong> & <strong>Tarkiln</strong> Watershed GIS.
27<br />
AN0750<br />
AN0751<br />
Figure 4. <strong>NJ</strong>DEP 1998 AMNET Sites AN0750 <strong>and</strong> AN0751.<br />
a. Benthic Macroinvertebrate Sampling<br />
Three sample sites were established: two on <strong>Parvin</strong> <strong>Branch</strong> (PB1 <strong>and</strong> PB2) <strong>and</strong> one<br />
on <strong>Tarkiln</strong> <strong>Branch</strong> (TB1). These sites were sampled for benthic macroinvertebrates on June<br />
9, 2005 <strong>and</strong> September 5, 2005 <strong>and</strong> were also used for surface water monitoring. Benthic<br />
macroinvertebrate sampling was completed on June 9, 2005 by Citizens United to Protect<br />
the Maurice River <strong>and</strong> its Tributaries (CUPMRT) <strong>and</strong> TRC Omni Environmental Corp.<br />
(TRC Omni). During this sampling event, Dr. Amy Soli of TRC Omni provided training in<br />
benthic macroinvertebrate collection techniques. CUMPRT completed the benthic<br />
macroinvertebrate sampling on September 5, 2005.
28<br />
Benthic macroinvertebrates were collected using a 500 µm mesh kick-net.<br />
Invertebrates were collected by kicking a 1 m 2 area upstream of the kick-net in order to<br />
dislodge the invertebrates. Three 1 m 2 areas representing a variety of habitats were<br />
sampled at each stream site; the invertebrates <strong>and</strong> substrate collected were combined into<br />
one composite sample. Large pieces of substrate collected in the net were inspected for<br />
invertebrates (<strong>and</strong> discarded), as was the kick-net. Captured invertebrates were placed in<br />
bottles containing 80% ethanol <strong>and</strong> labels with site identification information. Vegetation<br />
(e.g. leafpacks) <strong>and</strong> substrate collected in the kick-net were also placed in the bottles for<br />
later inspection to remove organisms. A supplemental qualitative sample of coarse<br />
particulate organic matter (CPOM) was also collected at each site during each sampling<br />
episode <strong>and</strong> preserved separately in 80% ethanol.<br />
The preserved benthic samples were later sorted in the laboratory. All Benthic<br />
macroinvertebrates were identified to the lowest practical taxonomic level, usually to<br />
family. Benthic macroinvertebrate sorting <strong>and</strong> identification was conducted by CUPMRT.<br />
Dr. Amy Soli of TRC Omni provided a quality assurance check for the identification of<br />
benthic macroinvertebrate samples. Dr. Soli evaluated a minimum of 10% of the samples to<br />
verify proper identification of benthic macroinvertebrates. A list of taxa collected, <strong>and</strong> the<br />
number of individuals of each taxa, is located in Appendix H. Benthic macroinvertebrate<br />
data were analyzed using benthic metrics discussed in the US EPA’s Rapid Bioassessment<br />
Protocols manual (Barbour et al., 1999) <strong>and</strong> the <strong>NJ</strong>DEP’s Bureau of Freshwater <strong>and</strong><br />
Biological Monitoring’s (BFBM) Rapid Bioassessment Protocol (RBP).<br />
Habitat assessment <strong>and</strong> the measurement of physicochemical parameters were<br />
conducted concurrently with macroinvertebrate sampling. Surface water sampling for the<br />
measurement of pH, temperature, dissolved oxygen (DO), <strong>and</strong> conductivity was conducted<br />
on a representative cross-section of the stream. At least four (4) subsurface grab samples<br />
were collected across an established transect. These grab samples were composited into one<br />
container from which physiochemical parameters were measured. Habitat assessment data<br />
included weather conditions, water quality, sediment composition, <strong>and</strong> in-stream habitats.<br />
These variables were assessed prior to the commencement of sampling efforts.<br />
2. Results<br />
a. AMNET Data<br />
AMNET stations AN0750 <strong>and</strong> AN0751 were both designated as “moderately<br />
impaired” in the 1995-1996 <strong>and</strong> 2000-2001 surveys. <strong>NJ</strong>DEP noted that station AN0750<br />
had a paucity of clean water organisms <strong>and</strong> a malodorous iron precipitate. Station AN0751<br />
was described as having a paucity of clean water organisms <strong>and</strong> “much trash.” The health<br />
of the biological community is used by <strong>NJ</strong>DEP as a primary indicator of water quality<br />
impairment <strong>and</strong> is integral when <strong>NJ</strong>DEP staff consider funding restoration projects<br />
throughout the State. Of note, in the latest biomonitoring assessment (1998), all stations<br />
along the Maurice River main stem <strong>and</strong> headwaters tributaries upstream of the <strong>Parvin</strong><br />
<strong>Branch</strong> confluence are listed as unimpaired. Clearly the <strong>Parvin</strong> & <strong>Tarkiln</strong> Watershed is<br />
contributing to the impairment of the Maurice River, which begins at its confluence with<br />
<strong>Parvin</strong> <strong>Branch</strong>.
. Benthic Macroinvertebrate Sampling<br />
29<br />
Various benthic metrics based on diversity <strong>and</strong> pollution tolerance were calculated<br />
following the guidelines of Barbour et al. (1999) <strong>and</strong> the <strong>NJ</strong>DEP’s BFBM RPB(2006,<br />
2004) (Appendix H). Richness indices included taxa richness; Ephemeroptera, Plecoptera,<br />
<strong>and</strong> Trichoptera (EPT) richness; %EPT; <strong>and</strong> % contribution dominant family (%CDF).<br />
EPT richness is the total number of Ephemeroptera, Plecoptera, <strong>and</strong> Trichoptera taxa in<br />
each sample; %EPT is percentage of the total number of organisms in each sample<br />
belonging to the EPT orders. The %CDF is the percentage of the total number of<br />
organisms in each sample in the numerically dominant family. Taxa were also classified as<br />
being tolerant, semi-tolerant, or intolerant to pollution based on Family Tolerance Values<br />
(FTV) provided by the <strong>NJ</strong>DEP BFBM. Using the FTV’s, the Modified Family Biotic Index<br />
(FBI) was calculated. The <strong>NJ</strong>DEP bases their FBI on that developed by Hilsenhoff (1988).<br />
The bioassessment indices (taxa richness, EPT, %EPT, %CDF, <strong>and</strong> FBI) were calculated<br />
for each site for each sampling date.<br />
Benthic macroinvertebrate sampling yielded between 2 <strong>and</strong> 12 taxa <strong>and</strong> 6 <strong>and</strong> 123<br />
individuals per site. With the exception of PB1 on 9/5/2005 <strong>and</strong> TB1 on 9/5/2005, the<br />
predominant taxon in each sample was Chironomidae (midge flies), a pollution tolerant<br />
organism. Physidae was the dominant taxon in the TB1 sample on 9/5/2005. Bivalvia<br />
(Pelecypoda) was the dominant taxon in the PB1 sample on 9/5/2005. Both Physidae <strong>and</strong><br />
Bivalvia are pollution tolerant organisms. None of the samples contained members of the<br />
Ephemeroptera, Plecoptera, or Trichoptera. Ephemeroptera, Plecoptera, <strong>and</strong> Trichoptera<br />
(the EPT taxa) are traditionally considered to be sensitive taxa <strong>and</strong> their presence implies<br />
minimal water quality impairment. While their absence cannot be used to prove poor water<br />
quality (since habitat, water temperature, <strong>and</strong> other physiochemical parameters may instead<br />
contribute to their absence), it does provide additional evidence of impaired water quality.<br />
Few semi-tolerant taxa were also found <strong>and</strong> included Dytiscids, Calopterygidae,<br />
Coenagrionidae, Aeshnidae, <strong>and</strong> Tipulidae.<br />
Appendix F shows the benthic bioassessment metric values. The benthic data was<br />
analyzed for five bioassessment indices: taxa richness, taxa richness, EPT richness, % CDF,<br />
% EPT, <strong>and</strong> the Hilsenhoff Family Biotic Index (FBI). These indices are used by the<br />
<strong>NJ</strong>DEP BFBM <strong>and</strong> are used to calculate the New Jersey Impairment Score (<strong>NJ</strong>IS). Taxa<br />
richness <strong>and</strong> EPT richness are measurements commonly used as indicators of water quality<br />
because decreases in these parameters indicate decreasing water quality. Percent<br />
dominance is of interest because a shift towards dominance by relatively few taxa indicates<br />
environmental stress. Percent EPT is measured because increases in this metric denote<br />
improved water quality. (Kurtz et al. 2000) Finally, the HFBI (a.k.a. the modified family<br />
biotic index) is used as an indicator of organic pollution, with lower HFBI values indicating<br />
a lower likelihood of organic pollution (Hilsenhoff 1988).<br />
As was mentioned, these five metrics are used by the <strong>NJ</strong>DEP to classify streams as<br />
being non-impaired, moderately impaired, or severely impaired (<strong>NJ</strong>DEP 2004). The <strong>NJ</strong>IS<br />
for sample PB1 on 6/9/2005 <strong>and</strong> the PB1 sample on 9/5/2005 was 6 <strong>and</strong> 15, respectively.<br />
Thus, the <strong>NJ</strong>IS indicated that PB1 was severely impaired on 6/9/2005 <strong>and</strong> moderately<br />
impaired on 9/5/2005. The <strong>NJ</strong>IS for samples PB2 on 6/9/2005 <strong>and</strong> 9/5/2005 was 3,<br />
indicating severely impaired conditions on both sampling dates. Finally, the <strong>NJ</strong>IS for the<br />
TB1 sample on 6/9/2005 was 9 <strong>and</strong> 6 from the 9/5/2005 sample. Thus, the <strong>NJ</strong>IS indicated<br />
that TB1 was moderately impaired on 6/9/2005 <strong>and</strong> severely impaired on 9/5/2005.
30<br />
The benthic macroinvertebrate data indicated impaired water quality at all stations<br />
on all sample dates. First, there were no sensitive taxa identified from any of the samples,<br />
especially the EPT taxa. In addition, taxa richness was relatively low; higher <strong>NJ</strong>IS are<br />
associated with taxa richness greater than 10. The %CDF also indicated impaired<br />
conditions; %CDF of less than 40 is associated with non-impaired (or relatively<br />
unimpaired) waters. The %CDF was less than 40 in only one sample- PB1 on 9/5/2005<br />
(one date with the moderately impaired classification). Finally, the FBI was always<br />
between 5.67 <strong>and</strong> 6.77. According to the <strong>NJ</strong>IS, these values indicate moderately impaired<br />
water quality. Hilsenhoff (1988) designates streams with HFBI values of between 5.76 <strong>and</strong><br />
6.50 to be of fairly poor water quality, indicating that substantial organic pollution is likely.<br />
Table 10 lists the species identified <strong>and</strong> counted by Citizens United.<br />
Table 10. <strong>Parvin</strong> <strong>Branch</strong> Macroinvertebrate Count for all Sites<br />
SITE > PB2 PB2 PB1 PB1 TB1 TB1<br />
DATE > 6/9/2005 9/5/2005 6/9/2005 9/5/2005 6/9/2005 9/5/2005<br />
Sample % sorted > 100% 100% 67% 100% 50% 100%<br />
Taxon Description Total Total Total Total Total Total<br />
Simulidae black flies 8 4<br />
Chironomidae midges 19 5 75 13 67 8<br />
Coleoptra beetles 1 11 2<br />
dragon &<br />
Odonata damselflies 1 14 2<br />
Crustacea amphipoda-scuds 3 1<br />
Gastropoda snails 13 8 16 51<br />
Pelecypoda clams 4 22 1<br />
Worms worms-oligachatta 4 7 8 17<br />
Eggs yes yes<br />
Cases<br />
yes<br />
Crayfish 2<br />
Cranefly 2<br />
Salam<strong>and</strong>ers yes yes yes
IV.<br />
RECOMMENDATIONS<br />
A. Stormwater Management<br />
1. Conduct an Evaluation of Stormwater Phase II Compliance<br />
31<br />
The New Jersey Department of Environmental Protection (<strong>NJ</strong>DEP)<br />
implemented the USEPA’s Phase II rules into the New Jersey Storm Water Permitting<br />
Rules effective February 1, 2004. The municipal storm water regulation program<br />
(<strong>NJ</strong>AC 7:14A) prescribes eight basic requirements that, when implemented together, are<br />
intended to result in significant reductions in the pollutants being discharged to<br />
receiving waters from municipal storm sewer systems. The regulations provide that<br />
these eight elements are the “minimum control measures” for compliance with the<br />
municipal program. The eight Statewide Basic Requirements (7:14A-25.6(b)) are:<br />
• Public involvement/participation;<br />
• Construction site stormwater runoff control;<br />
• Post-construction stormwater management in new development <strong>and</strong><br />
redevelopment;<br />
• Public education on stormwater impacts;<br />
• Prohibiting improper disposal of waste;<br />
• Control of solid <strong>and</strong> floatable materials;<br />
• Maintenance yards <strong>and</strong> highway service area program; <strong>and</strong><br />
• Employee training<br />
Municipalities have some flexibility in determining what BMPs <strong>and</strong> measurable<br />
goals for each minimum control measure are most appropriate for its particular<br />
community. The municipality has the option to select BMPs from the menu of BMPs<br />
provided by <strong>NJ</strong>DEP or to develop system specific BMPs. When the BMPs <strong>and</strong><br />
measurable goals are submitted in the municipal permit application, those elements<br />
become the required storm water management program (SWMP) for the municipality.<br />
Additionally, municipalities are encouraged to develop BMPs that will allow the<br />
municipality to gauge <strong>and</strong> measure goals for permit compliance <strong>and</strong> program<br />
effectiveness. The goals will vary from municipality to municipality based on<br />
particular storm water problems of the municipality <strong>and</strong> the measures chosen to combat<br />
them.<br />
To comply with the new regulations, municipalities must include in the permit<br />
submittal the chosen Best Management Practices (BMPs) <strong>and</strong> measurable goals for each<br />
of the eight elements. Municipalities need to evaluate the effectiveness of their SWMP<br />
to meet the overarching goals of the stormwater regulation program, which are:<br />
• Reduce pollutant discharges to the maximum extent practicable;<br />
• Protect water quality; <strong>and</strong><br />
• Satisfy the appropriate requirements of the Clean Water Act.
32<br />
Municipalities will be required to assess their progress in achieving their<br />
program’s measurable goals. The most efficient, cost-effective approach to obtaining<br />
compliance with the stormwater rules involves dividing the effort into two phases. The<br />
first phase involves an initial Baseline Assessment of the municipality’s infrastructure<br />
<strong>and</strong> current programs <strong>and</strong> resources to evaluate what elements will be most necessary to<br />
comply with the regulations <strong>and</strong> satisfy the eight required elements. The second phase<br />
is to prepare a municipal stormwater management plan as required by <strong>NJ</strong>AC 7:14A <strong>and</strong><br />
defined in <strong>NJ</strong>AC 7:8. The plans that have been prepared <strong>and</strong> submitted by the<br />
communities within this study area need to be reviewed <strong>and</strong> if necessary, additional<br />
emphasis needs to be placed on implementing BMPs <strong>and</strong> enforcing actions that address<br />
fecal coliform <strong>and</strong> other contamination in stormwater runoff.<br />
2. Enact a Stormwater Runoff Pollution Ordinance for New<br />
Development<br />
As previously stated, conventional storm water management has utilized dry<br />
detention basins to address storm water quantity issues. Unfortunately, this type of<br />
BMP application does not address storm water quality. We recommend that watershed<br />
partners promote enactment of municipal ordinances throughout the watershed that will<br />
require more attention to BMPs that will address storm water quality issues.<br />
Specifically, the ordinance should require that applicants for new developments prove<br />
that there will be “no net increase” in storm water pollutant loads for key parameters.<br />
This approach has recently been adopted by <strong>NJ</strong>DEP <strong>and</strong> other municipalities.<br />
On January 11, 2000, Governor Whitman issued Executive Order 109 (EO109),<br />
which requires that an environmental review be completed by <strong>NJ</strong>DEP for each<br />
Wastewater Management Plan (WMP), or WMP amendment that is requested. It<br />
directs <strong>NJ</strong>DEP to require that a nonpoint source (NPS) pollutant loading analysis be<br />
completed for proposed development. The NPS analysis must determine the pre- <strong>and</strong><br />
post-development storm water pollutant loading rates from the project area, <strong>and</strong> identify<br />
best management practices (BMPs) that reduce the post-development pollutant load to<br />
the pre-development pollutant load. The typical parameters required for study by<br />
<strong>NJ</strong>DEP include total suspended solids, total nitrogen, total phosphorus, <strong>and</strong> total<br />
petroleum hydrocarbons.<br />
In June 2001, Montgomery Township enacted a NPS ordinance that contains<br />
provisions similar to those enacted through EO109; however, this ordinance applies to<br />
all development, not just development that triggers a WMP amendment. The ordinance<br />
requires that a study be submitted that demonstrates that the post-development nonpoint<br />
source pollutant loads be equal to or less than existing NPS pollutant loads. An even<br />
more comprehensive ordinance is in place in Harding Township in Morris County <strong>and</strong><br />
Readington Township, Hunterdon County.
3. Implement Stormwater BMPs<br />
33<br />
New best management practices (BMPs) are being proposed <strong>and</strong> implemented<br />
throughout the state <strong>and</strong> opportunities to improve existing stormwater management<br />
practices in the study area should be addressed. An effective system not only safely <strong>and</strong><br />
economically conveys excess runoff but also maximizes opportunities for attenuating,<br />
infiltrating, <strong>and</strong> filtering surface runoff close to where it is generated. This reduces both<br />
total runoff volume <strong>and</strong> flow velocities, <strong>and</strong> results in less erosion <strong>and</strong> lower<br />
concentrations of nonpoint source pollution in waterways.<br />
Development <strong>and</strong> redevelopment in the study area should require improvement<br />
of existing infrastructure to not only adequately convey stormwater but also filter<br />
stormwater pollutants. Traditional controls such as catch basins, piped discharge, <strong>and</strong><br />
detention basins are not enough to prevent degradation to local streams <strong>and</strong> waterways.<br />
BMP techniques need to be included in the municipal stormwater plans <strong>and</strong> applied to<br />
retrofit existing systems. What is needed is a more creative use of available space <strong>and</strong><br />
resources focusing on disconnecting impervious areas from drainage systems <strong>and</strong><br />
filtering runoff from smaller storm events <strong>and</strong> the first flush of stormwater runoff using<br />
best management practices. Specific BMP designs are proposed in the New Jersey<br />
Stormwater Best Management Practices Manual (<strong>NJ</strong>DEP; April 2004). Stormwater<br />
BMP examples include:<br />
• Filter strips to filter runoff from roof tops <strong>and</strong> paved areas<br />
• Infiltration measures, including infiltration trenches, vegetated swales <strong>and</strong><br />
bioretention areas<br />
• Upgrading existing detention areas to provide greater hydrologic <strong>and</strong> water<br />
quality benefits as well as flood prevention<br />
• Installing approved pre-manufactured storm water treatment devices (approved<br />
by New Jersey Center for Advanced Technologies (<strong>NJ</strong>CAT))<br />
4. Develop Training Sessions for Municipalities<br />
Municipal employees, in particular, the Public Works Department set the<br />
st<strong>and</strong>ard for others in the community <strong>and</strong> work daily to improve the quality of life for<br />
residents. Programs are required as part of the new stormwater regulations to educate<br />
those involved daily in h<strong>and</strong>ling nonpoint source pollutants <strong>and</strong> improving stormwater<br />
management. Based on this study, the following areas of emphasis are recommended<br />
for the communities in the area of concern:<br />
• Goose Management,<br />
• Pet Waste Management,<br />
• Street Sweeping,<br />
• In-stream Debris Removal,<br />
• Stormwater Infrastructure Evaluation <strong>and</strong> Maintenance,<br />
• Upkeep of Maintenance Facilities, <strong>and</strong><br />
• De-Icing Materials: Storage & Distribution.<br />
This training program needs to include measures <strong>and</strong> strategies for enforcing<br />
municipal requirements <strong>and</strong> documenting progress throughout the community.
B. Riparian Area Management<br />
34<br />
1. Control Debris in Floodplains<br />
Streams are a reflection of what goes into them <strong>and</strong> what exists on the l<strong>and</strong><br />
within the drainage area. During the course of the stream visual assessment, floodplains<br />
were noted to often have debris, such as yard waste (sometimes in large amounts, for<br />
instance from a l<strong>and</strong>scaper) <strong>and</strong> other manmade debris from passing traffic. Debris,<br />
natural or manmade, smothers existing plant life, causing erosion <strong>and</strong> leading to the<br />
proliferation of exotic, invasive vegetation; furthermore, it has the possibility of<br />
leaching nutrients to the stream. This practice is illegal <strong>and</strong> more people need to be<br />
aware of the consequences of disposing of debris along the waterway. “No Littering”<br />
signs can help deter dumping, as can fines <strong>and</strong> penalties. Also, community cleanups<br />
<strong>and</strong> “Adopt a Stream” programs enhance stewardship in the watershed <strong>and</strong> can unite a<br />
community in further protecting their local waterways. Finally, debris such as old tires<br />
can play a role in increasing mosquito habitat in the watershed. Dumping penalties can<br />
help eliminate this problem.<br />
In addition, storm water runoff discharging directly into waterways presents a<br />
debris <strong>and</strong> water quality concern. Often, opportunities exist along waterways in parks<br />
<strong>and</strong> open space areas to retrofit stormwater discharge pipes that empty directly into a<br />
receiving waterbody by installing pre-manufactured treatment devices or daylighting<br />
pipes <strong>and</strong> discharging stormwater into vegetated swales or constructed wetl<strong>and</strong>s to trap<br />
floatables, promote settling <strong>and</strong> nutrient uptake prior to flowing into a lake or pond.<br />
Either in-line systems or off-line systems can direct first flush flows into treatment areas<br />
to remove debris, sediment <strong>and</strong> other pollutants prior to flowing into receiving waters.<br />
While these retrofit solutions can become expensive, for large drainage areas, they can<br />
provide a cost-effective solution to treating stormwater runoff, protecting waterways<br />
from nonpoint source pollution <strong>and</strong> reducing future costs for maintenance <strong>and</strong> dredging.<br />
2. Manage Invasive Plants<br />
Invasive exotic plant species present a threat to the health <strong>and</strong> integrity of<br />
riparian areas. Plant species such as oriental bittersweet, Japanese honeysuckle,<br />
Japanese knotweed, Norway maple, multiflora rose <strong>and</strong> purple loosestrife often become<br />
established in disturbed edges <strong>and</strong> then spread into riparian zones replacing the diverse<br />
native plant community <strong>and</strong> degrading the area’s habitat value.<br />
If invasive vegetation has become established, removal of the invasive<br />
vegetation by weeding or herbicide application must be done. Several invasive plant<br />
species can become established in riparian systems. Invasive species need to be<br />
removed <strong>and</strong> return growth closely monitored. Those species that should be removed as<br />
soon as they appear include: purple loosestrife, phragmites, Japanese knotweed,<br />
multiflora rose, tree-of-heaven, Norway maple, <strong>and</strong> honeysuckle. Organizing volunteer<br />
efforts to undertake invasive vegetation removal can be done, but will require an annual<br />
or semi-annual commitment for several years to follow up <strong>and</strong> continue to manage the<br />
site. If sufficient volunteer effort cannot be employed, herbicide applications can be<br />
used. The herbicide must be applied by a licensed applicator per the manufacturer’s<br />
specifications <strong>and</strong> local rules <strong>and</strong> regulations. The USFWS can provide technical<br />
assistance to communities or organizations working to control invasive exotics along<br />
waterways.
3. Enhance Natural Habitats<br />
35<br />
Lakes <strong>and</strong> ponds serve an important functional value <strong>and</strong> are an attractive<br />
feature in our communities. However, water quality in many lakes <strong>and</strong> ponds is<br />
vulnerable to high levels of nutrients, fecal coliform <strong>and</strong> biochemical oxygen dem<strong>and</strong>.<br />
Furthermore, many lakes <strong>and</strong> ponds are plagued by geese that contribute a significant<br />
nutrient <strong>and</strong> fecal coliform load to the system. Shorelines are also eroding. Sediment<br />
resulting from shoreline erosion is being deposited in the waterbody, along with<br />
sediment that is carried downstream by feeder tributaries. If sedimentation <strong>and</strong> nutrient<br />
enrichment continue to occur, waterbodies will reach a eutrophic state, thereby<br />
impacting wildlife habitat, severely degrading downstream water quality, <strong>and</strong><br />
destroying recreational opportunities. Establishing a narrow buffer of dense, native<br />
vegetation at the water’s edge that is between 2 <strong>and</strong> 3 foot in height, deters unwanted<br />
geese, provides filtering of overl<strong>and</strong> stormwater runoff, <strong>and</strong> helps to stabilize soils<br />
along shorelines.<br />
4. Enact Stream Corridor/Greenway Management<br />
Streams <strong>and</strong> rivers create a natural greenway network throughout the watershed.<br />
A management ordinance would assist in maintaining the health of these buffers <strong>and</strong><br />
setting forth recommended maintenance practices for controlling invasive plant species,<br />
planting additional native species, stabilizing degraded areas <strong>and</strong> defining proper<br />
techniques for care. This ordinance would enable some control of l<strong>and</strong>-use practices in<br />
riparian areas, even in privately owned areas. Sample ordinances are available from the<br />
Association of New Jersey Environmental Commissions (A<strong>NJ</strong>EC).<br />
5. Manage Construction Sites<br />
In following through with minimum disturbance, there is much that can be done<br />
before, during, <strong>and</strong> after construction to limit its impact. For one, a Soil Erosion <strong>and</strong><br />
Sediment Control Ordinance are recommended to provide more subsistence to what is<br />
already laid out in the Soil Erosion <strong>and</strong> Sediment Control Act, Chapter 251 of New<br />
Jersey Public Laws. The less soils that have to be moved, the bigger benefit for the<br />
l<strong>and</strong>; soils native to an area, unless polluted, should be expected to stay on-site,<br />
especially the top 12 inches of soil, usually rich in humus.<br />
Also, preserving natural vegetation on a construction site, as much as possible,<br />
is important for reasons of soil stabilization, habitat protection, <strong>and</strong> runoff treatment.<br />
Other benefits include enhanced aesthetic, an already established area of vegetation,<br />
less maintenance needed, reduction in water table via transpiration, <strong>and</strong> a buffer<br />
screening noise <strong>and</strong> visual disturbance. Other considerations during the construction<br />
phase are suggested in the following:<br />
• To maintain the health of trees that will be left on site, boards <strong>and</strong> other objects<br />
should not be nailed to the trunk;<br />
• Tree marking should be done before the start of construction <strong>and</strong> should be<br />
shown on the engineer’s drawings;<br />
• Tree roots within the drip zone should not be cut;<br />
• Barriers should be utilized to prevent equipment entering the natural, preserved<br />
areas;
36<br />
cut.<br />
A tree ordinance can also be used to keep track of what should <strong>and</strong> should not be<br />
6. Protect Watershed Easements along Surface Waters<br />
Many opportunities exist for both farmers <strong>and</strong> l<strong>and</strong>owners to “sell” an easement<br />
along waterways that exist as their private l<strong>and</strong> without actually selling. Government<br />
programs can lease the l<strong>and</strong> under a contractual agreement that the homeowner will<br />
keep the easement wild <strong>and</strong> natural. In addition, some local nonprofit l<strong>and</strong> trust<br />
organizations can work with property owners to develop a conservation easement to<br />
protect all or portions of a property from future l<strong>and</strong> use changes.<br />
7. Acquire <strong>and</strong> Protect Floodplain Property<br />
Several funding programs have <strong>and</strong> continue to provide funds to acquire<br />
properties prone to flooding. These programs focus on purchasing properties that are<br />
routinely damaged by floods <strong>and</strong> present a danger to the health, safety, <strong>and</strong> welfare of<br />
the public. FEMA <strong>and</strong> the Army Corps of Engineers are active in this endeavor <strong>and</strong><br />
opportunities to reclaim flood plain areas should be pursued whenever possible. The<br />
Blue Acres Bond Act of 1995 contained money for grants <strong>and</strong> loans for municipalities<br />
<strong>and</strong> counties to purchase l<strong>and</strong>s along waterways that have been damaged by floods,<br />
prone to damage by floods, or protect other l<strong>and</strong>s from flood damage. This program<br />
also serves to enhance recreation opportunities <strong>and</strong> promote conservation.<br />
Public parks <strong>and</strong> open space areas are excellent sites for demonstrating new<br />
materials, techniques <strong>and</strong> best management practices. Examples of BMPs <strong>and</strong> methods<br />
for “minimum disturbance” are outlined in the <strong>NJ</strong>DEP’s New Jersey Stormwater Best<br />
Management Practice Manual. Minimum disturbance as referred to by the <strong>NJ</strong>DEP<br />
relates to fitting development into the terrain. For example, permeable paving<br />
techniques can be used to minimize site runoff <strong>and</strong> can be used for streets, parking<br />
areas, <strong>and</strong> sidewalks, while retaining natural filtration capacity. Porous pavement is<br />
most recommended for use as parking areas for office buildings, recreation facilities,<br />
<strong>and</strong> shopping centers. Other uses can be for emergency stopping areas along roadways,<br />
traffic isl<strong>and</strong>s, <strong>and</strong> road shoulders. Grid pavers are another type of permeable pavement<br />
recommended by the <strong>NJ</strong>DEP. These include interlocking concrete blocks, brick, turf<br />
block, <strong>and</strong> stone, which allow water to infiltrate into the subsurface <strong>and</strong> are aesthetically<br />
pleasing. Mulched trails add a natural aspect to developments rather than concrete<br />
sidewalks, <strong>and</strong> further infiltration. Other types of infiltration best management<br />
practices for development can be found in the New Jersey Stormwater Management<br />
Practice Manual <strong>and</strong> include disconnecting impervious coverages, curb cuts <strong>and</strong><br />
diversion devices, <strong>and</strong> decreased road widths.
37<br />
C. Measurable Milestones<br />
This list of recommendations provides a guide for potential projects to be<br />
implemented to improve surface water quality <strong>and</strong> improve the overall health of the <strong>Parvin</strong><br />
<strong>and</strong> <strong>Tarkiln</strong> <strong>Branch</strong> Watershed. Key in successfully implementing these projects in the<br />
watershed will be working closely with <strong>NJ</strong>DEP <strong>and</strong> the City of Vinel<strong>and</strong> to develop a goal<br />
oriented schedule <strong>and</strong> time table. This plan is intended to be a guide for the CUPMRT <strong>and</strong><br />
its partners as they work to achieve water quality improvements in the streams. The study<br />
<strong>and</strong> recommendations should be viewed as a working document <strong>and</strong> periodically updated as<br />
new issues arise, new data is collected, <strong>and</strong> when projects have been successfully<br />
completed.<br />
Figure 5. The 22 SVAP Stream Segments for <strong>Parvin</strong> <strong>and</strong> <strong>Tarkiln</strong> <strong>Branch</strong>es
38<br />
<strong>Parvin</strong> <strong>Branch</strong> <strong>and</strong> <strong>Tarkiln</strong> <strong>Branch</strong> Watershed Restoration Master Plan<br />
APPENDIX A<br />
Visual Assessment Protocol (SVAP) data<br />
<strong>Parvin</strong>-<strong>Tarkiln</strong> Main <strong>Branch</strong> Reaches M1 thru M3<br />
The <strong>Parvin</strong>-<strong>Tarkiln</strong> SVAP data was collected <strong>and</strong><br />
filed digitally by “reach”. The <strong>Parvin</strong>-<strong>Tarkiln</strong><br />
Main <strong>Branch</strong> stream reaches M-1 thru M-3 total<br />
6,001 linear feet, for an average length of 2,000<br />
feet per reach. (Flow is from the right to the left).<br />
The field surveys on the Main <strong>Branch</strong> occurred during two separate periods. Reaches M1 <strong>and</strong> M2<br />
were surveyed in April 2005. Reach M1 is characterized as a historically channelized stream until it<br />
empties into an impounded area creating a pond. Below the pond, the stream becomes a braided<br />
channel <strong>and</strong> is closely connected with adjacent floodplain <strong>and</strong> wetl<strong>and</strong> areas. Downstream in the M2<br />
reach, the stream again becomes channelized with visible entrenchment <strong>and</strong> eroding undercut banks<br />
limiting access to the floodplain for the stream.
The survey of the M3 reach occurred in May 2004 <strong>and</strong> indicates that the channelized stream bed<br />
has begun to me<strong>and</strong>er <strong>and</strong> reconnect with adjacent floodplain <strong>and</strong> wetl<strong>and</strong>s areas. Impacts to<br />
streambed stability due to flashy stormwater flows were noted.<br />
39<br />
Throughout the reaches of the Main <strong>Branch</strong>, issues of flashy stormwater flows eroding <strong>and</strong><br />
destabilizing the stream bed <strong>and</strong> channel were noted <strong>and</strong> concerns regarding water quality due to the<br />
visible iron flocculation <strong>and</strong> deposition were raised. Further details <strong>and</strong> photographs of conditions are<br />
contained in the Portable Document File (.pdf) version of Appendix A. (51 pages, 58 MB)<br />
This data combines multiple data formats that includes gathering on the ground global positioning<br />
system (GPS) coordinates <strong>and</strong> digital photography, <strong>and</strong> desk top Geographic Information System<br />
(GIS) map analysis <strong>and</strong> interpretation of all available GIS mapping information for the <strong>Parvin</strong>s <strong>Branch</strong><br />
project. ESRI’s ArcView 9.1 GIS software was used to analyze <strong>and</strong> publish “real time” data collected<br />
from the field <strong>and</strong> existing l<strong>and</strong>use <strong>and</strong> l<strong>and</strong>scape GIS data provided by the New Jersey Department of<br />
Environmental Protection.<br />
In addition to the data provided here in Appendix A, <strong>Parvin</strong>-<strong>Tarkiln</strong> Main <strong>Branch</strong> Reaches M-1<br />
thru M-3, additional source data can be found in Appendix J, <strong>Parvin</strong>-<strong>Tarkiln</strong> <strong>Branch</strong>es GIS, in the<br />
following folders:<br />
Reach GPS – This file contains two files, GPS Points, <strong>and</strong> GPS Points Pictures. The GPS Points<br />
file contains an ArcView shapefile (<strong>NJ</strong> State Plane projection) of the XY coordinates of physical<br />
attributes on the reach. The GPS Points Picture file contains digital photographs of those XY attributes<br />
with the .jpg file name of the photograph referenced to the identification number of each point in the<br />
shape file.<br />
Maps – This file contains the .jpg maps used in the .pdf file with the SVAP data.<br />
Pictures – This file contains the universe of .jpg digital photographs (<strong>and</strong> film photo scans) that the<br />
SVAP data pictures were selected from.<br />
Table of Contents for Appendix A, <strong>Parvin</strong>-<strong>Tarkiln</strong> Main <strong>Branch</strong> Reaches M-1 thru M-3<br />
Reach M-1 Page 3 Reach M-3 Page 33<br />
Reach M-2 Page 16<br />
Note: Please find this document on the data DVD. (51 pages, 58MB)
40<br />
<strong>Parvin</strong> <strong>Branch</strong> <strong>and</strong> <strong>Tarkiln</strong> <strong>Branch</strong> Watershed Restoration Master Plan<br />
APPENDIX B<br />
Visual Assessment Protocol (SVAP) data<br />
<strong>Tarkiln</strong> <strong>Branch</strong> Reaches T1 thru T6<br />
The <strong>Parvin</strong>-<strong>Tarkiln</strong> SVAP data was collected <strong>and</strong> filed<br />
digitally by “reach”. The <strong>Tarkiln</strong> <strong>Branch</strong> stream reaches<br />
T-1 thru T-6 total 12,350 linear feet, for an average length<br />
of 2,058 feet per reach. (Flow is from the right to the left).<br />
The <strong>Tarkiln</strong> stream reaches were surveyed multiple times over the course of three years beginning<br />
in May 2003 <strong>and</strong> ending in April 2005. This stream flows westerly nearly two miles from the<br />
community of Vinel<strong>and</strong> until it joins with the <strong>Parvin</strong> <strong>Branch</strong>. In its most upstream reaches (identified<br />
as T1 <strong>and</strong> T2) the <strong>Tarkiln</strong> <strong>Branch</strong> serves solely as a channelized stormwater conveyance with little<br />
base flow <strong>and</strong> multiple stormwater discharges <strong>and</strong> crossings within its urban setting.<br />
Once the stream flows through the culvert crossing at West Avenue in Vinel<strong>and</strong>, while still showing<br />
signs of a channelized stormwater conveyance, becomes connected to large areas of forested floodplain<br />
wetl<strong>and</strong>s. Segments of the stream allow for connection to these adjacent flood plain wetl<strong>and</strong>s while<br />
other segments exhibit signs of entrenchment <strong>and</strong> continue to be impacted by significant stormwater<br />
discharges.
41<br />
Major concerns in the <strong>Tarkiln</strong> <strong>Branch</strong> were noted regarding the need for removing <strong>and</strong><br />
minimizing trash, debris <strong>and</strong> floatables as well as reconnecting the stream to floodplain wetl<strong>and</strong>s to<br />
improve water quality, flood plain storage, <strong>and</strong> groundwater recharge. Further details <strong>and</strong> photographs<br />
of conditions are contained in the <strong>Tarkiln</strong> <strong>Branch</strong> Reach Report in Appendix B. (58 pages, 70MB)<br />
This data combines multiple data formats that includes gathering on the ground global positioning<br />
system (GPS) coordinates <strong>and</strong> digital photography, <strong>and</strong> desk top Geographic Information System<br />
(GIS) map analysis <strong>and</strong> interpretation of all available GIS mapping information for the <strong>Parvin</strong> <strong>Tarkiln</strong><br />
<strong>Branch</strong>es project. ESRI’s ArcView 9.1 GIS software was used to analyze <strong>and</strong> publish “real time” data<br />
collected from the field <strong>and</strong> existing l<strong>and</strong>use <strong>and</strong> l<strong>and</strong>scape GIS data provided by the New Jersey<br />
Department of Environmental Protection.<br />
In addition to the data provided here in Appendix B, <strong>Tarkiln</strong> <strong>Branch</strong> Reaches T-1 thru T-6,<br />
additional source data can be found in Appendix J, <strong>Parvin</strong>-<strong>Tarkiln</strong> <strong>Branch</strong>es GIS, in the following<br />
folders:<br />
Reach GPS – This file contains two files, GPS Points, <strong>and</strong> GPS Points Pictures. The GPS Points<br />
file contains an ArcView shapefile (<strong>NJ</strong> State Plane projection) of the XY coordinates of physical<br />
attributes on the reach. The GPS Points Picture file contains digital photographs of those XY attributes<br />
with the .jpg file name of the photograph referenced to the identification number of each point in the<br />
shape file.<br />
Maps – This file contains the .jpg maps used in the .pdf file with the SVAP data.<br />
Pictures – This file contains the universe of .jpg digital photographs (<strong>and</strong> film photo scans) that the<br />
SVAP data pictures were selected from.<br />
Table of Contents for Appendix A, <strong>Tarkiln</strong> <strong>Branch</strong> Reaches T-1 thru T-6<br />
Reach T-1 Page 3 Reach T-4 Page 34<br />
Reach T-2 Page 10 Reach T-5 Page 43<br />
Reach T-3 Page 23 Reach T-6 Page 51<br />
Note: Please find this document on the data DVD. (58 pages, 70MB)
42<br />
<strong>Parvin</strong> <strong>Branch</strong> <strong>and</strong> <strong>Tarkiln</strong> <strong>Branch</strong> Watershed Restoration Master Plan<br />
APPENDIX C<br />
Visual Assessment Protocol (SVAP) data<br />
<strong>Parvin</strong> <strong>Branch</strong> Reaches P1 thru P13<br />
The <strong>Parvin</strong>-<strong>Tarkiln</strong> SVAP data was collected <strong>and</strong> filed digitally by “reach”.<br />
The <strong>Parvin</strong> <strong>Branch</strong> stream reaches P-1 thru P-13 total 25,249 linear feet, for<br />
an average length of 1,942 feet per reach. (Flow is from the right to the left).<br />
The <strong>Parvin</strong> <strong>Branch</strong> reaches were surveyed multiple periods beginning in May 2004 <strong>and</strong> ending in<br />
November 2006. This stream flows westerly nearly three miles from the community of Vinel<strong>and</strong> until<br />
it joins with the <strong>Tarkiln</strong> <strong>Branch</strong>. In its most upstream reaches (identified as P1 <strong>and</strong> P2) the <strong>Parvin</strong><br />
<strong>Branch</strong> serves as a stormwater conveyance with little base flow <strong>and</strong> multiple stormwater discharges<br />
<strong>and</strong> crossings within its urban setting. Adjacent areas of undeveloped wooded wetl<strong>and</strong>s remain along<br />
portions of the stream, but the entrenched channel does not allow for connections to the adjacent flood<br />
plain areas. Numerous stormwater discharges were identified along with encroaching areas of<br />
development <strong>and</strong> large quantities of trash <strong>and</strong> debris. Little or no base flow was evident.<br />
As the <strong>Parvin</strong> <strong>Branch</strong> transitions from its urban headwaters into reaches P3 through P5, the<br />
channelized stream begins to me<strong>and</strong>er <strong>and</strong> at points reconnects to adjacent floodplain <strong>and</strong> wetl<strong>and</strong><br />
areas. In addition, l<strong>and</strong> use near the stream begins to include agricultural l<strong>and</strong>s that sheet flow directly
into floodplain areas. Woody debris accumulation is visible within the channel <strong>and</strong> base flows in<br />
the stream become evident.<br />
43<br />
The stream then flows through 3 large box culverts beneath West Boulevard into the next set of<br />
reaches P6 through P10. This segment of the <strong>Parvin</strong> <strong>Branch</strong> flows through extensive forested<br />
floodplain wetl<strong>and</strong>s, but is impacted by multiple stormwater discharges from nearby industrial<br />
facilities through open ditches <strong>and</strong> a shallow pond. To the north of the stream, extensive agricultural<br />
fields direct surface runoff into floodplain <strong>and</strong> stream. Much of stream remains channelized <strong>and</strong> is<br />
disconnected from adjacent floodplain storage areas.<br />
As the stream flows into the final reaches (P11 through P13), the channel widens <strong>and</strong> has<br />
established floodplain benches <strong>and</strong> visible evidence of frequent connections to adjacent floodplain<br />
wetl<strong>and</strong>s <strong>and</strong> storage areas were observed. The channel begins to me<strong>and</strong>er through extensive<br />
floodplain wetl<strong>and</strong>s <strong>and</strong> as it nears its confluence with the <strong>Tarkiln</strong> <strong>Branch</strong>, steady base flows provide<br />
for aquatic habitat throughout the reach.<br />
Primary concerns for the <strong>Parvin</strong> <strong>Branch</strong> include stabilization of stormwater outlets discharging<br />
directly to the stream, large contributions of trash <strong>and</strong> debris, <strong>and</strong> impacts of agricultural activities in<br />
adjacent floodplain <strong>and</strong> wetl<strong>and</strong>s areas. Further details <strong>and</strong> photographs of conditions are contained in<br />
the Portable Document File (.pdf) version of Appendix C. (see DVD, 142 pgs, 147MB)<br />
This data combines multiple data formats that includes gathering on the ground global positioning<br />
system (GPS) coordinates <strong>and</strong> digital photography, <strong>and</strong> desk top Geographic Information System<br />
(GIS) map analysis <strong>and</strong> interpretation of all available GIS mapping information for the <strong>Parvin</strong>s <strong>Branch</strong><br />
project. ESRI’s ArcView 9.1 GIS software was used to analyze <strong>and</strong> publish “real time” data collected<br />
from the field <strong>and</strong> existing l<strong>and</strong>use <strong>and</strong> l<strong>and</strong>scape GIS data provided by the New Jersey Department of<br />
Environmental Protection.<br />
In addition to the data provided here in Appendix C, <strong>Parvin</strong> <strong>Branch</strong> Reaches P-1 thru P-13,<br />
additional source data can be found in Appendix J, <strong>Parvin</strong>-<strong>Tarkiln</strong> <strong>Branch</strong>es GIS, in the following<br />
folders:<br />
Reach GPS – This file contains two files, GPS Points, <strong>and</strong> GPS Points Pictures. The GPS Points<br />
file contains an ArcView shapefile (<strong>NJ</strong> State Plane projection) of the XY coordinates of physical<br />
attributes on the reach. The GPS Points Picture file contains digital photographs of those XY attributes<br />
with the .jpg file name of the photograph referenced to the identification number of each point in the<br />
shape file.<br />
Maps – This file contains the .jpg maps used in the .pdf file with the SVAP data.<br />
Pictures – This file contains the universe of .jpg digital photographs (<strong>and</strong> film photo scans) that the<br />
SVAP data pictures were selected from.<br />
Table of Contents for Appendix C, <strong>Parvin</strong>s <strong>Branch</strong> Reaches P-1 thru P-13<br />
Reach P-1 Page 3 Reach P-8 Page 84<br />
Reach P-2 Page 18 Reach P-9 Page 97<br />
Reach P-3 Page 27 Reach P-10 Page 106<br />
Reach P-4 Page 42 Reach P-11 Page 117<br />
Reach P-5 Page 53 Reach P-12 Page 125<br />
Reach P-6 Page 67 Reach P-13 Page 135<br />
Reach P-7 Page 76
<strong>Parvin</strong> <strong>Branch</strong> <strong>and</strong> <strong>Tarkiln</strong> <strong>Branch</strong> Watershed Restoration Master Plan<br />
APPENDIX D<br />
Water Chemistry Sampling Results Tables<br />
Watershed Sampling<br />
A monitoring plan was developed to gather surface water (<strong>Parvin</strong> <strong>Branch</strong> <strong>and</strong> <strong>Tarkiln</strong> <strong>Branch</strong>)<br />
<strong>and</strong> groundwater quality data. The monitoring plan included <strong>NJ</strong>DEP-approved sampling protocols for<br />
collecting physical <strong>and</strong> chemical data in these resources. Appropriate protocols, sampling points, <strong>and</strong><br />
schedules were selected for both wet weather (stormwater) <strong>and</strong> dry weather (base flow) sampling.<br />
Chemical analyses were completed by <strong>NJ</strong>DEP-certified laboratories as well as by volunteers using<br />
field sampling kits. Local volunteer groups were instrumental in completing the physical <strong>and</strong> chemical<br />
assessments of the stream, including visual assessments of flow.<br />
Surface water, groundwater <strong>and</strong> sediment sampling occurred at <strong>Parvin</strong> <strong>Branch</strong> <strong>and</strong> <strong>Tarkiln</strong><br />
<strong>Branch</strong> from May 2005 to April 2006. During this time, Citizens United to Protect the Maurice River<br />
<strong>and</strong> its tributaries (CUPMRT) <strong>and</strong> TRC Omni collected eleven (11) sets of surface water samples at the<br />
three chemical <strong>and</strong> biological stations, PB1, PB2 <strong>and</strong> TB1, one (1) set of sediment samples from SEDS<br />
<strong>and</strong> SSN <strong>and</strong> three (3) sets of groundwater samples at monitoring wells GWN <strong>and</strong> GWS.<br />
Water quality was measured at PB1, PB2, <strong>and</strong> TB1 on 14 dates between May 2005 <strong>and</strong> April<br />
2006. Water samples were analyzed for a number of st<strong>and</strong>ard water quality parameters including<br />
nitrogen (nitrate <strong>and</strong> ammonia), phosphorus (total <strong>and</strong> dissolved), dissolved oxygen, solids (total<br />
dissolved <strong>and</strong> total suspended), iron, pH, conductivity, <strong>and</strong> temperature. Results are in Appendix D<br />
<strong>and</strong> in the dry weather concentration figures found in Appendix E. Water quality was also measured<br />
in GWN <strong>and</strong> GWS on three dates in 2005. Samples were analyzed for st<strong>and</strong>ard water quality<br />
parameters <strong>and</strong> priority pollutants. Results are in Appendix D.<br />
Sediment samples from SEDN <strong>and</strong> SEDS were analyzed once for priority pollutants <strong>and</strong><br />
nutrients. Based on the results of the groundwater sampling, no significant contaminants were noted in<br />
the initial priority pollutant or metals scans. In accordance with the QAPP, no further samples were<br />
analyzed. Results are in Appendix D.
<strong>Parvin</strong> <strong>Branch</strong> <strong>and</strong> <strong>Tarkiln</strong> <strong>Branch</strong><br />
Watershed Restoration Master Plan<br />
November 30, 2006<br />
Chemical <strong>and</strong> Biological Sampling Results<br />
Station Date Temp pH DO Alkalinity NH 3 -N<br />
Fecal<br />
Coliforms<br />
Hardness Fe Mn<br />
Nitrate<br />
(NO 3 -N)<br />
Nitrite<br />
(NO 2 -N)<br />
DOPO 4 TP TDS TKN TSS Turbidity<br />
ºC s.u. mg/l mg/l mg/l colonies/100ml mg/l mg/l mg/l mg/l mg/l mg/l mg/l mg/l mg/l mg/l NTUs<br />
PB1<br />
PB2<br />
TB1<br />
05/26/05 13.4 6.0 6.3 15 0.14 65 140 0.56 0.08 7.91 < 0.04 0.03 0.04 130 1.92 2.5 2.4<br />
06/24/05 19.2 6.8 6.8 11 0.12 190 68 NR NR 10.60 < 0.04 0.02 0.08 190 0.45 5.5 4.1<br />
07/27/05 20.2 6.0 6.6 33 0.34 170 71 NR NR 10.70 < 0.04 0.16 0.04 170 0.65 < 0.5 2.2<br />
08/23/05 18.7 6.4 6.8 17 0.10 2100 68 NR NR 9.16 < 0.04 0.01 0.04 130 0.16 3.0 2.4<br />
09/28/05 16.4 6.0 5.6 14 0.11 230 72 NR NR 5.20 < 0.04 0.01 0.03 90 0.29 4.5 1.6<br />
11/14/05 16.0 6.4 4.8 18 0.07 180 36 NR NR 7.42 < 0.04 0.02 0.07 140 0.8 3.5 2.5<br />
12/05/05 8.2 6.3 6.8 16 0.08 72 65 0.48 NR 7.13 < 0.04 0.02 0.03 120 0.58 4.5 2.7<br />
01/10/06 10.0 6.2 6.8 18 < 0.05 < 2 71 0.49 0.10 8.59 < 0.04 0.03 0.11 130 0.44 < 0.5 2.8<br />
02/16/06 NA NA 8.6 14 < 0.05 43 62 0.46 0.07 8.85 < 0.04 0.03 0.07 140 0.53 3.5 3.4<br />
04/03/06 11.0 6.2 8.2 19 0.12 160 64 0.34 0.07 10.15 < 0.04 0.01 0.08 150 0.37 9.0 2.8<br />
04/24/06 14.8 6.5 6.1 48 0.19 2400 38 0.57 0.04 2.03 < 0.04 0.03 0.13 76 1.77 4.5 7.4<br />
05/26/05 13.6 6.9 13.5 39 0.87 10 76 6.57 0.07 3.46 < 0.04 0.03 0.08 250 3.15 11.5 34<br />
06/24/05 18.2 6.7 7.6 42 0.94 < 4 52 NR NR 2.93 < 0.04 < 0.01 0.12 310 1.45 17.0 64<br />
07/27/05 19.0 6.3 5.0 52 1.06 86 84 NR NR 2.72 < 0.04 < 0.01 0.05 300 1.40 15.0 65<br />
08/23/05 17.2 6.6 5.5 57 0.11 140 53 NR NR 1.96 < 0.04 < 0.01 0.11 240 0.24 9.5 62<br />
09/28/05 16.3 6.5 5.0 43 1.46 68 56 NR NR 1.59 < 0.04 0.03 0.12 320 2.22 26.0 70<br />
11/14/05 14.7 7.0 6.0 59 1.01 24 58 NR NR 1.34 < 0.04 0.04 0.25 340 1.82 10.5 28<br />
12/05/05 6.2 6.9 7.2 49 0.84 56 64 6.20 NR 2.07 < 0.04 0.07 0.11 270 1.36 7.0 13<br />
01/10/06 9.0 6.8 6.8 48 0.62 < 2 80 6.50 0.05 2.55 < 0.04 0.02 0.18 280 1.58 12.0 28<br />
02/16/06 9.0 6.9 7.4 52 0.28 38 49 6.76 0.05 2.68 < 0.04 0.05 0.16 320 0.95 9.5 22<br />
04/03/06 11.4 6.9 6.8 57 0.26 82 52 7.82 0.05 2.57 < 0.04 < 0.01 0.15 300 0.45 17.0 25<br />
04/24/06 14.3 6.8 6.6 32 0.23 500 38 5.57 0.06 1.62 < 0.04 0.05 0.23 140 2.37 16.0 27<br />
05/26/05 13.2 6.0 6.1 11 0.10 46 48 0.51 0.06 1.71 < 0.04 0.01 0.03 90 1.80 4.0 2.7<br />
06/24/05 18.8 6.4 8.3 9.2 0.13 30 30 NR NR 1.64 < 0.04 0.01 0.04 100 0.72 3.5 1.9<br />
07/27/05 21.1 6.0 5.6 12 0.33 300 30 NR NR 1.66 < 0.04 0.02 0.03 68 0.56 < 0.5 1.6<br />
08/23/05 19.6 6.1 4.4 13 0.11 6600 18 NR NR 1.11 < 0.04 0.03 0.1 39 0.13 18.0 6.2<br />
09/28/05 Stream Dry, No Sample Obtained<br />
11/14/05 14.9 6.1 1.6 17 0.06 18 28 NR NR 0.47 < 0.04 0.02 0.16 60 0.55 12.0 6.7<br />
12/05/05 6.9 6.1 6.4 10 0.07 110 18 0.65 NR 1.15 < 0.04 0.03 0.04 53 0.58 4.0 1.7<br />
01/10/06 10.0 6.0 8.1 8.8 < 0.05 < 2 30 0.60 0.12 1.52 < 0.04 0.03 0.12 62 0.77 < 0.5 2<br />
02/16/06 10.3 6.0 9.4 7.6 0.05 4 25 0.47 0.06 1.66 < 0.04 0.02 0.08 86 0.36 1.0 2.2<br />
04/03/06 8.2 5.8 10.8 9.6 0.08 10 4.8 0.54 0.05 1.47 < 0.04 0.02 0.06 65 0.30 3.5 2<br />
04/24/06 14.8 6.5 6.1 16 0.29 2300 39 0.48 0.04 0.97 < 0.04 0.03 0.11 49 1.49 4.5 9.6<br />
Blue fill indicates marginal wet weather event
<strong>Parvin</strong> <strong>Branch</strong> <strong>and</strong> <strong>Tarkiln</strong> <strong>Branch</strong><br />
Watershed Restoration Master Plan<br />
November 30, 2006<br />
Groundwater Sampling Results<br />
GWN<br />
GWS<br />
Parameter<br />
Units 5/17/2005 9/14/2005 12/22/2005 5/17/2005 9/14/2005 12/22/2005<br />
Value Value Value Value Value Value<br />
1, 1-dichloroethane mg/l < 1 < 1 < 1 < 1<br />
1, 1-dichloroethene mg/l < 1 < 1 < 1 < 1<br />
1,1,1,2-tetrachloroethane mg/l < 1 < 1 < 1 < 1<br />
1,1,1-trichloroethane mg/l < 1 < 1 < 1 < 1<br />
1,1,2,2-tetrachloroethane mg/l < 1 < 1 < 1 < 1<br />
1,1,2-trichloroethane mg/l < 1 < 1 < 1 < 1<br />
1,1-dichloropropene mg/l < 1 < 1 < 1 < 1<br />
1,2,3-trichlorobenzene mg/l < 1 < 1 < 1 < 1<br />
1,2,3-trichloropropane mg/l < 1 < 1 < 1 < 1<br />
1,2,4-trichlorobenzene mg/l < 1 < 1 < 1 < 1<br />
1,2,4-trimethylbenzene mg/l < 1 < 1 < 1 < 1<br />
1,2-dibromo-3-<br />
chloropropane<br />
mg/l < 1 < 1 < 1 < 1<br />
1,2-dibromoethane mg/l < 1 < 1 < 1 < 1<br />
1,2-dichlorobenzene mg/l < 1 < 1 < 1 < 1<br />
1,2-dichloroethane mg/l < 1 < 1 < 1 < 1<br />
1,2-dichloropropane mg/l < 1 < 1 < 1 < 1<br />
1,3,5-trimethyl benzene mg/l < 1 < 1 < 1 < 1<br />
1,3-dichlorobenzene mg/l < 1 < 1 < 1 < 1<br />
1,4 dichlorobenzene mg/l < 1 < 1 < 1 < 1<br />
2, 2dichloropropane mg/l < 1 < 1 < 1 < 1<br />
2-chlorotoluene mg/l < 1 < 1 < 1 < 1<br />
2-chlorovinyl ether mg/l < 1 < 1 < 1 < 1<br />
2-hexanone mg/l < 1 < 1 < 1 < 1<br />
4-chlorotoluene mg/l < 1 < 1 < 1 < 1<br />
Acetone mg/l < 5 < 5 < 5 < 5<br />
Acrolien mg/l < 1 < 1 < 1 < 1<br />
Acrylonitrile mg/l < 1 < 1 < 1 < 1<br />
Alkalinity, total as CaCo3 mg/l 58 71 67 53 45 11<br />
Ammonia as NH3-N mg/l 10.02 9.1 9.11 1 1.77 0.63<br />
Antimony mg/l < 11.6 < 0.005 < 11.6 < 0.005<br />
Arsenic mg/l < 6.4 < 0.004 21.1 0.023<br />
benzene mg/l < 1 < 1 < 1 < 1<br />
Beryllium mg/l < 0.6 < 0.003 < 0.6 < 0.003<br />
bromobenzene mg/l < 1 < 1 < 1 < 1<br />
bromochloromethane mg/l < 1 < 1 < 1 < 1<br />
bromodichloromethane mg/l < 1 < 1 < 1 < 1<br />
bromoform mg/l < 1 < 1 < 1 < 1<br />
bromomethane mg/l < 2 < 2 < 2 < 2<br />
Cadmium mg/l < 0.8 < 0.001 < 0.8 0.002<br />
carbon disulfide mg/l < 1 < 1 < 1 < 1<br />
carbon tetrachloride mg/l < 1 < 1 < 1 < 1<br />
chlorobenzene mg/l < 1 < 1 < 1 < 1<br />
chloroethane mg/l < 1 < 1 < 1 < 1<br />
chloroform mg/l < 1 < 1 < 1 < 1<br />
chloromethane mg/l < 1 < 1 < 1 < 1<br />
Chromium mg/l 5.8 0.004 4.4 < 0.003<br />
Cis Dichloroethene mg/l < 1 < 1 < 1 < 1<br />
cis-1,3-dichloropropene mg/l < 1 < 1 < 1 < 1<br />
Copper mg/l < 7.4 < 0.01 23.7 0.02<br />
dibromochloromehtane mg/l < 1 < 1 < 1 < 1<br />
dibromomethane mg/l < 1 < 1 < 1 < 1<br />
Dichlorodifuloromethane mg/l < 1 < 1 < 1 < 1<br />
ethylbenzene mg/l < 1 < 1 < 1 < 1<br />
Fecal Coliforms colonies/100ml < 2 < 4 < 4 < 2 < 4 4<br />
Hardness, total as CaCo3 mg/l 14 33 40 54 48 37<br />
hexachlorobutadiene mg/l < 2 < 2 < 2 < 2<br />
Hexachloroethane mg/l < 1 < 1 < 1 < 1<br />
Iron mg/l 0.9 13 1.14 20.6 14<br />
isopropyl benzene mg/l < 1 < 1 < 1 < 1<br />
Lead mg/l < 5.4 < 0.003 26.1 0.005<br />
m/p xylene mg/l < 1 < 1 < 1 < 1<br />
Manganese mg/l 0.04 0.07 0.07 0.1 0.12<br />
Mercury mg/l < 0.1 < 0.0005 < 0.1 < 0.0005<br />
methyl tertiary butyl ether mg/l < 1 < 1 < 1 < 1<br />
methylene chloride mg/l < 1 < 1 < 1 < 1<br />
Methylethyl Ketone (MEK) mg/l < 1 < 1 < 1 < 1<br />
MIBK mg/l < 2 < 2 < 2 < 2<br />
naphthalene mg/l < 2 < 2 < 2 < 2<br />
n-butyl benzene mg/l < 1 < 1 < 1 < 1<br />
Nickel mg/l 8.3 < 0.01 6.6 < 0.01<br />
Nitrate as N, dissolved mg/l 0.4 0.52 < 0.02 < 0.02 0.72 < 0.02<br />
Nitrite as N, Dissolved mg/l < 0.04 < 0.04 < 0.04 < 0.04 < 0.04 < 0.02<br />
Nitrobenzene mg/l < 2 < 2 < 2 < 2<br />
n-propyl benzene mg/l < 1 < 1 < 1 < 1<br />
Ortho-Phosphate, dissolved mg/l 0.05 0.08 0.05 0.05 0.31 0.14<br />
o-xylene mg/l < 1 < 1 < 1 < 1<br />
Pentachloroethane mg/l < 1 < 1 < 1 < 1<br />
Phosphorus, total as P mg/l 0.17 0.18 0.13 0.07 1.2 0.51<br />
p-isopropyltoluene mg/l < 1 < 1 < 1 < 1
<strong>Parvin</strong> <strong>Branch</strong> <strong>and</strong> <strong>Tarkiln</strong> <strong>Branch</strong><br />
Watershed Restoration Master Plan<br />
November 30, 2006<br />
Groundwater Sampling Results<br />
GWN<br />
GWS<br />
Parameter<br />
Units 5/17/2005 9/14/2005 12/22/2005 5/17/2005 9/14/2005 12/22/2005<br />
Value Value Value Value Value Value<br />
sec-butylbenzene mg/l < 1 < 1 < 1 < 1<br />
Selenium mg/l < 8.4 < 0.005 < 8.4 < 0.005<br />
Silver mg/l < 2.8 < 0.002 < 2.8 < 0.002<br />
styrene mg/l < 1 < 1 < 1 < 1<br />
tert-butylbenzyne mg/l < 1 < 1 < 1 < 1<br />
Tertiary Butyl Alcohol mg/l < 1 < 1 < 1 < 1<br />
tetrachloroethene mg/l < 1 < 1 < 1 < 1<br />
Thallium mg/l < 9.4 < 0.005 < 9.4 < 0.005<br />
THF mg/l < 2 < 2 < 2 < 2<br />
toluene mg/l < 1 < 1 < 1 < 1<br />
Total Dissolved Solids mg/l 310 320 330 230 250 190<br />
Total Kjedahl Nitrogen mg/l 11.1 9.96 12.34 3.77 4.82 1.75<br />
Total Suspended Solids mg/l 32 21 32 690 53 42<br />
trans-1,2-dichloroethene mg/l < 1 < 1 < 1 < 1<br />
trans-1,3-dichoropropene mg/l < 1 < 1 < 1 < 1<br />
trans-1,4-dichloro-2-butene mg/l < 1 < 1 < 1 < 1<br />
trichloroethene mg/l < 1 < 1 < 1 < 1<br />
Trichlorofluoromethane mg/l < 1 < 1 < 1 < 1<br />
Turbidity NTUs 180 22 45 340 33 70<br />
vinyl chloride mg/l < 1 < 1 < 1 < 1<br />
Zinc mg/l 47.2 0.05 63 0.25
<strong>Parvin</strong> <strong>Branch</strong> <strong>and</strong> <strong>Tarkiln</strong> <strong>Branch</strong><br />
Watershed Restoration Master Plan<br />
November 30, 2006<br />
Soil Sampling Results<br />
Parameter Units SEDS SSN<br />
1, 1-dichloroethane ug/Kg < 620 < 620<br />
1, 1-dichloroethene ug/Kg < 620 < 620<br />
1,1,1,2-tetrachloroethane ug/Kg < 620 < 620<br />
1,1,1-trichloroethane ug/Kg < 620 < 620<br />
1,1,2,2-tetrachloroethane ug/Kg < 620 < 620<br />
1,1,2-trichloroethane ug/Kg < 620 < 620<br />
1,1-dichloropropene ug/Kg < 620 < 620<br />
1,2,3-trichlorobenzene ug/Kg < 370 < 620<br />
1,2,3-trichloropropane ug/Kg < 620 < 620<br />
1,2,4-trichlorobenzene ug/Kg < 320 < 620<br />
1,2,4-trimethylbenzene ug/Kg < 620 < 620<br />
1,2-dibromo-3-chloropropane ug/Kg < 620 < 620<br />
1,2-dibromoethane ug/Kg < 620 < 620<br />
1,2-dichlorobenzene ug/Kg < 620 < 620<br />
1,2-dichloroethane ug/Kg < 620 < 620<br />
1,2-dichloropropane ug/Kg < 620 < 620<br />
1,3,5-trimethyl benzene ug/Kg < 620 < 620<br />
1,3-dichlorobenzene ug/Kg < 620 < 620<br />
1,3-dichloropropane ug/Kg < 620 < 620<br />
1,4 dichlorobenzene ug/Kg < 620 < 620<br />
2-chlorotoluene ug/Kg < 620 < 620<br />
2-chlorovinyl ether ug/Kg < 620 < 620<br />
2-hexanone ug/Kg < 620 < 620<br />
4-chlorotoluene ug/Kg < 620 < 620<br />
Acetone ug/Kg < 1200 < 1200<br />
Acrolien ug/Kg < 620 < 620<br />
Acrylonitrile ug/Kg < 620 < 620<br />
Ammonia mg/kg < 8 < 8<br />
Antimony mg/kg < 1.7 < 1.4<br />
Arsenic mg/kg < 1.5 < 1.3<br />
benzene ug/Kg < 620 < 620<br />
Beryllium mg/kg < 0.05 < 0.029<br />
bromobenzene ug/Kg < 620 < 620<br />
bromochloromethane ug/Kg < 620 < 620<br />
bromodichloromethane ug/Kg < 620 < 620<br />
bromoform ug/Kg < 620 < 620<br />
bromomethane ug/Kg < 620 < 620<br />
Cadmium mg/kg < 0.17 < 0.14<br />
carbon disulfide ug/Kg < 620 < 620<br />
carbon tetrachloride ug/Kg < 620 < 620<br />
chlorobenzene ug/Kg < 620 < 620<br />
chloroethane ug/Kg < 620 < 620<br />
chloroform ug/Kg < 620 < 620<br />
chloromethane ug/Kg < 620 < 620<br />
Chromium mg/kg < 1.7 3.2<br />
Cis Dichloroethene ug/Kg < 620 < 620<br />
cis-1,3-dichloropropene ug/Kg < 620 < 620<br />
Copper mg/kg < 1.2 < 0.88<br />
dibromochloromehtane ug/Kg < 620 < 620<br />
dibromomethane ug/Kg < 620 < 620<br />
Dichlorodifuloromethane ug/Kg < 620 < 620<br />
Ethyl Ether ug/Kg < 620 < 620<br />
ethylbenzene ug/Kg < 620 < 620<br />
hexachlorobutadiene ug/Kg 1000 < 620<br />
Hexachloroethane ug/Kg < 620 < 620<br />
Iron mg/kg 1360 1750<br />
isopropyl benzene ug/Kg < 620 < 620<br />
Lead mg/kg 3.2 9.1<br />
m/p xylene ug/Kg < 620 < 620<br />
Manganese mg/kg 5.6 35.5<br />
Mercury mg/kg < 0.028 < 0.024<br />
methylene chloride ug/Kg < 620 < 620<br />
Methylethyl Ketone (MEK) ug/Kg < 620 < 620<br />
MIBK ug/Kg < 620 < 620<br />
naphthalene ug/Kg < 370 < 620<br />
n-butyl benzene ug/Kg < 240 < 620<br />
Nickel mg/kg < 1.3 < 1.9<br />
Nitrate mg/kg < 0.1 < 0.1<br />
Nitrite mg/kg < 0.1 < 0.1<br />
Nitrobenzene ug/Kg < 620 < 620<br />
n-propyl benzene ug/Kg < 620 < 620<br />
OrthoPhosphate mg/kg < 0.6 1.4<br />
o-xylene ug/Kg < 620 < 620<br />
Pentachloroethane ug/Kg < 620 < 620<br />
p-isopropyltoluene ug/Kg < 620 < 620<br />
sec-butylbenzene ug/Kg < 620 < 620
<strong>Parvin</strong> <strong>Branch</strong> <strong>and</strong> <strong>Tarkiln</strong> <strong>Branch</strong><br />
Watershed Restoration Master Plan<br />
November 30, 2006<br />
Soil Sampling Results<br />
Parameter Units SEDS SSN<br />
Selenium mg/kg < 1.6 < 1.4<br />
Silver mg/kg < 0.41 < 0.35<br />
styrene ug/Kg < 620 < 620<br />
tert-butylbenzyne ug/Kg < 620 < 620<br />
Tertiary Butyl Alcohol ug/Kg < 250 < 250<br />
tetrachloroethane ug/Kg < 620 < 620<br />
Thallium mg/kg < 1.6 < 1.4<br />
THF ug/Kg < 620 < 620<br />
toluene ug/Kg < 620 < 620<br />
Total Kjeldahl Nitrogen mg/kg 8.9 9.5<br />
Total Phosphorus mg/kg 32.3 49.6<br />
Total Solids % 58.7 69.1<br />
trans-1,2-dichloroethene ug/Kg < 620 < 620<br />
trans-1,3-dichoropropene ug/Kg < 620 < 620<br />
trichloroethene ug/Kg < 620 < 620<br />
Trichlorofluoromethane ug/Kg < 620 < 620<br />
vinyl chloride ug/Kg < 620 < 620<br />
Zinc mg/kg < 6 16.9
<strong>Parvin</strong> <strong>Branch</strong> <strong>and</strong> <strong>Tarkiln</strong> <strong>Branch</strong> Watershed Restoration Master Plan<br />
APPENDIX E<br />
Dry Weather Chemical Concentration Plots<br />
Watershed Sampling<br />
A monitoring plan was developed to gather surface water (<strong>Parvin</strong> <strong>Branch</strong> <strong>and</strong> <strong>Tarkiln</strong> <strong>Branch</strong>)<br />
<strong>and</strong> groundwater quality data. The monitoring plan included <strong>NJ</strong>DEP-approved sampling protocols for<br />
collecting physical <strong>and</strong> chemical data in these resources. Appropriate protocols, sampling points, <strong>and</strong><br />
schedules were selected for both wet weather (stormwater) <strong>and</strong> dry weather (base flow) sampling.<br />
Chemical analyses were completed by <strong>NJ</strong>DEP-certified laboratories as well as by volunteers using<br />
field sampling kits. Local volunteer groups were instrumental in completing the physical <strong>and</strong> chemical<br />
assessments of the stream, including visual assessments of flow.<br />
Surface water, groundwater <strong>and</strong> sediment sampling occurred at <strong>Parvin</strong> <strong>Branch</strong> <strong>and</strong> <strong>Tarkiln</strong><br />
<strong>Branch</strong> from May 2005 to April 2006. During this time, Citizens United to Protect the Maurice River<br />
<strong>and</strong> its tributaries (CUPMRT) <strong>and</strong> TRC Omni collected eleven (11) sets of surface water samples at the<br />
three chemical <strong>and</strong> biological stations, PB1, PB2 <strong>and</strong> TB1, one (1) set of sediment samples from SEDS<br />
<strong>and</strong> SSN <strong>and</strong> three (3) sets of groundwater samples at monitoring wells GWN <strong>and</strong> GWS.<br />
Water quality was measured at PB1, PB2, <strong>and</strong> TB1 on 14 dates between May 2005 <strong>and</strong> April<br />
2006. Water samples were analyzed for a number of st<strong>and</strong>ard water quality parameters including<br />
nitrogen (nitrate <strong>and</strong> ammonia), phosphorus (total <strong>and</strong> dissolved), dissolved oxygen, solids (total<br />
dissolved <strong>and</strong> total suspended), iron, pH, conductivity, <strong>and</strong> temperature. Results are in Appendix D<br />
<strong>and</strong> in the dry weather concentration figures found in Appendix E. Water quality was also measured<br />
in GWN <strong>and</strong> GWS on three dates in 2005. Samples were analyzed for st<strong>and</strong>ard water quality<br />
parameters <strong>and</strong> priority pollutants. Results are in Appendix D.<br />
Sediment samples from SEDN <strong>and</strong> SEDS were analyzed once for priority pollutants <strong>and</strong><br />
nutrients. Based on the results of the groundwater sampling, no significant contaminants were noted in<br />
the initial priority pollutant or metals scans. In accordance with the QAPP, no further samples were<br />
analyzed. Results are in Appendix D.
<strong>Parvin</strong> <strong>Branch</strong> <strong>and</strong> <strong>Tarkiln</strong> <strong>Branch</strong><br />
Watershed Restoration Master Plan<br />
November 30, 2006<br />
Dry Weather Concentration Plots<br />
Total Suspended Solids Concentration<br />
50<br />
45<br />
40<br />
Surface Water Quality St<strong>and</strong>ard<br />
Total Suspended Solids (mg/l)<br />
35<br />
30<br />
25<br />
20<br />
15<br />
10<br />
5<br />
0<br />
4/8/2005<br />
5/28/2005<br />
7/17/2005<br />
9/5/2005<br />
10/25/2005<br />
12/14/2005<br />
2/2/2006<br />
3/24/2006<br />
5/13/2006<br />
Date<br />
PB1 PB2 TB1<br />
Fecal Coliform Concentration<br />
7000<br />
6000<br />
Fecal Coliform (colonies/100ml)<br />
5000<br />
4000<br />
3000<br />
2000<br />
1000<br />
FW2-NT Surface Water Quality St<strong>and</strong>ards<br />
0<br />
4/8/2005<br />
5/28/2005<br />
7/17/2005<br />
9/5/2005<br />
10/25/2005<br />
12/14/2005<br />
2/2/2006<br />
3/24/2006<br />
5/13/2006<br />
Date<br />
PB1 PB2 TB1
<strong>Parvin</strong> <strong>Branch</strong> <strong>and</strong> <strong>Tarkiln</strong> <strong>Branch</strong><br />
Watershed Restoration Master Plan<br />
November 30, 2006<br />
Dry Weather Concentration Plots<br />
Total Phosphorus Concentration<br />
0.3<br />
0.25<br />
Total Phosphorus (mg/l)<br />
0.2<br />
0.15<br />
0.1<br />
Surface Water Quality St<strong>and</strong>ard<br />
0.05<br />
0<br />
4/8/2005<br />
5/28/2005<br />
7/17/2005<br />
9/5/2005<br />
10/25/2005<br />
12/14/2005<br />
2/2/2006<br />
3/24/2006<br />
5/13/2006<br />
Date<br />
PB1 PB2 TB1<br />
Dissolved Orthophosphate Concentration<br />
0.18<br />
0.16<br />
0.14<br />
Dissolved Orthophosphate (mg/l)<br />
0.12<br />
0.1<br />
0.08<br />
0.06<br />
0.04<br />
0.02<br />
0<br />
4/8/2005<br />
5/28/2005<br />
7/17/2005<br />
9/5/2005<br />
10/25/2005<br />
12/14/2005<br />
2/2/2006<br />
3/24/2006<br />
5/13/2006<br />
Date<br />
PB1 PB2 TB1
<strong>Parvin</strong> <strong>Branch</strong> <strong>and</strong> <strong>Tarkiln</strong> <strong>Branch</strong><br />
Watershed Restoration Master Plan<br />
November 30, 2006<br />
Dry Weather Concentration Plots<br />
Dissolved Oxygen Concentration<br />
15<br />
14<br />
13<br />
12<br />
11<br />
Dissolved Oxygen (mg/l)<br />
10<br />
9<br />
8<br />
7<br />
6<br />
5<br />
4<br />
Surface Water Quality St<strong>and</strong>ard<br />
3<br />
2<br />
1<br />
0<br />
4/8/2005<br />
5/28/2005<br />
7/17/2005<br />
9/5/2005<br />
10/25/2005<br />
12/14/2005<br />
2/2/2006<br />
3/24/2006<br />
5/13/2006<br />
Date<br />
PB1 PB2 TB1<br />
Total Dissolved Solids Concentration<br />
600<br />
500<br />
Surface Water Quality St<strong>and</strong>ard<br />
400<br />
TDS (mg/l)<br />
300<br />
200<br />
100<br />
0<br />
4/8/2005<br />
5/28/2005<br />
7/17/2005<br />
9/5/2005<br />
10/25/2005<br />
12/14/2005<br />
2/2/2006<br />
3/24/2006<br />
5/13/2006<br />
Date<br />
PB1 PB2 TB1
<strong>Parvin</strong> <strong>Branch</strong> <strong>and</strong> <strong>Tarkiln</strong> <strong>Branch</strong><br />
Watershed Restoration Master Plan<br />
November 30, 2006<br />
Dry Weather Concentration Plots<br />
Ammonia Concentration<br />
1.6<br />
1.4<br />
1.2<br />
Ammonia (mg/l)<br />
1<br />
0.8<br />
0.6<br />
0.4<br />
0.2<br />
0<br />
4/8/2005<br />
5/28/2005<br />
7/17/2005<br />
9/5/2005<br />
10/25/2005<br />
12/14/2005<br />
2/2/2006<br />
3/24/2006<br />
5/13/2006<br />
Date<br />
PB1 PB2 TB1<br />
Nitrate Concentration<br />
12<br />
10<br />
8<br />
Nitrate (mg/l)<br />
6<br />
4<br />
2<br />
0<br />
4/8/2005<br />
5/28/2005<br />
7/17/2005<br />
9/5/2005<br />
10/25/2005<br />
12/14/2005<br />
2/2/2006<br />
3/24/2006<br />
5/13/2006<br />
Date<br />
PB1 PB2 TB1
<strong>Parvin</strong> <strong>Branch</strong> <strong>and</strong> <strong>Tarkiln</strong> <strong>Branch</strong><br />
Watershed Restoration Master Plan<br />
November 30, 2006<br />
Dry Weather Concentration Plots<br />
Iron Concentration<br />
9<br />
8<br />
7<br />
6<br />
Iron (mg/l)<br />
5<br />
4<br />
3<br />
2<br />
1<br />
0<br />
4/8/2005<br />
5/28/2005<br />
7/17/2005<br />
9/5/2005<br />
10/25/2005<br />
12/14/2005<br />
2/2/2006<br />
3/24/2006<br />
5/13/2006<br />
Date<br />
PB1 PB2 TB1
<strong>Parvin</strong> <strong>Branch</strong> <strong>and</strong> <strong>Tarkiln</strong> <strong>Branch</strong> Watershed Restoration Master Plan<br />
APPENDIX F<br />
Benthic bioassessment metric values<br />
Benthic Macroinvertebrate Sampling<br />
Three sample sites were established: two on <strong>Parvin</strong> <strong>Branch</strong> (PB1 <strong>and</strong> PB2) <strong>and</strong> one on <strong>Tarkiln</strong><br />
<strong>Branch</strong> (TB1). These sites were sampled for benthic macroinvertebrates on June 9, 2005 <strong>and</strong> September<br />
5, 2005 <strong>and</strong> were also used for surface water monitoring. Benthic macroinvertebrate sampling was<br />
completed on June 9, 2005 by Citizens United to Protect the Maurice River <strong>and</strong> its Tributaries<br />
(CUPMRT) <strong>and</strong> TRC Omni Environmental Corp. (TRC Omni). During this sampling event, Dr. Amy<br />
Soli of TRC Omni provided training in benthic macroinvertebrate collection techniques. CUMPRT<br />
completed the benthic macroinvertebrate sampling on September 5, 2005.<br />
Benthic macroinvertebrates were collected using a 500 µm mesh kick-net. Invertebrates were<br />
collected by kicking a 1 m 2 area upstream of the kick-net in order to dislodge the invertebrates. Three 1<br />
m 2 areas representing a variety of habitats were sampled at each stream site; the invertebrates <strong>and</strong><br />
substrate collected were combined into one composite sample. Large pieces of substrate collected in the<br />
net were inspected for invertebrates (<strong>and</strong> discarded), as was the kick-net. Captured invertebrates were<br />
placed in bottles containing 80% ethanol <strong>and</strong> labels with site identification information. Vegetation (e.g.<br />
leafpacks) <strong>and</strong> substrate collected in the kick-net were also placed in the bottles for later inspection to<br />
remove organisms. A supplemental qualitative sample of coarse particulate organic matter (CPOM) was<br />
also collected at each site during each sampling episode <strong>and</strong> preserved separately in 80% ethanol.<br />
Various benthic metrics based on diversity <strong>and</strong> pollution tolerance were calculated following the<br />
guidelines of Barbour et al. (1999) <strong>and</strong> the <strong>NJ</strong>DEP’s BFBM RPB(2006, 2004) (Appendix H). Richness<br />
indices included taxa richness; Ephemeroptera, Plecoptera, <strong>and</strong> Trichoptera (EPT) richness; %EPT; <strong>and</strong><br />
% contribution dominant family (%CDF). EPT richness is the total number of Ephemeroptera,<br />
Plecoptera, <strong>and</strong> Trichoptera taxa in each sample; %EPT is percentage of the total number of organisms<br />
in each sample belonging to the EPT orders. The %CDF is the percentage of the total number of<br />
organisms in each sample in the numerically dominant family. Taxa were also classified as being<br />
tolerant, semi-tolerant, or intolerant to pollution based on Family Tolerance Values (FTV) provided by<br />
the <strong>NJ</strong>DEP BFBM. Using the FTV’s, the Modified Family Biotic Index (FBI) was calculated. The<br />
<strong>NJ</strong>DEP bases their FBI on that developed by Hilsenhoff (1988). The bioassessment indices (taxa<br />
richness, EPT, %EPT, %CDF, <strong>and</strong> FBI) were calculated for each site for each sampling date.<br />
The preserved benthic samples were later sorted in the laboratory. All Benthic<br />
macroinvertebrates were identified to the lowest practical taxonomic level, usually to family. Benthic<br />
macroinvertebrate sorting <strong>and</strong> identification was conducted by CUPMRT. Dr. Amy Soli of TRC Omni<br />
provided a quality
assurance check for the identification of benthic macroinvertebrate samples. Dr. Soli evaluated a<br />
minimum of 10% of the samples to verify proper identification of benthic macroinvertebrates. A list of<br />
taxa collected, <strong>and</strong> the number of individuals of each taxa, is located in Appendix H. Benthic<br />
macroinvertebrate data were analyzed using benthic metrics discussed in the US EPA’s Rapid<br />
Bioassessment Protocols manual (Barbour et al., 1999) <strong>and</strong> the <strong>NJ</strong>DEP’s Bureau of Freshwater <strong>and</strong><br />
Biological Monitoring’s (BFBM) Rapid Bioassessment Protocol (RBP).<br />
Benthic macroinvertebrate sampling yielded between 2 <strong>and</strong> 12 taxa <strong>and</strong> 6 <strong>and</strong> 123 individuals per<br />
site. With the exception of PB1 on 9/5/2005 <strong>and</strong> TB1 on 9/5/2005, the predominant taxon in each<br />
sample was Chironomidae (midge flies), a pollution tolerant organism. Physidae was the dominant<br />
taxon in the TB1 sample on 9/5/2005. Bivalvia (Pelecypoda) was the dominant taxon in the PB1 sample<br />
on 9/5/2005. Both Physidae <strong>and</strong> Bivalvia are pollution tolerant organisms. None of the samples<br />
contained members of the Ephemeroptera, Plecoptera, or Trichoptera. Ephemeroptera, Plecoptera, <strong>and</strong><br />
Trichoptera (the EPT taxa) are traditionally considered to be sensitive taxa <strong>and</strong> their presence implies<br />
minimal water quality impairment. While their absence cannot be used to prove poor water quality<br />
(since habitat, water temperature, <strong>and</strong> other physiochemical parameters may instead contribute to their<br />
absence), it does provide additional evidence of impaired water quality. Few semi-tolerant taxa were<br />
also found <strong>and</strong> included Dytiscids, Calopterygidae, Coenagrionidae, Aeshnidae, <strong>and</strong> Tipulidae.<br />
Appendix F shows the benthic bioassessment metric values. The benthic data was analyzed for<br />
five bioassessment indices: taxa richness, taxa richness, EPT richness, % CDF, % EPT, <strong>and</strong> the<br />
Hilsenhoff Family Biotic Index (FBI). These indices are used by the <strong>NJ</strong>DEP BFBM <strong>and</strong> are used to<br />
calculate the New Jersey Impairment Score (<strong>NJ</strong>IS). Taxa richness <strong>and</strong> EPT richness are measurements<br />
commonly used as indicators of water quality because decreases in these parameters indicate decreasing<br />
water quality. Percent dominance is of interest because a shift towards dominance by relatively few taxa<br />
indicates environmental stress. Percent EPT is measured because increases in this metric denote<br />
improved water quality. (Kurtz et al. 2000) Finally, the HFBI (a.k.a. the modified family biotic index)<br />
is used as an indicator of organic pollution, with lower HFBI values indicating a lower likelihood of<br />
organic pollution (Hilsenhoff 1988).<br />
As was mentioned, these five metrics are used by the <strong>NJ</strong>DEP to classify streams as being nonimpaired,<br />
moderately impaired, or severely impaired (<strong>NJ</strong>DEP 2004). The <strong>NJ</strong>IS for sample PB1 on<br />
6/9/2005 <strong>and</strong> the PB1 sample on 9/5/2005 was 6 <strong>and</strong> 15, respectively. Thus, the <strong>NJ</strong>IS indicated that<br />
PB1 was severely impaired on 6/9/2005 <strong>and</strong> moderately impaired on 9/5/2005. The <strong>NJ</strong>IS for samples<br />
PB2 on 6/9/2005 <strong>and</strong> 9/5/2005 was 3, indicating severely impaired conditions on both sampling dates.<br />
Finally, the <strong>NJ</strong>IS for the TB1 sample on 6/9/2005 was 9 <strong>and</strong> 6 from the 9/5/2005 sample. Thus, the<br />
<strong>NJ</strong>IS indicated that TB1 was moderately impaired on 6/9/2005 <strong>and</strong> severely impaired on 9/5/2005.<br />
The benthic macroinvertebrate data indicated impaired water quality at all stations on all sample<br />
dates. First, there were no sensitive taxa identified from any of the samples, especially the EPT taxa. In<br />
addition, taxa richness was relatively low; higher <strong>NJ</strong>IS are associated with taxa richness greater than 10.<br />
The %CDF also indicated impaired conditions; %CDF of less than 40 is associated with non-impaired<br />
(or relatively unimpaired) waters. The %CDF was less than 40 in only one sample- PB1 on 9/5/2005<br />
(one date with the moderately impaired classification). Finally, the FBI was always between 5.67 <strong>and</strong><br />
6.77. According to the <strong>NJ</strong>IS, these values indicate moderately impaired water quality. Hilsenhoff<br />
(1988) designates streams with HFBI values of between 5.76 <strong>and</strong> 6.50 to be of fairly poor water quality,<br />
indicating that substantial organic pollution is likely.
<strong>Parvin</strong> <strong>Branch</strong> <strong>and</strong> <strong>Tarkiln</strong> <strong>Branch</strong><br />
Watershed Restoration Master Plan<br />
November 30, 2006<br />
Benthic Survey Tables<br />
<strong>Parvin</strong> <strong>Branch</strong> <strong>and</strong> <strong>Tarkiln</strong> <strong>Branch</strong> Macroinvertebrate Taxa: Classification, Enumeration, <strong>and</strong> Bioassessment<br />
Indices<br />
Site PB1 PB1 PB2 PB2 TB1 TB1<br />
Date 6/9/2005 9/5/2005 6/9/2005 9/5/2005 6/9/2005 9/5/2005<br />
Sample (% Sorted) 100 100 100 100 100 100<br />
Taxon Description Total Total Total Total Total Total<br />
Simuliidae Blackflies 8 4<br />
Chironomidae Midges 75 9 19 5 68 8<br />
Dytiscidae Beetles 12 2<br />
Elmidae Beetles 1 4<br />
Haliplidae Beetles 9<br />
Calopterygidae Damselflies 11 2<br />
Coenagrionidae Damselflies 1 1<br />
Aeshnidae Dragonflies 1<br />
Amphipoda Scuds 2 1<br />
Asellidae Sowbug 1<br />
Physidae Snails 13 8 16 51<br />
Planorbidae Snails 1<br />
Bivalvia (Pelecypoda) Clams 4 22 1<br />
Oligochaeta Worms 7 8 4 20 1<br />
Cambaridae Crayfish 2<br />
Tipulidae Cranefly 1 2<br />
Culicidae Mosquito 1<br />
Collembola<br />
Springtail<br />
(semi-aquatic)<br />
1<br />
Egg Masses Yes Yes<br />
Cases<br />
Yes<br />
Salam<strong>and</strong>ers Yes Yes Yes<br />
Non-Macro. Taxa 3<br />
Taxa Richness 8 12 4 2 8 5<br />
Total Individuals a 110 78 26 6 123 64<br />
EPT 0 0 0 0 0 0<br />
%EPT 0 0 0 0 0 0<br />
% Dominant<br />
Family Contribution<br />
68.18 28.21 73.08 83.33 55.28 79.69<br />
Modified Family<br />
Boiotic Index<br />
6.30 6.44 6.23 5.67 6.41 6.77<br />
a) The <strong>NJ</strong>DEP does not include Total Individuals as a metric when calculating the <strong>NJ</strong>IS Score.
<strong>Parvin</strong> <strong>Branch</strong> <strong>and</strong> <strong>Tarkiln</strong> <strong>Branch</strong><br />
Watershed Restoration Master Plan<br />
November 30, 2006<br />
Benthic Survey Tables<br />
<strong>Parvin</strong> <strong>Branch</strong> <strong>and</strong> <strong>Tarkiln</strong> <strong>Branch</strong> Macroinvertebrate Taxa: Modified Family Biotic Index Calculations<br />
Site PB1 PB1 PB1 PB1 PB1 PB1 PB2 PB2 PB2 PB2 PB2 PB2 TB1 TB1 TB1 TB1 TB1 TB1<br />
Date 6/9/2005 6/9/2005 6/9/2005 9/5/2005 9/5/2005 9/5/2005 6/9/2005 6/9/2005 6/9/2005 9/5/2005 9/5/2005 9/5/2005 6/9/2005 6/9/2005 6/9/2005 9/5/2005 9/5/2005 9/5/2005<br />
Taxon Description Total<br />
Tolerance<br />
Score<br />
x i t i<br />
Total<br />
Tolerance<br />
Score<br />
x i t i<br />
Total<br />
Tolerance<br />
Score<br />
Simuliidae Blackflies 8 6 48 4 6 24<br />
Chironomidae Midges 75 6 450 9 6 54 19 6 114 5 6 30 68 6 408 8 6 48<br />
Dytiscidae Beetles 12 5 60 2 5 10<br />
Elmidae Beetles 1 4 4 4 4 16<br />
Haliplidae Beetles 9 5 45<br />
Calopterygidae Damselflies 11 5 55 2 5 10<br />
Coenagrionidae Damselflies 1 9 9 1 9 9<br />
Aeshnidae Dragonflies 1 3 3<br />
Amphipoda Scuds 2 4 8 1 4 4<br />
Asellidae Sowbug 1 8 8<br />
Physidae Snails 13 7 91 8 7 56 16 7 112 51 7 357<br />
Planorbidae Snails 1 6 6<br />
Bivalvia (Pelecypoda) Clams 4 8 32 22 8 176 1 8 8<br />
Oligochaeta Worms 7 8 56 8 8 64 4 8 32 20 8 160 1 8 8<br />
Cambaridae Crayfish 2 5 10<br />
Tipulidae Cranefly 1 3 3 2 3 6<br />
Culicidae Mosquito 1 8 8<br />
Collembola<br />
Springtail<br />
(semi-aquatic)<br />
1 10 10<br />
Total 110 693 78 502 26 162 6 34 123 788 64 433<br />
Modified Family<br />
Biotic Index<br />
6.30 6.44 6.23 5.67 6.41 6.77<br />
x i t i<br />
Total<br />
Tolerance<br />
Score<br />
x i t i<br />
Total<br />
Tolerance<br />
Score<br />
x i t i<br />
Total<br />
Tolerance<br />
Score<br />
x i t i
<strong>Parvin</strong> <strong>Branch</strong> <strong>and</strong> <strong>Tarkiln</strong> <strong>Branch</strong><br />
Watershed Restoration Master Plan<br />
November 30, 2006<br />
Benthic Survey Tables<br />
<strong>Parvin</strong> <strong>Branch</strong> <strong>and</strong> <strong>Tarkiln</strong> <strong>Branch</strong> Macroinvertebrate Taxa: <strong>NJ</strong>IS Score <strong>and</strong> Biological Assessment<br />
Site PB1 PB1 PB1 PB1 PB2 PB2 PB2 PB2 TB1 TB1 TB1 TB1<br />
Date 6/9/2005 6/9/2005 9/5/2005 9/5/2005 6/9/2005 6/9/2005 9/5/2005 9/5/2005 6/9/2005 6/9/2005 9/5/2005 9/5/2005<br />
Taxa Richness 8 3 12 6 4 0 2 0 8 3 5 3<br />
EPT 0 0 0 0 0 0 0 0 0 0 0 0<br />
%EPT 0 0 0 0 0 0 0 0 0 0 0 0<br />
% Dominant Family Contribution 68.18 0 28.21 6 73.08 0 83.33 0 55.28 3 79.69 0<br />
Family Boiotic Index 6.30 3 6.44 3 6.23 3 5.67 3 6.41 3 6.77 3<br />
<strong>NJ</strong>IS SCORE 6 15 3 3 9 6<br />
BIOLOGICAL ASSESSMENT Severly impaired Moderately Impaired Severly impaired Severly impaired Moderately Impaired Severly impaired<br />
Biometrics 6 3 0<br />
Taxa Richness >10 10-5 4-0<br />
E+P+T >5 5-3 2-0<br />
% CDF (% Percent Dominance) 60<br />
% EPT >35 35-10
Appendix G, In-Situ Data<br />
Citizens United preformed all the in-situ measurements for stream flow, pH, temperature, DO,<br />
specific conductance, <strong>and</strong> redox. Instrumentation used to perform in-situ measurements was properly<br />
calibrated in conformance with manufacture’s instructions, <strong>NJ</strong>DEP field sampling procedures, <strong>and</strong> EPA<br />
-B-97-003. This included the calibration of equipment before every sampling event <strong>and</strong> the disposal of<br />
all buffers after each calibration session. 13 sets of signed Chain of Custody documents were executed<br />
on the sample collection dates <strong>and</strong> are on file. All sampling containers were furnished by <strong>NJ</strong>AL. (See<br />
Appendix G for In-Situ data).<br />
PARVIN BRANCH AND TARKLIN BRANCH ASSESSMENT PROJECT (RP03-026)<br />
IN-SITU DATA LOG<br />
SAMPLING SITES<br />
PB2 PB1 TB1<br />
DATE pH TEMP C DO mg/L SC ORP FLOW pH TEMP C DO mg/L SC ORP FLOW pH TEMP C DO mg/L SC ORP FLOW<br />
5/26/2005 6.90 13.60 13.50 M 6.00 13.40 6.30 M 6.00 13.20 6.10 M<br />
6/9/2005 6.10 17.90 7.27 449.00 M 6.40 18.80 8.10 229.00 M 6.40 20.40 7.80 143.00 M<br />
6/24/2005 6.70 18.20 7.58 M-L 6.80 19.20 6.80 M-L 6.40 18.80 8.31 L<br />
7/27/2005 6.30 19.00 5.0 ppm M 6.00 20.20 6.6 ppm L 6.00 21.10 5.6 ppm M-L<br />
8/23/2005 6.60 17.20 5.5 ppm 600.00 M 6.30 18.70 6.8 ppm 221.00 L 6.10 19.60 4.4 ppm 78.60 L-<br />
9/5/2005 6.80 19.90 6.2 ppm 628.00 20.00 M 6.30 20.50 5.6 ppm 181.00 138.00 L- 6.30 22.70 4.8 ppm 84.40 81.00 L-<br />
9/23/2005 6.70 19.70 608.00 -9.00 M<br />
9/28/2005 6.53 16.30 5.0 ppm 602.00 -16.00 M 6.00 16.40 5.6 ppm 136.30 116.00 L-<br />
No Water<br />
9/29/2006 6.50 16.80 615.00 -3.00 M<br />
11/14/2005 6.99 14.70 6.0 ppm 558.00 -7.00 M 6.36 16.00 4.8 ppm 219.00 102.00 M 6.09 14.90 1.6 ppm 86.70 94.00 L<br />
12/5/2005 6.85 6.20 7.2 ppm 459.00 9.00 M 6.34 8.20 6.8 ppm 168.80 106.00 M 6.11 6.90 6.4 ppm 72.90 122.00 L+<br />
1/10/2006 6.77 8.40 6.8 ppm 518.00 5.00 M 6.22 10.00 6.8 ppm 192.60 103.00 M-L 5.98 9.70 8.1 ppm 97.40 123.00 L<br />
2/16/2006 6.87 8.60 7.4 ppm 504.00 11.00 M 6.19 10.50 8.6 ppm 212.00 132.00 M 5.98 12.00 9.4 ppm 130.10 144.00 L<br />
4/3/2006 6.86 11.40 6.8 ppm 507.00 25.00 M 6.18 11.00 8.2 ppm 203.00 151.00 M 5.83 10.80 8.2 ppm 78.70 173.00 L-M<br />
4/24/2006 6.77 14.30 6.6 ppm 237.00 33.00 M-H 6.48 14.80 6.1 ppm 96.00 125.00 M-H 6..41 14.80 6.0 ppm 65.10 130.00 L-M<br />
PARVIN BRANCH AND TARKLIN BRANCH ASSESSMENT PROJECT (RP03-026)<br />
IN-SITU DATA LOG<br />
SAMPLING SITES<br />
Site MS - Sherman Staff Gauge Directly above <strong>Parvin</strong> <strong>Branch</strong> on MR Site MA - Almond Ave. Reference Site<br />
GPS 39.4481 x -75.0722<br />
GPS 39.4488 x -75.0727 GPS 39.4955 x -75.0763<br />
DATE pH TEMP C DO mg/L SC ORP FLOW pH TEMP C DO mg/L SC ORP pH TEMP C DO mg/L SC ORP<br />
6/24/2005 6.70 4.48" 6.70<br />
7/27/2005 6.00 26.30 5.56"<br />
8/23/2005 6.48 20.80 149.30 5.30"<br />
9/5/2005 6.58 23.20 173.50 58.00 5.20" 6.63 22.70 118.90 110.00<br />
9/23/2005 6.69 23.40 155.10 75.00 6.68 22.70 124.50 75.00 6.64 23.50 95.10 140.00<br />
9/28/2005 6.73 17.90 147.00 64.00 5.15 6.75 18.30 119.50 81.00<br />
11/14/2005 6.60 12.90 157.50 76.00 5.60" 6.67 13.01 130.00 80.00 6.54 13.90 8.0 ppm 110.40 111.00<br />
12/5/2005 6.39 5.10 137.80 144.00 6.38" To Deep<br />
6.28 4.80 10.2 ppm 96.10 153.00<br />
1/10/2006 6.54 6.60 139.00 76.00 6.30" 6.55 7.50 117.80 81.00 6.18 6.80 9.2 ppm 100.80 145.00<br />
2/16/2006 6.77 8.60 148.10 67.00 6.32" 6.39 7.70 135.00 168.00 6.45 9.70 10.5 ppm 111.80 153.00<br />
4/3/2006 6.90 12.10 133.40 89.00 5.74" 6.86 11.10 120.50 89.00 6.52 12.30 9.0 ppm 105.00 160.00<br />
4/24/2006 6.77 15.50 111.60 88.00 6.36" 6.79 15.20 105.80 90.00 6.31 15.20 6.1 ppm 88.10 153.00<br />
5/30/2006 6.66 25.30 149.20 85.00 5.56" 6.54 26.40 97.00 130.00
<strong>Parvin</strong> <strong>Branch</strong> Project Data Comparison<br />
Water Quality Data at Monitoring site PB2 compared to Water Quality Data at ANO740<br />
PB2<br />
MR/Almond Ave. Reference Site (ANO740)<br />
GPS 39.4496 x -75.0721 GPS 39.4955 x -75.0763<br />
DATE pH TEMP C DO mg/L SC ORP FLOW pH TEMP C DO mg/L SC ORP FLOW<br />
9/23/2005 6.70 19.70 608.00 -9.00 M 6.64 23.50 95.10 140.00<br />
9/28/2005 6.53 16.30 5.0 ppm 602.00 -16.00 M<br />
9/29/2006 6.50 16.80 615.00 -3.00 M<br />
11/14/2005 6.99 14.70 6.0 ppm 558.00 -7.00 M 6.54 13.90 8.0 ppm 110.40 111.00<br />
1/10/2006 6.77 8.40 6.8 ppm 518.00 5.00 M 6.18 6.80 9.2 ppm 100.80 145.00<br />
2/16/2006 6.87 8.60 7.4 ppm 504.00 11.00 M 6.45 9.70 10.5 ppm 111.80 153.00<br />
4/3/2006 6.86 11.40 6.8 ppm 507.00 25.00 M 6.52 12.30 9.0 ppm 105.00 160.00<br />
4/24/2006 6.77 14.30 6.6 ppm 237.00 33.00 M-H 6.31 15.20 6.1 ppm 88.10 153.00 2.95"<br />
<strong>Parvin</strong> <strong>Branch</strong> Project Data Comparison<br />
Water Quality Data at Monitoring site PB2 compared to Water Quality Data at ANO751<br />
PB2<br />
Sherman Staff Gauge (ANO751)<br />
GPS 39.4496 x -75.0721<br />
GPS 39.4481 x -75.0722<br />
DATE pH TEMP C DO mg/L SC ORP FLOW pH TEMP C DO mg/L SC ORP FLOW<br />
5/26/2005 6.90 13.60 13.50 M<br />
6/9/2005 6.10 17.90 7.27 449.00 M<br />
6/24/2005 6.70 18.20 7.58 M-L 6.70 4.48"<br />
7/27/2005 6.30 19.00 5.0 ppm M 6.00 26.30 5.56"<br />
8/23/2005 6.60 17.20 5.5 ppm 600.00 M 6.48 20.80 149.30 5.30"<br />
9/5/2005 6.80 19.90 6.2 ppm 628.00 20.00 M 6.58 23.20 173.50 58.00 5.20"<br />
9/23/2005 6.70 19.70 608.00 -9.00 M 6.69 23.40 155.10 75.00<br />
9/28/2005 6.53 16.30 5.0 ppm 602.00 -16.00 M<br />
9/29/2006 6.50 16.80 615.00 -3.00 M<br />
11/14/2005 6.99 14.70 6.0 ppm 558.00 -7.00 M 6.60 12.90 157.50 76.00 5.60"<br />
1/10/2006 6.77 8.40 6.8 ppm 518.00 5.00 M 6.54 6.60 139.00 76.00 6.30"<br />
2/16/2006 6.87 8.60 7.4 ppm 504.00 11.00 M 6.77 8.60 148.10 67.00 6.32"<br />
4/3/2006 6.86 11.40 6.8 ppm 507.00 25.00 M 6.90 12.10 133.40 89.00 5.74"<br />
4/24/2006 6.77 14.30 6.6 ppm 237.00 33.00 M-H 6.77 15.50 111.60 88.00 6.36"<br />
5/30/2006 6.66 25.30 149.20 85.00 5.56
<strong>Parvin</strong> <strong>Branch</strong> Project Data Comparison<br />
Water Quality Data at Monitoring site PB2 compared to Water Quality Data at TB1<br />
PB2<br />
PB1<br />
GPS 39.4496 x -75.0721<br />
DATE pH TEMP C DO mg/L SC ORP FLOW pH TEMP C DO mg/L SC ORP FLOW<br />
5/26/2005 6.90 13.60 13.50 M 6.00 13.40 6.30 M<br />
6/9/2005 6.10 17.90 7.27 449.00 M 6.40 18.80 8.10 229.00 M<br />
6/24/2005 6.70 18.20 7.58 M-L 6.80 19.20 6.80 M-L<br />
7/27/2005 6.30 19.00 5.0 ppm M 6.00 20.20 6.6 ppm L<br />
8/23/2005 6.60 17.20 5.5 ppm 600.00 M 6.30 18.70 6.8 ppm 221.00 L<br />
9/5/2005 6.80 19.90 6.2 ppm 628.00 20.00 M 6.30 20.50 5.6 ppm 181.00 138.00 L-<br />
9/23/2005 6.70 19.70 608.00 -9.00 M<br />
9/28/2005 6.53 16.30 5.0 ppm 602.00 -16.00 M 6.00 16.40 5.6 ppm 136.30 116.00 L-<br />
9/29/2006 6.50 16.80 615.00 -3.00 M<br />
11/14/2005 6.99 14.70 6.0 ppm 558.00 -7.00 M 6.36 16.00 4.8 ppm 219.00 102.00 M<br />
1/10/2006 6.77 8.40 6.8 ppm 518.00 5.00 M 6.22 10.00 6.8 ppm 192.60 103.00 M-L<br />
2/16/2006 6.87 8.60 7.4 ppm 504.00 11.00 M 6.19 10.50 8.6 ppm 212.00 132.00 M<br />
4/3/2006 6.86 11.40 6.8 ppm 507.00 25.00 M 6.18 11.00 8.2 ppm 203.00 151.00 M<br />
4/24/2006 6.77 14.30 6.6 ppm 237.00 33.00 M-H 6.48 14.80 6.1 ppm 96.00 125.00 M-H<br />
<strong>Parvin</strong> <strong>Branch</strong> Project Data Comparison<br />
Water Quality Data at Monitoring site PB2 compared to Water Quality Data at TB1<br />
PB2<br />
TB1<br />
GPS 39.4496 x -75.0721<br />
DATE pH TEMP C DO mg/L SC ORP FLOW pH TEMP C DO mg/L SC ORP FLOW<br />
5/26/2005 6.90 13.60 13.50 M 6.00 13.20 6.10 M<br />
6/9/2005 6.10 17.90 7.27 449.00 M 6.40 20.40 7.80 143.00 M<br />
6/24/2005 6.70 18.20 7.58 M-L 6.40 18.80 8.31 L<br />
7/27/2005 6.30 19.00 5.0 ppm M 6.00 21.10 5.6 ppm M-L<br />
8/23/2005 6.60 17.20 5.5 ppm 600.00 M 6.10 19.60 4.4 ppm 78.60 L-<br />
9/5/2005 6.80 19.90 6.2 ppm 628.00 20.00 M 6.30 22.70 4.8 ppm 84.40 81.00 L-<br />
9/23/2005 6.70 19.70 608.00 -9.00 M<br />
9/28/2005 6.53 16.30 5.0 ppm 602.00 -16.00 M<br />
No Water<br />
9/29/2006 6.50 16.80 615.00 -3.00 M<br />
11/14/2005 6.99 14.70 6.0 ppm 558.00 -7.00 M 6.09 14.90 1.6 ppm 86.70 94.00 L<br />
1/10/2006 6.77 8.40 6.8 ppm 518.00 5.00 M 5.98 9.70 8.1 ppm 97.40 123.00 L<br />
2/16/2006 6.87 8.60 7.4 ppm 504.00 11.00 M 5.98 12.00 9.4 ppm 130.10 144.00 L<br />
4/3/2006 6.86 11.40 6.8 ppm 507.00 25.00 M 5.83 10.80 8.2 ppm 78.70 173.00 L-M<br />
4/24/2006 6.77 14.30 6.6 ppm 237.00 33.00 M-H 6..41 14.80 6.0 ppm 65.10 130.00 L-M
<strong>Parvin</strong> <strong>Branch</strong> Project Data Comparison<br />
Water Quality Data at Monitoring site PB1 compared to Water Quality Data at ANO740<br />
PB1<br />
MR/Almond Ave. Reference Site (ANO740)<br />
GPS 39.4955 x -75.0763<br />
DATE pH TEMP C DO mg/L SC ORP FLOW pH TEMP C DO mg/L SC ORP FLOW<br />
9/23/2005 6.64 23.50 95.10 140.00<br />
9/28/2005 6.00 16.40 5.6 ppm 136.30 116.00 L-<br />
9/29/2006<br />
11/14/2005 6.36 16.00 4.8 ppm 219.00 102.00 M 6.54 13.90 8.0 ppm 110.40 111.00<br />
1/10/2006 6.22 10.00 6.8 ppm 192.60 103.00 M-L 6.18 6.80 9.2 ppm 100.80 145.00<br />
2/16/2006 6.19 10.50 8.6 ppm 212.00 132.00 M 6.45 9.70 10.5 ppm 111.80 153.00<br />
4/3/2006 6.18 11.00 8.2 ppm 203.00 151.00 M 6.52 12.30 9.0 ppm 105.00 160.00<br />
4/24/2006 6.48 14.80 6.1 ppm 96.00 125.00 M-H 6.31 15.20 6.1 ppm 88.10 153.00 2.95"<br />
<strong>Parvin</strong> <strong>Branch</strong> Project Data Comparison<br />
Water Quality Data at Monitoring site PB1 compared to Water Quality Data at TB1<br />
PB1<br />
TB1<br />
DATE pH TEMP C DO mg/L SC ORP FLOW pH TEMP C DO mg/L SC ORP FLOW<br />
5/26/2005 6.00 13.40 6.30 M 6.00 13.20 6.10 M<br />
6/9/2005 6.40 18.80 8.10 229.00 M 6.40 20.40 7.80 143.00 M<br />
6/24/2005 6.80 19.20 6.80 M-L 6.40 18.80 8.31 L<br />
7/27/2005 6.00 20.20 6.6 ppm L 6.00 21.10 5.6 ppm M-L<br />
8/23/2005 6.30 18.70 6.8 ppm 221.00 L 6.10 19.60 4.4 ppm 78.60 L-<br />
9/5/2005 6.30 20.50 5.6 ppm 181.00 138.00 L- 6.30 22.70 4.8 ppm 84.40 81.00 L-<br />
9/23/2005<br />
9/28/2005 6.00 16.40 5.6 ppm 136.30 116.00 L-<br />
No Water<br />
9/29/2006<br />
11/14/2005 6.36 16.00 4.8 ppm 219.00 102.00 M 6.09 14.90 1.6 ppm 86.70 94.00 L<br />
1/10/2006 6.22 10.00 6.8 ppm 192.60 103.00 M-L 5.98 9.70 8.1 ppm 97.40 123.00 L<br />
2/16/2006 6.19 10.50 8.6 ppm 212.00 132.00 M 5.98 12.00 9.4 ppm 130.10 144.00 L<br />
4/3/2006 6.18 11.00 8.2 ppm 203.00 151.00 M 5.83 10.80 8.2 ppm 78.70 173.00 L-M<br />
4/24/2006 6.48 14.80 6.1 ppm 96.00 125.00 M-H 6..41 14.80 6.0 ppm 65.10 130.00 L-M
National Water <strong>and</strong> Climate Center<br />
Technical Note 99–1<br />
United States<br />
Department of<br />
Agriculture<br />
Natural<br />
Resources<br />
Conservation<br />
Service<br />
Stream Visual<br />
Assessment Protocol
Issued December 1998<br />
Cover photo:<br />
Stream in Clayton County, Iowa, exhibiting an impaired<br />
riparian zone.<br />
The U. S. Department of Agriculture (USDA) prohibits discrimination in its<br />
programs on the basis of race, color, national origin, gender, religion, age,<br />
disability, political beliefs, sexual orientation, <strong>and</strong> marital or family status.<br />
(Not all prohibited bases apply to all programs.) Persons with disabilities<br />
who require alternative means for communication of program information<br />
(Braille, large print, audiotape, etc.) should contact USDA’s TARGET Center<br />
at (202) 720-2600 (voice <strong>and</strong> TDD).<br />
To file a complaint of discrimination, write USDA, Director, Office of Civil<br />
Rights, Room 326W, Whitten Building, 14th <strong>and</strong> Independence Avenue, SW,<br />
Washington, DC 20250-9410 or call (202) 720-5964 (voice or TDD). USDA is<br />
an equal opportunity provider <strong>and</strong> employer.<br />
(NWCC Technical Note 99–1, Stream Visual Assessment Protocol, December 1998)
Preface<br />
This document presents an easy-to-use assessment protocol to evaluate the<br />
condition of aquatic ecosystems associated with streams. The protocol does<br />
not require expertise in aquatic biology or extensive training. Least-impacted<br />
reference sites are used to provide a st<strong>and</strong>ard of comparison. The<br />
use of reference sites is variable depending on how the state chooses to<br />
implement the protocol. The state may modify the protocol based on a<br />
system of stream classification <strong>and</strong> a series of reference sites. Instructions<br />
for modifying the protocol are provided in the technical information section.<br />
Aternatively, a user may use reference sites in a less structured manner<br />
as a point of reference when applying the protocol.<br />
The Stream Visual Assessment Protocol is the first level in a hierarchy of<br />
ecological assessment protocols. More sophisticated assessment methods<br />
may be found in the Stream Ecological Assessment Field H<strong>and</strong>book. The<br />
field h<strong>and</strong>book also contains background information on basic stream<br />
ecology. Information on chemical monitoring of surface water <strong>and</strong> groundwater<br />
may be found in the National H<strong>and</strong>book of Water Quality Monitoring.<br />
The protocol is designed to be conducted with the l<strong>and</strong>owner. Educational<br />
material is incorporated into the protocol. The document is structured so<br />
that the protocol (pp. 7–20) can be duplicated to provide a copy to the<br />
l<strong>and</strong>owner after completion of an assessment. The assessment is recorded<br />
on a single sheet of paper (copied front <strong>and</strong> back).<br />
(NWCC Technical Note 99–1, Stream Visual Assessment Protocol, December 1998)<br />
i
Acknowledgments<br />
This protocol was developed by the Natural Resources Conservation Service<br />
(NRCS) Aquatic Assessment Workgroup. The principal authors were<br />
Bruce Newton, limnologist, National Water <strong>and</strong> Climate Center, NRCS,<br />
Portl<strong>and</strong>, OR; Dr. Catherine Pringle, associate professor of Aquatic<br />
Ecology, University of Georgia, Athens, GA; <strong>and</strong> Ronald Bjorkl<strong>and</strong>, University<br />
of Georgia, Athens, GA. The NRCS Aquatic Assessment Workgroup<br />
members provided substantial assistance in development, field evaluation,<br />
<strong>and</strong> critical review of the document. These members were:<br />
Tim Dunne, biologist, NRCS, Ann<strong>and</strong>ale, <strong>NJ</strong><br />
Ray Erickson, area biologist, NRCS, Texarkana, AR<br />
Chris Faulkner, aquatic biologist, USEPA, Washington, DC<br />
Howard Hankin, aquatic ecologist, Ecological Sciences Division, NRCS,<br />
Washington, DC<br />
Louis Justice, state biologist, NRCS, Athens, GA<br />
Betty McQuaid, soil ecologist, Watershed Science Institute, NRCS,<br />
Raleigh, NC<br />
Marcus Miller, wetl<strong>and</strong>s specialist, Northern Plains Riparian Team, NRCS,<br />
Bozeman, MT<br />
Lyn Sampson, state biologist, NRCS, East Lansing, MI<br />
Terri Skadel<strong>and</strong>, state biologist, NRCS, Lakewood, CO<br />
Kathryn Staley, fisheries biologist, Wildlife Habitat Management<br />
Institute, NRCS, Corvallis, OR<br />
Bianca Streif, state biologist, NRCS, Portl<strong>and</strong>, OR<br />
Billy Teels, director, Wetl<strong>and</strong>s Science Institute, NRCS, Laurel, MD<br />
Additional assistance was provided by Janine Castro, geomorphologist,<br />
NRCS, Portl<strong>and</strong>, OR; Mark Schuller, fisheries biologist, NRCS, Spokane,<br />
WA; Lyle Steffen, geologist, NRCS, Lincoln, NE; <strong>and</strong> Lyn Townsend,<br />
forest ecologist, NRCS, Seattle, WA.<br />
ii (NWCC Technical Note 99–1, Stream Visual Assessment Protocol, December 1998)
Contents: Introduction 1<br />
What makes for a healthy stream? 1<br />
What's the stream type? 1<br />
Reference sites 2<br />
Using this protocol 3<br />
Reach description 6<br />
Scoring descriptions 7<br />
Channel condition ................................................................................................................. 7<br />
Hydrologic alteration ............................................................................................................ 8<br />
Riparian zone ......................................................................................................................... 9<br />
Bank stability ....................................................................................................................... 10<br />
Water appearance ............................................................................................................... 11<br />
Nutrient enrichment ........................................................................................................... 12<br />
Barriers to fish movement ................................................................................................. 12<br />
Instream fish cover ............................................................................................................. 13<br />
Pools ..................................................................................................................................... 14<br />
Insect/invertebrate habitat ................................................................................................. 14<br />
Canopy cover ....................................................................................................................... 15<br />
Coldwater fishery ...................................................................................................... 15<br />
Warmwater fishery ................................................................................................... 15<br />
Manure presence ................................................................................................................. 16<br />
Salinity .................................................................................................................................. 16<br />
Riffle embeddedness .......................................................................................................... 17<br />
Macroinvertebrates observed ............................................................................................ 17<br />
Technical information to support implementation 21<br />
Introduction ......................................................................................................................... 21<br />
Origin of the protocol ......................................................................................................... 21<br />
Context for use .................................................................................................................... 21<br />
Development ........................................................................................................................ 21<br />
Implementation ................................................................................................................... 22<br />
Instructions for modification............................................................................................. 22<br />
References 25<br />
Glossary 27<br />
(NWCC Technical Note 99–1, Stream Visual Assessment Protocol, December 1998)<br />
iii
Appendix A—1997 <strong>and</strong> 1998 Field Trial Results 31<br />
Purpose <strong>and</strong> methods ......................................................................................................... 31<br />
Results .................................................................................................................................. 31<br />
Discussion ............................................................................................................................ 34<br />
Tables Table A–1 Summary of studies in the field trial 31<br />
Table A–2 Summary of replication results 32<br />
Table A–3 Accuracy comparison data from studies with too few sites 33<br />
to determine a correlation coefficient<br />
Figures Figure 1 Factors that influence the integrity of streams 2<br />
Figure 2 Stream visual assessment protocol worksheet 4<br />
Figure 3 Baseflow, bankfull, <strong>and</strong> flood plain locations (Rosgen 1996) 6<br />
Figure 4 Relationship of various stream condition assessment 22<br />
methods in terms of complexity or expertise required<br />
<strong>and</strong> the aspects of stream condition addressed<br />
Figure A–1 Means <strong>and</strong> st<strong>and</strong>ard deviations from the Parker’s Mill 32<br />
Creek site in Americus, GA<br />
Figure A–2 Correlation between SVAP <strong>and</strong> IBI values in the Virginia 33<br />
study<br />
Figure A–3 Correlation between SVAP <strong>and</strong> Ohio Qualitative Habitat 33<br />
Evaluation Index values in the Virginia study<br />
Figure A–4 Correlation between SVAP <strong>and</strong> IBI values in the Carolinas 33<br />
study<br />
Figure A–5 Correlation between SVAP <strong>and</strong> macroinverte-brate index 33<br />
values in Carolinas study<br />
Figure A–6 Version 4 scores for VA plotted against version 3 scores 34<br />
iv (NWCC Technical Note 99–1, Stream Visual Assessment Protocol, December 1998)
Stream Visual Assessment Protocol<br />
Introduction<br />
This assessment protocol provides a basic level of<br />
stream health evaluation. It can be successfully applied<br />
by conservationists with little biological or<br />
hydrological training. It is intended to be conducted<br />
with the l<strong>and</strong>owner <strong>and</strong> incorporates talking points for<br />
the conservationist to use during the assessment. This<br />
protocol is the first level in a four-part hierarchy of<br />
assessment protocols. Tier 2 is the NRCS Water Quality<br />
Indicators Guide, Tier 3 is the NRCS Stream Ecological<br />
Assessment Field H<strong>and</strong>book, <strong>and</strong> Tier 4 is the<br />
intensive bioassessment protocol used by your State<br />
water quality agency.<br />
This protocol provides an assessment based primarily<br />
on physical conditions within the assessment area. It<br />
may not detect some resource problems caused by<br />
factors located beyond the area being assessed. The<br />
use of higher tier methods is required to more fully<br />
assess the ecological condition <strong>and</strong> to detect problems<br />
originating elsewhere in the watershed. However,<br />
most l<strong>and</strong>owners are mainly interested in evaluating<br />
conditions on their l<strong>and</strong>, <strong>and</strong> this protocol is well<br />
suited to supporting that objective.<br />
What makes for a healthy<br />
stream?<br />
A stream is a complex ecosystem in which several<br />
biological, physical, <strong>and</strong> chemical processes interact.<br />
Changes in any one characteristic or process have<br />
cascading effects throughout the system <strong>and</strong> result in<br />
changes to many aspects of the system.<br />
Some of the factors that influence <strong>and</strong> determine the<br />
integrity of streams are shown in figure 1. Often several<br />
factors can combine to cause profound changes.<br />
For example, increased nutrient loads alone might not<br />
cause a change to a forested stream. But when combined<br />
with tree removal <strong>and</strong> channel widening, the<br />
result is to shift the energy dynamics from an aquatic<br />
biological community based on leaf litter inputs to one<br />
based on algae <strong>and</strong> macrophytes. The resulting chemical<br />
changes caused by algal photosynthesis <strong>and</strong> respiration<br />
<strong>and</strong> elevated temperatures may further contribute<br />
to a completely different biological community.<br />
Many stream processes are in a delicate balance. For<br />
example, stream power, sediment load, <strong>and</strong> channel<br />
roughness must be in balance. Hydrologic changes<br />
that increase stream power, if not balanced by greater<br />
channel complexity <strong>and</strong> roughness, result in "hungry"<br />
water that erodes banks or the stream bottom. Increases<br />
in sediment load beyond the transport capacity<br />
of the stream leads to deposition, lateral channel<br />
movement into streambanks, <strong>and</strong> channel widening.<br />
Most systems would benefit from increased complexity<br />
<strong>and</strong> diversity in physical structure. Structural<br />
complexity is provided by trees fallen into the channel,<br />
overhanging banks, roots extending into the flow,<br />
pools <strong>and</strong> riffles, overhanging vegetation, <strong>and</strong> a variety<br />
of bottom materials. This complexity enhances habitat<br />
for organisms <strong>and</strong> also restores hydrologic properties<br />
that often have been lost.<br />
Chemical pollution is a factor in most streams. The<br />
major categories of chemical pollutants are oxygen<br />
depleting substances, such as manure, ammonia, <strong>and</strong><br />
organic wastes; the nutrients nitrogen <strong>and</strong> phosphorus;<br />
acids, such as from mining or industrial activities;<br />
<strong>and</strong> toxic materials, such as pesticides <strong>and</strong> salts or<br />
metals contained in some drain water. It is important<br />
to note that the effects of many chemicals depend on<br />
several factors. For example, an increase in the pH<br />
caused by excessive algal <strong>and</strong> aquatic plant growth<br />
may cause an otherwise safe concentration of ammonia<br />
to become toxic. This is because the equilibrium<br />
concentrations of nontoxic ammonium ion <strong>and</strong> toxic<br />
un-ionized ammonia are pH-dependent.<br />
Finally, it is important to recognize that streams <strong>and</strong><br />
flood plains need to operate as a connected system.<br />
Flooding is necessary to maintain the flood plain<br />
biological community <strong>and</strong> to relieve the erosive force<br />
of flood discharges by reducing the velocity of the<br />
water. Flooding <strong>and</strong> bankfull flows are also essential<br />
for maintaining the instream physical structure. These<br />
events scour out pools, clean coarser substrates<br />
(gravel, cobbles, <strong>and</strong> boulders) of fine sediment, <strong>and</strong><br />
redistribute or introduce woody debris.<br />
What's the stream type?<br />
A healthy stream will look <strong>and</strong> function differently in<br />
different parts of the country <strong>and</strong> in different parts of<br />
the l<strong>and</strong>scape. A mountain stream in a shale bedrock<br />
(NWCC Technical Note 99–1, Stream Visual Assessment Protocol, December 1998) 1
is different from a valley stream in alluvial deposits.<br />
Coastal streams are different from piedmont streams.<br />
Figuring out the different types of streams is called<br />
stream classification. Determining what types of<br />
streams are in your area is important to assessing the<br />
health of a particular stream.<br />
There are many stream classification systems. For the<br />
purpose of a general assessment based on biology <strong>and</strong><br />
habitat, you should think in terms of a three-level<br />
classification system based on ecoregion, drainage<br />
area, <strong>and</strong> gradient. Ecoregions are geographic areas in<br />
which ecosystems are expected to be similar. A national-level<br />
ecoregion map is available, <strong>and</strong> many<br />
states are working to develop maps at a higher level of<br />
resolution. Drainage area is the next most important<br />
factor to defining stream type. Finally, the slope or<br />
gradient of the reach you are assessing will help you<br />
determine the stream type. If you are familiar with<br />
another classification system, such as Rosgen or<br />
Montgomery/Buffington, you should use that system.<br />
This protocol may have been adjusted by your state<br />
office to reflect stream types common in your area.<br />
Reference sites<br />
One of the most difficult issues associated with stream<br />
ecosystems is the question of historic <strong>and</strong> potential<br />
conditions. To assess stream health, we need a benchmark<br />
of what the healthy condition is. We can usually<br />
assume that historic conditions were healthy. But in<br />
areas where streams have been degraded for 150 years<br />
or more, knowledge of historic conditions may have<br />
been lost. Moreover, in many areas returning to historic<br />
conditions is impossible or the historic conditions<br />
would not be stable under the current hydrology.<br />
Therefore, the question becomes what is the best we<br />
can expect for a particular stream. Scientists have<br />
grappled with this question for a long time, <strong>and</strong> the<br />
Figure 1 Factors that influence the integrity of streams (modified from Karr 1986)<br />
Solubilities Alkalinity<br />
Temperature<br />
Velocity<br />
Adsorption<br />
D.O.<br />
L<strong>and</strong> use<br />
High/low<br />
extremes<br />
Nutrients<br />
Organics<br />
Chemical<br />
variables<br />
Hardness<br />
pH<br />
Turbidity<br />
Ground<br />
water<br />
Flow<br />
Regime<br />
Precipitation<br />
& runoff<br />
Disease<br />
Parasitism<br />
Feeding<br />
Biotic<br />
factors<br />
Reproduction<br />
Competition<br />
Water<br />
resource<br />
integrity<br />
Predation<br />
Nutrients<br />
Sunlight<br />
Organic matter<br />
inputs<br />
Energy<br />
source<br />
1° <strong>and</strong> 2°<br />
Production<br />
Seasonal<br />
cycles<br />
Siltation<br />
Sinuosity<br />
Riparian<br />
vegetation<br />
Habitat<br />
structure<br />
Current<br />
Canopy<br />
Substrate<br />
Width/depth<br />
Bank stability<br />
Channel<br />
morphology<br />
Instream<br />
cover<br />
Gradient<br />
2 (NWCC Technical Note 99–1, Stream Visual Assessment Protocol, December 1998)
consensus that has emerged is to use reference sites<br />
within a classification system.<br />
Reference sites represent the best conditions attainable<br />
within a particular stream class. The identification<br />
<strong>and</strong> characterization of reference sites is an<br />
ongoing effort led in most states by the water quality<br />
agency. You should determine whether your state has<br />
identified reference sites for the streams in your area.<br />
Such reference sites could be in another county or in<br />
another state. Unless your state office has provided<br />
photographs <strong>and</strong> other descriptive information, you<br />
should visit some reference sites to learn what healthy<br />
streams look like as part of your skills development.<br />
Visiting reference sites should also be part of your<br />
orientation after a move to a new field office.<br />
Using this protocol<br />
This protocol is intended for use in the field with the<br />
l<strong>and</strong>owner. Conducting the assessment with the l<strong>and</strong>owner<br />
gives you the opportunity to discuss natural<br />
resource concerns <strong>and</strong> conservation opportunities.<br />
Before conducting the assessment, you should determine<br />
the following information in the field office:<br />
• ecoregion (if in use in your State)<br />
• drainage area<br />
• stream gradients on the property<br />
• overall position on the l<strong>and</strong>scape<br />
Your opening discussion with l<strong>and</strong>owners should start<br />
by acknowledging that they own the l<strong>and</strong> <strong>and</strong> that you<br />
underst<strong>and</strong> that they know their operation best. Point<br />
out that streams, from small creeks to large rivers, are<br />
a resource that runs throughout the l<strong>and</strong>scape—how<br />
they manage their part of the stream affects the entire<br />
system. Talk about the benefits of healthy streams <strong>and</strong><br />
watersheds (improved baseflow, forage, fish, waterfowl,<br />
wildlife, aesthetics, reduced flooding downstream,<br />
<strong>and</strong> reduced water pollution). Talk about how<br />
restoring streams to a healthy condition is now a<br />
national priority.<br />
Explain what will happen during the assessment <strong>and</strong><br />
what you expect from them. An example follows:<br />
This assessment will tell us how your stream is<br />
doing. We’ll need to look at sections of the stream that<br />
are representative of different conditions. As we do<br />
the assessment we’ll discuss how the functioning of<br />
different aspects of the stream work to keep the system<br />
healthy. After we’re done, we can talk about the<br />
results of the assessment. I may recommend further<br />
assessment work to better underst<strong>and</strong> what’s going<br />
on. Once we underst<strong>and</strong> what is happening, we can<br />
explore what you would like to accomplish with your<br />
stream <strong>and</strong> ideas for improving its condition, if<br />
necessary.<br />
You need to assess one or more representative<br />
reaches. A reach is a length of stream. For this protocol,<br />
the length of the assessment reach is 12 times the<br />
active channel width. The reach should be representative<br />
of the stream through that area. If conditions<br />
change dramatically along the stream, you should<br />
identify additional assessment reaches <strong>and</strong> conduct<br />
separate assessments for each.<br />
As you evaluate each element, try to work the talking<br />
points contained in the scoring descriptions into the<br />
conversation. If possible, involve the owner by asking<br />
him or her to help record the scores.<br />
The assessment is recorded on a two-page worksheet.<br />
A completed worksheet is shown in figure 2. (A<br />
worksheet suitable for copying is at the end of this<br />
note.) The stream visual assessment protocol worksheet<br />
consists of two principal sections: reach identification<br />
<strong>and</strong> assessment. The identification section<br />
records basic information about the reach, such as<br />
name, location, <strong>and</strong> l<strong>and</strong> uses. Space is provided for a<br />
diagram of the reach, which may be useful to locate<br />
the reach or illustrate problem areas. On this diagram<br />
draw all tributaries, drainage ditches, <strong>and</strong> irrigation<br />
ditches; note springs <strong>and</strong> ponds that drain to the<br />
stream; include road crossings <strong>and</strong> note whether they<br />
are fords, culverts, or bridges; note the direction of<br />
flow; <strong>and</strong> draw in any large woody debris, pools, <strong>and</strong><br />
riffles.<br />
The assessment section is used to record the scores<br />
for up to 15 assessment elements. Not all assessment<br />
elements will be applicable or useful for your site. Do<br />
not score elements that are not applicable. Score an<br />
element by comparing your observations to the descriptions<br />
provided. If you have difficulty matching<br />
descriptions, try to compare what you are observing to<br />
the conditions at reference sites for your area.<br />
The overall assessment score is determined by adding<br />
the values for each element <strong>and</strong> dividing by the number<br />
of elements assessed. For example, if your scores<br />
add up to 76 <strong>and</strong> you used 12 assessment elements,<br />
you would have an overall assessment value of 6.3,<br />
which is classified as fair. This value provides a numerical<br />
assessment of the environmental condition of<br />
the stream reach. This value can be used as a general<br />
statement about the "state of the environment" of the<br />
stream or (over time) as an indicator of trends in<br />
condition.<br />
(NWCC Technical Note 99–1, Stream Visual Assessment Protocol, December 1998) 3
Figure 2<br />
Stream visual assessment protocol worksheet<br />
Stream Visual Assessment Protocol<br />
Elmer Smith Mary Soylkahn 6-20-99<br />
Camp Creek<br />
About 2,000 feet upstream of equipment shed<br />
Owners name ___________________________________ Evaluator's name_______________________________ Date ________________<br />
Stream name _______________________________________________ Waterbody ID number ____________________________________<br />
Reach location _____________________________________________________________________________________________________<br />
__________________________________________________________________________________________________________________<br />
2,200 acres 1.2 % (map)<br />
Cherry Creek north of the Rt 310 bridge<br />
40 30 20 10<br />
Ecoregion ___________________________________ Drainage area _______________________ Gradient__________________________<br />
Applicable reference site _____________________________________________________________________________________________<br />
L<strong>and</strong> use within drainage (%): row crop ______ hayl<strong>and</strong> ______ grazing/pasture _______ forest ______ residential _______<br />
confined animal feeding operations ______ Cons. Reserve ________ industrial _______ Other: _________________<br />
clear<br />
15 feet<br />
clear<br />
x<br />
Weather conditions-today ______________________________________ Past 2-5 days __________________________________________<br />
Active channel width ______________________ Dominant substrate: boulder ______ gravel ______ s<strong>and</strong> ______ silt ______ mud ______<br />
x<br />
Site Diagram<br />
N<br />
Pasture<br />
Pool<br />
Riffle<br />
x<br />
x<br />
x<br />
x<br />
x<br />
x<br />
x<br />
Evidence of<br />
concentrated<br />
flow<br />
Flow<br />
x<br />
x<br />
Corn<br />
x<br />
x<br />
4 (NWCC Technical Note 99–1, Stream Visual Assessment Protocol, December 1998)
Figure 2<br />
Stream visual assessment protocol worksheet—Continued<br />
Assessment Scores<br />
Channel condition<br />
8<br />
Pools<br />
3<br />
Hydrologic alteration<br />
10<br />
Invertebrate habitat<br />
7<br />
Riparian zone<br />
Bank stability<br />
Water appearance<br />
1<br />
5<br />
3<br />
Score only if applicable<br />
Canopy cover<br />
Manure presence<br />
3<br />
1<br />
Nutrient enrichment<br />
Barriers to fish movement<br />
Instream fish cover<br />
7<br />
10<br />
3<br />
Salinity<br />
Riffle embeddedness<br />
Marcroinvertebrates<br />
Observed (optional)<br />
5<br />
10<br />
Overall score<br />
(Total divided by number scored)<br />
76/14<br />
5.4<br />
9.0 Excellent<br />
This reach is typical of the reaches on the property. Severely<br />
Suspected causes of observed problems_____________________________________________________________________<br />
degraded riparian zones lack brush, small trees. Some bank problems from livestock access.<br />
_____________________________________________________________________________________________________<br />
Channel may be widening due to high sediment load. Does not appear to be downcutting.<br />
_____________________________________________________________________________________________________<br />
_____________________________________________________________________________________________________<br />
Install 391-Riparian Forest Buffer. Need to encourage livestock away from<br />
Recommendations______________________________________________________________________________________<br />
stream using water sources <strong>and</strong> shade or exclude livestock. Concentrated flows off fields<br />
_____________________________________________________________________________________________________<br />
need to be spread out in zone 3 of buffer. Relocate fallen trees if they deflect current into<br />
_____________________________________________________________________________________________________<br />
bank–use as stream barbs to deflect current to maintain channel.<br />
_____________________________________________________________________________________________________<br />
_____________________________________________________________________________________________________<br />
_____________________________________________________________________________________________________<br />
_____________________________________________________________________________________________________<br />
_____________________________________________________________________________________________________<br />
_____________________________________________________________________________________________________<br />
(NWCC Technical Note 99–1, Stream Visual Assessment Protocol, December 1998) 5
Reach description<br />
The first page of the assessment worksheet records<br />
the identity <strong>and</strong> location of the stream reach. Most<br />
entries are self-explanatory. Waterbody ID <strong>and</strong><br />
ecoregion should be filled out only if these identification<br />
<strong>and</strong> classification aids are used in your state.<br />
Active channel width can be difficult to determine.<br />
However, active channel width helps to characterize<br />
the stream. It is also an important aspect of more<br />
advanced assessment protocols; therefore, it is worth<br />
becoming familiar with the concept <strong>and</strong> field determination.<br />
For this protocol you do not need to measure<br />
active channel width accurately — a visual estimate of<br />
the average width is adequate.<br />
Active channel width is the stream width at the<br />
bankfull discharge. Bankfull discharge is the flow rate<br />
that forms <strong>and</strong> controls the shape <strong>and</strong> size of the<br />
active channel. It is approximately the flow rate at<br />
which the stream begins to move onto its flood plain if<br />
the stream has an active flood plain. The bankfull<br />
discharge is expected to occur every 1.5 years on<br />
average. Figure 3 illustrates the relationship between<br />
baseflow, bankfull flow, <strong>and</strong> the flood plain. Active<br />
channel width is best determined by locating the first<br />
flat depositional surface occurring above the bed of<br />
the stream (i.e., an active flood plain). The lowest<br />
elevation at which the bankfull surface could occur is<br />
at the top of the point bars or other sediment deposits<br />
in the channel bed. Other indicators of the bankfull<br />
surface include a break in slope on the bank, vegetation<br />
change, substrate, <strong>and</strong> debris. If you are not<br />
trained in locating the bankfull stage, ask the l<strong>and</strong>owner<br />
how high the water gets every year <strong>and</strong> observe<br />
the location of permanent vegetation.<br />
Figure 3 Baseflow, bankfull, <strong>and</strong> flood plain locations (Rosgen 1996)<br />
Baseflow<br />
Flood plain<br />
Bankfull<br />
Baseflow<br />
Flood plain<br />
Bankfull<br />
6 (NWCC Technical Note 99–1, Stream Visual Assessment Protocol, December 1998)
Scoring descriptions<br />
Each assessment element is rated with a value of 1 to<br />
10. Rate only those elements appropriate to the<br />
stream. Using the Stream Visual Assessment Protocol<br />
worksheet, record the score that best fits the observations<br />
you make based on the narrative descriptions<br />
provided. Unless otherwise directed, assign the lowest<br />
score that applies. For example, if a reach has aspects<br />
of several narrative descriptions, assign a score based<br />
on the lowest scoring description that contains indicators<br />
present within the reach. You may record values<br />
intermediate to those listed. Some background information<br />
is provided for each assessment element, as<br />
well as a description of what to look for. The length of<br />
the assessment reach should be 12 times the active<br />
channel width.<br />
Channel condition<br />
Natural channel; no<br />
structures, dikes. No<br />
evidence of downcutting<br />
or excessive<br />
lateral cutting.<br />
Evidence of past channel<br />
alteration, but with<br />
significant recovery of<br />
channel <strong>and</strong> banks. Any<br />
dikes or levies are set<br />
back to provide access to<br />
an adequate flood plain.<br />
Altered channel; 50% of the reach<br />
with riprap or channelization.<br />
Dikes or levees<br />
prevent access to the<br />
flood plain.<br />
10<br />
7<br />
3<br />
1<br />
Stream me<strong>and</strong>ering generally increases as the gradient<br />
of the surrounding valley decreases. Often, development<br />
in the area results in changes to this me<strong>and</strong>ering<br />
pattern <strong>and</strong> the flow of a stream. These changes in<br />
turn may affect the way a stream naturally does its<br />
work, such as the transport of sediment <strong>and</strong> the development<br />
<strong>and</strong> maintenance of habitat for fish, aquatic<br />
insects, <strong>and</strong> aquatic plants. Some modifications to<br />
stream channels have more impact on stream health<br />
than others. For example, channelization <strong>and</strong> dams<br />
affect a stream more than the presence of pilings or<br />
other supports for road crossings.<br />
Active downcutting <strong>and</strong> excessive lateral cutting are<br />
serious impairments to stream function. Both conditions<br />
are indicative of an unstable stream channel.<br />
Usually, this instability must be addressed before<br />
committing time <strong>and</strong> money toward improving other<br />
stream problems. For example, restoring the woody<br />
vegetation within the riparian zone becomes increasingly<br />
difficult when a channel is downcutting because<br />
banks continue to be undermined <strong>and</strong> the water table<br />
drops below the root zone of the plants during their<br />
growing season. In this situation or when a channel is<br />
fairly stable, but already incised from previous downcutting<br />
or mechanical dredging, it is usually necessary<br />
to plant upl<strong>and</strong> species, rather than hydrophytic, or to<br />
apply irrigation for several growing seasons, or both.<br />
Extensive bank-armoring of channels to stop lateral<br />
cutting usually leads to more problems (especially<br />
downstream). Often stability can be obtained by using<br />
a series of structures (barbs, groins, jetties, deflectors,<br />
weirs, vortex weirs) that reduce water velocity, deflect<br />
currents, or act as gradient controls. These structures<br />
are used in conjunction with large woody debris <strong>and</strong><br />
woody vegetation plantings. Hydrologic alterations are<br />
described next.<br />
What to look for: Signs of channelization or straightening<br />
of the stream may include an unnaturally<br />
straight section of the stream, high banks, dikes or<br />
berms, lack of flow diversity (e.g., few point bars <strong>and</strong><br />
deep pools), <strong>and</strong> uniform-sized bed materials (e.g., all<br />
cobbles where there should be mixes of gravel <strong>and</strong><br />
cobble). In newly channelized reaches, vegetation may<br />
be missing or appear very different (different species,<br />
not as well developed) from the bank vegetation of<br />
areas that were not channelized. Older channelized<br />
reaches may also have little or no vegetation or have<br />
grasses instead of woody vegetation. Drop structures<br />
(such as check dams), irrigation diversions, culverts,<br />
bridge abutments, <strong>and</strong> riprap also indicate changes to<br />
the stream channel.<br />
Indicators of downcutting in the stream channel<br />
include nickpoints associated with headcuts in the<br />
stream bottom <strong>and</strong> exposure of cultural features, such<br />
as pipelines that were initially buried under the<br />
stream. Exposed footings in bridges <strong>and</strong> culvert outlets<br />
that are higher than the water surface during low<br />
flows are other examples. A lack of sediment depositional<br />
features, such as regularly-spaced point bars, is<br />
(NWCC Technical Note 99–1, Stream Visual Assessment Protocol, December 1998) 7
normally an indicator of incision. A low vertical scarp<br />
at the toe of the streambank may indicate downcutting,<br />
especially if the scarp occurs on the inside of a<br />
me<strong>and</strong>er. Another visual indicator of current or past<br />
downcutting is high streambanks with woody vegetation<br />
growing well below the top of the bank (as a<br />
channel incises the bankfull flow line moves downward<br />
within the former bankfull channel). Excessive<br />
bank erosion is indicated by raw banks in areas of the<br />
stream where they are not normally found, such as<br />
straight sections between me<strong>and</strong>ers or on the inside of<br />
curves.<br />
Hydrologic alteration<br />
Flooding every 1.5 to 2<br />
years. No dams, no<br />
water withdrawals, no<br />
dikes or other structures<br />
limiting the<br />
stream's access to the<br />
flood plain. Channel is<br />
not incised.<br />
Flooding occurs only<br />
once every 3 to 5 years;<br />
limited channel incision.<br />
or<br />
Withdrawals, although<br />
present, do not affect<br />
available habitat for<br />
biota.<br />
Flooding occurs only<br />
once every 6 to 10 years;<br />
channel deeply incised.<br />
or<br />
Withdrawals significantly<br />
affect available low flow<br />
habitat for biota.<br />
No flooding; channel<br />
deeply incised or structures<br />
prevent access to<br />
flood plain or dam<br />
operations prevent<br />
flood flows.<br />
or<br />
Withdrawals have<br />
caused severe loss of<br />
low flow habitat.<br />
or<br />
Flooding occurs on a 1-<br />
year rain event or less.<br />
10<br />
7<br />
3<br />
1<br />
Bankfull flows, as well as flooding, are important to<br />
maintaining channel shape <strong>and</strong> function (e.g., sediment<br />
transport) <strong>and</strong> maintaining the physical habitat<br />
for animals <strong>and</strong> plants. High flows scour fine sediment<br />
to keep gravel areas clean for fish <strong>and</strong> other aquatic<br />
organisms. These flows also redistribute larger sediment,<br />
such as gravel, cobbles, <strong>and</strong> boulders, as well as<br />
large woody debris, to form pool <strong>and</strong> riffle habitat<br />
important to stream biota. The river channel <strong>and</strong> flood<br />
plain exist in dynamic equilibrium, having evolved in<br />
the present climatic regime <strong>and</strong> geomorphic setting.<br />
The relationship of water <strong>and</strong> sediment is the basis for<br />
the dynamic equilibrium that maintains the form <strong>and</strong><br />
function of the river channel. The energy of the river<br />
(water velocity <strong>and</strong> depth) should be in balance with<br />
the bedload (volume <strong>and</strong> particle size of the sediment).<br />
Any change in the flow regime alters this balance.<br />
If a river is not incised <strong>and</strong> has access to its flood<br />
plain, decreases in the frequency of bankfull <strong>and</strong> outof-bank<br />
flows decrease the river's ability to transport<br />
sediment. This can result in excess sediment deposition,<br />
channel widening <strong>and</strong> shallowing, <strong>and</strong>, ultimately, in<br />
braiding of the channel. Rosgen (1996) defines braiding<br />
as a stream with three or more smaller channels.<br />
These smaller channels are extremely unstable, rarely<br />
have woody vegetation along their banks, <strong>and</strong> provide<br />
poor habitat for stream biota. A split channel, however,<br />
has two or more smaller channels (called side<br />
channels) that are usually very stable, have woody<br />
vegetation along their banks, <strong>and</strong> provide excellent<br />
habitat.<br />
Conversely, an increase in flood flows or the confinement<br />
of the river away from its flood plain (from either<br />
incision or levees) increases the energy available to<br />
transport sediment <strong>and</strong> can result in bank <strong>and</strong> channel<br />
erosion.<br />
The low flow or baseflow during the dry periods of<br />
summer or fall usually comes from groundwater<br />
entering the stream through the stream banks <strong>and</strong><br />
bottom. A decrease in the low-flow rate will result in a<br />
smaller portion of the channel suitable for aquatic<br />
organisms. The withdrawal of water from streams for<br />
irrigation or industry <strong>and</strong> the placement of dams often<br />
change the normal low-flow pattern. Baseflow can also<br />
8 (NWCC Technical Note 99–1, Stream Visual Assessment Protocol, December 1998)
e affected by management <strong>and</strong> l<strong>and</strong> use within the<br />
watershed — less infiltration of precipitation reduces<br />
baseflow <strong>and</strong> increases the frequency <strong>and</strong> severity of<br />
high flow events. For example, urbanization increases<br />
runoff <strong>and</strong> can increase the frequency of flooding to<br />
every year or more often <strong>and</strong> also reduce low flows.<br />
Overgrazing <strong>and</strong> clearcutting can have similar, although<br />
typically less severe, effects. The last description<br />
in the last box refers to the increased flood frequency<br />
that occurs with the above watershed changes.<br />
What to look for: Ask the l<strong>and</strong>owner about the<br />
frequency of flooding <strong>and</strong> about summer low-flow<br />
conditions. A flood plain should be inundated during<br />
flows that equal or exceed the 1.5- to 2.0-year flow<br />
event (2 out of 3 years or every other year). Be cautious<br />
because water in an adjacent field does not<br />
necessarily indicate natural flooding. The water may<br />
have flowed overl<strong>and</strong> from a low spot in the bank<br />
outside the assessment reach.<br />
Evidence of flooding includes high water marks (such<br />
as water lines), sediment deposits, or stream debris.<br />
Look for these on the banks, on the bankside trees or<br />
rocks, or on other structures (such as road pilings or<br />
culverts).<br />
Excess sediment deposits <strong>and</strong> wide, shallow channels<br />
could indicate a loss of sediment transport capacity.<br />
The loss of transport capacity can result in a stream<br />
with three or more channels (braiding).<br />
Riparian zone<br />
Natural vegetation<br />
extends at least<br />
two active channel<br />
widths on each<br />
side.<br />
Natural vegetation<br />
extends one active<br />
channel width on<br />
each side.<br />
or<br />
If less than one<br />
width, covers entire<br />
flood plain.<br />
Natural vegetation<br />
extends half of the<br />
active channel width<br />
on each side.<br />
Natural vegetation<br />
extends a third of<br />
the active channel<br />
width on each side.<br />
or<br />
Filtering function<br />
moderately compromised.<br />
Natural vegetation<br />
less than a third of<br />
the active channel<br />
width on each side.<br />
or<br />
Lack of regeneration.<br />
or<br />
Filtering function<br />
severely compromised.<br />
10<br />
8<br />
5<br />
3<br />
1<br />
This element is the width of the natural vegetation<br />
zone from the edge of the active channel out onto the<br />
flood plain. For this element, the word natural means<br />
plant communities with (1) all appropriate structural<br />
components <strong>and</strong> (2) species native to the site or introduced<br />
species that function similar to native species at<br />
reference sites.<br />
A healthy riparian vegetation zone is one of the most<br />
important elements for a healthy stream ecosystem.<br />
The quality of the riparian zone increases with the<br />
width <strong>and</strong> the complexity of the woody vegetation<br />
within it. This zone:<br />
• Reduces the amount of pollutants that reach the<br />
stream in surface runoff.<br />
• Helps control erosion.<br />
• Provides a microclimate that is cooler during the<br />
summer providing cooler water for aquatic organisms.<br />
• Provides large woody debris from fallen trees <strong>and</strong><br />
limbs that form instream cover, create pools, stabilize<br />
the streambed, <strong>and</strong> provide habitat for stream<br />
biota.<br />
• Provides fish habitat in the form of undercut banks<br />
with the "ceiling" held together by roots of woody<br />
vegetation.<br />
• Provides organic material for stream biota that,<br />
among other functions, is the base of the food chain<br />
in lower order streams.<br />
• Provides habitat for terrestrial insects that drop in<br />
the stream <strong>and</strong> become food for fish, <strong>and</strong> habitat<br />
<strong>and</strong> travel corridors for terrestrial animals.<br />
• Dissipates energy during flood events.<br />
• Often provides the only refuge areas for fish during<br />
out-of-bank flows (behind trees, stumps, <strong>and</strong> logs).<br />
(NWCC Technical Note 99–1, Stream Visual Assessment Protocol, December 1998) 9
The type, timing, intensity, <strong>and</strong> extent of activity in<br />
riparian zones are critical in determining the impact on<br />
these areas. Narrow riparian zones <strong>and</strong>/or riparian<br />
zones that have roads, agricultural activities, residential<br />
or commercial structures, or significant areas of<br />
bare soils have reduced functional value for the<br />
stream. The filtering function of riparian zones can be<br />
compromised by concentrated flows. No evidence of<br />
concentrated flows through the zone should occur or,<br />
if concentrated flows are evident, they should be from<br />
l<strong>and</strong> areas appropriately buffered with vegetated<br />
strips.<br />
What to look for: Compare the width of the riparian<br />
zone to the active channel width. In steep, V-shaped<br />
valleys there may not be enough room for a flood plain<br />
riparian zone to extend as far as one or two active<br />
channel widths. In this case, observe how much of the<br />
flood plain is covered by riparian zone. The vegetation<br />
must be natural <strong>and</strong> consist of all of the structural<br />
components (aquatic plants, sedges or rushes, grasses,<br />
forbs, shrubs, understory trees, <strong>and</strong> overstory trees)<br />
appropriate for the area. A common problem is lack of<br />
shrubs <strong>and</strong> understory trees. Another common problem<br />
is lack of regeneration. The presence of only<br />
mature vegetation <strong>and</strong> few seedlings indicates lack of<br />
regeneration. Do not consider incomplete plant communities<br />
as natural. Healthy riparian zones on both<br />
sides of the stream are important for the health of the<br />
entire system. If one side is lacking the protective<br />
vegetative cover, the entire reach of the stream will be<br />
affected. In doing the assessment, examine both sides<br />
of the stream <strong>and</strong> note on the diagram which side of<br />
the stream has problems. There should be no evidence<br />
of concentrated flows through the riparian zone that<br />
are not adequately buffered before entering the riparian<br />
zone.<br />
Bank stability<br />
Banks are stable; banks<br />
are low (at elevation of<br />
active flood plain); 33% or<br />
more of eroding surface<br />
area of banks in outside<br />
bends is protected by<br />
roots that extend to the<br />
base-flow elevation.<br />
Moderately stable; banks<br />
are low (at elevation of<br />
active flood plain); less<br />
than 33% of eroding surface<br />
area of banks in<br />
outside bends is protected<br />
by roots that extend to the<br />
baseflow elevation.<br />
Moderately unstable;<br />
banks may be low, but<br />
typically are high (flooding<br />
occurs 1 year out of 5<br />
or less frequently); outside<br />
bends are actively<br />
eroding (overhanging<br />
vegetation at top of bank,<br />
some mature trees falling<br />
into steam annually, some<br />
slope failures apparent).<br />
Unstable; banks may be<br />
low, but typically are high;<br />
some straight reaches <strong>and</strong><br />
inside edges of bends are<br />
actively eroding as well as<br />
outside bends (overhanging<br />
vegetation at top of<br />
bare bank, numerous<br />
mature trees falling into<br />
stream annually, numerous<br />
slope failures apparent).<br />
10<br />
7<br />
3<br />
1<br />
This element is the existence of or the potential for<br />
detachment of soil from the upper <strong>and</strong> lower stream<br />
banks <strong>and</strong> its movement into the stream. Some bank<br />
erosion is normal in a healthy stream. Excessive bank<br />
erosion occurs where riparian zones are degraded or<br />
where the stream is unstable because of changes in<br />
hydrology, sediment load, or isolation from the flood<br />
plain. High <strong>and</strong> steep banks are more susceptible to<br />
erosion or collapse. All outside bends of streams<br />
erode, so even a stable stream may have 50 percent of<br />
its banks bare <strong>and</strong> eroding. A healthy riparian corridor<br />
with a vegetated flood plain contributes to bank stability.<br />
The roots of perennial grasses or woody vegetation<br />
typically extend to the baseflow elevation of water in<br />
streams that have bank heights of 6 feet or less. The<br />
root masses help hold the bank soils together <strong>and</strong><br />
physically protect the bank from scour during bankfull<br />
<strong>and</strong> flooding events. Vegetation seldom becomes<br />
established below the elevation of the bankfull surface<br />
because of the frequency of inundation <strong>and</strong> the unstable<br />
bottom conditions as the stream moves its<br />
bedload.<br />
The type of vegetation is important. For example,<br />
trees, shrubs, sedges, <strong>and</strong> rushes have the type of root<br />
masses capable of withst<strong>and</strong>ing high streamflow<br />
events, while Kentucky bluegrass does not. Soil type at<br />
the surface <strong>and</strong> below the surface also influences bank<br />
stability. For example, banks with a thin soil cover<br />
over gravel or s<strong>and</strong> are more prone to collapse than<br />
are banks with a deep soil layer.<br />
10 (NWCC Technical Note 99–1, Stream Visual Assessment Protocol, December 1998)
What to look for: Signs of erosion include unvegetated<br />
stretches, exposed tree roots, or scalloped edges. Evidence<br />
of construction, vehicular, or animal paths near<br />
banks or grazing areas leading directly to the water's<br />
edge suggest conditions that may lead to the collapse of<br />
banks. Estimate the size or area of the bank affected<br />
relative to the total bank area. This element may be<br />
difficult to score during high water.<br />
Water appearance<br />
Very clear, or clear but<br />
tea-colored; objects<br />
visible at depth 3 to 6 ft<br />
(less if slightly colored);<br />
no oil sheen on surface;<br />
no noticeable film on<br />
submerged objects or<br />
rocks.<br />
Occasionally cloudy,<br />
especially after storm<br />
event, but clears rapidly;<br />
objects visible at depth 1.5<br />
to 3 ft; may have slightly<br />
green color; no oil sheen<br />
on water surface.<br />
Considerable cloudiness<br />
most of the time; objects<br />
visible to depth 0.5 to 1.5<br />
ft; slow sections may<br />
appear pea-green; bottom<br />
rocks or submerged objects<br />
covered with heavy<br />
green or olive-green film.<br />
or<br />
Moderate odor of ammonia<br />
or rotten eggs.<br />
Very turbid or muddy<br />
appearance most of the<br />
time; objects visible to<br />
depth < 0.5 ft; slow moving<br />
water may be brightgreen;<br />
other obvious<br />
water pollutants; floating<br />
algal mats, surface scum,<br />
sheen or heavy coat of<br />
foam on surface.<br />
or<br />
Strong odor of chemicals,<br />
oil, sewage, other pollutants.<br />
10<br />
7<br />
3<br />
1<br />
This element compares turbidity, color, <strong>and</strong> other<br />
visual characteristics with a healthy or reference<br />
stream. The depth to which an object can be clearly<br />
seen is a measure of turbidity. Turbidity is caused<br />
mostly by particles of soil <strong>and</strong> organic matter suspended<br />
in the water column. Water often shows some<br />
turbidity after a storm event because of soil <strong>and</strong> organic<br />
particles carried by runoff into the stream or<br />
suspended by turbulence. The water in some streams<br />
may be naturally tea-colored. This is particularly true<br />
in watersheds with extensive bog <strong>and</strong> wetl<strong>and</strong> areas.<br />
Water that has slight nutrient enrichment may support<br />
communities of algae, which provide a greenish color<br />
to the water. Streams with heavy loads of nutrients have<br />
thick coatings of algae attached to the rocks <strong>and</strong> other<br />
submerged objects. In degraded streams, floating algal<br />
mats, surface scum, or pollutants, such as dyes <strong>and</strong> oil,<br />
may be visible.<br />
What to look for: Clarity of the water is an obvious<br />
<strong>and</strong> easy feature to assess. The deeper an object in the<br />
water can be seen, the lower the amount of turbidity.<br />
Use the depth that objects are visible only if the<br />
stream is deep enough to evaluate turbidity using this<br />
approach. For example, if the water is clear, but only 1<br />
foot deep, do not rate it as if an object became obscured<br />
at a depth of 1 foot. This measure should be<br />
taken after a stream has had the opportunity to "settle"<br />
following a storm event. A pea-green color indicates<br />
nutrient enrichment beyond what the stream can<br />
naturally absorb.<br />
(NWCC Technical Note 99–1, Stream Visual Assessment Protocol, December 1998) 11
Nutrient enrichment<br />
Clear water along entire<br />
reach; diverse aquatic<br />
plant community includes<br />
low quantities of<br />
many species of macrophytes;<br />
little algal<br />
growth present.<br />
Fairly clear or slightly<br />
greenish water along<br />
entire reach; moderate<br />
algal growth on stream<br />
substrates.<br />
Greenish water along entire<br />
reach; overabundance of<br />
lush green macrophytes;<br />
abundant algal growth,<br />
especially during warmer<br />
months.<br />
Pea green, gray, or brown<br />
water along entire reach;<br />
dense st<strong>and</strong>s of macrophytes<br />
clog stream;<br />
severe algal blooms<br />
create thick algal mats in<br />
stream.<br />
10<br />
7<br />
3<br />
1<br />
Nutrient enrichment is often reflected by the types <strong>and</strong><br />
amounts of aquatic vegetation in the water. High levels<br />
of nutrients (especially phosphorus <strong>and</strong> nitrogen)<br />
promote an overabundance of algae <strong>and</strong> floating <strong>and</strong><br />
rooted macrophytes. The presence of some aquatic<br />
vegetation is normal in streams. Algae <strong>and</strong> macrophytes<br />
provide habitat <strong>and</strong> food for all stream animals.<br />
However, an excessive amount of aquatic vegetation is<br />
not beneficial to most stream life. Plant respiration<br />
<strong>and</strong> decomposition of dead vegetation consume dissolved<br />
oxygen in the water. Lack of dissolved oxygen<br />
creates stress for all aquatic organisms <strong>and</strong> can cause<br />
fish kills. A l<strong>and</strong>owner may have seen fish gulping for<br />
air at the water surface during warm weather, indicating<br />
a lack of dissolved oxygen.<br />
What to look for: Some aquatic vegetation (rooted<br />
macrophytes, floating plants, <strong>and</strong> algae attached to<br />
substrates) is normal <strong>and</strong> indicates a healthy stream.<br />
Excess nutrients cause excess growth of algae <strong>and</strong><br />
macrophytes, which can create greenish color to the<br />
water. As nutrient loads increase the green becomes<br />
more intense <strong>and</strong> macrophytes become more lush <strong>and</strong><br />
deep green. Intense algal blooms, thick mats of algae,<br />
or dense st<strong>and</strong>s of macrophytes degrade water quality<br />
<strong>and</strong> habitat. Clear water <strong>and</strong> a diverse aquatic plant<br />
community without dense plant populations are optimal<br />
for this characteristic.<br />
Barriers to fish movement<br />
No barriers<br />
Seasonal water<br />
withdrawals inhibit<br />
movement within<br />
the reach<br />
Drop structures,<br />
culverts, dams, or<br />
diversions (< 1 foot<br />
drop) within the<br />
reach<br />
Drop structures,<br />
culverts, dams, or<br />
diversions (> 1 foot<br />
drop) within 3 miles<br />
of the reach<br />
Drop structures,<br />
culverts, dams, or<br />
diversions (> 1<br />
foot drop) within<br />
the reach<br />
10<br />
8<br />
5<br />
3<br />
1<br />
Barriers that block the movement of fish or other<br />
aquatic organisms, such as fresh water mussels, must<br />
be considered as part of the overall stream assessment.<br />
If sufficiently high, these barriers may prevent<br />
the movement or migration of fish, deny access to<br />
important breeding <strong>and</strong> foraging habitats, <strong>and</strong> isolate<br />
populations of fish <strong>and</strong> other aquatic animals.<br />
What to look for: Some barriers are natural, such as<br />
waterfalls <strong>and</strong> boulder dams, <strong>and</strong> some are developed<br />
by humans. Note the presence of such barriers along<br />
the reach of the stream you are assessing, their size,<br />
<strong>and</strong> whether provisions have been made for the passage<br />
of fish. Ask the l<strong>and</strong>owner about any dams or<br />
other barriers that may be present 3 to 5 miles upstream<br />
or downstream. Larger dams are often noted<br />
on maps, so you may find some information even<br />
before going out into the field. Beaver dams generally<br />
do not prevent fish migration. Look for structures that<br />
may not involve a drop, but still present a hydraulic<br />
barrier. Single, large culverts with no slope <strong>and</strong> sufficient<br />
water depth usually do not constitute a barrier.<br />
Small culverts or culverts with slopes may cause high<br />
water velocities that prevent passage.<br />
12 (NWCC Technical Note 99–1, Stream Visual Assessment Protocol, December 1998)
Instream fish cover<br />
>7 cover types<br />
available<br />
6 to 7 cover types<br />
available<br />
4 to 5 cover types<br />
available<br />
2 to 3 cover types<br />
available<br />
None to 1 cover<br />
type available<br />
10<br />
8<br />
5<br />
3<br />
1<br />
Cover types: Logs/large woody debris, deep pools, overhanging vegetation, boulders/cobble, riffles,<br />
undercut banks, thick root mats, dense macrophyte beds, isolated/backwater pools,<br />
other: ___________________________________.<br />
This assessment element measures availability of<br />
physical habitat for fish. The potential for the maintenance<br />
of a healthy fish community <strong>and</strong> its ability to<br />
recover from disturbance is dependent on the variety<br />
<strong>and</strong> abundance of suitable habitat <strong>and</strong> cover available.<br />
What to look for: Observe the number of different<br />
habitat <strong>and</strong> cover types within a representative subsection<br />
of the assessment reach that is equivalent in<br />
length to five times the active channel width. Each<br />
cover type must be present in appreciable amounts to<br />
score. Cover types are described below.<br />
Logs/large woody debris—Fallen trees or parts of<br />
trees that provide structure <strong>and</strong> attachment for aquatic<br />
macroinvertebrates <strong>and</strong> hiding places for fish.<br />
Deep pools—Areas characterized by a smooth undisturbed<br />
surface, generally slow current, <strong>and</strong> deep<br />
enough to provide protective cover for fish (75 to 100%<br />
deeper than the prevailing stream depth).<br />
Overhanging vegetation—Trees, shrubs, vines, or<br />
perennial herbaceous vegetation that hangs immediately<br />
over the stream surface, providing shade <strong>and</strong><br />
cover.<br />
Boulders/cobble—Boulders are rounded stones more<br />
than 10 inches in diameter or large slabs more than 10<br />
inches in length; cobbles are stones between 2.5 <strong>and</strong><br />
10 inches in diameter.<br />
Undercut banks—Eroded areas extending horizontally<br />
beneath the surface of the bank forming underwater<br />
pockets used by fish for hiding <strong>and</strong> protection.<br />
Thick root mats—Dense mats of roots <strong>and</strong> rootlets<br />
(generally from trees) at or beneath the water surface<br />
forming structure for invertebrate attachment <strong>and</strong> fish<br />
cover.<br />
Dense macrophyte beds—Beds of emergent (e.g.,<br />
water willow), floating leaf (e.g., water lily), or submerged<br />
(e.g., riverweed) aquatic vegetation thick<br />
enough to provide invertebrate attachment <strong>and</strong> fish<br />
cover.<br />
Riffles—Area characterized by broken water surface,<br />
rocky or firm substrate, moderate or swift current, <strong>and</strong><br />
relatively shallow depth (usually less than 18 inches).<br />
Isolated/backwater pools—Areas disconnected<br />
from the main channel or connected as a "blind" side<br />
channel, characterized by a lack of flow except in<br />
periods of high water.<br />
(NWCC Technical Note 99–1, Stream Visual Assessment Protocol, December 1998) 13
Pools<br />
Deep <strong>and</strong> shallow pools<br />
abundant; greater than<br />
30% of the pool bottom<br />
is obscure due to depth,<br />
or the pools are at least<br />
5 feet deep.<br />
Pools present, but not<br />
abundant; from 10 to 30%<br />
of the pool bottom is<br />
obscure due to depth, or<br />
the pools are at least 3<br />
feet deep.<br />
Pools present, but shallow;<br />
from 5 to 10% of the<br />
pool bottom is obscure<br />
due to depth, or the pools<br />
are less than 3 feet deep.<br />
Pools absent, or the<br />
entire bottom is discernible.<br />
10<br />
7<br />
3<br />
1<br />
Pools are important resting <strong>and</strong> feeding sites for fish.<br />
A healthy stream has a mix of shallow <strong>and</strong> deep pools.<br />
A deep pool is 1.6 to 2 times deeper than the prevailing<br />
depth, while a shallow pool is less than 1.5 times<br />
deeper than the prevailing depth. Pools are abundant if<br />
a deep pool is in each of the me<strong>and</strong>er bends in the<br />
reach being assessed. To determine if pools are abundant,<br />
look at a longer sample length than one that is 12<br />
active channel widths in length. Generally, only 1 or 2<br />
pools would typically form within a reach as long as 12<br />
active channel widths. In low order, high gradient<br />
streams, pools are abundant if there is more than one<br />
pool every 4 channel widths.<br />
What to look for: Pool diversity <strong>and</strong> abundance are<br />
estimated based on walking the stream or probing<br />
from the streambank with a stick or length of rebar.<br />
You should find deep pools on the outside of me<strong>and</strong>er<br />
bends. In shallow, clear streams a visual inspection<br />
may provide an accurate estimate. In deep streams or<br />
streams with low visibility, this assessment characteristic<br />
may be difficult to determine <strong>and</strong> should not be<br />
scored.<br />
Insect/invertebrate habitat<br />
At least 5 types of habitat<br />
available. Habitat is at a<br />
stage to allow full insect<br />
colonization (woody<br />
debris <strong>and</strong> logs not<br />
freshly fallen).<br />
3 to 4 types of habitat.<br />
Some potential habitat<br />
exists, such as overhanging<br />
trees, which will provide<br />
habitat, but have not yet<br />
entered the stream.<br />
1 to 2 types of habitat. The<br />
substrate is often disturbed,<br />
covered, or removed<br />
by high stream<br />
velocities <strong>and</strong> scour or by<br />
sediment deposition.<br />
None to 1 type of habitat.<br />
10<br />
7<br />
3<br />
1<br />
Cover types: Fine woody debris, submerged logs, leaf packs, undercut banks, cobble, boulders,<br />
coarse gravel,<br />
other: _________________________________________.<br />
Stable substrate is important for insect/invertebrate<br />
colonization. Substrate refers to the stream bottom,<br />
woody debris, or other surfaces on which invertebrates<br />
can live. Optimal conditions include a variety of<br />
substrate types within a relatively small area of the<br />
stream (5 times the active channel width). Stream <strong>and</strong><br />
substrate stability are also important. High stream<br />
velocities, high sediment loads, <strong>and</strong> frequent flooding<br />
may cause substrate instability even if substrate is<br />
present.<br />
What to look for: Observe the number of different<br />
types of habitat <strong>and</strong> cover within a representative<br />
subsection of the assessment reach that is equivalent<br />
in length to five times the active channel width. Each<br />
cover type must be present in appreciable amounts to<br />
score.<br />
14 (NWCC Technical Note 99–1, Stream Visual Assessment Protocol, December 1998)
Score the following assessment elements<br />
only if applicable<br />
Canopy cover (if applicable)<br />
Coldwater fishery<br />
> 75% of water surface<br />
shaded <strong>and</strong> upstream 2<br />
to 3 miles generally<br />
well shaded.<br />
>50% shaded in reach.<br />
or<br />
>75% in reach, but upstream<br />
2 to 3 miles poorly<br />
shaded.<br />
20 to 50% shaded.<br />
< 20% of water surface in<br />
reach shaded.<br />
10<br />
7<br />
3<br />
1<br />
Warmwater fishery<br />
25 to 90% of water<br />
surface shaded; mixture<br />
of conditions.<br />
> 90% shaded; full canopy;<br />
same shading condition<br />
throughout the reach.<br />
(intentionally blank)<br />
< 25% water surface<br />
shaded in reach.<br />
10<br />
7<br />
1<br />
Do not assess this element if active channel<br />
width is greater than 50 feet. Do not assess this<br />
element if woody vegetation is naturally absent<br />
(e.g., wet meadows).<br />
Shading of the stream is important because it keeps<br />
water cool <strong>and</strong> limits algal growth. Cool water has a<br />
greater oxygen holding capacity than does warm<br />
water. When streamside trees are removed, the stream<br />
is exposed to the warming effects of the sun causing<br />
the water temperature to increase for longer periods<br />
during the daylight hours <strong>and</strong> for more days during the<br />
year. This shift in light intensity <strong>and</strong> temperature<br />
causes a decline in the numbers of certain species of<br />
fish, insects, <strong>and</strong> other invertebrates <strong>and</strong> some aquatic<br />
plants. They may be replaced altogether by other<br />
species that are more tolerant of increased light intensity,<br />
low dissolved oxygen, <strong>and</strong> warmer water temperature.<br />
For example, trout <strong>and</strong> salmon require cool,<br />
oxygen-rich water. Loss of streamside vegetation (<strong>and</strong><br />
also channel widening) that cause increased water<br />
temperature <strong>and</strong> decreased oxygen levels are major<br />
contributing factors to the decrease in abundance of<br />
trout <strong>and</strong> salmon from many streams that historically<br />
supported these species. Increased light <strong>and</strong> the<br />
warmer water also promote excessive growth of<br />
submerged macrophytes <strong>and</strong> algae that compromises<br />
the biotic community of the stream. The temperature<br />
at the reach you are assessing will be affected by the<br />
amount of shading 2 to 3 miles upstream.<br />
What to look for: Try to estimate the portion of the<br />
water surface area for the whole reach that is shaded<br />
by estimating areas with no shade, poor shade, <strong>and</strong><br />
shade. Time of the year, time of the day, <strong>and</strong> weather<br />
can affect your observation of shading. Therefore, the<br />
relative amount of shade is estimated by assuming that<br />
the sun is directly overhead <strong>and</strong> the vegetation is in<br />
full leaf-out. First evaluate the shading conditions for<br />
the reach; then determine (by talking with the l<strong>and</strong>owner)<br />
shading conditions 2 to 3 miles upstream.<br />
Alternatively, use aerial photographs taken during full<br />
leaf out. The following rough guidelines for percent<br />
shade may be used:<br />
stream surface not visible .......................................... >90<br />
surface slightly visible or visible only in patches .. 70 – 90<br />
surface visible, but banks not visible................... 40 – 70<br />
surface visible <strong>and</strong> banks visible at times ........... 20 – 40<br />
surface <strong>and</strong> banks visible ............................................
Manure presence (if applicable)<br />
(Intentionally blank)<br />
Evidence of livestock<br />
access to riparian zone.<br />
Occasional manure in<br />
stream or waste storage<br />
structure located on the<br />
flood plain.<br />
Extensive amount of<br />
manure on banks or in<br />
stream.<br />
or<br />
Untreated human waste<br />
discharge pipes present.<br />
5<br />
3<br />
1<br />
Do not score this element unless livestock operations<br />
or human waste discharges are present.<br />
Manure from livestock may enter the water if livestock<br />
have access to the stream or from runoff of grazing<br />
l<strong>and</strong> adjacent to the stream. In some communities<br />
untreated human waste may also empty directly into<br />
streams. Manure <strong>and</strong> human waste increase biochemical<br />
oxygen dem<strong>and</strong>, increase the loading of nutrients,<br />
<strong>and</strong> alter the trophic state of the aquatic biological<br />
community. Untreated human waste is a health risk.<br />
What to look for: Do not score this element unless<br />
livestock operations or human waste discharges are<br />
present. Look for evidence of animal droppings in or<br />
around streams, on the streambank, or in the adjacent<br />
riparian zone. Well-worn livestock paths leading to or<br />
near streams also suggest the probability of manure in<br />
the stream. Areas with stagnant or slow-moving water<br />
may have moderate to dense amounts of vegetation or<br />
algal blooms, indicating localized enrichment from<br />
manure.<br />
Salinity (if applicable)<br />
(Intentionally blank)<br />
Minimal wilting, bleaching,<br />
leaf burn, or stunting<br />
of aquatic vegetation;<br />
some salt-tolerant streamside<br />
vegetation.<br />
Aquatic vegetation may<br />
show significant wilting,<br />
bleaching, leaf burn, or<br />
stunting; dominance of<br />
salt-tolerant streamside<br />
vegetation.<br />
Severe wilting, bleaching,<br />
leaf burn, or stunting;<br />
presence of only salttolerant<br />
aquatic vegetation;<br />
most streamside<br />
vegetation salt tolerant.<br />
5<br />
3<br />
1<br />
Do not assess this element unless elevated salinity<br />
from anthropogenic sources is known to<br />
occur in the stream.<br />
High salinity levels most often occur in arid areas<br />
<strong>and</strong> in areas that have high irrigation requirements.<br />
High salinity can also result from oil <strong>and</strong> gas well<br />
operations. Salt accumulation in soil causes a breakdown<br />
of soil structure, decreased infiltration of water,<br />
<strong>and</strong> potential toxicity. High salinity in streams affects<br />
aquatic vegetation, macroinvertebrates, <strong>and</strong> fish. Salts<br />
are a product of natural weathering processes of soil<br />
<strong>and</strong> geologic material.<br />
What to look for: High salinity levels cause a "burning"<br />
or "bleaching" of aquatic vegetation. Wilting, loss<br />
of plant color, decreased productivity, <strong>and</strong> stunted<br />
growth are readily visible signs. Other indicators<br />
include whitish salt encrustments on the streambanks<br />
<strong>and</strong> the displacement of native vegetation by salttolerant<br />
aquatic plants <strong>and</strong> riparian vegetation (such<br />
as tamarix or salt cedar).<br />
16 (NWCC Technical Note 99–1, Stream Visual Assessment Protocol, December 1998)
Riffle embeddedness<br />
(if applicable)<br />
Gravel or cobble<br />
particles are<br />
< 20% embedded.<br />
Gravel or cobble<br />
particles are 20 to<br />
30% embedded.<br />
Gravel or cobble<br />
particles are 30 to<br />
40% embedded.<br />
Gravel or cobble<br />
particles are >40%<br />
embedded.<br />
Riffle is completely<br />
embedded.<br />
10<br />
8<br />
5<br />
3<br />
1<br />
Do not assess this element unless riffles are<br />
present or they are a natural feature that<br />
should be present.<br />
Riffles are areas, often downstream of a pool, where<br />
the water is breaking over rocks or other debris causing<br />
surface agitation. In coastal areas riffles can be<br />
created by shoals <strong>and</strong> submerged objects. (This element<br />
is sensitive to regional differences <strong>and</strong> should be<br />
related to reference conditions.) Riffles are critical for<br />
maintaining high species diversity <strong>and</strong> abundance of<br />
insects for most streams <strong>and</strong> for serving as spawning<br />
<strong>and</strong> feeding grounds for some fish species. Embeddedness<br />
measures the degree to which gravel <strong>and</strong> cobble<br />
substrate are surrounded by fine sediment. It relates<br />
directly to the suitability of the stream substrate as<br />
habitat for macroinvertebrates, fish spawning, <strong>and</strong> egg<br />
incubation.<br />
What to look for: This assessment characteristic<br />
should be used only in riffle areas <strong>and</strong> in streams<br />
where this is a natural feature. The measure is the<br />
depth to which objects are buried by sediment. This<br />
assessment is made by picking up particles of gravel<br />
or cobble with your fingertips at the fine sediment<br />
layer. Pull the particle out of the bed <strong>and</strong> estimate<br />
what percent of the particle was buried. Some streams<br />
have been so smothered by fine sediment that the<br />
original stream bottom is not visible. Test for complete<br />
burial of a streambed by probing with a length of<br />
rebar.<br />
Macroinvertebrates observed<br />
Community dominated by<br />
Group I or intolerant<br />
species with good species<br />
diversity. Examples<br />
include caddisflies, mayflies,<br />
stoneflies, hellgrammites.<br />
Community dominated by<br />
Group II or facultative<br />
species, such as damselflies,<br />
dragonflies, aquatic<br />
sowbugs, blackflies,<br />
crayfish.<br />
Community dominated by<br />
Group III or tolerant species,<br />
such as midges,<br />
craneflies, horseflies,<br />
leeches, aquatic earthworms,<br />
tubificid worms.<br />
Very reduced number of<br />
species or near absence of<br />
all macroinvertebrates.<br />
15<br />
6<br />
2<br />
– 3<br />
This important characteristic reflects the ability of the<br />
stream to support aquatic invertebrate animals. However,<br />
successful assessment requires knowledge of the<br />
life cycles of some aquatic insects <strong>and</strong> other macroinvertebrates<br />
<strong>and</strong> the ability to identify them. For this<br />
reason, this is an optional element. The presence of<br />
intolerant insect species (cannot survive in polluted<br />
water) indicates healthy stream conditions. Some<br />
kinds of macroinvertebrates, such as stoneflies, mayflies,<br />
<strong>and</strong> caddisflies, are sensitive to pollution <strong>and</strong> do<br />
not live in polluted water; they are considered<br />
Group I. Another group of macroinvertebrates, known<br />
as Group II or facultative macroinvertebrates, can<br />
tolerate limited pollution. This group includes damselflies,<br />
aquatic sowbugs, <strong>and</strong> crayfish. The presence of<br />
Group III macroinvertebrates, including midges,<br />
craneflies <strong>and</strong> leeches, suggests the water is significantly<br />
polluted. The presence of a single Group I<br />
species in a community does not constitute good<br />
diversity <strong>and</strong> should generally not be given a score of<br />
15.<br />
(NWCC Technical Note 99–1, Stream Visual Assessment Protocol, December 1998) 17
What to look for: You can collect macroinvertebrates<br />
by picking up cobbles <strong>and</strong> other submerged<br />
objects in the water. Look carefully for the insects;<br />
they are often well camouflaged <strong>and</strong> may appear as<br />
part of the stone or object. Note the kinds of insects,<br />
number of species, <strong>and</strong> relative abundance of each<br />
group of insects/macroinvertebrates. Each of the three<br />
classes of macroinvertebrates are illustrated on pages<br />
19 <strong>and</strong> 20. Note that the scoring values for this<br />
element range from – 3 to 15.<br />
18 (NWCC Technical Note 99–1, Stream Visual Assessment Protocol, December 1998)
Stream<br />
Invertebrates<br />
Group One Taxa<br />
Pollution sensitive organisms found in good<br />
quality water.<br />
1 Stonefly Order Plecoptera. 1/2" to<br />
1 1/2", 6 legs with hooked tips, antennae,<br />
2 hair-line tails. Smooth (no gills) on lower<br />
half of body (see arrow).<br />
2 Caddisfly: Order Trichoptera. Up to 1",<br />
6 hooked legs on upper third of body, 2<br />
hooks at back end. May be in a stick,<br />
rock, or leaf case with its head sticking<br />
out. May have fluffy gill tufts on underside.<br />
3 Water Penny: Order Coleoptera. 1/4",<br />
flat saucer-shaped body with a raised<br />
bump on one side <strong>and</strong> 6 tiny legs <strong>and</strong><br />
fluffy gills on the other side. Immature<br />
beetle.<br />
4 Riffle Beetle: Order Coleoptera. 1/4",<br />
oval body covered with tiny hairs, 6 legs,<br />
antennae. Walks slowly underwater.<br />
Does not swim on surface.<br />
5 Mayfly: Order Ephemeroptera. 1/4" to<br />
1", brown, moving, plate-like or feathery<br />
gills on the sides of lower body (see<br />
arrow), 6 large hooked legs, antennae, 2<br />
or 3 long hair-like tails. Tails may be<br />
webbed together.<br />
6 Gilled Snail: Class Gastropoda. Shell<br />
opening covered by thin plate called<br />
operculum. When opening is facing you,<br />
shell usually opens on right.<br />
7 Dobsonfly (Hellgrammite): Family<br />
Corydalidae. 3/4" to 4", dark-colored, 6<br />
legs, large pinching jaws, eight pairs<br />
feelers on lower half of body with paired<br />
cotton-like gill tufts along underside, short<br />
antennae, 2 tails, <strong>and</strong> 2 pairs of hooks at<br />
back end.<br />
Group Two Taxa<br />
Somewhat pollution tolerant organisms can<br />
be in good or fair quality water.<br />
8 Crayfish: Order Decapoda. Up to 6", 2<br />
large claws, 8 legs, resembles small<br />
lobster.<br />
9 Sowbug: Order Isopoda. 1/4" to 3/4",<br />
gray oblong body wider than it is high,<br />
more than 6 legs, long antennae.<br />
Bar line indicate relative size<br />
Source: Izaak Walton League of America,<br />
707 Conservation Lane, Gaithersburg, MD<br />
20878-2983. (800) BUG-IWLA<br />
(NWCC Technical Note 99–1, Stream Visual Assessment Protocol, December 1998) 19
Group Two Taxa<br />
Somewhat pollution tolerant organisms can<br />
be in good or fair quality water.<br />
10 Scud: Order Amphipoda. 1/4", white to<br />
gray, body higher than it is wide, swims<br />
sideways, more than 6 legs, resembles<br />
small shrimp.<br />
11 Alderfly Larva: Family Sialedae. 1"<br />
long. Looks like small Hellgramite but<br />
has long, thin, branched tail at back end<br />
(no hooks). No gill tufts underneath.<br />
12 Fishfly Larva: Family Cordalidae. Up<br />
to 1 1/2" long. Looks like small<br />
hellgramite but often a lighter reddishtan<br />
color, or with yellowish streaks. No<br />
gill tufts underneath.<br />
13 Damselfly: Suborder Zygoptera. 1/2"<br />
to 1", large eyes, 6 thin hooked legs, 3<br />
broad oar-shaped tails, positioned like a<br />
tripod. Smooth (no gills) on sides of<br />
lower half of body. (See arrow.)<br />
14 Watersnipe Fly Larva: Family<br />
Athericidae (Atherix). 1/4" to 1", pale to<br />
green, tapered body, many caterpillarlike<br />
legs, conical head, feathery "horns"<br />
at back end.<br />
15 Crane Fly: Suborder Nematocera. 1/3"<br />
to 2", milky, green, or light brown, plump<br />
caterpillar-like segmented body, 4 fingerlike<br />
lobes at back end.<br />
16 Beetle Larva: Order Coleoptera. 1/4"<br />
to 1", light-colored, 6 legs on upper half<br />
of body, feelers, antennae.<br />
17 Dragon Fly: Suborder Anisoptera. 1/2"<br />
to 2", large eyes, 6 hooked legs. Wide<br />
oval to round abdomen.<br />
18 Clam: Class Bivalvia.<br />
Group Three Taxa<br />
Pollution tolerant organisms can be in any<br />
quality of water.<br />
19 Aquatic Worm: Class Oligochaeta.<br />
1/4" to 2", can be very tiny, thin wormlike<br />
body.<br />
20 Midge Fly Larva: Suborder Nematocera.<br />
Up to 1/4", dark head, worm-like<br />
segmented body, 2 tiny legs on each<br />
side.<br />
21 Blackfly Larva: Family Simulidae. Up<br />
to 1/4", one end of body wider. Black<br />
head, suction pad on other end.<br />
22 Leech: Order Hirudinea. 1/4" to 2",<br />
brown, slimy body, ends with suction<br />
pads.<br />
23 Pouch Snail <strong>and</strong> Pond Snails: Class<br />
Gastropoda. No operculum. Breath air.<br />
When opening is facing you, shell<br />
usually open to left.<br />
Bar line indicate relative size<br />
24 Other Snails: Class Gastropoda. No<br />
operculum.Breath air. Snail shell coils in<br />
one plane.<br />
20 (NWCC Technical Note 99–1, Stream Visual Assessment Protocol, December 1998)
Technical information to<br />
support implementation<br />
Introduction<br />
This section provides a guide for implementation of<br />
the Stream Visual Assessment Protocol (SVAP). The<br />
topics covered in this section include the origin of the<br />
protocol, development history, context for use in<br />
relation to other methods of stream assessment,<br />
instructions for modifying the protocol, <strong>and</strong> references.<br />
Origin of the protocol<br />
In 1996 the NRCS National Water <strong>and</strong> Climate Center<br />
surveyed the NRCS state biologists to determine the<br />
extent of activity in stream ecological assessment <strong>and</strong><br />
the need for technical support. The survey indicated<br />
that less than a third of the NRCS states were active in<br />
supporting stream assessment within their state. Most<br />
respondents said they believed they should be more<br />
active <strong>and</strong> requested additional support from the<br />
National Centers <strong>and</strong> Institutes. In response to these<br />
findings, the NRCS Aquatic Assessment Workgroup<br />
was formed. In their first meeting the workgroup<br />
determined that a simple assessment protocol was<br />
needed. The Water Quality Indicators Guide (WQIG)<br />
had been available for 8 years, but was not being used<br />
extensively. The workgroup felt a simpler <strong>and</strong> more<br />
streamlined method was needed as an initial protocol<br />
for field office use.<br />
The workgroup developed a plan for a tiered progression<br />
of methods that could be used in the field as<br />
conservationists became more skilled in stream assessment.<br />
These methods would also serve different<br />
assessment objectives. The first tier is a simple 2-page<br />
assessment — the Stream Visual Assessment Protocol<br />
(SVAP). The second tier is the existing WQIG. The<br />
third tier is a series of simple assessment methods that<br />
could be conducted by conservationists in the field. An<br />
example of a third tier method would be macroinvertibrate<br />
sampling <strong>and</strong> identification to the taxonomic<br />
level of Order. The fourth tier is fairly sophisticated<br />
methods used in special projects. Examples of<br />
fourth tier methods would be fish community sampling<br />
<strong>and</strong> quantitative sampling of macroinvertebrates<br />
with shipment of samples to a lab for identification.<br />
The workgroup also found that introductory training<br />
<strong>and</strong> a field h<strong>and</strong>book that would serve as a comprehensive<br />
reference <strong>and</strong> guidance manual are needed.<br />
These projects are under development as of this writing.<br />
Context for use<br />
The Stream Visual Assessment Protocol is intended to<br />
be a simple, comprehensive assessment of stream<br />
condition that maximizes ease of use. It is suitable as a<br />
basic first approximation of stream condition. It can<br />
also be used to identify the need for more accurate<br />
assessment methods that focus on a particular aspect<br />
of the aquatic system.<br />
The relationship of the SVAP to other assessment<br />
methods is shown in figure 4. In this figure a specific<br />
reference to a guidance document is provided for<br />
some methods. The horizontal bars indicate which<br />
aspects of stream condition (chemical, physical, or<br />
biological) are addressed by the method. The SVAP is<br />
the simplest method <strong>and</strong> covers all three aspects of<br />
stream condition. As you move upwards in figure 4 the<br />
methods provide more accuracy, but also become<br />
more focused on one or two aspects of stream condition<br />
<strong>and</strong> require more expertise or resources to conduct.<br />
The SVAP is intended to be applicable nationwide. It<br />
has been designed to utilize factors that are least<br />
sensitive to regional differences. However, regional<br />
differences are a significant aspect of stream assessment,<br />
<strong>and</strong> the protocol can be enhanced by tailoring<br />
the assessment elements to regional conditions. The<br />
national SVAP can be viewed as a framework that can<br />
evolve over time to better reflect State or within-State<br />
regional differences. Instructions for modification are<br />
provided later in this document.<br />
Development<br />
The SVAP was developed by combining parts of several<br />
existing assessment procedures. Many of these<br />
sources are listed in the references section. Three<br />
drafts were developed <strong>and</strong> reviewed by the workgroup<br />
<strong>and</strong> others between the fall of 1996 <strong>and</strong> the spring of<br />
1997. During the summer of 1997, the workgroup<br />
conducted a field trial evaluation of the third draft.<br />
Further field trials were conducted with the fourth<br />
draft in 1998. A report on the field trial results is appendix<br />
A of this document.<br />
The field trials involved approximately 60 individuals<br />
<strong>and</strong> 182 assessment sites. The field trial consisted of a<br />
combination of replication studies (in which several<br />
individuals independently assessed the same sites) <strong>and</strong><br />
accuracy studies (in which SVAP scores were compared<br />
to the results from other assessment methods).<br />
The average coefficient of variation in the replication<br />
studies was 10.5 percent. The accuracy results indicated<br />
that SVAP version 3 scores correlated well with<br />
(NWCC Technical Note 99–1, Stream Visual Assessment Protocol, December 1998) 21
other methods for moderately impacted <strong>and</strong> high<br />
quality sites, but that low quality sites were not scoring<br />
correspondingly low in the SVAP. Conservationists in<br />
the field who participated in the trial were surveyed on<br />
the usability <strong>and</strong> value of the protocol. The participants<br />
indicated that they found it easy to use <strong>and</strong><br />
thought it would be valuable for their clients.<br />
Revisions were made to the draft to address the deficiencies<br />
identified in the field trial, <strong>and</strong> some reassessments<br />
were made during the winter of 1998 to see how<br />
the revisions affected performance. Performance was<br />
improved. Additional revisions were made, <strong>and</strong> the<br />
fifth draft was sent to all NRCS state offices, selected<br />
Federal agencies, <strong>and</strong> other partners for review <strong>and</strong><br />
comment during the spring of 1998.<br />
Comments were received from eight NRCS state<br />
offices, the Bureau of L<strong>and</strong> Management, <strong>and</strong> several<br />
NRCS national specialists. Comments were uniformly<br />
supportive of the need for the guidance <strong>and</strong> for the<br />
document as drafted. Many commenters provided<br />
improved explanatory text for the supporting descriptions<br />
accompanying the assessment elements. Most of<br />
the suggested revisions were incorporated.<br />
Implementation<br />
The SVAP is issued as a national product. States are<br />
encouraged to incorporate it within the Field Office<br />
Technical Guide. The document may be modified by<br />
States. The electronic file for the document may be<br />
downloaded from the National Water <strong>and</strong> Climate<br />
Center web site at http://www.wcc.nrcs.usda.gov.<br />
A training course for conservationists in the field<br />
suitable for use at the state or area level has been<br />
developed to facilitate implementation of the SVAP. It<br />
is designed as either a 1-day or 2-day session. The first<br />
day covers basic stream ecology <strong>and</strong> use of the SVAP.<br />
The second day includes an overview of several<br />
stream assessment methods, instruction on a macroinvertebrate<br />
survey method, <strong>and</strong> field exercises to<br />
apply the SVAP <strong>and</strong> macroinvertibrate protocols. The<br />
training materials consist of an instructor's guide,<br />
slides, video, a macroinvertebrate assessment training<br />
kit, <strong>and</strong> a student workbook. Training materials have<br />
been provided to each NRCS state office.<br />
Instructions for modification<br />
The national version of the Stream Visual Assessment<br />
Protocol may be used without modification. It has<br />
been designed to use assessment elements that are<br />
least sensitive to regional differences. Nonetheless, it<br />
can be modified to better reflect conditions within a<br />
geographic area. Modifying the protocol would have<br />
the following benefits:<br />
• The protocol can be made easier to use with narrative<br />
descriptions that are closer to the conditions<br />
users will encounter.<br />
• The protocol can be made more responsive to<br />
differences in stream condition.<br />
• Precision can be improved by modifying elements<br />
that users have trouble evaluating.<br />
• The rating scale can be calibrated to regionallybased<br />
criteria for excellent, good, fair, <strong>and</strong> poor<br />
condition.<br />
Figure 4<br />
Relationship of various stream condition assessment methods in terms of complexity or expertise required <strong>and</strong> the<br />
aspects of stream condition addressed<br />
Difficult<br />
or more<br />
expertise<br />
needed<br />
National H<strong>and</strong>book<br />
of WQ Monitoring<br />
Tier 4 Biotic Assessment<br />
Geomorphic analysis<br />
Proper functioning condition<br />
Tier 3 Biotic Assessment<br />
WQ Indicators Guide<br />
Stream Visual Assessment<br />
Simple<br />
Chemical<br />
Biological<br />
Physical<br />
22 (NWCC Technical Note 99–1, Stream Visual Assessment Protocol, December 1998)
Two parts of the SVAP may be modified—the individual<br />
elements <strong>and</strong> their narrative descriptions, <strong>and</strong><br />
the rating scale for assigning an overall condition rating<br />
of excellent, good, fair, or poor.<br />
The simplest approach to modifying the SVAP is based<br />
on professional experience <strong>and</strong> judgment. Under this<br />
approach an interdisciplinary team should be assembled<br />
to develop proposed revisions. Revisions<br />
should then be evaluated by conducting comparison<br />
assessments at sites representing a range of conditions<br />
<strong>and</strong> evaluating accuracy (correlation between different<br />
assessment methods), precision (reproducibility<br />
among different users), <strong>and</strong> ease of use.<br />
A second, more scientifically rigorous method for<br />
modifying the protocol is described below. This approach<br />
is based on a classification system for stream<br />
type <strong>and</strong> the use of reference sites.<br />
Step 1 Decide on tentative number of versions.<br />
Do you want to develop a revised version for your<br />
state, for each ecoregion within your state, or for<br />
several stream classes within each ecoregion?<br />
Step 2 Develop tentative stream classification.<br />
If you are developing protocols by stream class, you<br />
need to develop a tentative classification system. (If<br />
you are interested in a statewide or ecoregion protocol,<br />
go to step 3.) You might develop a classification system<br />
based on stream order, elevation, or l<strong>and</strong>scape character.<br />
Do not create too many categories. The greater the<br />
number of categories, the more assessment work will<br />
be needed to modify the protocol <strong>and</strong> the more you will<br />
be accommodating degradation within the evaluation<br />
system. As an extreme example of the latter problem,<br />
you would not want to create a stream class consisting<br />
of those streams that have bank-to-bank cropping <strong>and</strong><br />
at least one sewage outfall.<br />
Step 3 Assess sites.<br />
Assess a series of sites representing a range of conditions<br />
from highly impacted sites to least impacted sites.<br />
Try to have at least 10 sites in each of your tentative<br />
classes. Those sites should include several potential<br />
“least impacted reference sites.” Try to use sites that<br />
have been assessed by other assessment methods<br />
(such as sites assessed by state agencies or universities).<br />
As part of the assessments, be sure to record<br />
information on potential classification factors <strong>and</strong> if<br />
any particular elements are difficult to score. Take<br />
notes so that future revisions of the elements can be rescored<br />
without another site visit.<br />
Step 4 Rank the sites.<br />
Begin your data analysis by ranking all the sites from<br />
most impacted to least impacted. Rank sites according<br />
to the independent assessment results (preferred) or<br />
by the SVAP scores. Initially, rank all of the sites in the<br />
state data set. You will test classifications in subsequent<br />
iterations.<br />
Step 5 Display scoring data.<br />
Prepare a chart of the data from all sites in your state.<br />
The columns are the sites arranged by the ranking. The<br />
rows are the assessment elements, the overall numerical<br />
score, <strong>and</strong> the narrative rating. If you have independent<br />
assessment data, create a second chart by<br />
plotting the overall SVAP scores against the independent<br />
scores.<br />
Step 6 Evaluate responsiveness.<br />
Does the SVAP score change in response to the condition<br />
gradient represented by the different sites? Are<br />
the individual element scores responding to key resource<br />
problems? Were users comfortable with all<br />
elements? If the answers are yes, do not change the<br />
elements <strong>and</strong> proceed to step 7. If the answers are no,<br />
isolate which elements are not responsive. Revise the<br />
narrative descriptions for those elements to better<br />
respond to the observable conditions. Conduct a<br />
"desktop" reassessment of the sites with the new<br />
descriptions, <strong>and</strong> return to step 4.<br />
Step 7 Evaluate the narrative rating breakpoints.<br />
Do the breakpoints for the narrative rating correspond<br />
to other assessment results? The excellent range<br />
should encompass only reference sites. If not, you<br />
should reset the narrative rating breakpoints. Set the<br />
excellent breakpoint based on the least impacted<br />
reference sites. You must use judgment to set the<br />
other breakpoints.<br />
Step 8 Evaluate tentative classification system.<br />
Go back to step 4 <strong>and</strong> display your data this time by<br />
the tentative classes (ecoregions or stream classes). In<br />
other words, analyze sites from each ecoregion or<br />
each stream class separately. Repeat steps 5 through 7.<br />
If the responsiveness is significantly different from the<br />
responsiveness of the statewide data set or the breakpoints<br />
appear to be significantly different, adopt the<br />
classification system <strong>and</strong> revise the protocol for each<br />
ecoregion or stream class. If not, a single statewide<br />
protocol is adequate.<br />
(NWCC Technical Note 99–1, Stream Visual Assessment Protocol, December 1998) 23
After the initial modification of the SVAP, the state<br />
may want to set up a process to consider future revisions.<br />
Field offices should be encouraged to locate <strong>and</strong><br />
assess least impacted reference sites to build the data<br />
base for interpretation <strong>and</strong> future revisions. Ancillary<br />
data should be collected to help evaluate whether a<br />
potential reference site should be considered a reference<br />
site.<br />
Caution should be exercised when considering future<br />
revisions. Revisions complicate comparing SVAP<br />
scores determined before <strong>and</strong> after the implementation<br />
of conservation practices if the protocol is substantially<br />
revised in the intervening period. Developing<br />
information to support refining the SVAP can be<br />
carried out by graduate students working cooperatively<br />
with NRCS. The Aquatic Assessment Workgroup<br />
has been conducting a pilot Graduate Student Fellowship<br />
program to evaluate whether students would be<br />
willing to work cooperatively for a small stipend. Early<br />
results indicate that students can provide valuable<br />
assistance. However, student response to advertisements<br />
has varied among states. If the pilot is successful,<br />
the program will be exp<strong>and</strong>ed.<br />
24 (NWCC Technical Note 99–1, Stream Visual Assessment Protocol, December 1998)
References<br />
Binns, N.A., <strong>and</strong> F.M. Eiserman. 1979. Quantification<br />
of fluvial trout habitat in Wyoming. Trans. Am.<br />
Fish. Soc. 103(3): 215-228.<br />
California Department of Fish <strong>and</strong> Game. 1996. California<br />
stream bioassessment procedures. Aquatic<br />
Bioassessment Lab.<br />
Chambers, J.R. 1992. U.S. coastal habitat degradation<br />
<strong>and</strong> fishery declines. Trans. N. Am. Widl. <strong>and</strong><br />
Nat. Res. Conf. 57(11-19).<br />
Davis, W.S., <strong>and</strong> T.P. Simon (eds.). 1995. Biological<br />
assessment <strong>and</strong> criteria: tools for water resource<br />
planning <strong>and</strong> decision making. Lewis Publ., Boca<br />
Raton, FL.<br />
Detenbeck, N.E., P.W. DeVore, G.J. Niemi, <strong>and</strong> A.<br />
Lima. 1992. Recovery of temperate stream fish<br />
communities from disturbance: a review of case<br />
studies <strong>and</strong> synthesis of theory. Env. Man.<br />
16:33-53.<br />
Etneir, D.A., <strong>and</strong> W.C. Starnes. 1993. The fishes of<br />
Tennessee. Univ. TN Press, Knoxville, TN.<br />
Idaho Division of Environmental Quality. 1996. 1996<br />
beneficial use reconnaissance project workplan.<br />
IDHW-300-83270-05/96.<br />
Izaak Walton League of America. 1994. Save our<br />
streams stream quality survey. IWLA, 707 Conservation<br />
Lane, Gaithersburg, MD.<br />
Karr, J.R., K.D. Fausch, P.L. Angermier, P.R. Yant,<br />
<strong>and</strong> I.J. Schlosser. 1986. Assessing biological<br />
integrity in running waters: a method <strong>and</strong> its<br />
rationale. IL Natl. Hist. Surv. Spec. Pub. 5,<br />
Champaign, IL.<br />
Minckley, W.L., <strong>and</strong> J.E. Deacon. 1991. Battle against<br />
extinction. Univ. AZ Press, Tucson, AZ.<br />
Mullan, J.W. 1986. Detriments of sockeye salmon<br />
abundance in the Columbia River, 1880's-1982: a<br />
review <strong>and</strong> synthesis. U.S. Fish <strong>and</strong> Wildl. Serv.<br />
Biol. Rep. 86(12).<br />
New Jersey Department of Environmental Protection.<br />
1987. Water watch field guide.<br />
Ohio Environmental Protection Agency. 1989. Biological<br />
criteria for the protection of aquatic life:<br />
volume III. St<strong>and</strong>ardized biological field sampling<br />
<strong>and</strong> laboratory methods for assessing fish<br />
<strong>and</strong> invertebrate communities. Columbus, OH.<br />
Omernick, J.M. 1995. Ecoregions: a spatial framework<br />
for environmental management. In Biological<br />
assessment <strong>and</strong> criteria: tools for water resource<br />
planning <strong>and</strong> decision making, W.S.Davis <strong>and</strong><br />
T.P. Simon (eds.), Lewis Publ., Boca Raton, FL,<br />
pp. 49-62.<br />
Rosgen, D. 1996. Applied river morphology. Wildl<strong>and</strong><br />
Hydrol., Pagosa Springs, CO.<br />
Terrell, J.W., T.E. McMahon, P.D. Inskip, R.F. Raleigh,<br />
<strong>and</strong> K.L. Williamson. 1982. Habitat suitability<br />
index models: appendix A. Guidelines for riverine<br />
<strong>and</strong> lacustrine applications of fish HSI<br />
models with the habitat evaluation procedures.<br />
U.S. Dep. Int., Fish <strong>and</strong> Wildl. Serv. FWS/OBS-82/<br />
10A.<br />
University of Montana. 1997. Assessing health of a<br />
riparian site (draft). School of Forestry, Univ.<br />
MT, Missoula, MT.<br />
United States Department of Agriculture, Forest Service.<br />
1997. R1/R4 Fish <strong>and</strong> fish habitat st<strong>and</strong>ard<br />
inventory procedures h<strong>and</strong>book. INT-GTR-346.<br />
United States Department of Agriculture, Soil Conservation<br />
Service. 1989. Water quality indicators<br />
guide: surface waters. SCS-TP-161 (now available<br />
from the Terrene Institute, Alex<strong>and</strong>ria, VA).<br />
United States Department of Agriculture, Natural<br />
Resources Conservation Service. 1997. National<br />
h<strong>and</strong>book of water quality monitoring. Part 600<br />
Natl. Water Quality H<strong>and</strong>b.<br />
United States Environmental Protection Agency. 1989.<br />
Rapid bioassessment protocols for use in steams<br />
<strong>and</strong> rivers: benthic macroinvertebrates <strong>and</strong> fish.<br />
EPA/440/4-89/001.<br />
United States Environmental Protection Agency. 1990.<br />
Macroinvertebrate field <strong>and</strong> laboratory methods<br />
for evaluating the biological integrity of surface<br />
waters. EPA/600/4-90/030.<br />
United States Environmental Protection Agency. 1997.<br />
Volunteer stream monitoring: A Methods Manual.<br />
EPA 841-B-97-003.<br />
(NWCC Technical Note 99–1, Stream Visual Assessment Protocol, December 1998) 25
United States Environmental Protection Agency. 1997.<br />
Field <strong>and</strong> laboratory methods for macroinvertebrate<br />
<strong>and</strong> habitat assessment of low gradient<br />
nontidal streams. Mid-Atlantic Coastal Streams<br />
Workgroup, Environ. Serv. Div., EPA Region 3,<br />
Wheeling, WV.<br />
United States Department of Interior, Bureau of L<strong>and</strong><br />
Management. 1993. Riparian area management:<br />
process for assessing proper functioning condition.<br />
TR 1737-9.<br />
United States Department of Interior, Geologic Survey.<br />
1993. Methods for characterizing stream habitat<br />
as part of the national water quality assessment<br />
program. Open File Rep. 93-408.<br />
Williams, J.D. 1981. Threatened warmwater stream<br />
fishes <strong>and</strong> the Endangered Species Act: a review.<br />
In L.A. Krumholz, ed. The Warmwater Streams<br />
Symposium. Am. Fish. Soc. South Div., Bethesda,<br />
MD.<br />
26 (NWCC Technical Note 99–1, Stream Visual Assessment Protocol, December 1998)
Glossary<br />
Active channel width<br />
Aggradation<br />
Bankfull discharge<br />
Bankfull stage<br />
Baseflow<br />
Benthos<br />
Boulders<br />
Channel<br />
Channel roughness<br />
Channelization<br />
Cobbles<br />
Confined channel<br />
Degradation<br />
Downcutting<br />
Ecoregion<br />
Embeddedness<br />
Emergent plants<br />
Flood plain<br />
Forb<br />
The width of the stream at the bankfull discharge. Permanent vegetation<br />
generally does not become established in the active channel.<br />
Geologic process by which a stream bottom or flood plain is raised in<br />
elevation by the deposition of material.<br />
The stream discharge (flow rate, such as cubic feet per second) that forms<br />
<strong>and</strong> controls the shape <strong>and</strong> size of the active channel <strong>and</strong> creates the flood<br />
plain. This discharge generally occurs once every 1.5 years on average.<br />
The stage at which water starts to flow over the flood plain; the elevation<br />
of the water surface at bankfull discharge.<br />
The portion of streamflow that is derived from natural storage; average<br />
stream discharge during low flow conditions.<br />
Bottom-dwelling or substrate-oriented organisms.<br />
Large rocks measuring more than 10 inches across.<br />
A natural or artificial waterway of perceptible extent that periodically or<br />
continuously contains moving water. It has a definite bed <strong>and</strong> banks that<br />
serve to confine the water.<br />
Physical elements of a stream channel upon which flow energy is expended<br />
including coarseness <strong>and</strong> texture of bed material, the curvature of the<br />
channel, <strong>and</strong> variation in the longitudinal profile.<br />
Straightening of a stream channel to make water move faster.<br />
Medium-sized rocks which measure 2.5 to 10 inches across.<br />
A channel that does not have access to a flood plain.<br />
Geologic process by which a stream bottom is lowered in elevation due to<br />
the net loss of substrate material. Often called downcutting.<br />
See Degradation.<br />
A geographic area defined by similarity of climate, l<strong>and</strong>form, soil, potential<br />
natural vegetation, hydrology, or other ecologically relevant variables.<br />
The degree to which an object is buried in steam sediment.<br />
Aquatic plants that extend out of the water.<br />
The flat area of l<strong>and</strong> adjacent to a stream that is formed by current flood<br />
processes.<br />
Any broad-leaved herbaceous plant other than those in the Gramineae<br />
(Poceae), Cyperacea, <strong>and</strong> Juncaceae families (Society for Range Management,<br />
1989).<br />
(NWCC Technical Note 99–1, Stream Visual Assessment Protocol, December 1998) 27
Gabions<br />
Geomorphology<br />
Glide<br />
Gradient<br />
Grass<br />
Gravel<br />
Habitat<br />
Herbaceous<br />
Hydrology<br />
Incised channel<br />
Intermittent stream<br />
Macrophyte bed<br />
Me<strong>and</strong>er<br />
Macroinvertebrate<br />
Nickpoint<br />
Perennial stream<br />
Point bar<br />
Pool<br />
Reach<br />
Riffle<br />
A wire basket filled with rocks; used to stabilize streambanks <strong>and</strong> to control<br />
erosion.<br />
The study of the evolution <strong>and</strong> configuration of l<strong>and</strong>forms.<br />
A fast water habitat type that has low to moderate velocities, no surface<br />
agitation, no defined thalweg, <strong>and</strong> a U-shaped, smooth, wide bottom.<br />
Slope calculated as the amount of vertical rise over horizontal run expressed<br />
as ft/ft or as percent (ft/ft * 100).<br />
An annual to perennial herb, generally with round erect stems <strong>and</strong> swollen<br />
nodes; leaves are alternate <strong>and</strong> two-ranked; flowers are in spikelets each<br />
subtended by two bracts.<br />
Small rocks measuring 0.25 to 2.5 inches across.<br />
The area or environment in which an organism lives.<br />
Plants with nonwoody stems.<br />
The study of the properties, distribution, <strong>and</strong> effects of water on the Earth's<br />
surface, soil, <strong>and</strong> atmosphere.<br />
A channel with a streambed lower in elevation than its historic elevation in<br />
relation to the flood plain.<br />
A stream in contact with the ground water table that flows only certain<br />
times of the year, such as when the ground water table is high or when it<br />
receives water from surface sources.<br />
A section of stream covered by a dense mat of aquatic plants.<br />
A winding section of stream with many bends that is at least 1.2 times<br />
longer, following the channel, than its straight-line distance. A single me<strong>and</strong>er<br />
generally comprises two complete opposing bends, starting from the<br />
relatively straight section of the channel just before the first bend to the<br />
relatively straight section just after the second bend.<br />
A spineless animal visible to the naked eye or larger than 0.5 millimeters.<br />
The point where a stream is actively eroding (downcutting) to a new base<br />
elevation. Nickpoints migrate upstream (through a process called<br />
headcutting).<br />
A steam that flows continuously throughout the year.<br />
A gravel or s<strong>and</strong> deposit on the inside of a me<strong>and</strong>er; an actively mobile<br />
river feature.<br />
Deeper area of a stream with slow-moving water.<br />
A section of stream (defined in a variety of ways, such as the section between<br />
tributaries or a section with consistent characteristics).<br />
A shallow section in a stream where water is breaking over rocks, wood, or<br />
other partly submerged debris <strong>and</strong> producing surface agitation.<br />
28 (NWCC Technical Note 99–1, Stream Visual Assessment Protocol, December 1998)
Riparian<br />
Riprap<br />
Run<br />
Scouring<br />
Sedge<br />
Substrate<br />
Surface fines<br />
Thalweg<br />
Turbidity<br />
Watershed<br />
The zone adjacent to a stream or any other waterbody (from the Latin word<br />
ripa, pertaining to the bank of a river, pond, or lake).<br />
Rock material of varying size used to stabilize streambanks <strong>and</strong> other<br />
slopes.<br />
A fast-moving section of a stream with a defined thalweg <strong>and</strong> little surface<br />
agitation.<br />
The erosive removal of material from the stream bottom <strong>and</strong> banks.<br />
A grasslike, fibrous-rooted herb with a triangular to round stem <strong>and</strong> leaves<br />
that are mostly three-ranked <strong>and</strong> with close sheaths; flowers are in spikes<br />
or spikelets, axillary to single bracts.<br />
The mineral or organic material that forms the bed of the stream; the<br />
surface on which aquatic organisms live.<br />
That portion of streambed surface consisting of s<strong>and</strong>/silt (less than 6 mm).<br />
The line followed by the majority of the streamflow. The line connecting<br />
the lowest or deepest points along the streambed.<br />
Murkiness or cloudiness of water caused by particles, such as fine sediment<br />
(silts, clays) <strong>and</strong> algae.<br />
A ridge of high l<strong>and</strong> dividing two areas that are drained by different river<br />
systems. The l<strong>and</strong> area draining to a waterbody or point in a river system;<br />
catchment area, drainage basin, drainage area.<br />
(NWCC Technical Note 99–1, Stream Visual Assessment Protocol, December 1998) 29
30 (NWCC Technical Note 99–1, Stream Visual Assessment Protocol, December 1998)
Appendix A—1997 <strong>and</strong> 1998 Field Trial Results<br />
Purpose <strong>and</strong> methods<br />
The purpose of the field trials was to evaluate the<br />
accuracy, precision, <strong>and</strong> usability of the draft Steam<br />
Visual Assessment Protocol. The draft protocols<br />
evaluated were the third draft dated May 1997 <strong>and</strong> the<br />
fourth draft dated October 1997. A field trial workplan<br />
was developed with study guidelines <strong>and</strong> a survey<br />
form to solicit feedback from users. Accuracy was<br />
evaluated by comparison to other stream assessment<br />
methods. Precision was evaluated by replicate assessments<br />
conduced by different individuals at the same<br />
sites. In all studies an attempt was made to utilize sites<br />
ranging from high quality to degraded. Results consisted<br />
of the scoring data <strong>and</strong> the user feedback form<br />
for each site.<br />
Results<br />
Overall, 182 sites were assessed, <strong>and</strong> approximately 60<br />
individuals participated in the field trials. The individual<br />
studies are summarized in table A–1.<br />
Precision could be evaluated using data from the<br />
Colorado, New Jersey, Oregon, Virginia, <strong>and</strong> Georgia<br />
studies. Results are summarized in table A–2. The New<br />
Jersey sites had coefficients of variation of 9.0 (n=8),<br />
14.4 (n=5), <strong>and</strong> 5.7 (n=4) percent. The Oregon site with<br />
three replicates was part of a course <strong>and</strong> had a coefficient<br />
of variation of 11.1 percent. One Georgia site was<br />
assessed using the fourth draft during a pilot of the<br />
training course. There were 11 replicates, <strong>and</strong> the<br />
coefficient of variation was 8.8 percent. In May 1998<br />
the workgroup conducted replicate assessments of<br />
two sites in Virginia using the fifth draft of the protocol.<br />
Coefficients of variation were 14.7 <strong>and</strong> 3.6 percent.<br />
The average coefficient of variation of all studies in<br />
table A–2 is 10.5 percent.<br />
Variability within the individual elements of the SVAP<br />
was evaluated using the Georgia site with 11 replicates.<br />
The results of the individual element scores are<br />
presented in figure A–1. It should be noted that two<br />
individuals erroneously rated the "presence of manure"<br />
element.<br />
Accuracy was evaluated by comparing the SVAP rating<br />
to other methods as noted in table A–1. Some of the<br />
comparisons involved professional judgment. In others<br />
the SVAP score could be compared with a quantitative<br />
evaluation. Figures A–2 through A–5 present data from<br />
the two studies that had larger numbers of sites. The<br />
Pearson's Correlation Coefficient is presented for<br />
these data. The results from other sites are presented<br />
in table A–3.<br />
Table A–1<br />
Summary of studies in the field trial<br />
Location Number of Number of SVAP compared to SVAP conducted by<br />
sites<br />
replicates<br />
VA 56 3, 5 IBI (fish) <strong>and</strong> Ohio QHEI FO personnel<br />
NC/SC 90 none IBI, EPT Soil scientists<br />
MI 5 none professional judgment State biologist<br />
<strong>NJ</strong> 3 4, 5, 8 <strong>NJ</strong>DEP ratings FO personnel<br />
OR 3 none IBI NWCC scientist<br />
CO 1 3 professional judgment FO personnel<br />
WA 3 none professional judgment State biologist<br />
OR 2 3 no comparisons FO personnel<br />
GA 8 4-5 macroinvertebrates FO personnel<br />
GA 2 12, none IBI, macroinvertebrate FO personnel<br />
(NWCC Technical Note 99–1, Stream Visual Assessment Protocol, December 1998) 31
Figure A–1<br />
10<br />
8<br />
Scores<br />
6<br />
4<br />
2<br />
0<br />
Means <strong>and</strong> st<strong>and</strong>ard deviations from the<br />
Parker’s Mill Creek site in Americus, GA<br />
(n=11) (mean plus <strong>and</strong> minus one st<strong>and</strong>ard<br />
deviation is shown; SVAP version 4 used)<br />
The SVAP version 3 scores correlated extremely well<br />
with the Ohio Qualitative Habitat Index <strong>and</strong> reasonably<br />
well with the fish community IBI in the Virginia<br />
study (fig. A–2 <strong>and</strong> A–3). However, the SVAP version 3<br />
scores in the Carolinas study did not correlate well<br />
with either IBI or EPT Taxa (fig. A–4 <strong>and</strong> A–5). These<br />
results may reflect the fact that the SVAP primarily<br />
assesses physical habitat within the assessment reach<br />
whereas IBI <strong>and</strong> EPT Taxa are influenced by both<br />
physical habitat within the assessment reach <strong>and</strong><br />
conditions within the watershed. Onsite physical<br />
habitat may have been a relatively more important<br />
factor at the Virginia sites than at the Carolina sites.<br />
-2<br />
Channel<br />
Hydrol<br />
Riparian<br />
Bank sta<br />
Canopy<br />
Watera<br />
Nutrient<br />
Manure<br />
Fish bar<br />
Fish cov<br />
SVAP elements<br />
Pools<br />
Riffle<br />
Inv hab<br />
Macroin<br />
Final<br />
Overall, the field trial results for the third draft seemed<br />
to indicate that SVAP scores reflected conditions for<br />
sites in good to moderate condition. However, SVAP<br />
scores tended to be too high for poor quality sites.<br />
Both the user questionnaires <strong>and</strong> verbal feedback<br />
indicated that users found the SVAP easy to use. Users<br />
reported that they thought it would be an effective tool<br />
to use with l<strong>and</strong>owners. The majority indicated that<br />
they would recommend it to l<strong>and</strong>owners.<br />
Table A–2<br />
Summary of replication results (version refers to the SVAP draft used; mean for overall score reported)<br />
Site SVAP No. Mean 1/ St<strong>and</strong>ard Coefficient<br />
version replicates deviation of variation<br />
Alloway Cr. <strong>NJ</strong> 3 5 3.6 F 0.52 14.4<br />
Manasquan R. <strong>NJ</strong> 3 4 5.1 G 0.29 5.7<br />
S. Br. Raritan R. <strong>NJ</strong> 3 8 5.9 G 0.53 9.0<br />
Gales Cr. OR 3 3 5.5 G 0.61 11.1<br />
Clear Cr. CO 3 3 5.4 G 0.74 13.7<br />
Piscola Cr. GA #1 4 5 9.2 E 0.77 8.4<br />
Piscola Cr. GA #2 4 5 9.0 E 0.85 9.4<br />
Piscola Cr. GA #3 4 4 4.7 F 1.10 23.4<br />
Piscola Cr. GA #4 4 4 7.4 G 0.96 13.0<br />
Little R. GA # 1 4 4 8.3 E 0.73 8.8<br />
Little R. GA # 2 4 4 7.4 E 0.83 11.2<br />
Little R. GA # 3 4 4 8.1 E 0.41 5.1<br />
Little R. GA # 4 4 4 7.3 G 0.60 8.2<br />
Parker’s Mill Cr. GA 4 11 5.7 F 0.50 8.8<br />
Cedar Run (up), VA 5 5 7.7 G 1.1 14.7<br />
Cedar R. (down), VA 5 5 6.6 F .2 3.6<br />
1/ Includes SVAP narrative ratings (P = poor, F = fair, G = good, E = excellent)<br />
32 (NWCC Technical Note 99–1, Stream Visual Assessment Protocol, December 1998)
Table A–3<br />
Accuracy comparison data from studies with too few sites to determine a correlation coefficient<br />
Site SVAP SVAP score <strong>and</strong> rating Comparative rating Comparative method<br />
version<br />
Alloway Cr. <strong>NJ</strong> 3 3.6* — fair 12 — mod. impaired <strong>NJ</strong>IS (macro.)<br />
Manasquan R. <strong>NJ</strong> 3 5.1* — good 12 — mod. impaired <strong>NJ</strong>IS (macro.)<br />
S. Br. Raritan R. <strong>NJ</strong> 3 5.9* — good 30 — not impaired <strong>NJ</strong>IS (macro.)<br />
Site 1 OR 3 2.7 — fair 12 — very poor IBI (fish)<br />
Site 2 OR 3 4.6 — good 22 — poor IBI (fish)<br />
Site 3 OR 3 7.0 — excellent 44 — good IBI (fish)<br />
Muckalee Cr. GA 4 8.6 — good good to excellent mussel taxa<br />
* Mean value of replicates<br />
Figure A–2<br />
50<br />
40<br />
Correlation between SVAP <strong>and</strong> IBI values in<br />
the Virginia study (n=56)<br />
r=0.63, p=0.0001<br />
Figure A–3<br />
8<br />
7<br />
r=0.91, p=0.0001<br />
Correlation between SVAP <strong>and</strong> Ohio Qualitative<br />
Habitat Evaluation Index values in the<br />
Virginia study (n=56)<br />
IBI<br />
30<br />
20<br />
NRCS, SVAP<br />
6<br />
5<br />
4<br />
0 0 4 5 6 7 8<br />
NRCS, SVAP<br />
0<br />
40 50 60 70 80 90<br />
Ohio, QHEI<br />
Figure A–4<br />
Correlation between SVAP <strong>and</strong> IBI values in<br />
the Carolinas study (n=90)<br />
Figure A–5<br />
Correlation between SVAP <strong>and</strong> macroinvertebrate<br />
index values in Carolinas study (n=90)<br />
Fish community IBI<br />
60<br />
55<br />
50<br />
45<br />
40<br />
35<br />
30<br />
25<br />
20<br />
15<br />
r=0.19, p=0.1<br />
10<br />
2 3<br />
4 5 6 7<br />
SVAP Version 3 score<br />
Number EPT taxa<br />
30<br />
r=0.2584, p=0.02<br />
25<br />
20<br />
15<br />
10<br />
5<br />
0<br />
2 3 4 5 6 7<br />
SVAP Version 3 score<br />
(NWCC Technical Note 99–1, Stream Visual Assessment Protocol, December 1998) 33
Discussion<br />
Overall, the workgroup concluded from the first field<br />
trial that the SVAP could be used by conservationists<br />
in the field with reasonable reproducibility <strong>and</strong> a level<br />
of accuracy commensurate with its objective of providing<br />
a basic assessment of ecological condition<br />
provided the poor response to degraded streams could<br />
be corrected.<br />
Several potential causes for the lack of accuracy with<br />
degraded sites were identified by the workgroup as<br />
follows:<br />
• Because the overall score is an average of all assessed<br />
elements, the effect of low scoring elements<br />
can be damped out by averaging if the degradation<br />
is not picked up by many of the other assessed<br />
elements.<br />
• Some of the elements needed to be adjusted to give<br />
lower scores for problems.<br />
• The numerical breakpoints for the narrative ratings<br />
of poor/fair <strong>and</strong> fair/good were set too low.<br />
To correct these problems the number of assessment<br />
elements was reduced <strong>and</strong> the instructions were<br />
modified so that certain elements are not scored if<br />
they do not apply. For example, the "presence of<br />
manure" element is not scored unless there are animal<br />
operations present. These changes reduced the potential<br />
for low scores to be damped out by the averaging<br />
process.<br />
Several elements were also rewritten to reduce ambiguity<br />
at the low end of the rating scale. Additionally,<br />
several elements were rewritten to have five narrative<br />
descriptions instead of four to address a concern that<br />
users might err on the high side. The scoring scale was<br />
changed from a scale of 1 to 7 to a scale of 1 to 10<br />
because it was felt that most people have a tendency<br />
to think in terms of a decimal scale.<br />
The revisions were incorporated into a fourth draft<br />
<strong>and</strong> evaluated by the workgroup. Sites from the first<br />
field trial were rescored using the new draft. Response<br />
seemed to have improved as indicated by the greater<br />
separation of sites at lower scores in figure A–6.<br />
During pilot testing of the training materials in March<br />
1998, the fourth draft was used by 12 students independently<br />
at one site <strong>and</strong> collectively at another site.<br />
The coefficient of variation at the replication site was<br />
8.8 percent. One of the sites had been previously<br />
assessed using other methods, <strong>and</strong> the SVAP rating<br />
corresponded well to the previous assessments.<br />
After the evaluation of the fourth draft, minor revisions<br />
were made for the fifth draft. The breakpoints<br />
for the narrative rating of excellent, good, fair, <strong>and</strong><br />
poor for the fifth draft were set using the Virginia data<br />
set. These breakpoints may be adjusted by the NRCS<br />
state office as explained in this document.<br />
Figure A–6<br />
Version 4 score<br />
10<br />
8<br />
6<br />
4<br />
2<br />
Version 4 scores for VA plotted against<br />
version 3 scores (n=56)<br />
0<br />
0 1 2 3 4 5 6 7 8<br />
Version 3 score<br />
34 (NWCC Technical Note 99–1, Stream Visual Assessment Protocol, December 1998)
Stream Visual Assessment Protocol<br />
Owners name ___________________________________ Evaluator's name_______________________________ Date ________________<br />
Stream name _______________________________________________ Waterbody ID number ____________________________________<br />
Reach location _____________________________________________________________________________________________________<br />
__________________________________________________________________________________________________________________<br />
Ecoregion ___________________________________ Drainage area _______________________ Gradient__________________________<br />
Applicable reference site _____________________________________________________________________________________________<br />
L<strong>and</strong> use within drainage (%): row crop ______ hayl<strong>and</strong> ______ grazing/pasture _______ forest ______ residential _______<br />
confined animal feeding operations ______ Cons. Reserve ________ industrial _______ Other: _________________<br />
Weather conditions-today ______________________________________ Past 2-5 days __________________________________________<br />
Active channel width ______________________ Dominant substrate: boulder ______ gravel ______ s<strong>and</strong> ______ silt ______ mud ______<br />
Site Diagram<br />
(NWCC Technical Note 99–1, Stream Visual Assessment Protocol, December 1998) 35
Assessment Scores<br />
Channel condition<br />
Pools<br />
Hydrologic alteration<br />
Riparian zone<br />
Bank stability<br />
Water appearance<br />
Nutrient enrichment<br />
Barriers to fish movement<br />
Instream fish cover<br />
Invertebrate habitat<br />
Canopy cover<br />
Manure presence<br />
Salinity<br />
Score only if applicable<br />
Riffle embeddedness<br />
Marcroinvertebrates<br />
Observed (optional)<br />
Overall score<br />
(Total divided by number scored)<br />
9.0 Excellent<br />
Suspected causes of observed problems_____________________________________________________________________<br />
_____________________________________________________________________________________________________<br />
_____________________________________________________________________________________________________<br />
_____________________________________________________________________________________________________<br />
Recommendations______________________________________________________________________________________<br />
_____________________________________________________________________________________________________<br />
_____________________________________________________________________________________________________<br />
_____________________________________________________________________________________________________<br />
_____________________________________________________________________________________________________<br />
_____________________________________________________________________________________________________<br />
_____________________________________________________________________________________________________<br />
_____________________________________________________________________________________________________<br />
_____________________________________________________________________________________________________<br />
36 (NWCC Technical Note 99–1, Stream Visual Assessment Protocol, December 1998)
TRC Omni Environmental Corporation<br />
Stream Visual Assessment Protocol<br />
(Customized for <strong>Parvin</strong> <strong>Branch</strong> Stream Assessment)<br />
Team:______________________Date:______________________Time:______________ Site #:_________________<br />
Owners Name________________________ Evaluators Name_______________Phone______________<br />
Stream Name_______________________________________ Waterbody ID_______________________<br />
Reach Location_________________________________________________________________________<br />
______________________________________________________________________________________<br />
Applicable Reference Site_________________________________________________________________<br />
GPS Coordinates:_______________________________________________________________________<br />
Weather conditions today________________________________ Past 2-5 days______________________<br />
Active channel width________ Dominant substrate: boulder____ cobble ______ gravel_____ s<strong>and</strong>____ silt___ mud____<br />
Site Diagram: Note direction of flow<br />
Photo Notes: 1.______________________________ 2.__________________________________<br />
3.__________________________________________ 4.__________________________________<br />
5.__________________________________________ 6.__________________________________<br />
7.__________________________________________ 8.__________________________________<br />
9.__________________________________________ 10._________________________________
TRC Omni Environmental Corporation<br />
Assessment Scores (1-Poor to 10-Excellent)<br />
Channel Condition<br />
***(face upstream)***<br />
Pools<br />
Hydrologic Alteration<br />
(Score only if Applicable)<br />
Invertebrate habitat<br />
Riparian Zone Left: Right: Score only if applicable<br />
Bank Stability Left: Right: Canopy Cover<br />
Water Appearance<br />
Nutrient Enrichment<br />
Barriers to fish movement<br />
Instream fish cover<br />
Manure presence<br />
Salinity<br />
Riffle embeddedness<br />
(look in riffles)<br />
Macroinvertebrates<br />
Observed (optional<br />
Streamside L<strong>and</strong> Use:<br />
(within 50 ft. of top of bank)<br />
Check all that apply<br />
Overall Score 9.0 Excellent<br />
L<strong>and</strong> Use<br />
From L<strong>and</strong> Use Maps<br />
Observed in the field<br />
Category Left Bank Right Bank Left Bank Right Bank<br />
Forest<br />
Field/Pasture<br />
Agriculture<br />
Residential<br />
Commercial<br />
Industrial<br />
Other<br />
Outfall Pipe 1: (Photograph #__ <strong>and</strong> mark on site diagram) GPS Coordinates________________N<br />
Diameter ___________in<br />
____________________W<br />
Headwall? YES NO<br />
Streambank at outfall eroded? YES NO<br />
Pipe Material: concrete steel PVC Clay Other<br />
Location: in stream, top of bank, behind bank, bridge, other______<br />
Channel downstream eroded? YES NO Pipe comes from:_______________________________<br />
Flow appearance: clear, turbid, oily, foamy, colored, other________<br />
Outfall Pipe 2: (Photograph # __<strong>and</strong> mark on site diagram) GPS Coordinates___________________N<br />
Diameter ___________in.<br />
_____________________W<br />
Headwall? YES NO<br />
Streambank at outfall eroded? YES NO<br />
Pipe Material: concrete steel PVC Clay Other:<br />
Location: in stream, top of bank, behind bank, bridge, other______<br />
Channel downstream eroded? YES NO Pipe comes from:_______________________________<br />
Flow appearance: clear, turbid, oily, foamy, colored, other________
TRC Omni Environmental Corporation<br />
Drainage Ditch: (Photograph #__ <strong>and</strong> mark on site diagram) GPS Coordinates ________________N<br />
Width of ditch________ft<br />
________________W<br />
Begins at: __________________ Ditch lining: stone, vegetation, concrete, mud, other________<br />
Ditch is: Stable, Eroding<br />
Ditch Flow is: none, intermittent, Steady<br />
Stream channel downstream is: stable, eroded, silted Flow is: clear, cloudy, oily, foamy, colored<br />
Ditch comes from:<br />
Drainage Ditch: (Photograph #__ <strong>and</strong> mark on site diagram) GPS Coordinates _________________N<br />
Width of ditch________ft<br />
_________________W<br />
Begins at: __________________ Ditch lining: stone, vegetation, concrete, mud, other____________<br />
Ditch is: Stable, Eroding<br />
Ditch Flow is: none, intermittent, Steady<br />
Stream channel downstream is: stable, eroded, silted Flow is: clear, cloudy, oily, foamy, colored<br />
Ditch comes from:<br />
Comments, Suggestions:<br />
Suggestions for remediation along this reach?<br />
Problems not otherwise noted on this form?<br />
Access to this site…how far off of road is it?<br />
Debris, Trash, Litter? Natural or Manmade?
<strong>Parvin</strong> <strong>Branch</strong> <strong>and</strong> <strong>Tarkiln</strong> <strong>Branch</strong> Watershed Restoration Master Plan<br />
APPENDIX I<br />
Note: Please find this document on the data DVD. (90 pages, 4.5MB)
<strong>Parvin</strong> <strong>Branch</strong> <strong>and</strong> <strong>Tarkiln</strong> <strong>Branch</strong> Watershed Restoration Master Plan<br />
APPENDIX J<br />
<strong>Parvin</strong>-Tarklin GIS<br />
Perhaps the most powerful aspect of this project was the integration of data into a<br />
Geographic Information System or GIS. With the information assembled in the GIS, project<br />
partners were able to present <strong>and</strong> summarize the assembled information, provide analyses aimed at<br />
identifying watershed restoration issues, <strong>and</strong> develop recommendations for implementation<br />
initiatives to correct real problems.<br />
The project partners identified <strong>and</strong> collected all available data for the watershed necessary<br />
to clearly describe the region, prepared a comprehensive analysis, <strong>and</strong> identified issues related to<br />
riparian areas. Specifically, we acquired existing data from various sources including GIS layers<br />
from the <strong>NJ</strong>DEP’s GIS database, <strong>NJ</strong>DEP aerial photographs, United States Geological Survey<br />
(USGS) quadrangles, USGS water quality data, Natural Resource Conservation Service (NRCS)<br />
Soils information, AMNET data, <strong>and</strong> County GIS datasets. Using ESRI’s ArcView GIS, the<br />
partners evaluated:<br />
‣ Watershed boundaries, streams, flood plains, major wetl<strong>and</strong> areas, municipal <strong>and</strong> county<br />
borders, <strong>and</strong> major roads;<br />
‣ L<strong>and</strong> use for the entire watershed;<br />
‣ Key open space areas;<br />
‣ Point source discharge locations;<br />
‣ Point source water quality <strong>and</strong> flow data from the last five years;<br />
‣ Available in-stream water quality <strong>and</strong> flow data collected over the last five years;<br />
‣ Biological survey monitoring locations <strong>and</strong> results;<br />
‣ Stream classifications; <strong>and</strong><br />
‣ Riparian corridor assessment data collected during the project.<br />
A comprehensive <strong>and</strong> user-friendly mapping system utilizing ArcView GIS to characterize<br />
the watershed has been developed. The GIS integrates mapping <strong>and</strong> various geographic data<br />
together in easy-to-underst<strong>and</strong> layers allowing for interpretation by the viewer.<br />
Note: Please find this document on the data DVD. (Multiple documents, 1.5GB+)
<strong>Parvin</strong> <strong>Branch</strong> <strong>and</strong> <strong>Tarkiln</strong> <strong>Branch</strong> Watershed Restoration Master Plan<br />
APPENDIX K<br />
WMA 17 DATA GIS<br />
To access all data files including the GIS project (WMA17_Final.apr), all folders on this CD should be<br />
copied to a folder on a desktop computer <strong>and</strong> placed into the following folder.<br />
C:\MyFiles\2711<br />
From this location, the GIS project can be opened using Esri’s ArcView GIS <strong>and</strong> all links should be<br />
retained including hotlinks to available MS Excel data tables.<br />
This document was prepared by:<br />
TRC Omni Environmental Corporation<br />
Research Park, 321 Wall Street<br />
Princeton, New Jersey, 08540<br />
Phone: 609-924-8821<br />
Fax: 609-924-8831<br />
Email: rferrara@trcsolutions.com<br />
Note: Please find this document on the data DVD. (Multiple documents, 680 MB)
3/7/2007<br />
Appendix L<br />
WATERSHED MANAGEMENT AREA 17<br />
CHARACTERIZATION & ASSESSMENT<br />
README.DOC<br />
The folder on this disc, named “WMA17finalppt” contains an interactive PowerPoint presentation.<br />
These files will run directly from this cd-rom. The following are directions for preferred viewing of<br />
the contents of this cd.<br />
1. After inserting the disc, begin by opening PowerPoint.<br />
2. Navigate to File: Open: D:\WMA17finalppt\INTRO.ppt.<br />
3. Start the slide show.<br />
4. The presentation will walk the viewer through the content. Further instruction is<br />
located at the start of the presentation.<br />
5. When finished viewing, the Esc key will close all open shows. This may take several<br />
key punches to close everything.<br />
Note: Please find this document on the data DVD. (Multiple documents, 53 MB)