The Long-Term Effects of Africa's Slave Trades - Social Sciences ...
The Long-Term Effects of Africa's Slave Trades - Social Sciences ...
The Long-Term Effects of Africa's Slave Trades - Social Sciences ...

Create successful ePaper yourself
Turn your PDF publications into a flip-book with our unique Google optimized e-Paper software.
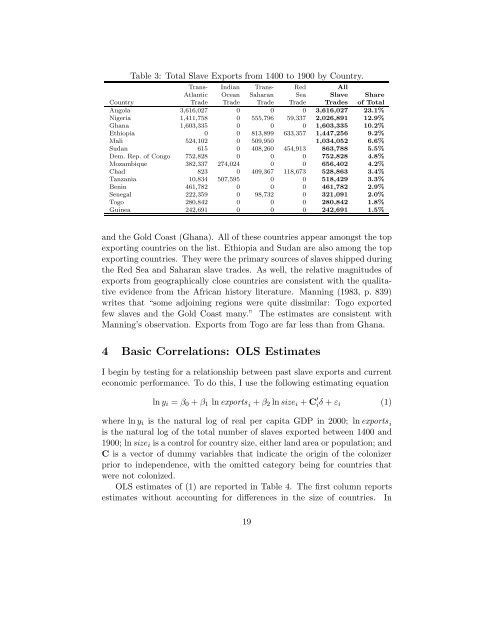
Table 3: Total <strong>Slave</strong> Exports from 1400 to 1900 by Country.<br />
Trans- Indian Trans- Red All<br />
Atlantic Ocean Saharan Sea <strong>Slave</strong> Share<br />
Country Trade Trade Trade Trade <strong>Trades</strong> <strong>of</strong> Total<br />
Angola 3,616,027 0 0 0 3,616,027 23.1%<br />
Nigeria 1,411,758 0 555,796 59,337 2,026,891 12.9%<br />
Ghana 1,603,335 0 0 0 1,603,335 10.2%<br />
Ethiopia 0 0 813,899 633,357 1,447,256 9.2%<br />
Mali 524,102 0 509,950 1,034,052 6.6%<br />
Sudan 615 0 408,260 454,913 863,788 5.5%<br />
Dem. Rep. <strong>of</strong> Congo 752,828 0 0 0 752,828 4.8%<br />
Mozambique 382,337 274,024 0 0 656,402 4.2%<br />
Chad 823 0 409,367 118,673 528,863 3.4%<br />
Tanzania 10,834 507,595 0 0 518,429 3.3%<br />
Benin 461,782 0 0 0 461,782 2.9%<br />
Senegal 222,359 0 98,732 0 321,091 2.0%<br />
Togo 280,842 0 0 0 280,842 1.8%<br />
Guinea 242,691 0 0 0 242,691 1.5%<br />
and the Gold Coast (Ghana). All <strong>of</strong> these countries appear amongst the top<br />
exporting countries on the list. Ethiopia and Sudan are also among the top<br />
exporting countries. <strong>The</strong>y were the primary sources <strong>of</strong> slaves shipped during<br />
the Red Sea and Saharan slave trades. As well, the relative magnitudes <strong>of</strong><br />
exports from geographically close countries are consistent with the qualitative<br />
evidence from the African history literature. Manning (1983, p. 839)<br />
writes that “some adjoining regions were quite dissimilar: Togo exported<br />
few slaves and the Gold Coast many.” <strong>The</strong> estimates are consistent with<br />
Manning’s observation. Exports from Togo are far less than from Ghana.<br />
4 Basic Correlations: OLS Estimates<br />
I begin by testing for a relationship between past slave exports and current<br />
economic performance. To do this, I use the following estimating equation<br />
ln y i = β 0 + β 1 lnexports i + β 2 lnsize i + C ′ iδ + ε i (1)<br />
where ln y i is the natural log <strong>of</strong> real per capita GDP in 2000; lnexports i<br />
is the natural log <strong>of</strong> the total number <strong>of</strong> slaves exported between 1400 and<br />
1900; lnsize i is a control for country size, either land area or population; and<br />
C is a vector <strong>of</strong> dummy variables that indicate the origin <strong>of</strong> the colonizer<br />
prior to independence, with the omitted category being for countries that<br />
were not colonized.<br />
OLS estimates <strong>of</strong> (1) are reported in Table 4. <strong>The</strong> first column reports<br />
estimates without accounting for differences in the size <strong>of</strong> countries. In<br />
19