Mars Entry Bank Profile Design for Terminal State Optimization
Mars Entry Bank Profile Design for Terminal State Optimization
Mars Entry Bank Profile Design for Terminal State Optimization

You also want an ePaper? Increase the reach of your titles
YUMPU automatically turns print PDFs into web optimized ePapers that Google loves.
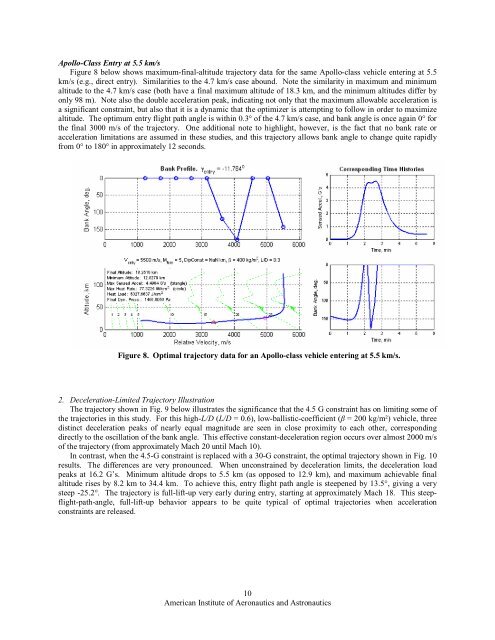
Apollo-Class <strong>Entry</strong> at 5.5 km/s<br />
Figure 8 below shows maximum-final-altitude trajectory data <strong>for</strong> the same Apollo-class vehicle entering at 5.5<br />
km/s (e.g., direct entry). Similarities to the 4.7 km/s case abound. Note the similarity in maximum and minimum<br />
altitude to the 4.7 km/s case (both have a final maximum altitude of 18.3 km, and the minimum altitudes differ by<br />
only 98 m). Note also the double acceleration peak, indicating not only that the maximum allowable acceleration is<br />
a significant constraint, but also that it is a dynamic that the optimizer is attempting to follow in order to maximize<br />
altitude. The optimum entry flight path angle is within 0.3° of the 4.7 km/s case, and bank angle is once again 0° <strong>for</strong><br />
the final 3000 m/s of the trajectory. One additional note to highlight, however, is the fact that no bank rate or<br />
acceleration limitations are assumed in these studies, and this trajectory allows bank angle to change quite rapidly<br />
from 0° to 180° in approximately 12 seconds.<br />
Figure 8. Optimal trajectory data <strong>for</strong> an Apollo-class vehicle entering at 5.5 km/s.<br />
2. Deceleration-Limited Trajectory Illustration<br />
The trajectory shown in Fig. 9 below illustrates the significance that the 4.5 G constraint has on limiting some of<br />
the trajectories in this study. For this high-L/D (L/D = 0.6), low-ballistic-coefficient (β = 200 kg/m²) vehicle, three<br />
distinct deceleration peaks of nearly equal magnitude are seen in close proximity to each other, corresponding<br />
directly to the oscillation of the bank angle. This effective constant-deceleration region occurs over almost 2000 m/s<br />
of the trajectory (from approximately Mach 20 until Mach 10).<br />
In contrast, when the 4.5-G constraint is replaced with a 30-G constraint, the optimal trajectory shown in Fig. 10<br />
results. The differences are very pronounced. When unconstrained by deceleration limits, the deceleration load<br />
peaks at 16.2 G’s. Minimum altitude drops to 5.5 km (as opposed to 12.9 km), and maximum achievable final<br />
altitude rises by 8.2 km to 34.4 km. To achieve this, entry flight path angle is steepened by 13.5°, giving a very<br />
steep -25.2°. The trajectory is full-lift-up very early during entry, starting at approximately Mach 18. This steepflight-path-angle,<br />
full-lift-up behavior appears to be quite typical of optimal trajectories when acceleration<br />
constraints are released.<br />
10<br />
American Institute of Aeronautics and Astronautics