Mars Entry Bank Profile Design for Terminal State Optimization
Mars Entry Bank Profile Design for Terminal State Optimization
Mars Entry Bank Profile Design for Terminal State Optimization

You also want an ePaper? Increase the reach of your titles
YUMPU automatically turns print PDFs into web optimized ePapers that Google loves.
AIAA Atmospheric Flight Mechanics Conference and Exhibit<br />
18 - 21 August 2008, Honolulu, Hawaii<br />
AIAA 2008-6213<br />
<strong>Mars</strong> <strong>Entry</strong> <strong>Bank</strong> <strong>Profile</strong> <strong>Design</strong><br />
<strong>for</strong> <strong>Terminal</strong> <strong>State</strong> <strong>Optimization</strong><br />
Jarret M. Lafleur * and Chris J. Cerimele †<br />
NASA Johnson Space Center, Houston, Texas 77058<br />
One challenge examined in NASA’s DRM 5.0 study is that of entry, descent, and landing<br />
(EDL) on <strong>Mars</strong> <strong>for</strong> high-ballistic-coefficient, human-class payloads. To define best-case<br />
entry scenarios <strong>for</strong> the evaluation of potential EDL system designs, a study is conducted to<br />
optimize the entry-to-terminal-state portion of EDL <strong>for</strong> a variety of entry velocities, vehicle<br />
ballistic coefficients (β), and lift-to-drag ratios (L/D). The terminal state is envisioned as one<br />
appropriate <strong>for</strong> the initiation of terminal descent via parachute or other means. A particle<br />
swarm optimizer varies entry flight path angle and ten bank profile points to find<br />
maximum-final-altitude trajectories. A baseline set of optimizations is per<strong>for</strong>med, as are fulllift-up<br />
and relaxed-deceleration-constraint sets <strong>for</strong> comparison. In total, an estimated 9<br />
million trajectories are analyzed to yield 1800 optimal trajectories. Parametric plots of<br />
maximum achievable altitude are shown, as are examples of optimized trajectories.<br />
Characteristic vehicle contours are overlaid on the parametric plots, and conclusions are<br />
drawn on the feasibility of vehicles in the L/D vs. β design space. It is shown that entry bank<br />
angle control is highly deserving of consideration early in design, particularly <strong>for</strong> vehicles<br />
with mid- or high-L/D values, high entry velocities, and deceleration-limited trajectories.<br />
Key conclusions are also drawn regarding trends in optimal bank profiles and in the<br />
constraints which impose particularly severe limits on the design of these trajectories.<br />
Nomenclature<br />
a = vehicle acceleration L/D = vehicle hypersonic lift-to-drag ratio<br />
C D = vehicle drag coefficient m = vehicle mass<br />
C L = vehicle lift coefficient MOLA = <strong>Mars</strong> Orbiter Laser Altimeter<br />
D = drag <strong>for</strong>ce on vehicle MSL = <strong>Mars</strong> Science Laboratory<br />
d = drag direction unit vector NASA = National Aeronautics and Space Administration<br />
DRM = <strong>Design</strong> Reference Mission q = dynamic pressure<br />
EDL = <strong>Entry</strong>, Descent, and Landing r = vector from planet center to vehicle mass center<br />
g = local gravitational acceleration S = vehicle reference area<br />
h = altitude above reference ellipsoid v rel = vehicle velocity relative to surface of planet<br />
L = lift <strong>for</strong>ce on vehicle β = vehicle ballistic coefficient<br />
l = lift direction unit vector ρ = local atmospheric density<br />
I. Introduction<br />
N January 2007, NASA assembled an agency-wide team of scientists and engineers to develop a current<br />
I assessment of objectives, system requirements, and prerequisites <strong>for</strong> human <strong>Mars</strong> exploration. As a collaborative<br />
ef<strong>for</strong>t among all four mission directorates, the objectives of the study were to (1) update NASA’s human <strong>Mars</strong><br />
mission reference architecture as DRM 5.0, (2) develop a plan of research and technology investments to reduce<br />
human <strong>Mars</strong> mission cost and risk, and (3) assess strategic linkages between human lunar and <strong>Mars</strong> exploration.<br />
One key challenge under examination as part of DRM 5.0 was that of conducting entry, descent, and landing <strong>for</strong><br />
human-class payloads. Coupling these massive payloads with launch-vehicle-limited aeroshell diameters typically<br />
* Graduate Co-op Student, Flight Mechanics and Trajectory <strong>Design</strong> Branch/EG5, Student Member AIAA.<br />
† Branch Chief, Flight Mechanics and Trajectory <strong>Design</strong> Branch/EG5, Member AIAA.<br />
1<br />
American Institute of Aeronautics and Astronautics<br />
This material is declared a work of the U.S. Government and is not subject to copyright protection in the United <strong>State</strong>s.
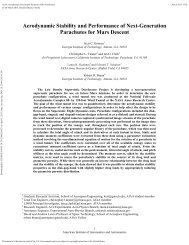
esults in very high vehicle ballistic coefficients and low L/D which, <strong>for</strong> <strong>Mars</strong>, results in very supersonic terminal<br />
velocities. It is generally impossible to decelerate these vehicles to velocities much lower than Mach 1.5 or Mach 2<br />
without the assistance of supersonic propulsion, large supersonic parachutes, or other large inflatable aerodynamic<br />
decelerators, none of which are yet proven <strong>for</strong> the Martian environment.<br />
To define best-case entry scenarios <strong>for</strong> the evaluation of potential descent and landing system designs, this paper<br />
focuses on the optimization of the entry-to-terminal-state phase <strong>for</strong> a variety of entry velocities, vehicle ballistic<br />
coefficients, and lift-to-drag ratios by selecting appropriate entry flight path angles and bank angle profiles. The<br />
terminal state is envisioned as one appropriate <strong>for</strong> initiation of a terminal descent system, such as a parachute. As is<br />
shown at the conclusion of this paper, this study permits identification of optimal regions of the ballistic-coefficientversus-L/D<br />
design space <strong>for</strong> any given entry vehicle capability envelope, which is important <strong>for</strong> minimizing the<br />
per<strong>for</strong>mance demands (and, in turn, technology demands) on terminal descent systems. From the perspective of the<br />
aerodynamic decelerator, parachute, or propulsion designer, this study effectively black-boxes the entry phase of<br />
flight <strong>for</strong> a best-case entry <strong>for</strong> a variety of vehicle configurations and entry conditions. As will soon be discussed,<br />
the metric chosen to represent these “best” cases is the maximum achievable altitude at a given Mach number.<br />
A. Previous Work on <strong>Entry</strong> <strong>Bank</strong> <strong>Profile</strong> <strong>Design</strong><br />
<strong>Design</strong> of bank angle modulation profiles to control<br />
flight in the hypersonic regime of atmospheric entry is<br />
well-established. <strong>Bank</strong>ing during atmospheric entry allows<br />
<strong>for</strong> the rotation of a vehicle’s lift vector (see Fig. 1) and<br />
thus allows a degree of control <strong>for</strong> achieving target landing<br />
sites or other trajectory objectives. A variety of guidance<br />
algorithms have been developed to effect these bank angle<br />
modulations, and entry guidance has been employed in<br />
Earth entry <strong>for</strong> manned vehicles since the Gemini program.<br />
However, only recently has guidance been developed <strong>for</strong><br />
precision landing on <strong>Mars</strong>.<br />
One of the most noteworthy applications of bank angle<br />
control <strong>for</strong> <strong>Mars</strong> is in the <strong>Mars</strong> Science Laboratory (MSL)<br />
mission slated to fly in 2009. MSL uses a modified Apollo<br />
guidance algorithm requiring the definition of a reference<br />
bank profile. Unlike the manned Apollo missions, which<br />
used a constant-bank reference profile, MSL utilizes a Figure 1. <strong>Bank</strong> angle (φ) definition.<br />
variable-bank profile which is divided into three segments<br />
in the relative velocity domain. The use of this variable-bank profile is necessitated by the inability of a constantbank<br />
profile to meet parachute deployment constraints (e.g. altitude and dynamic pressure). 1 Extensive work has<br />
been per<strong>for</strong>med to design this three-segment reference bank profile <strong>for</strong> the approximately 140 kg/m² ballistic<br />
coefficient, 0.24 lift-to-drag-ratio vehicle.<br />
However, to date, no study known to the authors has considered the systematic optimization of high-ballisticcoefficient<br />
<strong>Mars</strong> entry trajectories through control of bank angle profile. Some past studies have made broad<br />
parametric sweeps, as this study does, but have assumed a full-lift-up profile throughout the trajectory. 2,3 While<br />
intuition may suggest that a full-lift-up trajectory is most advantageous in terms of final altitude, often a lift-down<br />
bank angle early during entry allows a vehicle to dive and spend more time in high-drag (and high-lift) regions<br />
lower in the atmosphere. Other studies, such as <strong>for</strong> MSL, consider bank angle optimization but only <strong>for</strong> specific<br />
cases with relatively low ballistic coefficients. 4 Substantial gains are possible through control of the lift vector, and<br />
it is prudent to consider the per<strong>for</strong>mance effects of banking in any parametric assessment of <strong>Mars</strong> vehicle designs.<br />
This is especially true <strong>for</strong> the high-ballistic-coefficient, and likely high-lift-to-drag ratio, human-class vehicles<br />
toward which this study is directed.<br />
B. Challenges in the Physics of <strong>Mars</strong> <strong>Entry</strong><br />
<strong>Entry</strong>, descent, and landing on <strong>Mars</strong> is particularly challenging because of the physical characteristics of <strong>Mars</strong><br />
itself. Unlike Earth, which has a relatively thick atmosphere and high gravity, and the Moon, which has no<br />
atmosphere but low gravity, <strong>Mars</strong> has essentially the worst of both worlds: a thin atmosphere and relatively high<br />
gravity. As an illustration of <strong>Mars</strong>’ aerodynamic “unfriendliness”, a previous study 5 has shown that heavier-than-air<br />
flight on <strong>Mars</strong> requires 2.1 times as much power as on Earth and 17.5 times as much power as on Titan due to the<br />
high value of g 1.5 /ρ 0.5 on <strong>Mars</strong>.<br />
2<br />
American Institute of Aeronautics and Astronautics
Another illustration of <strong>Mars</strong>’ aerodynamic unfriendliness is shown in Fig. 2, which plots terminal velocity on<br />
<strong>Mars</strong> as a function of altitude above the MOLA reference ellipsoid (h) and vehicle ballistic coefficient (β). As<br />
shown in Eq. (1), terminal velocity is a function only of ballistic coefficient, local gravitational acceleration, and<br />
local atmospheric density (the latter two of which are functions of altitude). The definition of ballistic coefficient is<br />
shown in Eq. (2) (note that m is object mass, C D is object drag coefficient, and S is object reference area).<br />
Note from Fig. 2 that terminal Mach number on <strong>Mars</strong> is generally about a factor of ten higher on <strong>Mars</strong> than <strong>for</strong><br />
the same ballistic coefficient and altitude on Earth. This highlights the extreme challenge that <strong>Mars</strong> poses in terms<br />
of entry, descent, and landing: Any vehicle with a ballistic coefficient greater than 85 kg/m² would naturally impact<br />
the Martian surface supersonically. This is in stark contrast to Earth, where an 85 kg/m² vehicle would impact the<br />
ground at about Mach 0.10. As a further illustration, based on data available from Ref. 6, it can be estimated that a<br />
skydiver on <strong>Mars</strong> would have a terminal velocity somewhere in the range of Mach 1.0 to 1.5 (assuming a ballistic<br />
coefficient of between 90 and 180 kg/m², depending on the degree of the transonic drag rise).<br />
A final note to make on Fig. 2 is that later in this paper, it will be seen that many optimal trajectories are able to<br />
reach some altitudes at velocities lower than the terminal velocity at that altitude. For example, one optimal<br />
trajectory yields a vehicle which reaches Mach 2 at 6.8 km <strong>for</strong> a 600 kg/m² vehicle even though terminal velocity at<br />
6.8 km <strong>for</strong> a 600 kg/m² ballistic coefficient is Mach 3.6. The reason this sub-terminal velocity is possible is because<br />
of the presence of lift, which provides the vehicle with some authority to loft and thereby trade kinetic energy (i.e.<br />
velocity) <strong>for</strong> potential energy (i.e. altitude).<br />
V term<br />
= 2β g<br />
(1)<br />
ρ<br />
m<br />
=<br />
C S<br />
β (2)<br />
D<br />
Figure 2. <strong>Terminal</strong> velocities (in m/s) and Mach numbers on <strong>Mars</strong> (left) and Earth (right) as a function of<br />
altitude and ballistic coefficient.<br />
C. Vehicle Parameterization<br />
One principle on which this study relies is that a given entry vehicle can, from a trajectory perspective, be<br />
completely described by ballistic coefficient (β) and lift-to-drag ratio (L/D). This principle hinges on the assumption<br />
of a constant trim drag coefficient (C D ) and L/D, which is approximately true <strong>for</strong> hypersonic flight. A proof of the<br />
validity of this parameterization is shown below:<br />
Beginning with the definition of ballistic coefficient given in Equation 2, the definition of L/D = C L /C D , and<br />
Newton’s second law <strong>for</strong> a constant-mass object, a vector equation of motion may be derived. For entry,<br />
the only <strong>for</strong>ces acting on a vehicle are lift (L), drag (D), and gravity (mg), allowing the <strong>for</strong>ce term to be<br />
3<br />
American Institute of Aeronautics and Astronautics
written as in Eq. (3) below, where hat (^) terms indicate unit vectors in the respective directions of lift and<br />
drag. Equation (4) is equivalent to Eq. (3) except with all terms normalized by m. Note that q is dynamic<br />
pressure.<br />
r r r r<br />
r<br />
F= L+<br />
D+<br />
mg=<br />
qSC<br />
Ll<br />
ˆ+<br />
qSC<br />
Dd<br />
ˆ+<br />
mg<br />
(3)<br />
r<br />
F qS r qSC<br />
D<br />
⎛ C<br />
L<br />
⎞ r<br />
= ( C lˆ<br />
L<br />
+ C dˆ<br />
D<br />
) + g = l d + g<br />
m m<br />
m<br />
⎜ ˆ + ˆ<br />
C<br />
⎟<br />
⎝ D ⎠<br />
(4)<br />
Recognizing that SC D /m = 1/β and that C L /C D = L/D, Eq. (4) can be written as:<br />
r<br />
F q ⎛ L ⎞ r<br />
= ⎜ lˆ<br />
+ dˆ<br />
⎟ + g<br />
m β ⎝ D ⎠<br />
Expressing the l and d unit vectors in physical terms and recognizing that the left hand side is actually the<br />
vehicle’s acceleration allows Eq. (5) to be written in its final <strong>for</strong>m as:<br />
r q ⎛ L<br />
a = ⎜ ⋅<br />
ˆ<br />
rel<br />
rel<br />
β ⎝ D<br />
( vˆ<br />
× ( rˆ<br />
× vˆ<br />
)) − v g<br />
Note that in Eq. (6), the vehicle’s acceleration (the highest-order state derivative) is a function only of the<br />
vehicle’s current state (q is a function only of velocity and density, which is a function of altitude, and g is<br />
a function only of altitude) and the parameters β and L/D. As long as β and L/D are assumed constants (as<br />
is approximately true <strong>for</strong> trimmed hypersonic conditions), then this equation shows that the entry dynamics<br />
of a vehicle on a given planet can be completely described by β and L/D.<br />
Ballistic coefficients and L/D values <strong>for</strong> several historical and future entry vehicles are shown in Table 1 and<br />
Table 2. Note that all robotic <strong>Mars</strong> entries flown to date have utilized either zero-lift ballistic trajectories or full-liftup<br />
profiles, which has primarily been acceptable to the terminal descent system design because of their low ballistic<br />
coefficients. The <strong>Mars</strong> Science Laboratory mission, however, utilizes banking, and all U.S. manned vehicles since<br />
Gemini have also utilized banking. The manned vehicles are particularly relevant to the context of this study<br />
because they illustrate the high ballistic coefficients typically associated with manned flight.<br />
rel<br />
⎞<br />
⎟ +<br />
⎠<br />
r<br />
(5)<br />
(6)<br />
Table 1. <strong>Entry</strong> Characteristics of Selected <strong>Mars</strong> Landers. 7-11<br />
Vehicle Viking 1 Pathfinder <strong>Mars</strong> Microprobes Beagle 2 MER-A Phoenix MSL<br />
Last <strong>Entry</strong> Date 1976 1997 1999 2003 2004 2008 2010*<br />
<strong>Entry</strong> β (kg/m²) 64 63 36 73 94 65 140<br />
Hypersonic L/D 0.18 0 0 0 0 0 0.24<br />
<strong>Bank</strong> Scheme Full Lift-Up N/A N/A N/A N/A N/A Guided<br />
*Expected<br />
Table 2. <strong>Entry</strong> Characteristics of Selected Manned Vehicles. 12-18<br />
Vehicle Mercury Vostok Gemini Apollo X-38 Soyuz Space Shuttle<br />
Last <strong>Entry</strong> Date 1963 1963 1966 1975 N/A 2008** 2008**<br />
<strong>Entry</strong> β (kg/m²) 260 580 330 380 920 590 530<br />
Hypersonic L/D 0 0 0.17 0.32 0.92 0.28 1.4<br />
<strong>Bank</strong> Scheme N/A N/A Guided Guided Guided Guided Guided<br />
**As of writing of this paper; flights are ongoing.<br />
4<br />
American Institute of Aeronautics and Astronautics
II.<br />
Assumptions and Objective Function Selection<br />
A. Objective Function<br />
One of the first steps in this study is the definition of an objective function by which to define an “optimal”<br />
trajectory. If a vehicle is defined and sizing models are available, the most obvious choice is the maximization of<br />
landed payload mass <strong>for</strong> a given entry mass or, equivalently, the minimization of entry mass <strong>for</strong> a given landed<br />
payload mass. However, in this study, an entry vehicle is not defined beyond L/D and ballistic coefficient.<br />
Instead of vehicle mass minimization, this study seeks altitude maximization <strong>for</strong> a given trajectory termination<br />
Mach number. The inherent assumption behind this objective is that it is desirable <strong>for</strong> an entry vehicle to be<br />
traveling as slow and as high as possible when terminal descent is initiated (via parachutes, inflatable aerodynamic<br />
decelerators, or propulsion). The reason <strong>for</strong> this is rooted in altitude being a proxy <strong>for</strong> time-to-ground. To help<br />
explain this, Fig. 3 shows the variation of potential and kinetic energy with time <strong>for</strong> a vehicle entering at 4.7 km/s<br />
with β = 200 kg/m² and L/D = 0.5 on a maximum-altitude trajectory terminating at Mach 2. Note that the potential<br />
energy associated with altitude is a small fraction of the total energy, even at the end of the trajectory. Furthermore,<br />
potential energy changes relatively little even with large changes in altitude. Thus, while entry may be considered a<br />
total energy minimization problem (on the trajectory below, 98.3% of vehicle total energy is removed by Mach 2),<br />
kinetic energy changes are of principal importance. High altitude is known to be an important indicator of time<br />
available during parachute or inflatable device phases, and it also indicates the ease with which low-altitude terminal<br />
states may be achieved. Thus, since high altitude is also not a significant player in terms of energy, it is used as a<br />
defining characteristic of optimum trajectories.<br />
Figure 3. Specific energy <strong>for</strong> a β = 200 kg/m², L/D = 0.5 vehicle entering at 4.7 km/s on a maximum-altitude<br />
trajectory terminating at Mach 2. The right graph magnifies the final 2 minutes of flight.<br />
B. Assumptions<br />
In the completion of this study, several assumptions are made. The most significant is the assumption of an<br />
atmosphere. For consistency purposes with corresponding human <strong>Mars</strong> entry simulation ef<strong>for</strong>ts at other NASA<br />
centers, an equatorial landing site is assumed <strong>for</strong> entry on November 3, 2010 (Julian date 2455503.5). The<br />
corresponding atmospheric density and temperature profiles from the widely-used <strong>Mars</strong>-GRAM engineering-level<br />
atmospheric model 19 are shown in Fig. 4. Altitudes reported are above the MOLA reference ellipsoid.<br />
Figure 4. Density and Temperature profiles <strong>for</strong> the atmosphere assumed <strong>for</strong> this study.<br />
5<br />
American Institute of Aeronautics and Astronautics
As described earlier, a constant-trim condition is assumed <strong>for</strong> hypersonic flight, and as a result, a vehicle can be<br />
completely defined by a ballistic coefficient and lift-to-drag ratio. Additionally, this study assumes a 10-point bank<br />
profile defined in terms of points evenly spaced in the relative velocity domain. <strong>Bank</strong> angle is linearly interpolated<br />
between each of these points, much as was done by Ref. 4.<br />
Constraints include a 4.5 Earth-G acceleration limit to reflect acceptable deceleration <strong>for</strong> a deconditioned human<br />
crew while also allowing a 0.5 G margin <strong>for</strong> dispersion per<strong>for</strong>mance. Heat rate is constrained to 1000 W/cm² (half<br />
the limit published by Ref. 20) over an assumed one-meter-radius sphere, although in the study results, no<br />
trajectories were limited by this constraint. Some series of runs are noted as implementing a 10 km “dip constraint”,<br />
which constrain those trajectories to minimum altitudes no less than 10 km, reflecting the desire to limit the extent to<br />
which a vehicle is allowed to skim close to the ground prior to a loft to a higher altitude. Additionally, trajectories<br />
are automatically terminated if they fall below -5 km in altitude.<br />
As summarized in Table 3, the effective matrix of runs <strong>for</strong> this study consists of inertial entry velocities of 3.3<br />
km/s (representative of entry from a 500 km circular orbit), 4.7 km/s (representative of entry from a 1-sol elliptical<br />
orbit), and 5.5 km/s (representative of a direct entry). Note that, while entry velocities reported are inertial, they are<br />
approximately equal to the relative entry velocity since the assumed entry azimuth is 0° (north).<br />
coefficients range from 200 to 1000 kg/m² in<br />
increments of 200 kg/m², and lift-to-drag<br />
Table 3. Parameterization of Vehicle<br />
ratio ranges from 0.2 to 0.9 in increments of<br />
and Boundary Condition Variables.<br />
0.1. Altitude is maximized at four distinct Parameter<br />
Values Assessed<br />
termination Mach numbers meant to<br />
represent potential parachute, inflatable, or<br />
propulsion deployment points: Mach 0.8,<br />
2.0, 3.5, and 5.0.<br />
Ballistic<br />
Inertial <strong>Entry</strong> Velocity (km/s) 3.3, 4.7, 5.5<br />
Termination Mach Number 0.8, 2.0, 3.5, 5.0<br />
Vehicle Ballistic Coefficient (kg/m²) 200, 400, 600, 800, 1000<br />
Vehicle L/D 0.2, 0.3, 0.4, 0.5, 0.6, 0.7, 0.8, 0.9<br />
III.<br />
Simulation and <strong>Optimization</strong> Method<br />
A. <strong>Entry</strong> Simulation<br />
The entry simulator used in this study is selected to allow quick, accurate trajectory simulation. A custom<br />
MATLAB simulation models vehicle motion about an assumed spherical, rotating planet in a planet-centered inertial<br />
frame. Only three <strong>for</strong>ces act on the vehicle: lift, drag, and gravity. These vector <strong>for</strong>ces are translated into<br />
accelerations <strong>for</strong> the assumed constant-mass vehicle and integrated over time using MATLAB’s ode45 function. No<br />
bank rate or bank acceleration limitations are modeled. Note also that, as is applicable <strong>for</strong> skip-entry cases,<br />
atmospheric density is assumed to be zero above 125 km in altitude. Planet-specific simulation constants are shown<br />
in Table 4. Sample trajectory results from the MATLAB simulation were validated against trajectories generated<br />
via the Simulation and <strong>Optimization</strong> of Rocket Trajectories (SORT) tool used extensively at NASA JSC.<br />
Table 4. <strong>Mars</strong> <strong>Entry</strong> Simulation Constants.<br />
<strong>Mars</strong> Atmospheric Constants<br />
<strong>Mars</strong> Physical Constants<br />
Ratio of Specific Heats 1.289 Gravitational Parameter 42828 km³/s²<br />
Molecular Weight 43.34 g/mol Planetary Radius 3396 km<br />
Specific Gas Constant 191.8 J/kg/K Rotational Period 24.62 hours<br />
Maximum Altitude of Atmosphere 125 km Sphere of Influence Altitude 571140 km<br />
B. Optimizer<br />
To allow a thorough global search through the bank-angle and entry-flight-path-angle space, the optimizer<br />
selected is a particle swarm optimizer written originally <strong>for</strong> use on <strong>Mars</strong> Science Laboratory entry optimization. 21<br />
MATLAB’s fmincon gradient optimizer was also considered but yielded suboptimal results <strong>for</strong> early test cases.<br />
<strong>Optimization</strong>s involve 50 particles limited to 100 iterations ‡ to determine the maximum altitude attainable by<br />
varying the inertial entry flight path angle and 10 bank angles evenly spaced along the expected relative velocity<br />
range. <strong>Bank</strong> angles are limited to a range of 0° to 180°, and entry flight path angle is limited to skip-out and g-<br />
limited ranges computed prior to the optimization process. The entry flight path angle g-limit is defined by the<br />
‡ In some highly constrained problems in which a 10 km dip constraint is imposed, 10 particles are limited to 500<br />
iterations in order to speed the particle swarm initialization process, which would otherwise take over a week of<br />
computer run time.<br />
6<br />
American Institute of Aeronautics and Astronautics
steepest entry flight path angle <strong>for</strong> which a full-lift-up bank profile does not exceed the specified deceleration limit.<br />
The skip-out limit is defined by the shallowest entry flight path angle <strong>for</strong> which a full-lift-down bank profile causes<br />
the simulation to terminate at its 7-day time limit (allowing the optimizer to consider skip-entry trajectories).<br />
Otherwise, simulations would terminate based on Mach number (0.8, 2.0, 3.5, or 5.0) or at a -5 km altitude.<br />
IV. Results and Discussion<br />
The data from this study yields a wealth of in<strong>for</strong>mation on characteristics of <strong>Mars</strong> entry physics and implications<br />
<strong>for</strong> the design of future <strong>Mars</strong> entry vehicles (crewed or otherwise). By no means is this section comprehensive in<br />
covering the implications of all this data; however, the most important trends and implications are illustrated.<br />
Three distinct sub-studies were implemented – a baseline sub-study defined by the assumptions and constraints<br />
listed earlier in this paper and two additional sub-studies which utilized changes to those assumptions or constraints.<br />
A full-lift-up sub-study is implemented identically to the baseline except that bank angle is constrained to be 0° (i.e.<br />
full-lift-up) and the only free variable is entry flight path angle. The full-lift-up study demonstrates how often a fulllift-up<br />
profile can approximate an optimal bank profile. A 30-G-constrained sub-study is implemented identically to<br />
the baseline except that the 4.5-G deceleration constraint is replaced by a 30-G constraint. This deceleration<br />
constraint change is meant to provide insight into the optimal nearly-unconstrained bank angle profile and could also<br />
be applicable to unmanned vehicles which are restricted in their deceleration only by structural limitations.<br />
A. Baseline Sub-Study Results<br />
Shown in Fig. 5 is a plot of the baseline sub-study results, showing the maximum attainable final altitude (the<br />
objective function of the optimization) as a function of ballistic coefficient, lift-to-drag ratio, termination Mach<br />
number, and whether the 10 km dip constraint is imposed. This figure corresponds to an entry velocity of 4.7 km/s,<br />
but it is also representative of the 3.3 km/s and 5.5 km/s plots since it is found that, if bank control is permitted,<br />
maximum altitude per<strong>for</strong>mance is almost independent of entry velocity. It should also be noted that, while Mach 0.8<br />
termination cases were run, none returned any viable trajectories (i.e. trajectories which did not hit -5 km altitude<br />
prior to reaching Mach 0.8).<br />
The first note to make about this figure is that, as would be expected, <strong>for</strong> a given termination Mach number and<br />
dip constraint, maximum attainable altitude increases with increasing lift-to-drag ratio and decreasing ballistic<br />
coefficient. There are no local extrema, meaning that from a per<strong>for</strong>mance perspective, high lift-to-drag ratio and<br />
low ballistic coefficient are always desirable.<br />
Besides yielding numbers <strong>for</strong> the maximum attainable altitude, Fig. 5 can also be interpreted as showing “isoaltitude-per<strong>for</strong>mance”<br />
contours. For example, <strong>for</strong> Mach 5 altitude per<strong>for</strong>mance with no dip constraint imposed, a<br />
200 kg/m² vehicle with L/D = 0.6 is equivalent to a 600 kg/m² vehicle with L/D = 0.9. In this way, it can be seen<br />
that a ballistic coefficient decrease can be traded against a lift-to-drag ratio increase and vice-versa. This is<br />
important to note because, typically, as an entry vehicle shape is altered to improve L/D, its ballistic coefficient<br />
increases. Again, as discussed earlier, under the assumption of trimmed hypersonic flight, from the atmospheric<br />
perspective a vehicle may be completely defined by its ballistic coefficient and lift-to-drag ratio.<br />
Another observation which can be made from Fig. 5 is that imposition of the 10 km dip constraint (shown in the<br />
plots on the right) effectively changes the concavity of the altitude contours. Vehicles of low ballistic coefficients<br />
and high lift-to-drag ratios are unaffected by the constraint (these trajectories meet the constraint even when it is not<br />
imposed on the optimization), but vehicles at high ballistic coefficients and low lift-to-drag ratios are entirely<br />
eliminated from the data set (these trajectories cannot attain final altitudes greater than 10 km even without the<br />
constraint). Vehicles between these extremes show reduced altitudes compared to those attainable without the<br />
constraint.<br />
Finally, and perhaps most importantly, examination of the trajectories associated with each data point in Fig. 5<br />
yields some insight into the physics of the optimal trajectories which are converged upon. Eight specific trajectories<br />
are detailed below to illustrate trends observed from the wealth of data generated from this study.<br />
1. Apollo-Class Vehicle Trajectories<br />
The following example trajectories approximate the per<strong>for</strong>mance of an Apollo-class vehicle as one with a<br />
ballistic coefficient of 400 kg/m² and lift-to-drag ratio of 0.3 (Table 2 shows the actual Apollo ballistic coefficient as<br />
380 kg/m² and lift-to-drag ratio as 0.32, although this did vary slightly from mission to mission). It can be shown<br />
that even with bank angle control, the Apollo command module would not be able to decelerate to a velocity slower<br />
than Mach 2.1 prior to reaching 0 km altitude on <strong>Mars</strong>. Examined here is the maximum altitude Apollo could reach<br />
at Mach 5 (e.g. if the vehicle were to have a supersonic decelerator to deploy at Mach 5).<br />
7<br />
American Institute of Aeronautics and Astronautics
Figure 5. Maximum attainable altitude (in km) <strong>for</strong> an entry velocity of 4.7 km/s.<br />
Gray regions indicate regions in which no solutions are found due to constraints. White regions with broken or<br />
absent contours indicate the boundary between the constrained and unconstrained regions.<br />
Apollo-Class <strong>Entry</strong> at 4.7 km/s<br />
Figure 6 shows the maximum-final-altitude trajectory <strong>for</strong> an Apollo-class vehicle entering <strong>Mars</strong>’ atmosphere at<br />
4.7 km/s (e.g., entry from a 1-sol orbit). The maximum attainable altitude at Mach 5 is 18.3 km, lofted from a<br />
minimum altitude of 12.7 km (thus, this trajectory meets the 10 km dip constraint). Note that the deceleration<br />
constraint of 4.5 G’s is reached and limits per<strong>for</strong>mance. Of particular interest is the zig-zag bank profile as the<br />
maximum deceleration point is approached, which serves to limit this maximum deceleration while still maximizing<br />
final altitude. Also note that the optimum bank profile is full-lift-up starting at approximately 3000 m/s (somewhat<br />
under Mach 15). §<br />
§ One interesting feature in virtually all of these trajectories is a peak altitude which occurs prior to the end of the<br />
trajectory (one would intuitively expect the maximum altitude <strong>for</strong> a given Mach number to occur at the top of a loft).<br />
While this feature is difficult to physically explain, it is so consistent within this study that it is believed to be a real<br />
characteristic. Independent optimization routines using the POST simulation at NASA Langley Research Center<br />
have yielded solutions with equally consistent early peaks.<br />
8<br />
American Institute of Aeronautics and Astronautics
Figure 6. Optimal trajectory data <strong>for</strong> an Apollo-class vehicle entering at 4.7 km/s.<br />
Apollo-Class <strong>Entry</strong> at 3.3 km/s<br />
Figure 7 shows maximum-final-altitude trajectory data <strong>for</strong> the same vehicle entering at 3.3 km/s (e.g., entry from<br />
a low <strong>Mars</strong> orbit). The maximum attainable altitude at Mach 5 is 14.1 km, which is achieved without lofting. Note<br />
that the deceleration constraint is not approached (maximum deceleration is 1.7 G’s), which is typical of low-L/D,<br />
low-entry-velocity cases in this study. <strong>Entry</strong> flight path angle is quite shallow, and the trajectory is effectively fulllift-up.<br />
Note also that the duration of the flight is about 1.5 minutes longer than the 4.7 km/s entry case.<br />
Figure 7. Optimal trajectory data <strong>for</strong> an Apollo-class vehicle entering at 3.3 km/s.<br />
9<br />
American Institute of Aeronautics and Astronautics
Apollo-Class <strong>Entry</strong> at 5.5 km/s<br />
Figure 8 below shows maximum-final-altitude trajectory data <strong>for</strong> the same Apollo-class vehicle entering at 5.5<br />
km/s (e.g., direct entry). Similarities to the 4.7 km/s case abound. Note the similarity in maximum and minimum<br />
altitude to the 4.7 km/s case (both have a final maximum altitude of 18.3 km, and the minimum altitudes differ by<br />
only 98 m). Note also the double acceleration peak, indicating not only that the maximum allowable acceleration is<br />
a significant constraint, but also that it is a dynamic that the optimizer is attempting to follow in order to maximize<br />
altitude. The optimum entry flight path angle is within 0.3° of the 4.7 km/s case, and bank angle is once again 0° <strong>for</strong><br />
the final 3000 m/s of the trajectory. One additional note to highlight, however, is the fact that no bank rate or<br />
acceleration limitations are assumed in these studies, and this trajectory allows bank angle to change quite rapidly<br />
from 0° to 180° in approximately 12 seconds.<br />
Figure 8. Optimal trajectory data <strong>for</strong> an Apollo-class vehicle entering at 5.5 km/s.<br />
2. Deceleration-Limited Trajectory Illustration<br />
The trajectory shown in Fig. 9 below illustrates the significance that the 4.5 G constraint has on limiting some of<br />
the trajectories in this study. For this high-L/D (L/D = 0.6), low-ballistic-coefficient (β = 200 kg/m²) vehicle, three<br />
distinct deceleration peaks of nearly equal magnitude are seen in close proximity to each other, corresponding<br />
directly to the oscillation of the bank angle. This effective constant-deceleration region occurs over almost 2000 m/s<br />
of the trajectory (from approximately Mach 20 until Mach 10).<br />
In contrast, when the 4.5-G constraint is replaced with a 30-G constraint, the optimal trajectory shown in Fig. 10<br />
results. The differences are very pronounced. When unconstrained by deceleration limits, the deceleration load<br />
peaks at 16.2 G’s. Minimum altitude drops to 5.5 km (as opposed to 12.9 km), and maximum achievable final<br />
altitude rises by 8.2 km to 34.4 km. To achieve this, entry flight path angle is steepened by 13.5°, giving a very<br />
steep -25.2°. The trajectory is full-lift-up very early during entry, starting at approximately Mach 18. This steepflight-path-angle,<br />
full-lift-up behavior appears to be quite typical of optimal trajectories when acceleration<br />
constraints are released.<br />
10<br />
American Institute of Aeronautics and Astronautics
Figure 9. Optimal trajectory data <strong>for</strong> a 4.5-G constrained case.<br />
Figure 10.<br />
Optimal trajectory data <strong>for</strong> the same case as in Fig. 9 with no effective deceleration constraint.<br />
11<br />
American Institute of Aeronautics and Astronautics
3. Dip Constraint Illustration<br />
The trajectory shown in Fig. 12 is <strong>for</strong> an identical case as the trajectory in Fig. 11 except with an added 10 km dip<br />
constraint. For this high-L/D (L/D = 0.6), moderate-ballistic-coefficient (β = 600 kg/m²) vehicle, note that, while the<br />
nominal case dips to 4.6 km in order to reach a final altitude of 25.6 km, the case with the dip constraint dips only to<br />
10.1 km and lofts only to 20.5 km. The dip-constrained case is also clearly not limited by acceleration (unlike the<br />
nominal case), as it only hits the 4.0-G mark. Note also the fluctuation in the dip-constrained bank profile, as<br />
opposed to the smoothness of the nominal profile.<br />
Figure 11.<br />
Optimal trajectory data <strong>for</strong> a 600 kg/m², L/D = 0.6 vehicle.<br />
Figure 12.<br />
Optimal trajectory data <strong>for</strong> the same case as in Figure 11 but with a 10 km dip constraint.<br />
12<br />
American Institute of Aeronautics and Astronautics
4. Skip-<strong>Entry</strong> Illustration<br />
The trajectory shown in Fig. 13 is illustrative of the behavior of optimal trajectories <strong>for</strong> very-high-L/D cases<br />
(L/D = 0.8 or 0.9). The vast majority of these very-high-L/D cases exhibit skip-entry behavior <strong>for</strong> one or several<br />
skips over a period of hours. In the case in Fig. 13, an initial skip (during which the peak heat rate is experienced)<br />
removes about 900 m/s of velocity from the vehicle with a maximum acceleration of 1.8 G’s. A suborbital coast<br />
period occurs next, during which the vehicle reaches an apoapsis altitude of 1800 km (not shown) and re-enters the<br />
atmosphere at 3.8 km/s. The 4.5-G limit is hit on the second entry, and bank angle is 0° below about Mach 7.<br />
The reason <strong>for</strong> this skip behavior is not entirely clear, but its consistency <strong>for</strong> nearly all very-high-L/D cases<br />
makes it unlikely to be an anomaly. One reason <strong>for</strong> its optimality may be the fact that the skip(s) allow the vehicle<br />
to effectively re-enter the atmosphere at a lower velocity, which is known to reduce peak deceleration (as discussed<br />
earlier). This capability to artificially lower entry velocity through skipping may exist <strong>for</strong> lower L/D values but was<br />
not found to be optimal.<br />
Figure 13.<br />
Optimal trajectory data <strong>for</strong> a 400 kg/m², L/D = 0.9 vehicle.<br />
B. Full-Lift-Up Sub-Study Results<br />
In addition to the baseline study described <strong>for</strong> the bulk of this report, a full set of optimizations (minus the 10-km<br />
dip-constrained cases) was per<strong>for</strong>med <strong>for</strong> a full-lift-up profile. Thus, final altitude at all Mach numbers under<br />
consideration was maximized by varying entry flight path angle. The results of these optimizations <strong>for</strong> the 4.7 km/s<br />
entry velocity are shown in Fig. 14 in terms of maximum attainable altitude. Interestingly, zig-zag patterns exist in<br />
these contours which correlate with boundaries between skip trajectories. For example, <strong>for</strong> Mach 5 termination,<br />
optimal trajectories <strong>for</strong> vehicles with L/D values greater than about 0.3 involve a significant loft at high velocities (a<br />
“half-skip”). Then, above an L/D of about 0.7, optimal trajectories exhibit one full skip plus a significant loft (a<br />
“one-and-a-half skip”). At the L/D = 0.3 and 0.7 locations, trajectories are deceleration-limited but are not<br />
deceleration-limited in the surrounding L/D regions. This behavior is consistent but so far does not have a clear<br />
physical explanation; these optimum trajectories between the deceleration-limited regions are some of the few in this<br />
study which do not appear to be limited by any one constraint.<br />
Figure 15 shows the difference between these full-lift-up results and those of the baseline study. Note that at<br />
very low L/D values, altitudes are similar (i.e. the difference is near zero). However, as L/D increases, the benefit of<br />
bank angle control during entry becomes increasingly pronounced. Even <strong>for</strong> a low-L/D vehicle such as an Apollo<br />
capsule, using a banked (instead of full-lift-up) profile could result in 4 km final altitude gains at Mach 3.5 and 5 and<br />
a 1 km final altitude gain near Mach 2. This highlights the importance of considering bank angle control in<br />
preliminary entry trajectory design.<br />
13<br />
American Institute of Aeronautics and Astronautics
Figure 14. Maximum attainable altitude<br />
(in km) <strong>for</strong> an entry velocity of 4.7 km/s<br />
under a full-lift-up bank profile.<br />
Figure 15. Difference in maximum attainable<br />
altitude (in km) between the baseline and fulllift-up<br />
sub-studies <strong>for</strong> a 4.7 km/s entry velocity.<br />
Note that there is clearly a greater benefit to bank<br />
angle control as L/D increases.<br />
C. 30-G Constrained Sub-Study Results<br />
A third set of optimizations is per<strong>for</strong>med, again to complement the baseline sub-study described <strong>for</strong> the bulk of<br />
this paper. In this third set, the 4.5 G deceleration constraint is relaxed to 30 G’s, meant to effectively remove the<br />
deceleration constraint. This modification had the dual purposes of theoretically revealing “purer” optimum bank<br />
profiles which would be unconstrained by the strict 4.5-G deceleration limit and showing potential optimum<br />
trajectories <strong>for</strong> uncrewed (e.g. cargo or robotic) missions.<br />
The maximum final altitude results from this study are shown in Fig. 16 below. Note that the altitudes seen here<br />
are, depending on the specific case, up to 16 km higher than those seen in the baseline study. Also note the<br />
interesting change in contour concavity in the high-L/D, high-ballistic-coefficient region of the Mach 3.5 and Mach<br />
5 plots. Interestingly, analysis of the trajectories associated with this region indicates that these trajectories are<br />
actually constrained by the -5 km altitude limit within the entry simulation. Thus, this concavity change is<br />
analogous to the concavity difference between the baseline study’s nominal and 10-km dip-constrained cases.<br />
14<br />
American Institute of Aeronautics and Astronautics
Figure 16. Maximum attainable altitude <strong>for</strong> a<br />
4.7 km/s entry velocity under a 30-G constraint.<br />
Note that substantially higher altitudes are<br />
achievable compared to Fig. 5.<br />
15<br />
American Institute of Aeronautics and Astronautics
V. Conclusions and Implications<br />
This study has generated a wealth of data and insight into the characteristics of optimal trajectories <strong>for</strong> a wide<br />
range of combinations of ballistic coefficients, lift-to-drag ratios, entry velocities, termination Mach numbers, and<br />
dip constraints. In the completion of this study, more than 9 million trajectory runs were completed to optimize<br />
more than 1,800 data points. By choosing to analyze these scenarios in a vehicle-independent fashion (by assuming<br />
constant hypersonic aerodynamic coefficients), the vehicle analysis described next is made possible.<br />
A. Vehicle Implications<br />
The advantage to choosing a vehicle-independent analysis is that all per<strong>for</strong>mance data gathered in this study is<br />
valid <strong>for</strong> any vehicle (within the bounds of uncertainty due to the constant hypersonic aerodynamic coefficients<br />
assumption). Thus, if per<strong>for</strong>mance of a specific vehicle is desired, only its ballistic coefficient and lift-to-drag ratio<br />
are required and its optimal altitude per<strong>for</strong>mance is known. Specific vehicles are points in the ballistic-coefficient<br />
vs. lift-to-drag-ratio domain. Generic vehicle shapes may be represented as contours in this domain since center of<br />
mass location and vehicle mass may vary to change both ballistic coefficient and L/D.<br />
Figure 17 and Fig. 18 below show the Mach 3.5 and Mach 5 per<strong>for</strong>mance of entry vehicles entering at 4.7 km/s<br />
under a 10 km dip constraint. Overlaid on those altitude contours are iso-mass contours <strong>for</strong> three ellipsled designs<br />
plus a 12 m diameter capsule design. Additionally, Apollo and Soyuz designs are shown at their respective<br />
locations on the plots. Note that the 10 km dip constrained plot is shown because the 10 km limit is taken to<br />
represent a realistic margin above the ground to account <strong>for</strong> dispersions and safety considerations. Additionally, it<br />
should be noted that this 10 km constraint is relative to MOLA and not ground level (so the situation would be<br />
significantly more constrained if landing sites higher than 0 km MOLA are desired).<br />
These figures illustrate several very important points about requirements <strong>for</strong> high-ballistic-coefficient <strong>Mars</strong> entry<br />
vehicle designs. First, it is clear that, when restricted to diameters below 12 m, an Apollo-class vehicle design <strong>for</strong> a<br />
high-mass crewed <strong>Mars</strong> mission is on the fringes of what is acceptable if no supplementary deceleration is available<br />
prior to Mach 3.5 (it lies very close to the gray region in which it is impossible to meet the 10 km dip constraint).<br />
For a 12 m capsule above about 100 metric tons in entry mass, deployment or activation of some decelerator device<br />
is required by Mach 5 if a 10 km dip constraint is not to be breached. Similarly, <strong>for</strong> a 12 m capsule above about 60<br />
metric tons in entry mass, decelerator activation is required by Mach 3.5. These masses are fairly low considering<br />
the 40+ metric ton landed masses which are often desired <strong>for</strong> human <strong>Mars</strong> design reference missions.<br />
For a capsule, the only way to improve this mass<br />
per<strong>for</strong>mance is to increase capsule diameter ** , which<br />
would decrease ballistic coefficient and shift the capsule<br />
contours to the left in the figures below. A capsule<br />
diameter conversion chart is shown in Table 5. Each of<br />
the brown contours in Fig. 17 and Fig. 18, which are<br />
plotted <strong>for</strong> a 12 m capsule diameter, can be re-labeled<br />
with the masses shown in Table 5 if a different capsule<br />
Table 5. Equivalent-ballistic-coefficient capsule<br />
mass conversion chart.<br />
10-m Capsule<br />
Mass (t)<br />
12-m Capsule<br />
Mass (t)<br />
15-m Capsule<br />
Mass (t)<br />
27.8 40 62.5<br />
41.7 60 93.8<br />
55.6 80 125.0<br />
69.4 100 156.3<br />
diameter is assumed. For example, the per<strong>for</strong>mance<br />
curve <strong>for</strong> a 40 t (40 metric ton) 12-m capsule is the same<br />
as <strong>for</strong> a 62.5 t, 15-m capsule.<br />
Slender-body shapes such as ellipsleds can perhaps per<strong>for</strong>m better than capsules, but they are still significantly<br />
constrained to large vehicles with relatively small payload masses. Fig. 17 shows that a 12 × 35 m ellipsled allows<br />
an entry mass between 120 and 140 metric tons to reach Mach 3.5 without the assistance of a supplementary<br />
decelerator. An additional note of interest is that a given vehicle shape and mass does have its own maximum<br />
attainable altitude which can be visually found via the intersection of altitude and vehicle mass contours (<strong>for</strong><br />
example, the maximum altitude that the 120 metric ton ellipsled described above can reach at Mach 3.5 is about 15<br />
km, if subject to the 10 km dip constraint).<br />
** Unless in-space assembly is considered, a practical limit on vehicle diameter is launch vehicle fairing diameter.<br />
For example, the anticipated fairing diameter of the Ares V rocket is in the range of 8.4 m to 12 m. 22 In this respect,<br />
slender-body shapes such as ellipsleds offer advantages over capsules in that they can accommodate more volume<br />
(and potentially mass) <strong>for</strong> a given vehicle diameter.<br />
16<br />
American Institute of Aeronautics and Astronautics
Figure 17. Overlay of Mach 3.5 maximum attainable altitude contours (shown in gray) with ellipsled and<br />
12 m capsule vehicle characteristic contours. Note that the gray shaded region indicates the design space in<br />
which it is known that no solutions exist.<br />
Figure 18. Overlay of Mach 5 maximum attainable altitude contours (shown in gray) with ellipsled and 12<br />
m capsule vehicle characteristic contours. Note that the gray shaded region indicates the design space in<br />
which it is known that no solutions exist.<br />
17<br />
American Institute of Aeronautics and Astronautics
B. Key Conclusions<br />
Key conclusions from the data presented throughout this paper include:<br />
<br />
<br />
<br />
<br />
<br />
Unless vehicle L/D is low (about 0.2 or lower), entry velocity is low (under roughly 3.5-4.0 km/s), or<br />
deceleration constraints are absent or very high (in the 20’s of Earth G’s), optimal banking should be<br />
considered in the preliminary design of entry trajectories. This study found that, <strong>for</strong> entry velocities of<br />
4.7 km/s and 5.5 km/s, the optimal bank profiles <strong>for</strong> L/D = 0.2 vehicles were primarily lift-up. For the 3.3<br />
km/s entry velocity, optimal bank profiles <strong>for</strong> vehicles with L/D values less than 0.6 were also primarily<br />
lift-up. Additionally, <strong>for</strong> cases unconstrained by deceleration loads, the optimum-bank tendency was fulllift-up<br />
at a very steep entry flight path angle (unless altitude constraints interfered).<br />
Optimal final-altitude-maximizing bank profiles tend to be full-lift-up at the end of the trajectory, tend to<br />
have somewhat lift-down bank angles at the beginning of the trajectory, and, <strong>for</strong> higher entry velocities,<br />
almost always attempt to follow deceleration load constraints.<br />
Multiple bank profiles may be capable of reaching the same (or nearly the same) optimum altitude.<br />
Contours shown in final altitude plots in this study all appear smooth, which suggests quite strongly that the<br />
true optimum altitudes were nearly always found. However, the bank angle profiles which achieve<br />
neighboring optimum altitudes often show more irregular behavior. One credible explanation of this is that<br />
multiple bank angle combinations are commonly capable of achieving the same (or nearly the same) final<br />
altitude/velocity state.<br />
Minimum altitude constraints and deceleration load constraints are significant optimal trajectory<br />
drivers. As shown in this study, a 10 km dip constraint can severely limit the ballistic coefficient and liftto-drag<br />
combinations that are allowable. High-L/D, low-ballistic-coefficient vehicles do not violate the<br />
constraint, while low-L/D, high-ballistic-coefficient vehicles violate it simply because they cannot reach a<br />
final altitude above 10 km in the first place. Fringe cases see significant reductions when the dip constraint<br />
is imposed. Similarly, releasing a 4.5-G deceleration load constraint can result in altitude gains up to 16<br />
km <strong>for</strong> the cases considered in this study (or approximately 2 km <strong>for</strong> an Apollo-class vehicle).<br />
Low-L/D vehicle configurations (e.g. capsules and short ellipsleds) require very low ballistic coefficients<br />
to overcome their lift limitations. As detailed earlier, if no supplementary deceleration options (e.g.,<br />
parachutes, inflatable decelerators, propulsion) are available prior to Mach 5, a 12 m diameter capsule is<br />
limited to 100 metric tons. If no options are available prior to Mach 3.5, that mass is lowered to<br />
approximately 60 metric tons. A 12 × 35 m ellipsled can reach a mass of between 120 and 140 metric tons<br />
and still reach Mach 3.5 without the assistance of a supplementary decelerator. Without decelerator<br />
assistance, Mach 2 is unachievable <strong>for</strong> L/D values of 0.5 or less (unless ballistic coefficient is less than 200<br />
kg/m²), and Mach 0.8 cannot be achieved <strong>for</strong> any ballistic coefficient and L/D combination considered in<br />
this study.<br />
C. Study Limitations<br />
This study has attempted to be as broadly applicable within the limits of time and the scope of work <strong>for</strong> the<br />
NASA <strong>Mars</strong> DRM 5.0 ef<strong>for</strong>t. Two principal limitations are recognized, and avenues <strong>for</strong> future follow-on work are<br />
identified.<br />
First, this study has not considered environment and state knowledge dispersions which are crucial to any real,<br />
guided landing on <strong>Mars</strong>, especially human missions. This study has also not specified what type of guidance would<br />
be required to adequately fly the optimal trajectories which have been identified. It should be noted, however, that<br />
margin is included in these trajectories in the <strong>for</strong>m of a 10 km dip constraint and a 4.5-G (instead of 5-G)<br />
deceleration limit. This study was principally concerned with maximizing altitude and assumes that adequate<br />
margin was given at this stage of design. It is hoped that this work will continue in the future and include<br />
consideration of guidance per<strong>for</strong>mance. One such follow-on study is documented in Ref. 23.<br />
Second, some of the optimum low-L/D trajectories <strong>for</strong> the 3.3 km/s entry velocity converged to very shallow<br />
(sometimes 0°) entry flight path angles. The reason <strong>for</strong> this is that 3.3 km/s at a 0° flight path angle is below orbital<br />
velocity at the 125 km entry interface point (meaning that, while this is still a valid elliptical orbit, the periapsis of<br />
this orbit is within the atmosphere or planet). However, this limitation is difficult to remedy without assuming an<br />
initial orbit (which would disrupt the generality of this study). Be<strong>for</strong>e using any of the low-L/D results <strong>for</strong> the 3.3<br />
km/s entry velocity cases, the user should check the optimized entry flight path angle to be sure that entry state can<br />
be reached from the user’s initial orbit.<br />
18<br />
American Institute of Aeronautics and Astronautics
One concern which is acknowledged is the inherent limitation of the optimizer and bank profiles used. The<br />
smoothness of the objective function (final altitude) curves in all plots suggests that true optima were consistently<br />
found. However, the bank profile was inherently limited by the ten evenly-spaced points prescribed in the relative<br />
velocity domain. For example, it was often clear that the optimizer was attempting to follow a constant-deceleration<br />
profile, but the placement of the bank points did not allow a high degree of control over this. While the approach<br />
used in this study was suitable <strong>for</strong> the goal of a broad parametric sweep, higher-fidelity studies in the future should<br />
assess different methods of defining a bank profile which are more flexible and adaptable to recognized trends than<br />
the method used here.<br />
Finally, in the context of winged vehicles, this study is limited in the scope of L/D values considered. As noted<br />
in Table 2, the hypersonic L/D of the Space Shuttle is 1.4, which is well outside the L/D = 0.9 upper limit considered<br />
in this study’s parametric sweep. Since altitude per<strong>for</strong>mance increases with increasing L/D, it is recognized that<br />
with a high enough L/D, it may be possible to reach the elusive Mach 0.8 termination at a reasonable altitude and<br />
avoid many of the technology hurdles involved in designing large supersonic parachutes, supersonic propulsion, or<br />
inflatable aerodynamic decelerators. †† This study is unable to identify what L/D values are required to accomplish<br />
such low-Mach termination states, but this may be worthy of consideration in future studies.<br />
Overall, this study has accomplished its original goal of determining, to a reasonable certainty, optimal bank<br />
profiles <strong>for</strong> a wide range of human-class <strong>Mars</strong> entry scenarios. It has identified both the best-case altitudes and the<br />
bank profile characteristics which generally allow those altitudes to be achieved. It is hoped that this study’s result<br />
and methods will find broad use within the <strong>Mars</strong> entry community.<br />
Acknowledgments<br />
The authors would like to thank the <strong>Mars</strong> DRM 5.0 Aerocapture, <strong>Entry</strong>, Descent, and Landing team led by Walt<br />
Engelund and Rob Manning. Thanks are especially due to Carlos Westhelle, Lee Bryant, and Michael Grant at<br />
NASA JSC <strong>for</strong> their support throughout this study, and to Dr. Robert Braun at Georgia Tech <strong>for</strong> his inputs in the<br />
documentation phase of this project.<br />
References<br />
1 Mendeck, G.F. and Carman, G.L. “Guidance <strong>Design</strong> <strong>for</strong> <strong>Mars</strong> Smart Landers Using The <strong>Entry</strong> <strong>Terminal</strong> Point Controller.”<br />
AIAA 2002-4502. AIAA Atmospheric Flight Mechanics Conference and Exhibit, Monterey, 5-8 Aug. 2002.<br />
2 Christian, J., Wells, G., Lafleur, J., et. al. “Sizing of an <strong>Entry</strong>, Descent, and Landing System <strong>for</strong> Human <strong>Mars</strong> Exploration.”<br />
AIAA 2006-7427. Space 2006, San Jose, 19-21 Sept. 2006.<br />
3 Wells, G. and Braun, R. “An <strong>Entry</strong> Handbook <strong>for</strong> the Conceptual <strong>Design</strong> of <strong>Mars</strong> Missions.” AA2006-1-34. 1 st<br />
International ARA Days, Arcachon, 3-5 July 2006.<br />
4 Cruz, J.R., Cianciolo, A.D., Powell, R.W., et. al. “<strong>Entry</strong>, Descent, and Landing Technology Concept Trade Study <strong>for</strong><br />
Increasing Payload Mass to the Surface of <strong>Mars</strong>.” International Symposium on Atmospheric Reentry Vehicles and Systems<br />
Paper. Arcachon, 21-23 March 2005.<br />
5 Lafleur, J. “Derivation and Application of a Method <strong>for</strong> First-Order Estimation of Planetary Aerial Vehicle Power<br />
Requirements.” International Planetary Probe Workshop Paper. Pasadena, 27-30 June 2006.<br />
6 Palmer, M.J. “Af<strong>for</strong>dable Air – Vertical Wind Tunnel <strong>for</strong> Indoor Skydiving.” AIAA 2000-0289. Aerospace Sciences<br />
Meeting and Exhibit, Reno, 10-13 Jan. 2000.<br />
7 Braun, R.D. and Manning, R.M., “<strong>Mars</strong> Exploration <strong>Entry</strong>, Descent and Landing Challenges,” IEEEAC Paper #0076, Big<br />
Sky, 4-11 March 2006.<br />
8 Braun, R.D., Mitcheltree, R.A., and Cheatwood, F. M., “<strong>Mars</strong> Microprobe <strong>Entry</strong>-to-Impact Analysis.” Journal of Spacecraft<br />
and Rockets, Vol. 36, No. 3, May-June 1999, pp. 412-420.<br />
9 Stride, Scot. “<strong>Mars</strong> Microrover Telecom Closing Comments.” <strong>Mars</strong> Microrover Telecommunications [online]. 3 Oct. 1997.<br />
URL: http://mpfwww.jpl.nasa.gov/MPF/rovercom/closing.html [cited 22 July 2007].<br />
10 Liever, P.A., Habchi, S.D., Burnell, S.I., and Lingard, J.S. “Computational Fluid Dynamics Prediction of the Beagle 2<br />
Aerodynamic Database.” Journal of Spacecraft and Rockets, Vol. 40, No. 5, Sept.-Oct. 2003, pp. 632-638.<br />
11 Beagle 2 Team. “Beagle 2 System Overview.” Beagle 2 [online]. 26 Aug. 2004. URL:<br />
http://www.beagle2.com/technology/overview.htm [cited 22 July 2007].<br />
12 Erb, R.B. and Jacobs, S. “<strong>Entry</strong> Per<strong>for</strong>mance of the Mercury Spacecraft Heat Shield.” NASA-TM-X-57097. Hampton,<br />
12-14 Oct. 1964.<br />
13 Stewart, J.D. and Greenshields, D.H. “<strong>Entry</strong> Vehicles <strong>for</strong> Space Programs.” Journal of Spacecraft and Rockets, Vol. 6,<br />
No. 10, Oct. 1969, pp. 1089-1102.<br />
†† It deserves note that other hurdles may arise due to the poorer packaging efficiency and more demanding thermal<br />
protection requirements <strong>for</strong> winged vehicles, which is a trade that must be considered at the system level.<br />
19<br />
American Institute of Aeronautics and Astronautics
14 Johnson, N.L., Handbook of Soviet Manned Space Flight, AAS Science and Technology Series, Vol. 48, Univelt, San<br />
Diego, 1980.<br />
15 Whitnah, A.M. and Howes, D.B. “Summary Analysis of the Gemini <strong>Entry</strong> Aerodynamics.” NASA-TM-X-58100. Nov.<br />
1972.<br />
16 NASA Goddard Space Flight Center, National Space Science Data Center Spacecraft Query [online database], URL:<br />
http://nssdc.gsfc.nasa.gov/database/sc-query.html [cited 25 July 2007].<br />
17 Griffith, B.J. and Boylan, D.E. “Postflight Apollo Command Module Aerodynamic Simulation Tests.” Journal of<br />
Spacecraft and Rockets, Vol. 5, No. 7, July 1968. pp. 843-848.<br />
18 Graves, C.A. and Harpold, J.C. “Re-entry Targeting Philosophy and Flight Results from Apollo 10 and 11.” AIAA 1970-<br />
0028. Aerospace Sciences Meeting, New York, 19-21 Jan. 1970.<br />
19 Justus, C.G. and Johnson, D.L. “<strong>Mars</strong> Global Reference Atmospheric Model 2001 Version (<strong>Mars</strong>-GRAM 2001): Users<br />
Guide.” NASA-TM-2001-210961. April 2001.<br />
20 National Aeronautics and Space Administration. “NASA’s Exploration Systems Architecture Study.” NASA-TM-2005-<br />
214062. Nov. 2005.<br />
21 Grant, M. and Mendeck, G. “<strong>Mars</strong> Science Laboratory <strong>Entry</strong> <strong>Optimization</strong> Using Particle Swarm Methodology.” AIAA<br />
2007-6393. AIAA Atmospheric Flight Mechanics Conference and Exhibit, Hilton Head, 20-23 Aug. 2007.<br />
22 Lillie, C.F., Dailey, D., Kroening, K., and Polidan, R.S. “Large Aperture Telescopes Enabled by the Ares V Launch<br />
Vehicle.” AIAA 2007-6124. AIAA Space 2007 Conference and Exposition, Long Beach, 18-20 Sept. 2007.<br />
23 García-Llama, E. “Apollo-Derived <strong>Terminal</strong> Control <strong>for</strong> <strong>Bank</strong>-Modulated <strong>Mars</strong> Entries with Altitude Maximization.”<br />
AIAA 2008-6819. AIAA Guidance, Navigation, and Control Conference and Exhibit, Honolulu, 18-21 Aug. 2008.<br />
20<br />
American Institute of Aeronautics and Astronautics