Estimating the covariance function with functional data - Statistics ...
Estimating the covariance function with functional data - Statistics ...
Estimating the covariance function with functional data - Statistics ...

You also want an ePaper? Increase the reach of your titles
YUMPU automatically turns print PDFs into web optimized ePapers that Google loves.
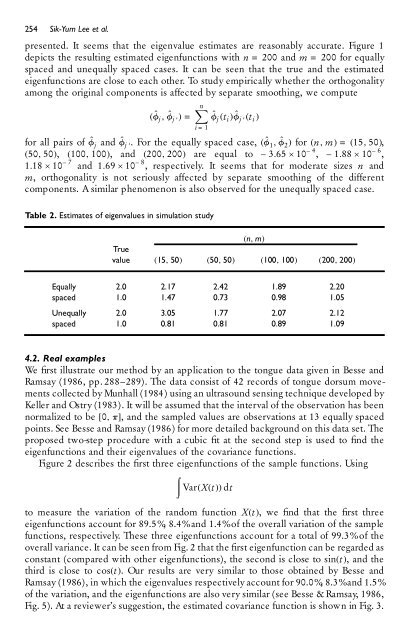
254 Sik-Yum Lee et al.<br />
presented. It seems that <strong>the</strong> eigenvalue estimates are reasonably accurate. Figure 1<br />
depicts <strong>the</strong> resulting estimated eigen<strong>function</strong>s <strong>with</strong> n = 200 and m = 200 for equally<br />
spaced and unequally spaced cases. It can be seen that <strong>the</strong> true and <strong>the</strong> estimated<br />
eigen<strong>function</strong>s are close to each o<strong>the</strong>r. To study empirically whe<strong>the</strong>r <strong>the</strong> orthogonality<br />
among <strong>the</strong> original components is affected by separate smoothing, we compute<br />
( ˆf j , ˆf j ¢ ) = Xn<br />
i = 1<br />
ˆf j (t i ) ˆf j ¢ (t i )<br />
for all pairs of ˆf j and ˆf j ¢ . For <strong>the</strong> equally spaced case, ( ˆf 1 , ˆf 2 ) for (n, m) = (15, 50),<br />
(50, 50), (100, 100), and (200, 200) are equal to ± 3.65 ´ 10 ± 4 , ± 1.88 ´ 10 ± 6 ,<br />
1.18 ´ 10 ± 7 and 1.69 ´ 10 ± 8 , respectively. It seems that for moderate sizes n and<br />
m, orthogonality is not seriously affected by separate smoothing of <strong>the</strong> different<br />
components. A similar phenomenon is also observed for <strong>the</strong> unequally spaced case.<br />
Table 2. Estimates of eigenvalues in simulation study<br />
(n, m)<br />
True<br />
value (15, 50) (50, 50) (100, 100) (200, 200)<br />
Equally 2.0 2.17 2.42 1.89 2.20<br />
spaced 1.0 1.47 0.73 0.98 1.05<br />
Unequally 2.0 3.05 1.77 2.07 2.12<br />
spaced 1.0 0.81 0.81 0.89 1.09<br />
4.2. Real examples<br />
We rst illustrate our method by an application to <strong>the</strong> tongue <strong>data</strong> given in Besse and<br />
Ramsay (1986, pp. 288–289). The <strong>data</strong> consist of 42 records of tongue dorsum movements<br />
collected by Munhall (1984) using an ultrasound sensing technique developed by<br />
Keller and Ostry (1983). It will be assumed that <strong>the</strong> interval of <strong>the</strong> observation has been<br />
normalized to be [0, p], and <strong>the</strong> sampled values are observations at 13 equally spaced<br />
points. See Besse and Ramsay (1986) for more detailed background on this <strong>data</strong> set. The<br />
proposed two-step procedure <strong>with</strong> a cubic t at <strong>the</strong> second step is used to nd <strong>the</strong><br />
eigen<strong>function</strong>s and <strong>the</strong>ir eigenvalues of <strong>the</strong> <strong>covariance</strong> <strong>function</strong>s.<br />
Figure 2 describes <strong>the</strong> rst three eigen<strong>function</strong>s of <strong>the</strong> sample <strong>function</strong>s. Using<br />
…<br />
Var(X(t)) dt<br />
to measure <strong>the</strong> variation of <strong>the</strong> random <strong>function</strong> X(t), we nd that <strong>the</strong> rst three<br />
eigen<strong>function</strong>s account for 89.5%, 8.4%and 1.4%of <strong>the</strong> overall variation of <strong>the</strong> sample<br />
<strong>function</strong>s, respectively. These three eigen<strong>function</strong>s account for a total of 99.3%of <strong>the</strong><br />
overall variance. It can be seen from Fig. 2 that <strong>the</strong> rst eigen<strong>function</strong> can be regarded as<br />
constant (compared <strong>with</strong> o<strong>the</strong>r eigen<strong>function</strong>s), <strong>the</strong> second is close to sin(t), and <strong>the</strong><br />
third is close to cos(t). Our results are very similar to those obtained by Besse and<br />
Ramsay (1986), in which <strong>the</strong> eigenvalues respectively account for 90.0%, 8.3%and 1.5%<br />
of <strong>the</strong> variation, and <strong>the</strong> eigen<strong>function</strong>s are also very similar (see Besse & Ramsay, 1986,<br />
Fig. 5). At a reviewer’s suggestion, <strong>the</strong> estimated <strong>covariance</strong> <strong>function</strong> is shown in Fig. 3.