Consolidated profit and loss account - Stagecoach Group
Consolidated profit and loss account - Stagecoach Group
Consolidated profit and loss account - Stagecoach Group

Create successful ePaper yourself
Turn your PDF publications into a flip-book with our unique Google optimized e-Paper software.
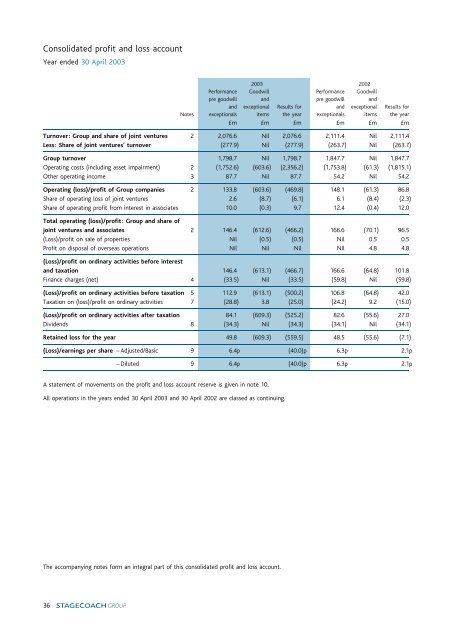
<strong>Consolidated</strong> <strong>profit</strong> <strong>and</strong> <strong>loss</strong> <strong>account</strong><br />
Year ended 30 April 2003<br />
2003 2002<br />
Performance Goodwill Performance Goodwill<br />
pre goodwill <strong>and</strong> pre goodwill <strong>and</strong><br />
<strong>and</strong> exceptional Results for <strong>and</strong> exceptional Results for<br />
Notes exceptionals items the year exceptionals items the year<br />
»m »m »m »m »m »m<br />
Turnover: <strong>Group</strong> <strong>and</strong> share of joint ventures 2 2,076.6 Nil 2,076.6 2,111.4 Nil 2,111.4<br />
Less: Share of joint ventures’ turnover (277.9) Nil (277.9) (263.7) Nil (263.7)<br />
<strong>Group</strong> turnover 1,798.7 Nil 1,798.7 1,847.7 Nil 1,847.7<br />
Operating costs (including asset impairment) 2 (1,752.6) (603.6) (2,356.2) (1,753.8) (61.3) (1,815.1)<br />
Other operating income 3 87.7 Nil 87.7 54.2 Nil 54.2<br />
Operating (<strong>loss</strong>)/<strong>profit</strong> of <strong>Group</strong> companies 2 133.8 (603.6) (469.8) 148.1 (61.3) 86.8<br />
Share of operating <strong>loss</strong> of joint ventures 2.6 (8.7) (6.1) 6.1 (8.4) (2.3)<br />
Share of operating <strong>profit</strong> from interest in associates 10.0 (0.3) 9.7 12.4 (0.4) 12.0<br />
Total operating (<strong>loss</strong>)/<strong>profit</strong>: <strong>Group</strong> <strong>and</strong> share of<br />
joint ventures <strong>and</strong> associates 2 146.4 (612.6) (466.2) 166.6 (70.1) 96.5<br />
(Loss)/<strong>profit</strong> on sale of properties Nil (0.5) (0.5) Nil 0.5 0.5<br />
Profit on disposal of overseas operations Nil Nil Nil NIl 4.8 4.8<br />
(Loss)/<strong>profit</strong> on ordinary activities before interest<br />
<strong>and</strong> taxation 146.4 (613.1) (466.7) 166.6 (64.8) 101.8<br />
Finance charges (net) 4 (33.5) Nil (33.5) (59.8) Nil (59.8)<br />
(Loss)/<strong>profit</strong> on ordinary activities before taxation 5 112.9 (613.1) (500.2) 106.8 (64.8) 42.0<br />
Taxation on (<strong>loss</strong>)/<strong>profit</strong> on ordinary activities 7 (28.8) 3.8 (25.0) (24.2) 9.2 (15.0)<br />
(Loss)/<strong>profit</strong> on ordinary activities after taxation 84.1 (609.3) (525.2) 82.6 (55.6) 27.0<br />
Dividends 8 (34.3) Nil (34.3) (34.1) Nil (34.1)<br />
Retained <strong>loss</strong> for the year 49.8 (609.3) (559.5) 48.5 (55.6) (7.1)<br />
(Loss)/earnings per share ^ Adjusted/Basic 9 6.4p (40.0)p 6.3p 2.1p<br />
^ Diluted 9 6.4p (40.0)p 6.3p 2.1p<br />
A statement of movements on the <strong>profit</strong> <strong>and</strong> <strong>loss</strong> <strong>account</strong> reserve is given in note 10.<br />
All operations in the years ended 30 April 2003 <strong>and</strong> 30 April 2002 are classed as continuing.<br />
The accompanying notes form an integral part of this consolidated <strong>profit</strong> <strong>and</strong> <strong>loss</strong> <strong>account</strong>.<br />
36
<strong>Consolidated</strong> balance sheet<br />
As at 30 April 2003<br />
Notes 2003 2002<br />
»m »m<br />
Fixed assets<br />
Intangible assets 11 206.9 665.4<br />
Tangible assets 12 851.6 1,108.9<br />
Investments 13<br />
^ Investment in joint ventures<br />
Goodwill 72.7 81.4<br />
Share of gross assets 167.5 136.7<br />
Share of gross liabilities (122.0) (97.4)<br />
Shareholder loan notes 10.4 10.0<br />
13 128.6 130.7<br />
^ Investment in associates 13 70.0 72.8<br />
^ Other investments 13 2.7 3.2<br />
1,259.8 1,981.0<br />
Current assets<br />
Stocks 15 38.1 50.9<br />
Debtors <strong>and</strong> prepaid charges ^ due within one year 16 192.3 228.5<br />
^ due after more than one year 16 59.9 54.2<br />
Cash at bank <strong>and</strong> in h<strong>and</strong> 164.7 150.0<br />
455.0 483.6<br />
Creditors: Amounts falling due within one year 17 (504.2) (524.0)<br />
Net current liabilities (49.2) (40.4)<br />
Total assets less current liabilities 1,210.6 1,940.6<br />
Creditors: Amounts falling due after more than one year 17 (640.7) (808.1)<br />
Provisions for liabilities <strong>and</strong> charges<br />
^ Joint ventures ^ thetrainline.com 21<br />
Share of gross assets 5.3 5.1<br />
Share of gross liabilities (27.9) (21.8)<br />
^ Other provisions 21 (230.2) (206.7)<br />
Net assets 2 317.1 909.1<br />
Capital <strong>and</strong> reserves<br />
Equity share capital 22 6.6 6.6<br />
Share premium <strong>account</strong> 24 386.1 384.4<br />
Profit <strong>and</strong> <strong>loss</strong> <strong>account</strong> 24 (77.3) 514.8<br />
ESOP distribution reserve 24 Nil 1.6<br />
Capital redemption reserve 24 1.7 1.7<br />
Shareholders’ funds ^ Equity 317.1 909.1<br />
Signed on behalf of the Board on 25 June 2003<br />
BRIAN SOUTER<br />
Chief Executive<br />
MARTIN A GRIFFITHS<br />
Finance Director<br />
The accompanying notes form an integral part of this consolidated balance sheet.<br />
37
Company balance sheet<br />
As at 30 April 2003<br />
Notes 2003 2002<br />
»m »m<br />
Fixed assets<br />
Tangible assets 12 7.8 8.5<br />
Investments 13 643.2 373.9<br />
651.0 382.4<br />
Current assets<br />
Debtors <strong>and</strong> prepaid charges ^ due within one year 16 21.5 22.3<br />
^ due after more than one year 16 551.8 1,656.9<br />
Cash at bank <strong>and</strong> in h<strong>and</strong> 5.2 Nil<br />
578.5 1,679.2<br />
Creditors: Amounts falling due within one year 17 (210.6) (177.2)<br />
Net current assets 367.9 1,502.0<br />
Total assets less current liabilities 1,018.9 1,884.4<br />
Creditors: Amounts falling due after more than one year 17 (563.4) (812.0)<br />
Provisions for liabilities <strong>and</strong> charges 21 (3.6) (8.0)<br />
Net assets 451.9 1,064.4<br />
Capital <strong>and</strong> reserves<br />
Equity share capital 22 6.6 6.6<br />
Share premium <strong>account</strong> 24 386.1 384.4<br />
Profit <strong>and</strong> <strong>loss</strong> <strong>account</strong> 24 57.5 670.1<br />
ESOP distribution reserve 24 Nil 1.6<br />
Capital redemption reserve 24 1.7 1.7<br />
Shareholders’ funds ^ Equity 451.9 1,064.4<br />
Signed on behalf of the Board on 25 June 2003<br />
BRIAN SOUTER<br />
Chief Executive<br />
MARTIN A GRIFFITHS<br />
Finance Director<br />
The accompanying notes form an integral part of this balance sheet.<br />
38
<strong>Consolidated</strong> cash flow statement<br />
Year ended 30 April 2003<br />
Notes 2003 2002<br />
»m »m<br />
Net cash inflow from operating activities 25 272.2 256.9<br />
Dividends from joint ventures <strong>and</strong> associates 5.3 5.0<br />
Returns on investments <strong>and</strong> servicing of finance<br />
Interest paid (52.6) (61.7)<br />
Interest element of hire purchase <strong>and</strong> lease finance (4.7) (7.6)<br />
Interest received 5.4 8.4<br />
Net cash outflow from returns on investments <strong>and</strong> servicing of finance (51.9) (60.9)<br />
Taxation (7.8) (16.7)<br />
Capital expenditure <strong>and</strong> financial investment<br />
Purchase of tangible fixed assets (52.9) (82.4)<br />
Sale of tangible fixed assets 20.1 5.4<br />
Net cash outflow from capital expenditure <strong>and</strong> financial investment (32.8) (77.0)<br />
Acquisitions <strong>and</strong> disposals<br />
Acquisition of subsidiaries 25 (10.1) (25.2)<br />
Net cash acquired with subsidiaries Nil 0.3<br />
Purchase of goodwill (0.8) (0.1)<br />
Purchase of investments in joint ventures <strong>and</strong> associates (0.9) (1.5)<br />
Purchase of other investments Nil (0.3)<br />
Cash of disposed subsidiaries 13 Nil (0.8)<br />
Disposal of subsidiaries <strong>and</strong> other businesses 13 7.0 16.1<br />
Disposal of other investments Nil 2.0<br />
Net cash outflow from acquisitions <strong>and</strong> disposals (4.8) (9.5)<br />
Equity dividends paid (27.6) (49.8)<br />
Net cash inflow before financing 152.6 48.0<br />
Financing<br />
Sale of tokens 12.9 14.8<br />
Redemption of tokens (10.8) (13.4)<br />
Issue of share capital for cash Nil 1.3<br />
(Increase)/decrease in collateral balances (32.1) 38.2<br />
Decrease in borrowings (90.9) (12.2)<br />
Repayments of hire purchase <strong>and</strong> lease finance (44.4) (48.2)<br />
Net cash outflow from financing (165.3) (19.5)<br />
(Decrease)/increase in cash during the year 25 (12.7) 28.5<br />
Free cash flow 217.8 184.3<br />
Free cash flow per share 16.6p 14.1p<br />
Free cash flow comprises net cash inflow from operating activities, dividends from joint ventures <strong>and</strong> associates, net cash outflow from<br />
returns on investments <strong>and</strong> servicing of finance, <strong>and</strong> taxation.<br />
The accompanying notes form an integral part of this consolidated cash flow statement.<br />
39
<strong>Consolidated</strong> statement of total recognised gains <strong>and</strong> <strong>loss</strong>es<br />
Year ended 30 April 2003<br />
2003 2002<br />
»m »m<br />
(Loss)/<strong>profit</strong> for the financial year (525.2) 27.0<br />
Translation differences on foreign currency net investments (26.6) (5.5)<br />
UK tax effect of translation differences on foreign currency net investments (6.4) (4.8)<br />
Share of other recognised gains <strong>and</strong> <strong>loss</strong>es of associates (0.1) (0.2)<br />
Total recognised gains <strong>and</strong> <strong>loss</strong>es relating to the year (558.3) 16.5<br />
There are no recognised gains <strong>and</strong> <strong>loss</strong>es of joint ventures other than the <strong>Group</strong>’s share of their <strong>profit</strong>s or <strong>loss</strong>es for each financial year.<br />
Reconciliation of movements in consolidated shareholders’ funds<br />
Year ended 30 April 2003<br />
2003 2002<br />
»m »m<br />
(Loss)/<strong>profit</strong> for the financial year (525.2) 27.0<br />
Dividends (34.3) (34.1)<br />
(559.5) (7.1)<br />
Goodwill sold, previously written off to reserves 0.5 3.7<br />
Other recognised gains <strong>and</strong> <strong>loss</strong>es relating to the year<br />
^ translation differences on foreign currency net investments (26.6) (5.5)<br />
^ UK tax effect of translation differences on foreign currency net investments (6.4) (4.8)<br />
^ share of other recognised gains <strong>and</strong> <strong>loss</strong>es of associates (0.1) (0.2)<br />
Share capital issued less costs 1.7 2.9<br />
ESOP distribution reserve decrease (1.6) (0.2)<br />
Net reduction in shareholders’ funds (592.0) (11.2)<br />
Opening shareholders’ funds 909.1 920.3<br />
Closing shareholders’ funds 317.1 909.1<br />
The accompanying notes form an integral part of these statements.<br />
40
Notes to the <strong>account</strong>s 2003<br />
Note 1 Statement of <strong>account</strong>ing policies<br />
A summary of the principal <strong>account</strong>ing policies is set out below. All principal <strong>account</strong>ing policies have been applied consistently throughout<br />
the year <strong>and</strong> the preceding year.<br />
(a) Basis of <strong>account</strong>ing<br />
The <strong>account</strong>s have been prepared under the historical cost convention <strong>and</strong> in accordance with applicable <strong>account</strong>ing st<strong>and</strong>ards in the<br />
United Kingdom.<br />
(b) Presentation of <strong>profit</strong> <strong>and</strong> <strong>loss</strong> <strong>account</strong><br />
Where applicable, <strong>profit</strong> <strong>and</strong> <strong>loss</strong> <strong>account</strong> information has been presented in a columnar format, which separately highlights goodwill<br />
amortisation <strong>and</strong> exceptional items. This is intended to enable the users of the <strong>account</strong>s to determine more readily the impact of goodwill<br />
<strong>and</strong> exceptional items on the results of the <strong>Group</strong>.<br />
(c) Basis of consolidation<br />
The consolidated <strong>account</strong>s include the <strong>account</strong>s of the Company, its subsidiary undertakings, joint ventures <strong>and</strong> associates made up to<br />
30 April in each year except as noted below:<br />
Associates ^ The <strong>Group</strong>’s share of the <strong>profit</strong> of Road King Infrastructure Limited is based on the results of that company for the year to<br />
31 December. The <strong>Group</strong>’s share of the <strong>profit</strong>/<strong>loss</strong> of other associates is based on the results for the period covered by the <strong>Group</strong>’s<br />
financial year.<br />
The consolidated <strong>profit</strong> <strong>and</strong> <strong>loss</strong> <strong>account</strong> includes the results of businesses purchased from the effective date of acquisition <strong>and</strong> excludes<br />
the results of discontinued operations <strong>and</strong> businesses sold from the effective date of disposal. No <strong>profit</strong> <strong>and</strong> <strong>loss</strong> <strong>account</strong> is presented for<br />
the parent company, <strong>Stagecoach</strong> <strong>Group</strong> plc, as permitted by Section 230 of the Companies Act 1985.<br />
(d) Intangible assets<br />
In accordance with FRS 10 ‘‘Goodwill <strong>and</strong> Intangible Assets’’, goodwill arising on acquisitions after 30 April 1998 is recorded as an asset on<br />
the balance sheet at cost less amortisation. Each acquisition is reviewed <strong>and</strong> where the goodwill has a finite economic life, goodwill is<br />
amortised over that life. In estimating the useful economic life of goodwill, <strong>account</strong> has been taken of the nature of the business acquired,<br />
stability of the industry sector, extent of barriers to entry <strong>and</strong> expected future impact of competition. The useful life of goodwill arising on<br />
the acquisitions made is estimated by the directors to be between 5 <strong>and</strong> 20 years. Provision is made for any impairment, with impairment<br />
reviews being undertaken in accordance with FRS 11, ‘‘Impairment of fixed assets <strong>and</strong> goodwill’’. Goodwill arising on acquisitions in the<br />
year ended 30 April 1998 <strong>and</strong> earlier periods was written off directly to reserves in accordance with the <strong>account</strong>ing st<strong>and</strong>ard then in force.<br />
As permitted by the current <strong>account</strong>ing st<strong>and</strong>ard, the goodwill previously written off to reserves has not been reinstated in the balance<br />
sheet. On the disposal of a subsidiary undertaking, goodwill previously written off directly to reserves in respect of such an undertaking is<br />
transferred to the <strong>profit</strong> <strong>and</strong> <strong>loss</strong> <strong>account</strong> <strong>and</strong> constitutes part of the gain or <strong>loss</strong> to the <strong>Group</strong> arising on disposal.<br />
Fair value <strong>account</strong>ing adjustments have been made to take <strong>account</strong> of the revaluation of certain fixed assets on an existing use basis,<br />
discounting of long term liabilities (but not deferred tax provisions) <strong>and</strong> other changes in <strong>account</strong>ing policies required to comply with<br />
<strong>Group</strong> policies. Fair value adjustments based on provisional estimates are amended in the following year’s <strong>account</strong>s where necessary,<br />
with a corresponding adjustment to goodwill, in order to refine adjustments to reflect further evidence gained post-acquisition.<br />
41
Notes to the <strong>account</strong>s 2003<br />
Note 1 Statement of <strong>account</strong>ing policies (continued)<br />
(e) Tangible fixed assets<br />
Tangible fixed assets are shown at their original historic cost or fair value on acquisition net of depreciation <strong>and</strong> any provision for<br />
impairment as set out in note 12.<br />
Depreciation is provided at rates calculated to write off the cost or valuation less estimated residual value of each asset on a straight-line<br />
basis over their estimated useful lives, as follows:<br />
Heritable <strong>and</strong> freehold buildings <strong>and</strong> long leasehold properties<br />
Short leasehold properties<br />
Public service vehicles (‘‘PSVs’’) <strong>and</strong> transportation equipment<br />
IT <strong>and</strong> other equipment, furniture <strong>and</strong> fittings<br />
Motor cars <strong>and</strong> other vehicles<br />
50 years<br />
Over period of lease<br />
7 to 16 years, depending on type<br />
5 to 10 years<br />
3 to 5 years<br />
Heritable <strong>and</strong> freehold l<strong>and</strong> is not depreciated.<br />
The need for any fixed asset impairment write-down is assessed by comparison of the carrying value of the asset against the higher of net<br />
realisable value or value in use.<br />
(f) Pre-contract costs<br />
In accordance with UITF Abstract 34, ‘‘Pre-contract costs’’, the costs associated with securing new rail franchises are expensed as incurred,<br />
except where it is virtually certain that a contract will be awarded in which case they are recognised as an asset <strong>and</strong> are charged to the<br />
<strong>profit</strong> <strong>and</strong> <strong>loss</strong> <strong>account</strong> over the life of the franchise.<br />
(g) Investments<br />
Fixed asset investments are shown at cost less provision for impairment. In the Company’s <strong>account</strong>s investments in subsidiary undertakings<br />
are stated at cost, less provision for impairment.<br />
(h) Associates <strong>and</strong> Joint Ventures<br />
In the <strong>Group</strong> <strong>account</strong>s the investments in associates are <strong>account</strong>ed for using the equity method <strong>and</strong> investments in joint ventures are<br />
<strong>account</strong>ed for using the gross equity method. The consolidated <strong>profit</strong> <strong>and</strong> <strong>loss</strong> <strong>account</strong> includes the <strong>Group</strong>’s share of associates’ <strong>and</strong> joint<br />
ventures’ <strong>profit</strong>s less <strong>loss</strong>es, while the <strong>Group</strong>’s share of associates’ <strong>and</strong> joint ventures’ net assets is shown in the consolidated balance<br />
sheet. Where the <strong>Group</strong> has an interest in a joint venture’s net liabilities, the <strong>Group</strong>’s share of net liabilities is classified within provisions<br />
for liabilities <strong>and</strong> charges. Goodwill arising on the acquisition is <strong>account</strong>ed for in accordance with the policy set out above. Any<br />
unamortised goodwill is included in the carrying value of the <strong>Group</strong>’s investments.<br />
(i) Stocks<br />
Stocks of parts <strong>and</strong> consumables are stated at the lower of cost <strong>and</strong> net realisable value after making due allowance for obsolete or slow<br />
moving items.<br />
Taxicabs which are held for sale or lease to independent contractors are included within stocks.<br />
(j) Hire purchase <strong>and</strong> lease obligations<br />
Assets acquired under hire purchase <strong>and</strong> finance leases are recorded in the balance sheet as assets at the equivalent of the purchase price<br />
<strong>and</strong> as obligations to pay hire purchase capital instalments or future lease rentals. Obligations arising from hire purchase contracts <strong>and</strong><br />
finance leases represent the total of the capital payments outst<strong>and</strong>ing at the date of the balance sheet. Future finance charges are not<br />
included. Future finance charges are calculated in relation to the reducing balance of capital outst<strong>and</strong>ing throughout the contract <strong>and</strong><br />
charged to the <strong>profit</strong> <strong>and</strong> <strong>loss</strong> <strong>account</strong> on the same basis.<br />
Assets capitalised under lease finance <strong>and</strong> other similar contracts are depreciated over the shorter of the lease terms <strong>and</strong> their useful<br />
economic lives.<br />
Assets capitalised under hire purchase contracts are depreciated over their useful economic lives.<br />
Rentals under operating leases are charged on a straight-line basis over the lease term.<br />
The principal restriction on property held under finance or hire purchase agreements is a restriction on the right to dispose of the property<br />
during the period of the agreement.<br />
42
Notes to the <strong>account</strong>s 2003<br />
Note 1 Statement of <strong>account</strong>ing policies (continued)<br />
(k) Taxation<br />
Corporation tax is provided on taxable <strong>profit</strong>s at the current rate applicable. Tax charges <strong>and</strong> credits are <strong>account</strong>ed for through the same<br />
primary statement (either the <strong>profit</strong> <strong>and</strong> <strong>loss</strong> <strong>account</strong> or the statement of total recognised gains <strong>and</strong> <strong>loss</strong>es) as the related pre-tax item.<br />
In accordance with FRS 19, ‘‘Deferred Taxation’’, full provision is made for deferred tax on a non-discounted basis in respect of all timing<br />
differences except those arising from the revaluation of fixed assets where there is no binding sale agreement <strong>and</strong> undistributed <strong>profit</strong>s of<br />
overseas subsidiaries <strong>and</strong> associates.<br />
Deferred tax is calculated at rates at which it is estimated the tax will arise. Deferred tax assets are recognised to the extent they are<br />
more likely than not to be recovered.<br />
(l) Turnover<br />
Turnover represents gross revenue earned from public transport services <strong>and</strong> operating lease rentals receivable, <strong>and</strong> excludes future<br />
payments received on <strong>account</strong>. Amounts receivable for tendered services <strong>and</strong> concessionary fare schemes are included as part of turnover.<br />
Where appropriate, amounts are shown net of rebates <strong>and</strong> VAT. Revenues incidental to the <strong>Group</strong>’s principal activity (including advertising<br />
income <strong>and</strong> maintenance income) are reported as miscellaneous revenue.<br />
Bus <strong>and</strong> rail revenue is recognised at the time of travel. Bus revenue from local authority <strong>and</strong> similar contracts is recognised on a<br />
straight-line basis over the period of the contract.<br />
Income from advertising <strong>and</strong> other activities is recognised as the income is earned.<br />
Compensation receivable by UK Rail companies in respect of service disruption under the performance regime provisions of the track access<br />
agreements with Network Rail is recognised over the expected period of disruption <strong>and</strong> is shown as other operating income.<br />
(m) Tokens<br />
Tokens issued by National Transport Tokens Limited, a subsidiary of the <strong>Group</strong>, are credited to a token redemption provision. Redemptions<br />
are offset against this <strong>and</strong> associated h<strong>and</strong>ling commission paid to third parties is included in operating costs. Funds from the sale of<br />
tokens required for token redemption are included as a financing activity in the consolidated cash flow statement.<br />
The estimation of the balance sheet provision for token redemption is based on the value of tokens issued by the <strong>Group</strong> but not yet<br />
redeemed at the balance sheet date. Allowance is made for the estimated proportion of tokens in issue that will never be redeemed. This<br />
allowance is estimated with reference to historic redemption rates. At 30 April 2003, it has been estimated that 97% (2002 ^ 97%) of<br />
tokens in issue will be redeemed.<br />
(n) Pension costs<br />
The <strong>Group</strong> provides for <strong>and</strong> funds pension liabilities on the advice of external actuaries <strong>and</strong> makes payments to segregated funds managed<br />
by specialist financial institutions.<br />
Independent actuarial valuations on a going concern basis are carried out at least every three years. The employer costs of providing<br />
retirement benefits to employees are charged to the <strong>profit</strong> <strong>and</strong> <strong>loss</strong> <strong>account</strong> on a systematic basis so as to produce a substantially level<br />
percentage of the current <strong>and</strong> future pensionable payroll. Variations from regular cost arising from any excess or deficiency of the actuarial<br />
value of the pension funds’ assets over the actuarial valuation of the pension funds’ liabilities are allocated to the <strong>profit</strong> <strong>and</strong> <strong>loss</strong> <strong>account</strong><br />
over the employees’ average remaining service lives. Any timing difference between amounts charged in the <strong>profit</strong> <strong>and</strong> <strong>loss</strong> <strong>account</strong> <strong>and</strong><br />
paid to the pension funds is shown in the balance sheet as an asset or a liability.<br />
Details of the principal <strong>Group</strong> pension schemes are given in note 26d.<br />
The transitional disclosures required under FRS 17, ‘‘Retirement Benefits’’, are also included in note 26d.<br />
43
Notes to the <strong>account</strong>s 2003<br />
Note 1 Statement of <strong>account</strong>ing policies (continued)<br />
(o) Foreign currencies<br />
The <strong>account</strong>s of overseas subsidiaries <strong>and</strong> associate undertakings are maintained in the local currencies in which the subsidiaries transact<br />
business. The trading results of overseas subsidiary <strong>and</strong> associate undertakings are translated into sterling using average rates of exchange.<br />
Exchange differences arising on the translation of the opening net assets <strong>and</strong> results of overseas operations, together with exchange<br />
differences arising on foreign currency borrowings <strong>and</strong> foreign currency derivatives, to the extent they hedge the <strong>Group</strong>’s investment in<br />
overseas operations, are dealt with in the statement of total recognised gains <strong>and</strong> <strong>loss</strong>es.<br />
Foreign currency assets <strong>and</strong> liabilities are translated into sterling at the rates of exchange ruling at the year end except in those instances<br />
where forward contracts are in place, in which case the contract rate is used. Foreign currency transactions arising during the year are<br />
translated into sterling at the rate of exchange ruling on the date of the transaction. Any exchange differences so arising are dealt with<br />
through the <strong>profit</strong> <strong>and</strong> <strong>loss</strong> <strong>account</strong>.<br />
Principal rates of exchange 2003 2002<br />
New Zeal<strong>and</strong> Dollar<br />
Year end rate 2.86 3.40<br />
Average rate 3.10 3.26<br />
Hong Kong Dollar<br />
Year end rate 12.46 11.37<br />
Average rate 12.15 11.17<br />
US Dollar<br />
Year end rate 1.60 1.46<br />
Average rate 1.56 1.43<br />
(p) Accounting for finance costs <strong>and</strong> debt<br />
Finance costs of debt are recognised in the <strong>profit</strong> <strong>and</strong> <strong>loss</strong> <strong>account</strong> over the term of such instruments at a constant rate on the carrying<br />
amount.<br />
Debt is initially stated at the amount of the net proceeds after deduction of issue costs. The carrying amount is increased by the finance<br />
costs that are recognised in the <strong>profit</strong> <strong>and</strong> <strong>loss</strong> <strong>account</strong> in respect of each <strong>account</strong>ing period. The carrying amount is reduced by amounts<br />
paid in respect of finance costs <strong>and</strong>/or repayments of principal.<br />
(q) Government grants<br />
Government grants relating to tangible fixed assets are treated as deferred income <strong>and</strong> released to the <strong>profit</strong> <strong>and</strong> <strong>loss</strong> <strong>account</strong> over<br />
the expected useful lives of the assets concerned. Other grants are credited to the <strong>profit</strong> <strong>and</strong> <strong>loss</strong> <strong>account</strong> as the related expenditure<br />
is expensed.<br />
Revenue grants receivable in respect of the operation of rail franchises in the UK are charged or credited to the <strong>profit</strong> <strong>and</strong> <strong>loss</strong> <strong>account</strong><br />
in the year in which the related expenditure is recognised in the <strong>profit</strong> <strong>and</strong> <strong>loss</strong> <strong>account</strong> or where they do not relate to any specific<br />
expenditure, in the year in which the grant is receivable. These rail franchise grants are classified within Other Operating Income.<br />
44
Notes to the <strong>account</strong>s 2003<br />
Note 1 Statement of <strong>account</strong>ing policies (continued)<br />
(r) Derivatives <strong>and</strong> financial investments<br />
Financial assets are recognised in the balance sheet at the lower of cost <strong>and</strong> net realisable value.<br />
The <strong>Group</strong> uses derivative financial instruments to reduce exposure to foreign exchange risk, commodity price risk <strong>and</strong> interest rate<br />
movements. The <strong>Group</strong> does not hold or issue derivative financial instruments for speculative purposes.<br />
Forward foreign exchange contracts are used to manage exposure to fluctuations in currency rates <strong>and</strong> to hedge overseas net investments.<br />
For a forward foreign exchange contract to be treated as a hedge the instrument must be related to actual foreign currency assets or<br />
liabilities or to a probable commitment. It must involve the same currency or similar currencies as the hedged item <strong>and</strong> must also reduce<br />
the risk of foreign currency exchange movements on the <strong>Group</strong>’s operations. Gains <strong>and</strong> <strong>loss</strong>es arising on these contracts are either held off<br />
balance sheet or deferred on balance sheet <strong>and</strong> recognised either in the <strong>profit</strong> <strong>and</strong> <strong>loss</strong> <strong>account</strong> or as adjustments to the carrying amount<br />
of fixed assets, only when the hedged transaction has itself been reflected in the <strong>Group</strong>’s financial statements. Gains <strong>and</strong> <strong>loss</strong>es arising on<br />
derivatives hedging overseas net investments are recognised in the Statement of Total Recognised Gains <strong>and</strong> Losses.<br />
For interest rate <strong>and</strong> commodity swaps to be treated as a hedge the instrument must be related to actual assets or liabilities or a probable<br />
commitment <strong>and</strong> must change the nature of the interest rate or fuel cost by converting a fixed rate to a variable rate or vice versa.<br />
Cash flows under these swaps are recognised by adjusting net interest payable <strong>and</strong> fuel costs over the periods of the contracts. Gains <strong>and</strong><br />
<strong>loss</strong>es arising from the termination of these contracts are deferred on balance sheet <strong>and</strong> amortised to the <strong>profit</strong> <strong>and</strong> <strong>loss</strong> <strong>account</strong> over<br />
the remaining period of the related hedged item or recognised immediately in the <strong>profit</strong> <strong>and</strong> <strong>loss</strong> <strong>account</strong> where the hedged item no<br />
longer exists.<br />
If an instrument ceases to be <strong>account</strong>ed for as a hedge, for example because the underlying hedged position no longer exists or the hedge<br />
is no longer effective, provision is made for any fair value <strong>loss</strong> on the instrument at that time.<br />
(s) Marketing costs<br />
Marketing costs incurred during the start up phase of a new activity are charged to the <strong>profit</strong> <strong>and</strong> <strong>loss</strong> <strong>account</strong> as incurred.<br />
(t) Insurance<br />
The <strong>Group</strong> receives claims in respect of traffic incidents <strong>and</strong> employee claims. The <strong>Group</strong> protects against the cost of such claims through<br />
third party insurance policies. An element of the claims are not insured as a result of the ‘‘excess’’ on insurance policies.<br />
Provision is made on a discounted basis for the estimated cost to the <strong>Group</strong> (net of insurance recoveries) to settle claims for incidents<br />
occurring prior to the balance sheet date. The estimation of the balance sheet insurance provisions is based on an assessment of the<br />
expected settlement on known claims together with an estimate of settlements that will be made in respect of incidents occurring prior<br />
to the balance sheet date but that have not yet been reported to the <strong>Group</strong>.<br />
Note 2 Segmental analysis<br />
(a) Turnover 2003 2002<br />
»m »m<br />
Continuing operations<br />
UK Bus 598.4 567.9<br />
Overseas Bus 183.7 194.7<br />
Coach USA 603.0 682.3<br />
Total bus continuing operations 1,385.1 1,444.9<br />
Rail 413.6 402.8<br />
<strong>Group</strong> turnover ^ continuing operations 1,798.7 1,847.7<br />
Share of joint ventures’ turnover<br />
^ Train operating companies 276.1 261.2<br />
^ thetrainline.com 11.0 11.7<br />
^ Elimination of inter-segment turnover (9.2) (9.2)<br />
<strong>Group</strong> turnover <strong>and</strong> share of joint ventures’ turnover 2,076.6 2,111.4<br />
Turnover of »183.7m (2002 ^ »194.7m) for the continuing Overseas Bus segment includes amounts of »132.3m (2002 ^ »148.6m) in<br />
relation to Citybus, which was disposed of after 30 April 2003.<br />
Due to the nature of the <strong>Group</strong>’s business, the origin <strong>and</strong> destination of turnover is the same in all cases.<br />
45
Notes to the <strong>account</strong>s 2003<br />
Note 2 Segmental analysis (continued)<br />
(b) (i) Operating (<strong>loss</strong>)/<strong>profit</strong> 2003 2002<br />
Restated (see below)<br />
Performance Goodwill Results for Performance Goodwill Results for<br />
pre goodwill <strong>and</strong> the year pre goodwill <strong>and</strong> the year<br />
<strong>and</strong> exceptional <strong>and</strong> exceptional<br />
exceptionals items exceptionals items<br />
»m »m »m »m »m »m<br />
Continuing operations<br />
UK Bus 67.0 Nil 67.0 62.7 Nil 62.7<br />
Overseas Bus 30.3 Nil 30.3 33.4 Nil 33.4<br />
Coach USA 14.0 (575.0) (561.0) 38.4 (19.6) 18.8<br />
Total bus continuing operations 111.3 (575.0) (463.7) 134.5 (19.6) 114.9<br />
Rail 38.2 Nil 38.2 31.0 Nil 31.0<br />
Total continuing operations 149.5 (575.0) (425.5) 165.5 (19.6) 145.9<br />
<strong>Group</strong> overheads (9.4) Nil (9.4) (10.8) Nil (10.8)<br />
Annual goodwill amortisation Nil (28.6) (28.6) Nil (41.7) (41.7)<br />
Redundancy/restructuring costs<br />
^ Continuing operations (6.3) Nil (6.3) (6.6) Nil (6.6)<br />
Total operating (<strong>loss</strong>)/<strong>profit</strong> of <strong>Group</strong> companies 133.8 (603.6) (469.8) 148.1 (61.3) 86.8<br />
Share of operating <strong>profit</strong>/(<strong>loss</strong>) of joint ventures<br />
^ Train operating companies 7.2 Nil 7.2 10.8 Nil 10.8<br />
^ thetrainline.com (4.3) Nil (4.3) (4.4) Nil (4.4)<br />
^ other (0.3) Nil (0.3) (0.3) Nil (0.3)<br />
Goodwill amortised on investment in joint ventures Nil (8.7) (8.7) Nil (8.4) (8.4)<br />
Share of operating <strong>profit</strong>/(<strong>loss</strong>) of associates<br />
^ Road King 10.5 Nil 10.5 12.9 Nil 12.9<br />
^ other (0.5) Nil (0.5) (0.5) Nil (0.5)<br />
Goodwill amortised on investment in associates Nil (0.3) (0.3) Nil (0.4) (0.4)<br />
Total operating (<strong>loss</strong>)/<strong>profit</strong>: <strong>Group</strong> <strong>and</strong> share<br />
of joint ventures <strong>and</strong> associates 146.4 (612.6) (466.2) 166.6 (70.1) 96.5<br />
Operating <strong>profit</strong> of »30.3m (2002 ^ »33.4m) for the continuing Overseas Bus segment includes amounts of »19.1m (2002 ^ »25.2m) in<br />
relation to Citybus, which was disposed of after 30 April 2003.<br />
Goodwill amortisation of »28.6m (2002 ^ »41.7m) is analysed as UK Bus »0.8m (2002 ^ »0.7m), Overseas Bus »8.6m (2002 ^ »9.2m) <strong>and</strong><br />
Coach USA »19.2m (2002 ^ »31.8m).<br />
Restructuring costs of »6.3m (2002 ^ »6.6m) are analysed as UK Bus »1.8m (2002 ^ »1.5m), Overseas Bus »0.1m (2002 ^ »Nil), Coach<br />
USA »3.0m (2002 ^ »4.9m), Rail »0.6m (2002 ^ »Nil) <strong>and</strong> costs incurred centrally »0.8m (2002 ^ »0.2m)<br />
The above segmental analysis of operating <strong>profit</strong> has been restated by applying certain costs that were previously classified within ‘‘<strong>Group</strong><br />
overheads’’ against the operating <strong>profit</strong>s of particular operating divisions. This has been done to align the segmental analysis with the way<br />
management now monitors the business <strong>and</strong> to achieve greater comparability with other companies.<br />
For completeness, we have also presented on page 47, operating <strong>profit</strong>s segmented using the previous basis.<br />
46
Notes to the <strong>account</strong>s 2003<br />
Note 2 Segmental analysis (continued)<br />
(b) (ii) Operating (<strong>loss</strong>)/<strong>profit</strong> 2003 2002<br />
Performance Goodwill Results for Performance Goodwill Results for<br />
pre goodwill <strong>and</strong> the year pre goodwill <strong>and</strong> the year<br />
<strong>and</strong> exceptional <strong>and</strong> exceptional<br />
exceptionals items exceptionals items<br />
»m »m »m »m »m »m<br />
Continuing operations<br />
UK Bus 76.0 Nil 76.0 71.1 Nil 71.1<br />
Overseas Bus 30.3 Nil 30.3 34.1 Nil 34.1<br />
Coach USA 16.6 (575.0) (558.4) 41.2 (19.6) 21.6<br />
Total bus continuing operations 122.9 (575.0) (452.1) 146.4 (19.6) 126.8<br />
Rail 38.2 Nil 38.2 31.3 Nil 31.3<br />
Total continuing operations 161.1 (575.0) (413.9) 177.7 (19.6) 158.1<br />
<strong>Group</strong> overheads (21.0) Nil (21.0) (23.0) Nil (23.0)<br />
Annual goodwill amortisation Nil (28.6) (28.6) Nil (41.7) (41.7)<br />
Redundancy/restructuring costs<br />
^ Continuing operations (6.3) Nil (6.3) (6.6) Nil (6.6)<br />
Total operating (<strong>loss</strong>)/<strong>profit</strong> of <strong>Group</strong> companies 133.8 (603.6) (469.8) 148.1 (61.3) 86.8<br />
Share of operating <strong>profit</strong>/(<strong>loss</strong>) of joint ventures<br />
^ Train operating companies 7.2 Nil 7.2 10.8 Nil 10.8<br />
^ thetrainline.com (4.3) Nil (4.3) (4.4) Nil (4.4)<br />
^ other (0.3) Nil (0.3) (0.3) Nil (0.3)<br />
Goodwill amortised on investment in joint ventures Nil (8.7) (8.7) Nil (8.4) (8.4)<br />
Share of operating <strong>profit</strong>/(<strong>loss</strong>) of associates<br />
^ Road King 10.5 Nil 10.5 12.9 Nil 12.9<br />
^ other (0.5) Nil (0.5) (0.5) Nil (0.5)<br />
Goodwill amortised on investment in associates Nil (0.3) (0.3) Nil (0.4) (0.4)<br />
Total operating (<strong>loss</strong>)/<strong>profit</strong>: <strong>Group</strong> <strong>and</strong> share<br />
of joint ventures <strong>and</strong> associates 146.4 (612.6) (466.2) 166.6 (70.1) 96.5<br />
(c) Operating costs 2003 2002<br />
Performance Goodwill Results for Performance Goodwill Results for<br />
pre goodwill <strong>and</strong> the year pre goodwill <strong>and</strong> the year<br />
<strong>and</strong> exceptional <strong>and</strong> exceptional<br />
exceptionals items exceptionals items<br />
»m »m »m »m »m »m<br />
Operating costs (excluding asset impairment) (1,752.6) (54.1) (1,806.7) (1,753.8) (51.6) (1,805.4)<br />
Impairment of assets of group companies Nil (549.5) (549.5) Nil (9.7) (9.7)<br />
(1,752.6) (603.6) (2,356.2) (1,753.8) (61.3) (1,815.1)<br />
47
Notes to the <strong>account</strong>s 2003<br />
Note 2 Segmental analysis (continued)<br />
(d) Net assets 2003 2002<br />
»m »m<br />
UK Bus 298.5 344.3<br />
Overseas Bus 230.1 271.0<br />
Coach USA 323.2 1,032.3<br />
Rail (76.8) (83.2)<br />
Central assets/liabilities (73.9) (67.5)<br />
Net assets of <strong>Group</strong> companies before debt 701.1 1,496.9<br />
Joint ventures 106.0 114.0<br />
Associates 70.0 72.8<br />
Total net assets before debt: <strong>Group</strong>, joint ventures <strong>and</strong> associates 877.1 1,683.7<br />
Net debt (560.0) (774.6)<br />
Net assets 317.1 909.1<br />
Central assets/liabilities include the proposed dividend, token provisions, interest payable <strong>and</strong> receivable on <strong>Group</strong> debt <strong>and</strong> other net<br />
assets of the holding company.<br />
Note 3 Other operating income<br />
2003 2002<br />
»m »m<br />
Miscellaneous revenue 47.9 47.5<br />
Liquidated damages received 8.5 Nil<br />
Losses on disposal of assets, other than properties (2.7) (0.1)<br />
Rail franchise support 34.0 6.8<br />
87.7 54.2<br />
Miscellaneous revenue comprises revenue incidental to the <strong>Group</strong>’s principal activity. It includes advertising income, maintenance income<br />
<strong>and</strong> property income.<br />
The liquidated damages received of »8.5m (2002 ^ »Nil) relate to 24 new class 458 trains, which are now in service at South West Trains,<br />
a subsidiary of the <strong>Group</strong>. A number of problems were experienced with the late delivery <strong>and</strong> reliability of the new trains <strong>and</strong> the<br />
liquidated damages were received in respect of these issues.<br />
Rail franchise support totalled »34.0m (2002 ^ »6.8m). The increase mainly reflects the deed of amendment agreed with the UK’s Strategic<br />
Rail Authority in respect of South West Trains <strong>and</strong> is offset by increased operating costs.<br />
Note 4 Finance charges (net)<br />
2003 2002<br />
»m »m<br />
Bank loans <strong>and</strong> overdrafts 27.8 35.3<br />
Hire purchase <strong>and</strong> leases 4.7 7.6<br />
Other loans 19.5 30.3<br />
Interest receivable (5.4) (7.9)<br />
Net gain on early settlement of debt <strong>and</strong> other financial instruments (13.1) (5.5)<br />
33.5 59.8<br />
Interest receivable includes »Nil (2002 ^ »0.7m) in relation to share of joint venture net interest receivable <strong>and</strong> »1.0m (2002 ^ »1.0m) in<br />
relation to interest receivable on joint venture shareholder loan notes. Interest payable on other loans includes »0.2m (2002 ^ »Nil) in<br />
relation to share of joint venture net interest payable <strong>and</strong> »1.3m (2002 ^ »2.0m) in relation to share of associates’ net interest payable.<br />
48
Notes to the <strong>account</strong>s 2003<br />
Note 5 (Loss)/<strong>profit</strong> on ordinary activities before taxation<br />
(Loss)/<strong>profit</strong> on ordinary activities before taxation is stated after charging/(crediting): 2003 2002<br />
»m »m<br />
Materials <strong>and</strong> consumables 208.9 215.8<br />
Depreciation <strong>and</strong> amounts written off<br />
^ Tangible fixed assets (owned) 87.3 95.1<br />
^ Tangible fixed assets (on HP or lease) 18.0 17.6<br />
^ Impairment <strong>loss</strong>es 162.7 9.7<br />
Amortisation of goodwill<br />
^ Subsidiaries 28.6 41.7<br />
^ Joint venture <strong>and</strong> associates 9.0 8.8<br />
Impairment of Coach USA goodwill 386.8 Nil<br />
Losses/(gains) on property disposals 0.5 (0.5)<br />
Losses on other asset disposals 2.7 0.1<br />
Operating lease rentals<br />
^ PSVs <strong>and</strong> rolling stock 95.9 93.4<br />
^ Network Rail charges 101.5 103.4<br />
^ L<strong>and</strong> <strong>and</strong> buildings 10.1 10.2<br />
Auditors’ remuneration ^ audit (<strong>Group</strong>)<br />
^ Andersen Nil 0.3<br />
^ PricewaterhouseCoopers 0.7 0.5<br />
Auditors’ remuneration ^ audit (Company)<br />
^ PricewaterhouseCoopers ^ ^<br />
Payments for non-audit services of »0.2m (2002 ^ »0.3m) were made to PricewaterhouseCoopers in the UK during the year. Payments for<br />
non-audit services of »0.4m were made to Andersen in year ended 30 April 2002 while auditors of the Company.<br />
The following items have been treated as exceptional: 2003 2002<br />
»m »m<br />
Provision for <strong>loss</strong>es on operations to be terminated or sold at Coach USA (7.7) (9.9)<br />
Impairment of tangible fixed assets at Coach USA (162.7) (9.7)<br />
Write-down of current assets to net realisable value at Coach USA (17.8) Nil<br />
Impairment of goodwill at Coach USA (386.8) Nil<br />
Profit on disposal of overseas operations Nil 4.8<br />
(Loss)/<strong>profit</strong> on sale of properties (0.5) 0.5<br />
(575.5) (14.3)<br />
Tax effect of exceptional items Nil 5.6<br />
(575.5) (8.7)<br />
Management undertook a review of its North American business, Coach USA, in the six months to 31 October 2002. The outcome of this review<br />
resulted in a significant change to the <strong>Group</strong>’s North American strategy, further details of which are given in the Chief Executive’s Review.<br />
As at 30 April 2002, the <strong>Group</strong> undertook an impairment review of Coach USA. The Directors concluded that at that time, no impairment<br />
write-down was required but announced that a review of Coach USA’s business would be undertaken. The recovery in revenues for the six<br />
months ended 31 October 2002 was less than expected <strong>and</strong> trading conditions in North America continued to be difficult. As a result of<br />
the change in strategy for Coach USA <strong>and</strong> the absence of a significant recovery in revenues, the <strong>Group</strong> undertook a further review of the<br />
carrying value of Coach USA’s assets as at 31 October 2002. The commercial assumptions used in reviewing the carrying value of Coach<br />
USA at that time are consistent with the current strategic plans for that business.<br />
The carrying values of current assets within Coach USA were also reviewed to ensure those were properly valued. Appropriate write-downs<br />
were recorded in the six months ended 31 October 2002. These write-downs included adjustments to the carrying value of taxicab<br />
inventory <strong>and</strong> receivables, where the realisable value had fallen reflecting market conditions at that time.<br />
The remaining goodwill <strong>and</strong> tangible fixed assets of Coach USA were reviewed for impairment. In accordance with FRS 11, ‘‘Impairment of<br />
fixed assets <strong>and</strong> goodwill’’, Coach USA was divided into appropriate ‘‘Income Generating Units’’ or ‘‘IGUs’’. The carrying value of each IGU<br />
as at 31 October 2002 was compared to its estimated recoverable amount, being the higher of its value in use <strong>and</strong> net realisable value to<br />
the <strong>Group</strong>. The value in use of each IGU was derived from discounted cash flow projections that covered the period to 30 April 2007. After<br />
30 April 2007, the projections used a long-term growth rate compatible with projections for the US economy. The average discount rate<br />
used to arrive at the value in use was 13.0% on a pre-tax basis. The remaining tangible fixed assets <strong>and</strong> goodwill of each IGU are being<br />
amortised over their estimated useful economic lives, which in the case of goodwill is 16.25 years from 30 April 2003.<br />
49
Notes to the <strong>account</strong>s 2003<br />
Note 5 (Loss)/<strong>profit</strong> on ordinary activities before taxation (continued)<br />
The <strong>Group</strong> closed a number of businesses in the USA as a consequence of the review. Specific provision has been made for <strong>loss</strong>es<br />
associated with the closure of these businesses over <strong>and</strong> above the write-down of asset values described above. These additional <strong>loss</strong>es<br />
include employee redundancy payments, operating lease termination payments <strong>and</strong> professional fees directly attributable to the closures.<br />
To the extent the written-down values as at 31 October 2002 were based on projected cash flows, the actual cash flows for the six<br />
months ended 30 April 2003 have been compared to the projections. Actual cash flows were not significantly different to those projected.<br />
The aggregate exceptional charges across all of the IGUs were as follows:<br />
Year ended<br />
30 April 2003<br />
»m<br />
Provision for <strong>loss</strong>es on operations to be terminated (7.7)<br />
Write-down of current assets to net realisable value (17.8)<br />
Impairment of tangible fixed assets (162.7)<br />
Impairment of goodwill (386.8)<br />
(575.0)<br />
The residual written down values of Coach USA’s net assets as at 30 April 2003 were as follows:<br />
As at<br />
30 April 2003<br />
»m<br />
Goodwill 108.0<br />
Tangible fixed assets 231.0<br />
Net current liabilities (8.5)<br />
Net assets before debt <strong>and</strong> tax balances 330.5<br />
Net assets for Coach USA included in note 2(d) totalled »323.2m. This includes net tax liabilities of »7.3m excluded above.<br />
Details of disposals of fixed asset investments in the year are given in note 13.<br />
Note 6 Staff costs <strong>and</strong> employees 2003 2002<br />
»m »m<br />
Staff costs<br />
Wages <strong>and</strong> salaries 788.8 774.6<br />
Social security costs 60.6 61.3<br />
Other pension costs (note 26d) 31.2 18.0<br />
ESOP provided for 0.2 1.8<br />
880.8 855.7<br />
2003 2002<br />
»m »m<br />
Summary directors’ remuneration<br />
Aggregate emoluments 1.8 1.8<br />
Compensation for <strong>loss</strong> of office 0.5 Nil<br />
Sums paid to third parties for directors’ services 0.2 0.1<br />
2.5 1.9<br />
Further information on directors’ remuneration, share options, incentive schemes <strong>and</strong> pensions is contained in the Remuneration report on<br />
pages 30 to 34.<br />
The average monthly number of persons employed by the <strong>Group</strong> during the year (including executive directors) was as follows:<br />
2003 2002<br />
number number<br />
UK operations 21,292 20,856<br />
UK administration <strong>and</strong> supervisory 1,945 1,884<br />
Overseas 15,639 16,043<br />
38,876 38,783<br />
50
Notes to the <strong>account</strong>s 2003<br />
Note 7 Taxation on (<strong>loss</strong>)/<strong>profit</strong> on ordinary activities<br />
(a) Analysis of charge in the year 2003 2002<br />
Performance Goodwill <strong>and</strong> Results Performance Goodwill <strong>and</strong> Results<br />
pre goodwill exceptional for year pre goodwill exceptional for year<br />
<strong>and</strong> exceptionals items <strong>and</strong> exceptionals items<br />
»m »m »m »m »m »m<br />
Current tax:<br />
UK corporation tax at 30% (2002 ^ 30%) 24.7 Nil 24.7 12.6 Nil 12.6<br />
Share of joint ventures’ current tax 2.4 Nil 2.4 0.2 Nil 0.2<br />
Share of associates’ current tax 0.3 Nil 0.3 3.1 Nil 3.1<br />
Foreign tax (current year) 3.2 Nil 3.2 2.8 Nil 2.8<br />
Foreign tax (adjustments in respect of prior periods) (3.6) Nil (3.6) (0.3) Nil (0.3)<br />
Total current tax 27.0 Nil 27.0 18.4 Nil 18.4<br />
Deferred tax:<br />
Origination <strong>and</strong> reversal of timing differences (0.2) (3.8) (4.0) 7.4 (9.2) (1.8)<br />
Adjustments in respect of prior periods 2.0 Nil 2.0 (1.6) Nil (1.6)<br />
Total deferred tax 1.8 (3.8) (2.0) 5.8 (9.2) (3.4)<br />
Tax on (<strong>loss</strong>)/<strong>profit</strong> on ordinary activities 28.8 (3.8) 25.0 24.2 (9.2) 15.0<br />
(b) Factors affecting tax charge for the year 2003 2002<br />
»m »m<br />
(Loss)/<strong>profit</strong> on ordinary activities before tax (500.2) 42.0<br />
(Loss)/<strong>profit</strong> on ordinary activities multiplied by st<strong>and</strong>ard rate of corporation tax in the UK of 30% (150.1) 12.6<br />
Effects of:<br />
Goodwill amortisation 7.7 11.6<br />
Impairment <strong>loss</strong> 172.5 Nil<br />
Non-deductible expenditure 4.4 0.7<br />
Capital allowances for period in excess of depreciation (4.3) (7.1)<br />
Losses not utilised (2.1) 4.1<br />
Movement in general provisions <strong>and</strong> other short term timing differences 5.6 2.8<br />
Foreign taxes differences (3.1) (4.8)<br />
Adjustments to tax charge in respect of prior periods (3.6) (1.5)<br />
Current tax charge for the year (note 7(a)) 27.0 18.4<br />
(c) Factors that may affect future tax charges<br />
No provision has been made for deferred tax on rolled over gains. The total amount unprovided for is »3.3m (2002 ^ »3.3m).<br />
No deferred tax is recognised on the unremitted earnings of overseas subsidiaries, associates <strong>and</strong> joint ventures unless a binding agreement<br />
exists at the balance sheet date to remit such earnings in the future.<br />
Deferred tax assets in respect of corporation tax <strong>loss</strong>es carried forward within UK companies are provided against where the recoverability<br />
is in doubt.<br />
51
Notes to the <strong>account</strong>s 2003<br />
Note 8 Dividends 2003 2002<br />
»m »m<br />
Ordinary shares ^ interim paid (0.8 pence (2002 ^ 1.3 pence) per share) 10.6 17.1<br />
^ final proposed (1.8 pence (2002 ^ 1.3 pence) per share) 23.7 17.0<br />
34.3 34.1<br />
During the year, a share alternative was offered in respect of the interim dividend of 0.8 pence per share. The cash cost to the Company is<br />
unaffected but the cash is used by the Company’s registrars to acquire shares to be provided to shareholders as an alternative to the cash<br />
dividend. The alternative comprised ordinary shares with a market value of 36.13 pence per existing ordinary share. A similar arrangement<br />
applied to last year’s final dividend of 1.3 pence per share, the relevant market value being 22.00 pence per existing ordinary share.<br />
Note 9 (Loss)/earnings per share<br />
(Loss)/earnings per share have been calculated in accordance with FRS 14 ‘‘Earnings per Share’’ by calculating <strong>Group</strong> (<strong>loss</strong>)/<strong>profit</strong> on<br />
ordinary activities after tax, divided by the weighted average number of shares in issue during the year based on the following:<br />
2003 2002<br />
(Loss)/ Weighted (Loss)/ (Loss)/ Weighted (Loss)/<br />
earnings average no. earnings earnings average no. earnings<br />
of shares per share of shares per share<br />
»m million pence »m million pence<br />
Basic (525.2) 1,314.4 (40.0) 27.0 1,309.9 2.1<br />
Adjusted (pre goodwill <strong>and</strong> exceptional items) 84.1 1,314.4 6.4 82.6 1,309.9 6.3<br />
Dilutive shares ^ Executive Share Option Scheme ^ 2.3 Nil ^ 0.1 Nil<br />
^ Employee SAYE Scheme ^ Nil Nil ^ 0.2 Nil<br />
Diluted excluding goodwill <strong>and</strong> exceptional items 84.1 1,316.7 6.4 82.6 1,310.2 6.3<br />
Include goodwill <strong>and</strong> exceptional items (55.6) ^ (4.2)<br />
Diluted 27.0 1,310.2 2.1<br />
(Loss)/earnings per share before goodwill <strong>and</strong> exceptional items is calculated after adding back goodwill amortisation <strong>and</strong> exceptional items<br />
after taking <strong>account</strong> of taxation, as shown on the consolidated <strong>profit</strong> <strong>and</strong> <strong>loss</strong> <strong>account</strong> on page 36. This has been presented to allow<br />
shareholders to gain a clearer underst<strong>and</strong>ing of the underlying performance.<br />
In accordance with FRS 14, share options are only treated as dilutive in the calculation of diluted earnings per share if their exercise would<br />
result in the issue of ordinary shares at less than fair value. Potential ordinary shares are only treated as dilutive where the effect is to<br />
reduce earnings per share or increase <strong>loss</strong> per share. Accordingly, the basic <strong>loss</strong> per share for 2003 has not been adjusted for the dilutive<br />
shares as the effect would be to reduce the <strong>loss</strong> per share.<br />
52
Notes to the <strong>account</strong>s 2003<br />
Note 10 Profit <strong>and</strong> <strong>loss</strong> <strong>account</strong><br />
The movement on <strong>profit</strong> <strong>and</strong> <strong>loss</strong> <strong>account</strong> reserve is: <strong>Group</strong> Company<br />
2003 2002 2003 2002<br />
»m »m »m »m<br />
Retained <strong>profit</strong> brought forward 514.8 128.7 670.1 342.4<br />
Retained <strong>loss</strong> for the year (559.5) (7.1) (612.6) (72.3)<br />
Translation adjustment (26.6) (5.5) Nil Nil<br />
UK tax effect of translation adjustment (6.4) (4.8) Nil Nil<br />
Share of other recognised gains <strong>and</strong> <strong>loss</strong>es of associates (0.1) (0.2) Nil Nil<br />
Goodwill previously written off to reserves 0.5 3.7 Nil Nil<br />
Transfer from share premium/other reserve Nil 400.0 Nil 400.0<br />
Retained (<strong>loss</strong>)/<strong>profit</strong> carried forward (77.3) 514.8 57.5 670.1<br />
Note 11 Intangible assets ^ goodwill<br />
The <strong>Group</strong> movement in the year is: Joint ventures Associates Subsidiaries Total<br />
»m »m »m »m<br />
Cost<br />
Beginning of year 110.5 5.5 1,198.7 1,314.7<br />
Additions Nil 0.5 2.8 3.3<br />
Disposals Nil Nil (2.0) (2.0)<br />
Translation adjustment Nil Nil (100.2) (100.2)<br />
End of year 110.5 6.0 1,099.3 1,215.8<br />
Amortisation<br />
Beginning of year (29.1) (4.3) (533.3) (566.7)<br />
Charge for the year (8.7) (0.3) (28.6) (37.6)<br />
Impairment <strong>loss</strong>es Nil Nil (386.8) (386.8)<br />
Disposals Nil Nil 2.0 2.0<br />
Translation adjustment Nil Nil 54.3 54.3<br />
End of the year (37.8) (4.6) (892.4) (934.8)<br />
Net book value beginning of year 81.4 1.2 665.4 748.0<br />
Net book value end of year 72.7 1.4 206.9 281.0<br />
Goodwill arising during the year <strong>and</strong> the amortisation periods are as follows: Amortisation period Goodwill additions<br />
Years »m<br />
Subsidiaries<br />
North American acquisitions 20 1.5<br />
UK Bus goodwill acquired 5 0.8<br />
Adjustments re prior year acquisitions 20 0.5<br />
Associates 10 0.5<br />
3.3<br />
53
Notes to the <strong>account</strong>s 2003<br />
Note 12 Tangible fixed assets<br />
The following are included in the net book value of tangible fixed assets:<br />
<strong>Group</strong><br />
Company<br />
2003 2002 2003 2002<br />
»m »m »m »m<br />
L<strong>and</strong> <strong>and</strong> buildings 160.6 176.9 3.4 3.4<br />
PSVs <strong>and</strong> other assets 691.0 932.0 4.4 5.1<br />
851.6 1,108.9 7.8 8.5<br />
The <strong>Group</strong> movement in the year is: L<strong>and</strong> <strong>and</strong> PSVs <strong>and</strong> Total<br />
buildings other assets<br />
»m »m »m<br />
Cost<br />
Beginning of year 185.0 1,558.2 1,743.2<br />
Additions 19.5 51.6 71.1<br />
New subsidiary undertakings Nil 2.0 2.0<br />
Disposals (7.4) (53.0) (60.4)<br />
Sale/closure of subsidiary undertakings (2.9) (5.9) (8.8)<br />
Translation adjustment (6.7) (64.5) (71.2)<br />
End of year 187.5 1,488.4 1,675.9<br />
Depreciation<br />
Beginning of year (8.1) (626.2) (634.3)<br />
Charge (6.8) (98.5) (105.3)<br />
Impairment <strong>loss</strong>es (17.2) (145.5) (162.7)<br />
Disposals 3.0 42.0 45.0<br />
Sale/closure of subsidiary undertakings 0.5 3.2 3.7<br />
Translation adjustment 1.7 27.6 29.3<br />
End of year (26.9) (797.4) (824.3)<br />
Net book value, beginning of year 176.9 932.0 1,108.9<br />
Net book value, end of year 160.6 691.0 851.6<br />
Included in the above are:<br />
Assets on hire purchase Nil 162.5 162.5<br />
Leased PSV assets Nil 7.9 7.9<br />
Short leasehold l<strong>and</strong> <strong>and</strong> buildings 1.9 Nil 1.9<br />
Long leasehold l<strong>and</strong> <strong>and</strong> buildings 27.4 Nil 27.4<br />
Heritable <strong>and</strong> freehold l<strong>and</strong> amounting to »33.0m (2002 ^ »33.0m) has not been depreciated.<br />
Depreciation of »18.0m (2002 ^ »17.6m) has been charged in the year in respect of assets held under hire purchase or finance lease<br />
agreements.<br />
54
Notes to the <strong>account</strong>s 2003<br />
Note 12 Tangible fixed assets (continued)<br />
The Company movement during the year was as follows: L<strong>and</strong> <strong>and</strong> PSVs <strong>and</strong> Total<br />
buildings other assets*<br />
»m »m »m<br />
Cost<br />
Beginning of year 3.6 6.4 10.0<br />
Additions Nil 0.5 0.5<br />
Disposals Nil (0.5) (0.5)<br />
End of year 3.6 6.4 10.0<br />
Depreciation<br />
Beginning of year (0.2) (1.3) (1.5)<br />
Charge Nil (0.9) (0.9)<br />
Disposals Nil 0.2 0.2<br />
End of year (0.2) (2.0) (2.2)<br />
Net book value, beginning of year 3.4 5.1 8.5<br />
Net book value, end of year 3.4 4.4 7.8<br />
* PSVs <strong>and</strong> other assets include »4.1m (2002 ^ »4.7m) of information technology in progress not yet allocated to <strong>Group</strong> operating companies.<br />
Note 13 Fixed asset investments<br />
The <strong>Group</strong> movement during the year was as follows: Joint ventures Associates Other Total<br />
investments<br />
»m »m »m »m<br />
Cost<br />
Beginning of year 159.8 158.7 3.7 322.2<br />
Additions 0.3 1.0 0.1 1.4<br />
Share of recognised <strong>profit</strong>s 6.3 8.1 Nil 14.4<br />
Share of other recognised gains <strong>and</strong> <strong>loss</strong>es Nil (0.1) Nil (0.1)<br />
Translation adjustment Nil (6.2) Nil (6.2)<br />
Dividends received Nil (5.3) Nil (5.3)<br />
End of year 166.4 156.2 3.8 326.4<br />
Amounts written off<br />
Beginning of year (29.1) (85.9) (0.5) (115.5)<br />
Amounts written off during year Nil Nil (0.6) (0.6)<br />
Goodwill amortised during year (8.7) (0.3) Nil (9.0)<br />
End of year (37.8) (86.2) (1.1) (125.1)<br />
Net book value, beginning of year 130.7 72.8 3.2 206.7<br />
Net book value, end of year 128.6 70.0 2.7 201.3<br />
The <strong>Group</strong>’s share of the net assets of joint venture companies included above is analysed below:<br />
Virgin Rail Other joint 2003 2002<br />
<strong>Group</strong> Holdings venture Total Total<br />
Limited companies<br />
»m »m »m »m<br />
Fixed assets 8.3 Nil 8.3 3.5<br />
Current assets 158.5 0.7 159.2 133.2<br />
Creditors: Amounts falling due within one year (114.3) (0.9) (115.2) (90.8)<br />
Creditors: Amounts falling due after more than one year (6.1) (0.7) (6.8) (6.6)<br />
Share of net assets/(liabilities) 46.4 (0.9) 45.5 39.3<br />
Goodwill 71.9 0.8 72.7 81.4<br />
Shareholder loan notes 10.0 0.4 10.4 10.0<br />
128.3 0.3 128.6 130.7<br />
In addition to amounts shown above, the <strong>Group</strong> has a share of net liabilities in thetrainline.com, as shown in note 21.<br />
55
Notes to the <strong>account</strong>s 2003<br />
Note 13 Fixed asset investments (continued)<br />
The principal associate is: Country of Number of Nominal value of % held at<br />
operation shares in issue share capital 30 April 2003<br />
at 30 April 2003<br />
in issue<br />
at 30 April 2003<br />
Road King Infrastructure Limited<br />
China<br />
^ ordinary shares 515.6m HK$51.6m 25.2<br />
^ preference shares 0.4m HK$0.04m 100.0<br />
The market value of the <strong>Group</strong>’s ordinary share investment in Road King Infrastructure Limited, a Bermudan incorporated company, listed<br />
on the Hong Kong Stock Exchange, at 30 April 2003 was HK$480.2m (»38.5m) (2002 ^ HK$392.6m (»34.5m)). In February 2002, the <strong>Group</strong><br />
converted 100,000 of its 518,380 7.5% HK$1,000 convertible preference shares in Road King Infrastructure Limited to ordinary shares. The<br />
remaining 418,380 preference shares were converted on 12 June 2003 which resulted in us having a 31.2% interest in Road King’s ordinary<br />
shares. The equivalent market value of the <strong>Group</strong>’s ordinary share investment in Road King post-conversion of the preference shares would<br />
be HK$661.1m (»53.0m). This calculation uses the market value of Road King’s shares at 30 April 2003 <strong>and</strong> the exchange rate prevailing at<br />
that date. The coupon received on the preference shares has been included in the share of associates’ operating <strong>profit</strong>s. The <strong>Group</strong>’s share of<br />
operating <strong>profit</strong> is based on the most recent publicly available information, being the results for the year ended 31 December 2002.<br />
The carrying value of the <strong>Group</strong>’s interest in Road King Infrastructure Limited as at 30 April 2003 was »62.0m.<br />
The principal joint ventures are: Country of Number of Nominal value of % held at<br />
incorporation/ shares in issue share capital 30 April 2003<br />
operation at 30 April 2003 in issue<br />
at 30 April 2003<br />
Virgin Rail <strong>Group</strong> Holdings Limited United Kingdom 34.8m »3.5m 49<br />
Trainline Holdings Limited United Kingdom 3.4m »3.4m 49<br />
Virgin Rail <strong>Group</strong> Holdings Limited is the holding company of Virgin Rail <strong>Group</strong> Limited, which in turn is the holding company of<br />
CrossCountry Trains Limited <strong>and</strong> West Coast Trains Limited. Trainline Holdings Limited is the holding company of thetrainline.com Limited.<br />
The Virgin Rail <strong>Group</strong> Holdings <strong>and</strong> Trainline Holdings shareholders’ agreements provide for joint decision making on key matters <strong>and</strong> equal<br />
representation on the Boards of both companies. As a consequence the investments have been <strong>account</strong>ed for as joint ventures. As part of<br />
the original acquisition, the <strong>Group</strong> acquired a »20m shareholder loan to Virgin Rail <strong>Group</strong> Limited, now a subsidiary of Virgin Rail <strong>Group</strong><br />
Holdings Limited. The shareholder loan carries a 10% coupon <strong>and</strong> »10m was repaid on 28 April 2000.<br />
Virgin Rail <strong>Group</strong> Limited is restricted from paying dividends until any shareholders loans payable by it have been repaid. Under an<br />
agreement with the UK’s Strategic Rail Authority (‘‘SRA’’), Virgin Rail <strong>Group</strong> Limited, CrossCountry Trains Limited <strong>and</strong> West Coast Trains<br />
Limited may not pay dividends prior to 1 March 2004.<br />
As at 30 April 2002, the <strong>Group</strong> undertook an impairment review of its investment in Virgin Rail <strong>Group</strong> in accordance with FRS 11. The<br />
directors concluded, at that time, no impairment write-down was required. However, for each of the five years following the initial<br />
impairment review, the <strong>Group</strong> is required to review its initial projections in light of the actual cash flows. The <strong>Group</strong> has therefore<br />
reviewed the projections made in connection with the 30 April 2002 impairment review. This indicated that the actual net cash flows<br />
earned by the <strong>Group</strong> from its investment in Virgin Rail <strong>Group</strong> during the year ended 30 April 2003 were in line with those projected.<br />
Virgin Rail <strong>Group</strong>’s two train franchises are presently operating with subsidy from the SRA on the basis of a one-year budget set by the<br />
SRA. The value of the <strong>Group</strong>’s investment in Virgin Rail <strong>Group</strong> depends on the agreement of long-term commercial arrangements with the<br />
SRA for the operation of Virgin Rail <strong>Group</strong>’s two franchises. Virgin Rail <strong>Group</strong> has not yet agreed terms for the long-term operation of the<br />
franchises <strong>and</strong> it is not known with certainty when these arrangements will be agreed. In addition, Virgin Rail <strong>Group</strong> continues to be<br />
significantly impacted by the performance of Network Rail. Network Rail is contractually responsible for upgrading certain railway<br />
infrastructure, on which the future revenue growth of Virgin Rail <strong>Group</strong>’s train operations is dependent.<br />
The directors believe that these uncertainties give rise to a need to undertake a fresh impairment review as at 30 April 2003.<br />
In accordance with FRS 11, we have compared the carrying value of our net investment in Virgin Rail <strong>Group</strong>, with its estimated recoverable<br />
amount, being the higher of net realisable value <strong>and</strong> value in use.<br />
The <strong>Group</strong> has conducted this fresh review with reference to the terms agreed between Virgin Rail <strong>Group</strong> <strong>and</strong> the SRA on 19 July 2002 for<br />
the future operation of the two franchises. There remains uncertainty over the timing of agreeing new long-term commercial arrangements<br />
for each franchise <strong>and</strong> also around the level of shareholder return that will be achievable under such arrangements. The SRA has the right<br />
to offer the CrossCountry franchise for competitive tender <strong>and</strong> this presents a further uncertainty. However, to date, the SRA has not<br />
indicated that it intends to exercise this right. In conducting the impairment review as at 30 April 2003, the directors have made best<br />
estimates of future cash flows to the expected end of the two franchises in 2012 after taking <strong>account</strong> of these factors. Any estimation of<br />
value in use is subjective because it is based on estimates of future cash flows. Actual results can differ from those assumed <strong>and</strong> there can<br />
be no absolute assurance that the assumptions used will hold true.<br />
56
Notes to the <strong>account</strong>s 2003<br />
Note 13 Fixed asset investments (continued)<br />
This review indicates that there is no impairment <strong>loss</strong>. The value in use of Virgin Rail <strong>Group</strong> was determined using an average pre-tax<br />
discount rate of 11.4%. However, the directors will keep this matter under review in the light of changing circumstances.<br />
The remaining goodwill relating to the original acquisition of Virgin Rail <strong>Group</strong> is being amortised over its remaining useful life of 8.8 years<br />
from 30 April 2003.<br />
The Company movement during the year was as follows: Subsidiary Joint Other Total<br />
undertakings ventures investments<br />
»m »m »m »m<br />
Cost<br />
Beginning of year 235.5 139.4 0.8 375.7<br />
Additions 1,359.0 Nil Nil 1,359.0<br />
Disposals (213.1) (137.6) Nil (350.7)<br />
Translation gain (1.2) Nil Nil (1.2)<br />
End of year 1,380.2 1.8 0.8 1,382.8<br />
Amounts written off<br />
Beginning of year (1.8) Nil Nil (1.8)<br />
During the year (737.8) Nil Nil (737.8)<br />
End of year (739.6) Nil Nil (739.6)<br />
Net book value, beginning of year 233.7 139.4 0.8 373.9<br />
Net book value, end of year 640.6 1.8 0.8 643.2<br />
Subsidiary undertaking additions total »1,359.0m due to intercompany receivables being converted into investments <strong>and</strong> also increased<br />
investment in a subsidiary following the sale of certain of the Company’s investments <strong>and</strong> intercompany receivables to this subsidiary.<br />
Acquisitions<br />
During the year a further three acquisitions have been concluded by Coach USA for a total consideration of »2.8m in cash. The fair value<br />
of the net assets acquired was »1.3m giving rise to goodwill of »1.5m which has been capitalised <strong>and</strong> is being amortised over 20 years.<br />
UK businesses were acquired for a total consideration of »2.3m, paid in cash. The fair value of the net assets acquired was »2.3m giving<br />
rise to no goodwill.<br />
These acquisitions are not considered to be individually or collectively material for the purposes of FRS 7, ‘‘Fair Values in Acquisition<br />
Accounting’’. The aggregate fair value of the assets acquired is as follows:<br />
Coach USA UK Total<br />
Fair value to <strong>Group</strong> »m »m »m<br />
Tangible fixed assets 1.8 0.2 2.0<br />
Other current assets 0.1 2.1 2.2<br />
Total assets 1.9 2.3 4.2<br />
Creditors ^ within one year (0.6) Nil (0.6)<br />
Total liabilities (0.6) Nil (0.6)<br />
Net assets 1.3 2.3 3.6<br />
Consideration 2.8 2.3 5.1<br />
Goodwill 1.5 Nil 1.5<br />
Disposal of subsidiary undertakings <strong>and</strong> businesses<br />
The <strong>Group</strong> disposed of <strong>and</strong> closed a number of businesses within Coach USA during the year. A provision of »7.7m for the <strong>loss</strong>es on the<br />
operations to be sold or terminated was recorded as at 31 October 2002. (See note 21).<br />
57
Notes to the <strong>account</strong>s 2003<br />
Note 13 Fixed asset investments (continued)<br />
The net assets disposed of were as follows: Coach Other Total<br />
USA Overseas<br />
»m »m »m<br />
Tangible fixed assets 3.6 1.5 5.1<br />
Other current assets 0.7 0.1 0.8<br />
Net assets disposed 4.3 1.6 5.9<br />
Provisions for <strong>loss</strong>es on operations to be sold or terminated (7.7) Nil (7.7)<br />
Unutilised provision as at 30 April 2003 4.6 Nil 4.6<br />
Closure costs 4.1 Nil 4.1<br />
Goodwill previously written off to reserves Nil 0.5 0.5<br />
Proceeds on disposal 5.3 2.1 7.4<br />
Satisfied by:<br />
Cash 4.9 2.1 7.0<br />
Deferred consideration 0.4 Nil 0.4<br />
Net cash inflows in respect of the disposals comprised:<br />
Cash consideration 4.9 2.1 7.0<br />
Cash at bank <strong>and</strong> in h<strong>and</strong> on disposal Nil Nil Nil<br />
4.9 2.1 7.0<br />
Note 14 Principal business units<br />
The principal subsidiary undertakings (ordinary shares 100% owned except where shown) are:<br />
Company Country of registration or incorporation Principal activity<br />
<strong>Stagecoach</strong> (South) Ltd* Engl<strong>and</strong> Bus <strong>and</strong> coach operator<br />
<strong>Stagecoach</strong> (North West) Ltd* Engl<strong>and</strong> Bus <strong>and</strong> coach operator<br />
East Midl<strong>and</strong> Motor Services Ltd* Engl<strong>and</strong> Bus <strong>and</strong> coach operator<br />
<strong>Stagecoach</strong> Scotl<strong>and</strong> Ltd* Scotl<strong>and</strong> Bus <strong>and</strong> coach operator<br />
National Transport Tokens Ltd (99.9%)* Engl<strong>and</strong> Transport tokens<br />
East Kent Road Car Company Ltd* Engl<strong>and</strong> Bus <strong>and</strong> coach operator<br />
<strong>Stagecoach</strong> West Ltd* Engl<strong>and</strong> Bus <strong>and</strong> coach operator<br />
PSV Claims Bureau Ltd* Engl<strong>and</strong> Claims h<strong>and</strong>ling<br />
Busways Travel Services Ltd* Engl<strong>and</strong> Bus <strong>and</strong> coach operator<br />
South East London <strong>and</strong> Kent Bus Co Ltd* Engl<strong>and</strong> Bus <strong>and</strong> coach operator<br />
East London Bus <strong>and</strong> Coach Co Ltd* Engl<strong>and</strong> Bus <strong>and</strong> coach operator<br />
Clevel<strong>and</strong> Transit Ltd* Engl<strong>and</strong> Bus <strong>and</strong> coach operator<br />
Cambus Ltd* Engl<strong>and</strong> Bus <strong>and</strong> coach operator<br />
<strong>Stagecoach</strong> Devon Ltd* Engl<strong>and</strong> Bus <strong>and</strong> coach operator<br />
Greater Manchester Buses South Ltd* Engl<strong>and</strong> Bus <strong>and</strong> coach operator<br />
South West Trains Ltd Engl<strong>and</strong> Train operating company<br />
Isl<strong>and</strong> Line Ltd* Engl<strong>and</strong> Train operating company<br />
South Yorkshire Supertram Ltd* Engl<strong>and</strong> Tram operator<br />
Wellington City Transport Ltd* New Zeal<strong>and</strong> Bus <strong>and</strong> coach operator<br />
Transportation Auckl<strong>and</strong> Corporation Limited* New Zeal<strong>and</strong> Bus <strong>and</strong> coach operator<br />
Fullers <strong>Group</strong> Limited (96%)* New Zeal<strong>and</strong> Ferry operator<br />
SGC (HK <strong>Group</strong>) Limited (formerly Citybus <strong>Group</strong> Limited)* Hong Kong Bus <strong>and</strong> coach operator<br />
Coach USA Inc.* United States Bus <strong>and</strong> coach operator<br />
*indirectly held<br />
All companies operate in the countries shown above. The companies listed above include all those which principally affect the results <strong>and</strong><br />
assets of the <strong>Group</strong>. A full list of subsidiary undertakings at 30 April 2003 will be annexed to the next annual return.<br />
58
Notes to the <strong>account</strong>s 2003<br />
Note 15 Stocks <strong>Group</strong> Company<br />
2003 2002 2003 2002<br />
»m »m »m »m<br />
Parts <strong>and</strong> consumables 19.1 19.1 Nil Nil<br />
Taxicabs held for resale 19.0 31.8 Nil Nil<br />
38.1 50.9 Nil Nil<br />
There is no material difference between the carrying value of stocks held at 30 April 2003 <strong>and</strong> their estimated replacement cost.<br />
Note 16 Debtors <strong>and</strong> prepaid charges<br />
Amounts falling due within one year are: <strong>Group</strong> Company<br />
2003 2002 2003 2002<br />
»m »m »m »m<br />
Trade debtors 91.0 107.7 0.3 0.2<br />
Other debtors 30.3 36.2 13.7 13.0<br />
Other prepayments <strong>and</strong> accrued income 62.6 73.2 1.2 0.9<br />
VAT <strong>and</strong> other government debtors 8.4 11.4 6.3 8.2<br />
192.3 228.5 21.5 22.3<br />
Amounts falling due after more than one year are: <strong>Group</strong> Company<br />
2003 2002 2003 2002<br />
»m »m »m »m<br />
Pension scheme prepayment (note 26d) 35.2 33.8 Nil 13.9<br />
Amounts owed by group companies Nil Nil 550.6 1,643.0<br />
Pre-contract costs 1.8 4.4 Nil Nil<br />
Other debtors 22.9 16.0 Nil Nil<br />
Deferred tax asset (note 21) Nil Nil 1.2 Nil<br />
59.9 54.2 551.8 1,656.9<br />
Note 17 Creditors<br />
(a) Creditors: Amounts falling due within one year <strong>Group</strong> Company<br />
2003 2002 2003 2002<br />
»m »m »m »m<br />
Bank overdrafts Nil Nil 59.6 17.7<br />
Bank loans <strong>and</strong> loan notes 58.9 76.7 46.8 54.8<br />
Trade creditors 95.5 110.3 0.9 1.2<br />
Accruals <strong>and</strong> deferred income 230.3 242.8 42.3 52.5<br />
Dividends payable 23.7 17.0 23.7 17.0<br />
Other creditors<br />
^ UK corporation tax payable 44.9 20.2 9.1 7.8<br />
^ Foreign tax payable 4.0 6.1 Nil Nil<br />
^ PAYE <strong>and</strong> NIC payable 12.1 10.2 0.2 0.2<br />
Current portion of hire purchase <strong>and</strong> lease obligations 34.8 40.7 Nil Nil<br />
Amounts due to group companies Nil Nil 28.0 26.0<br />
504.2 524.0 210.6 177.2<br />
59
Notes to the <strong>account</strong>s 2003<br />
Note 17 Creditors (continued)<br />
(b) Creditors: Amounts falling due after more than one year <strong>Group</strong> Company<br />
2003 2002 2003 2002<br />
»m »m »m »m<br />
Bank loans <strong>and</strong> loan notes 181.1 237.3 129.2 190.7<br />
US Dollar 8.625% Notes (note 17c) 208.9 259.3 227.6 342.0<br />
US Dollar 9.375% Notes (note 17d) Nil 0.1 Nil Nil<br />
Euro 6% Notes (note 17e) 195.2 244.7 195.2 244.7<br />
Non-current portion of hire purchase <strong>and</strong> lease obligations 45.8 65.8 Nil Nil<br />
Deferred income 9.7 Nil Nil Nil<br />
Other creditors Nil 0.9 Nil Nil<br />
Amounts due to group companies Nil Nil 11.4 34.6<br />
640.7 808.1 563.4 812.0<br />
(c) US Dollar 8.625% Notes<br />
On 9 November 1999 the <strong>Group</strong> issued US$500m of 8.625% Notes due in 2009. Interest on the Notes is payable six monthly in arrears.<br />
Unless previously redeemed or purchased <strong>and</strong> cancelled, the Notes will be redeemed at their principal amount on 15 November 2009.<br />
During the year US$45.0m (2002 ^ US$71.5m) of the Notes were purchased by the <strong>Group</strong>. US$135.9m (2002 ^ Nil) of the Notes<br />
purchased have been cancelled. The cumulative par value of Notes repurchased was US$165.9m as at 30 April 2003 (2002 ^ US$120.9m).<br />
The Notes were issued at 99.852% of their principal amount. The consolidated carrying value of the Notes at 30 April 2003 was »208.9m<br />
(2002 ^ »259.3m), after taking <strong>account</strong> of the notes purchased by the <strong>Group</strong>, the discount on issue, <strong>and</strong> issue costs.<br />
(d) US Dollar 9.375% Notes<br />
In June 1997, Coach USA, Inc. issued $150m 9.375% senior subordinated notes due in 2007. Following the acquisition of Coach USA, Inc.<br />
by the <strong>Group</strong> in July 1999 a tender offer for all the outst<strong>and</strong>ing notes was made at a price of 101% of principal. $0.2m of notes were<br />
tendered <strong>and</strong> redeemed at this time. On 18 November 1999 a tender <strong>and</strong> consent offer was made for all the outst<strong>and</strong>ing notes.<br />
On 17 December 1999 $146.4m of notes were tendered <strong>and</strong> redeemed. Following the tender the terms of the notes were amended to<br />
remove amongst other clauses, restrictive covenants <strong>and</strong> events of default. $0.1m of these notes remain outst<strong>and</strong>ing.<br />
The remaining notes were redeemed at the option of the Company at a premium of 104.7% on 1 July 2002.<br />
(e) Euro 6% Notes<br />
On 24 November 1999 the <strong>Group</strong> issued e400m of 6% Notes due in 2004. Interest on the Notes is payable annually in arrears. Unless<br />
previously redeemed or purchased <strong>and</strong> cancelled, the Notes will be redeemed at their principal amount on 24 November 2004.<br />
During the year e48.6m (2002 ^ e42.6m) of the Notes were purchased by the <strong>Group</strong> <strong>and</strong> cancelled. The cumulative par value of Notes<br />
repurchased <strong>and</strong> cancelled was e99.2m as at 30 April 2003 (2002 ^ e50.6m).<br />
The Notes were issued at 99.937% of their principal amount. The <strong>Group</strong> has effectively swapped the carrying value into US Dollars <strong>and</strong><br />
Sterling with a currency swap. After taking <strong>account</strong> of the notes repurchased <strong>and</strong> cancelled, the discount on issue, issue costs <strong>and</strong> the<br />
currency swap, the carrying value of the Notes at 30 April 2003 was »195.2m (2002 ^ »244.7m).<br />
60
Notes to the <strong>account</strong>s 2003<br />
Note 17 Creditors (continued)<br />
(f) Borrowings are repayable as follows <strong>Group</strong> Company<br />
2003 2002 2003 2002<br />
»m »m »m »m<br />
On dem<strong>and</strong> or within 1 year<br />
Bank overdraft Nil Nil 59.6 17.7<br />
Bank loans <strong>and</strong> loan notes 58.9 76.7 46.8 54.8<br />
Hire purchase <strong>and</strong> lease obligations 34.8 40.7 Nil Nil<br />
Within 1-2 years<br />
Bank loans <strong>and</strong> loan notes 130.6 25.2 118.3 8.0<br />
Euro 6% Notes 195.2 Nil 195.2 Nil<br />
Hire purchase <strong>and</strong> lease obligations 23.3 32.8 Nil Nil<br />
Within 2-5 years<br />
Bank loans <strong>and</strong> loan notes 49.5 207.4 10.9 182.7<br />
Euro 6% Notes Nil 244.7 Nil 244.7<br />
US Dollar 9.375% Notes Nil Nil Nil Nil<br />
Hire purchase <strong>and</strong> lease obligations 22.2 32.0 Nil Nil<br />
Over 5 years<br />
Bank loans <strong>and</strong> loan notes 1.0 4.7 Nil Nil<br />
US Dollar 8.625% Notes 208.9 259.3 227.6 342.0<br />
US Dollar 9.375% Notes Nil 0.1 Nil Nil<br />
Hire purchase <strong>and</strong> lease obligations 0.3 1.0 Nil Nil<br />
Total borrowings 724.7 924.6 658.4 849.9<br />
Less current maturities (93.7) (117.4) (106.4) (72.5)<br />
Long term portion of borrowings 631.0 807.2 552.0 777.4<br />
Interest terms on UK borrowings (except loan notes) are at annual rates between 0.4% <strong>and</strong> 1.625% over Bank of Scotl<strong>and</strong> base rate or<br />
equivalent LIBOR rates. Interest terms on overseas borrowings are at annual rates between 1.9% <strong>and</strong> 8.4% <strong>and</strong> are based on applicable<br />
local market borrowing rates. Interest on loan notes are at three months LIBOR or fixed interest. Loan notes amounting to »39.5m<br />
(2002 ^ »46.8m) are backed by guarantees provided under group banking facilities.<br />
The loan notes have been classified by reference to the earliest date on which the loan note holders can request redemptions.<br />
UK Bank loans, overdrafts, Euro Notes <strong>and</strong> US$ Notes are unsecured.<br />
Note 18 Derivatives <strong>and</strong> other financial instruments<br />
Treasury policy <strong>and</strong> the use of financial instruments are both discussed in the Finance Director’s review on pages 19 to 21.<br />
Short term debtors <strong>and</strong> creditors have been excluded from the disclosures below except for 18(c) on currency exposures.<br />
(a) Interest rate <strong>and</strong> currency profile of financial liabilities<br />
The interest rate profile of the financial liabilities of the <strong>Group</strong> on which interest is paid at 30 April 2003 was as follows:<br />
Floating rate Fixed rate Total Weighted average Weighted average<br />
fixed interest period for which<br />
rate<br />
rate is fixed<br />
Currency »m »m »m % Years<br />
Sterling 255.2 Nil 255.2 n/a n/a<br />
US Dollar 167.2 245.7 412.9 7.7 1.5<br />
Hong Kong Dollar 49.4 Nil 49.4 n/a n/a<br />
New Zeal<strong>and</strong> <strong>and</strong> Australian Dollar 0.7 Nil 0.7 n/a n/a<br />
Other 6.5 Nil 6.5 n/a n/a<br />
Gross Borrowings 479.0 245.7 724.7 7.7 1.5<br />
The figures shown in the above table take into <strong>account</strong> various interest rate <strong>and</strong> currency swaps used to manage the interest rate <strong>and</strong><br />
currency profile of borrowings.<br />
61
Notes to the <strong>account</strong>s 2003<br />
Note 18 Derivatives <strong>and</strong> other financial instruments (continued)<br />
As at 30 April 2003 floating rate Sterling borrowings of »50m (2002 ^ »125m) were hedged with a collar with an average cap rate of 8.5%<br />
<strong>and</strong> an average floor of 4.5%. The cap was not exercised during the year to 30 April 2003, the floor was exercised on »50m at an average<br />
rate of 4.5%.<br />
The floating rate financial liabilities bear interest at rates fixed in advance for periods ranging from one to three months based on market<br />
rates outlined in note 17.<br />
Financial liabilities on which no interest is paid comprise certain provisions totalling »106.6m (2002 ^ »91.6m). These are denominated in<br />
Sterling »54.1m (2002 ^ »49.9m), US dollars »46.8m (2002 ^ »36.1m) <strong>and</strong> Hong Kong dollars »5.7m (2002 ^ »5.6m). The weighted<br />
average maturity of these liabilities is 1.9 years (2002 ^ 2.1 years).<br />
The <strong>Group</strong>’s policies on managing interest rate risk <strong>and</strong> currency risk are explained in the Finance Director’s review on pages<br />
19 to 21.<br />
The interest rate profile of the financial liabilities of the <strong>Group</strong> on which interest is paid at 30 April 2002 was as follows:<br />
Floating rate Fixed rate Total Weighted average Weighted average<br />
fixed interest period for which<br />
rate<br />
rate is fixed<br />
Currency »m »m »m % Years<br />
Sterling 169.0 9.6 178.6 7.6 0.5<br />
US Dollar 353.1 318.8 671.9 7.3 2.2<br />
Hong Kong Dollar 58.2 Nil 58.2 n/a n/a<br />
New Zeal<strong>and</strong> <strong>and</strong> Australian Dollar 1.9 0.9 2.8 5.8 1.3<br />
Other 13.1 Nil 13.1 n/a n/a<br />
Gross borrowings 595.3 329.3 924.6 7.3 2.2<br />
The maturity profile of the <strong>Group</strong>’s financial liabilities at 30 April 2003 was as follows: 2003 2002<br />
»m »m<br />
Expiring within one year 136.8 155.7<br />
Expiring in more than one year but less than two years 371.0 76.9<br />
Expiring in more than two years but less than five years 88.4 516.0<br />
Expiring beyond five years 235.1 267.6<br />
831.3 1,016.2<br />
Represented by:<br />
Gross borrowings 724.7 924.6<br />
Financial liabilities on which no interest is paid<br />
^ insurance provisions 80.2 65.2<br />
^ token provisions 26.4 25.5<br />
^ other creditors Nil 0.9<br />
831.3 1,016.2<br />
(b) Interest rate <strong>and</strong> currency profile of financial assets<br />
The <strong>Group</strong>’s financial assets on which floating interest is receivable comprise cash deposits <strong>and</strong> cash in h<strong>and</strong> of »164.7m (2002 ^ »150.0m).<br />
The cash deposits comprise deposits placed on money market at call, seven day <strong>and</strong> monthly rates. The currency analysis is as follows:<br />
Floating rate<br />
2003 2002<br />
Currency »m »m<br />
Sterling 98.0 119.1<br />
US Dollar 58.7 20.8<br />
Hong Kong Dollar 5.0 4.6<br />
New Zeal<strong>and</strong> <strong>and</strong> Australian Dollar 2.3 2.0<br />
Other 0.7 3.5<br />
Cash at bank <strong>and</strong> in h<strong>and</strong> 164.7 150.0<br />
62
Notes to the <strong>account</strong>s 2003<br />
Note 18 Derivatives <strong>and</strong> other financial instruments (continued)<br />
Financial assets on which no interest is receivable total »4.2m (2002 ^ »4.7m) <strong>and</strong> comprise other investments of »2.7m (2002 ^ »3.2m)<br />
<strong>and</strong> other debtors greater than one year of »1.5m (2002 ^ »1.5m). These assets are denominated in Sterling »0.9m (2002 ^ »1.1m), US<br />
dollars »1.2m (2002 ^ »1.7m) <strong>and</strong> others »2.1m (2002 ^ »1.9m). The weighted average period to maturity of other debtors greater than<br />
one year is 1.5 years (2002 ^ 1.5 years). Financial assets on which fixed interest is receivable total »6.5m (2002 ^ »21.5m) <strong>and</strong> comprise<br />
US$ denominated loan notes receivable. They have a weighted average interest rate of 13.0% (2002 ^ 12.9%) <strong>and</strong> an average maturity of<br />
2.7 years (2002 ^ 2.5 years).<br />
(c) Currency exposures<br />
As explained in the Finance Director’s review on pages 19 to 21, the <strong>Group</strong>’s objective in managing currency borrowings <strong>and</strong> net exposures<br />
arising from its investments in net assets of overseas subsidiaries is to maintain a low cost of borrowing <strong>and</strong> to retain some potential for<br />
currency related appreciation whilst partially hedging against currency depreciation. All foreign currency borrowings are taken out to<br />
provide for or to hedge against foreign net investments. Gains <strong>and</strong> <strong>loss</strong>es arising from these currency borrowings <strong>and</strong> net exposures are<br />
recognised in the statement of total recognised gains <strong>and</strong> <strong>loss</strong>es.<br />
The <strong>Group</strong> generally hedges actual <strong>and</strong> forecast foreign exchange transactional exposures up to one year forward. At 30 April 2003 <strong>and</strong><br />
30 April 2002 there were no material net transactional exposures.<br />
(d) Borrowing facilities<br />
At 30 April 2003 the <strong>Group</strong> had the following undrawn committed banking <strong>and</strong> hire purchase facilities:<br />
2003 2002<br />
»m »m<br />
Expiring within one year 59.2 28.9<br />
Expiring in more than one year but no more than two years 207.9 Nil<br />
Expiring beyond two years 44.4 282.6<br />
311.5 311.5<br />
Note 19 Fair values<br />
Set out below is a comparison of fair <strong>and</strong> book values of all the <strong>Group</strong>’s financial instruments by category. Where available, market values<br />
have been used to determine fair values. Where market values are not available, fair values have been calculated by discounting future cash<br />
flows at prevailing interest <strong>and</strong> exchange rates.<br />
2003 2002<br />
Book value Fair value Book value Fair value<br />
»m »m »m »m<br />
Other financial assets 10.7 10.7 26.2 26.2<br />
Primary financial instruments to finance the <strong>Group</strong>’s operation<br />
Cash deposits <strong>and</strong> bank overdrafts 164.7 164.7 150.0 150.0<br />
US Dollar 8.625% Notes (208.9) (216.4) (259.3) (247.2)<br />
Euro 6% Notes (210.4) (210.0) (215.8) (203.1)<br />
Foreign currency swaps hedging currency debt 15.2 25.4 (28.9) (25.6)<br />
Short term borrowings <strong>and</strong> current portion of long term debt (93.7) (93.7) (117.4) (117.4)<br />
Other long term borrowings (226.9) (226.9) (303.2) (303.2)<br />
Derivative financial instruments held to manage the interest<br />
rate, currency <strong>and</strong> commodity risk profiles<br />
Interest rate swaps <strong>and</strong> similar instruments Nil 15.5 Nil (0.2)<br />
Forward foreign currency contracts <strong>and</strong> swaps hedging<br />
overseas investments 0.7 (0.9) (5.3) (5.9)<br />
Fuel price swaps <strong>and</strong> options Nil 1.4 Nil 1.5<br />
Other financial liabilities (106.6) (106.6) (91.6) (91.6)<br />
63
Notes to the <strong>account</strong>s 2003<br />
Note 20 Hedge <strong>account</strong>ing 2003 2002<br />
Gains Losses Total Gains Losses Total<br />
»m »m »m »m »m »m<br />
Unrecognised gains or <strong>loss</strong>es on hedges at<br />
start of year 35.5 (31.5) 4.0 26.5 (81.0) (54.5)<br />
Gains or <strong>loss</strong>es arising in previous years that were<br />
recognised in the year 22.3 0.3 22.6 7.6 55.4 63.0<br />
Gains or <strong>loss</strong>es arising in previous years that were<br />
not recognised in the year 57.8 (31.2) 26.6 34.1 (25.6) 8.5<br />
Gains or <strong>loss</strong>es arising in the year that were<br />
not recognised in the year 1.2 (2.3) (1.1) 1.4 (5.9) (4.5)<br />
Unrecognised gains or <strong>loss</strong>es on hedges at end of year 59.0 (33.5) 25.5 35.5 (31.5) 4.0<br />
Of which:<br />
Gains or <strong>loss</strong>es expected to be recognised within<br />
one year 19.4 (16.9) 2.5 11.1 (13.5) (2.4)<br />
Gains or <strong>loss</strong>es expected to be recognised after<br />
one year 39.6 (16.6) 23.0 24.4 (18.0) 6.4<br />
59.0 (33.5) 25.5 35.5 (31.5) 4.0<br />
As explained in the Finance Director’s review on pages 19 to 21, the <strong>Group</strong>’s policy is to hedge against interest rate risk, currency risk <strong>and</strong><br />
commodity price risk.<br />
Gains <strong>and</strong> <strong>loss</strong>es on instruments used for hedging are not recognised until the exposure that is being hedged is itself recognised.<br />
Note 21 Provisions for liabilities <strong>and</strong> charges <strong>Group</strong> Company<br />
2003 2002 2003 2002<br />
»m »m »m »m<br />
Deferred taxation 104.8 105.3 Nil 3.6<br />
Token redemption provision 26.4 25.5 Nil Nil<br />
Insurance provisions 80.2 65.2 Nil Nil<br />
Environmental provisions 2.4 2.9 0.8 1.2<br />
Pension provision (note 26d) 11.8 6.1 2.8 3.2<br />
Restructuring provision 4.6 1.7 Nil Nil<br />
230.2 206.7 3.6 8.0<br />
Joint ventures<br />
^ share of gross assets (5.3) (5.1) Nil Nil<br />
^ share of gross liabilities 27.9 21.8 Nil Nil<br />
22.6 16.7 Nil Nil<br />
Total provisions 252.8 223.4 3.6 8.0<br />
The token redemption provision relates to tokens issued to third parties to be redeemed as payment for transportation services.<br />
The insurance provisions relate to insurance reserves on incurred accidents up to 30 April in each year where claims have not been settled.<br />
These are based on actuarial reviews <strong>and</strong> prior claims history.<br />
The environmental provisions relate to legal or constructive obligations to undertake environmental work, such as an obligation to rectify<br />
l<strong>and</strong> which has been contaminated by fuel tanks or to eliminate the presence of asbestos. The provision is based on the estimated cost of<br />
undertaking the work required.<br />
The pension provision relates to unfunded liabilities established by actuarial review <strong>and</strong> SSAP 24 pension liabilities.<br />
The restructuring provision relates to the estimated costs of completing the sale or closure of operations at Coach USA, where an<br />
obligation exists at the balance sheet date.<br />
Share of joint venture’s net liabilities relates to the <strong>Group</strong>’s interest in the consolidated net liabilities of Trainline Holdings Limited.<br />
64
Notes to the <strong>account</strong>s 2003<br />
Note 21 Provisions for liabilities <strong>and</strong> charges (continued)<br />
The <strong>Group</strong> movement during the year was as follows:<br />
Deferred Token Insurance Environmental Pension Restructuring Share of<br />
taxation redemption provisions provisions provisions provision joint venture’s<br />
provision<br />
net liabilities<br />
»m »m »m »m »m »m »m<br />
Beginning of year 105.3 25.5 65.2 2.9 6.1 1.7 16.7<br />
^ (credited)/provided during year (2.0) Nil 38.4 0.2 12.8 7.7 5.9<br />
^ less deferred tax charge in <strong>profit</strong> <strong>and</strong><br />
<strong>loss</strong> <strong>account</strong> re associates/joint ventures 0.3 Nil Nil Nil Nil Nil Nil<br />
Utilised in the year Nil Nil (19.4) (0.7) (7.1) (4.6) Nil<br />
Arising on sale of tokens during year Nil 13.2 Nil Nil Nil Nil Nil<br />
Redemption of tokens Nil (12.3) Nil Nil Nil Nil Nil<br />
Translation differences 1.2 Nil (4.0) Nil Nil (0.2) Nil<br />
End of year 104.8 26.4 80.2 2.4 11.8 4.6 22.6<br />
The Company movement during the year was as follows: Deferred Environmental Pension<br />
taxation provisions provisions<br />
»m »m »m<br />
Beginning of year 3.6 1.2 3.2<br />
(Credited)/provided during year (4.8) Nil 0.5<br />
Payments in year Nil (0.4) (0.9)<br />
End of year (1.2) 0.8 2.8<br />
Deferred taxation is calculated as follows: <strong>Group</strong> Company<br />
2003 2002 2003 2002<br />
»m »m »m »m<br />
Accelerated capital allowances 193.6 198.2 0.5 0.9<br />
Pension timing differences 7.0 8.4 (0.8) 3.1<br />
Timing differences related to overseas retained earnings Nil 0.1 Nil Nil<br />
Short term timing differences (95.8) (101.4) (0.9) (0.4)<br />
104.8 105.3 (1.2) 3.6<br />
Note 22 Equity share capital<br />
2003 2002<br />
»m »m<br />
Authorised<br />
1,840,000,000 (2002 ^ 1,840,000,000) ordinary shares of 0.5p each 9.2 9.2<br />
Allotted, called-up <strong>and</strong> fully-paid<br />
1,320,946,012 (2002 ^ 1,320,946,012) ordinary shares of 0.5p each 6.6 6.6<br />
There were no movements in issued share capital during the year ended 30 April 2003.<br />
In October 1999 the Company established a Qualifying Employee Share Ownership Trust (‘‘QUEST’’) for the purpose of satisfying share<br />
option schemes for staff. During the year to 30 April 2000 a contribution of »10.5m <strong>and</strong> a loan of »10.0m were made to the QUEST <strong>and</strong><br />
used by the QUEST to apply for 11,500,000 new ordinary shares of 0.5p each at the market price of »1.78 per share on 29 October 1999.<br />
Under the provisions of FRS 5 ‘‘Reporting the Substance of Transactions’’, the assets <strong>and</strong> liabilities of the QUEST are recognised as assets<br />
<strong>and</strong> liabilities of the <strong>Group</strong> <strong>and</strong> the QUEST is consolidated in the <strong>Group</strong> <strong>account</strong>s. Balances <strong>and</strong> transactions between the QUEST <strong>and</strong> other<br />
<strong>Group</strong> entities are eliminated on consolidation. Since the shares have not been issued outside of the <strong>Group</strong>, the only effect of the above<br />
transaction was to increase share capital by »0.1m. The 11,500,000 shares are to be used to satisfy the valid exercise of options granted<br />
under the <strong>Stagecoach</strong> savings related share option schemes.<br />
Between 29 October 1999 <strong>and</strong> 30 April 2002 1,769,336 shares were transferred to option holders. During the year to 30 April 2003,<br />
a further 4,829,012 shares were transferred to option holders. The remaining 4,901,652 shares are held by the QUEST. At 30 April 2003<br />
the market valuation of shares held was »2.2m.<br />
65
Notes to the <strong>account</strong>s 2003<br />
Note 23 Share option schemes<br />
(a) Savings related share option schemes<br />
The Company has two Inl<strong>and</strong> Revenue approved savings related share option schemes. The schemes are based on eligible employees being<br />
granted options <strong>and</strong> them agreeing to open a sharesave <strong>account</strong> with the Nationwide Building Society <strong>and</strong>/or Halifax plc <strong>and</strong> to save<br />
weekly or monthly for a fixed period. The right to exercise the option is at the employee’s discretion within six months following the end<br />
of the fixed period.<br />
Scheme Date of issue Exercise price Duration<br />
B 1 April 1998 129.1p 5 years<br />
C 1 April 2002 60.0p 3 years<br />
The changes in the number of participating employees <strong>and</strong> options over ordinary shares were as follows:<br />
Scheme B<br />
Scheme C<br />
Number of Ordinary Number of Ordinary<br />
employees shares employees shares<br />
Beginning of year 1,725 3,847,359 4,414 15,654,052<br />
Options lapsed 1,263 2,530,468 834 3,300,599<br />
End of year 462 1,316,891 3,580 12,353,453<br />
(b) Executive share options<br />
Award date Number of At 1 May Granted Lapsed At 30 April Exercise Date from Expiry date<br />
executives 2002 2003 price » which<br />
& directors<br />
exercisable<br />
9 September 1994 1 53,296 Nil Nil 53,296 0.3030 9 September 1997 9 September 2004<br />
13 October 1995 3 339,353 Nil Nil 339,353 0.4820 13 October 1998 13 October 2005<br />
11 October 1996 9 1,332,276 Nil Nil 1,332,276 1.0900 11 October 1999 11 October 2006<br />
8 September 1997 9 558,569 Nil Nil 558,569 1.2810 8 September 2000 8 September 2004<br />
8 September 1997 2 41,472 Nil Nil 41,472 1.2810 8 September 2000 8 September 2007<br />
8 September 1997 3 725,754 Nil Nil 725,754 1.2810 8 September 2002 8 September 2004<br />
19 October 1998 21 392,506 Nil 63,753 328,753 2.2280 19 October 2001 19 October 2005<br />
19 October 1998 3 738,874 Nil Nil 738,874 2.2280 19 October 2003 19 October 2005<br />
1 February 1999 1 27,130 Nil Nil 27,130 2.5060 1 February 2002 1 February 2006<br />
16 June 1999 3 145,755 Nil Nil 145,755 2.1140 16 June 2004 16 June 2006<br />
19 July 1999 26 672,557 Nil 33,797 638,760 2.0310 19 July 2002 19 July 2006<br />
1 October 1999 1 78,050 Nil Nil 78,050 0.0050 1 October 2002 1 October 2006<br />
15 June 2000 72 7,402,661 Nil 692,497 6,710,164 0.6250 15 June 2003 15 June 2007<br />
15 June 2000 2 1,822,301 Nil Nil 1,822,301 0.6250 15 June 2005 15 June 2007<br />
20 June 2001 77 6,752,925 Nil 286,850 6,466,075 0.7075 20 June 2004 20 June 2008<br />
23 July 2001 1 828,300 Nil 828,300 Nil 0.7625 23 July 2004 23 July 2008<br />
23 July 2002 99 Nil 22,497,813 200,000 22,297,813 0.3750 23 July 2005 23 July 2009<br />
5 December 2002 39 Nil 15,835,032 Nil 15,835,032 0.2700 5 December 2005 5 December 2009<br />
Totals 21,911,779 38,332,845 2,105,197 58,139,427<br />
The expiry dates shown above are based on the original share option agreements. As explained in the Remuneration report on pages 30 to<br />
34, certain former directors of the Company hold share options where the expiry date is earlier than the original expiry date due to the<br />
directors no longer being employed by the <strong>Group</strong>.<br />
All options were granted for nil consideration. The mid-market price for these shares at 30 April 2003 was »0.44. The Company’s shares<br />
traded in the range »0.125 to »0.805 during the year to that date.<br />
66
Notes to the <strong>account</strong>s 2003<br />
Note 24 Reserves<br />
<strong>Group</strong><br />
Company<br />
2003 2002 2003 2002<br />
»m »m »m »m<br />
Profit <strong>and</strong> <strong>loss</strong> <strong>account</strong> (note 10) (77.3) 514.8 57.5 670.1<br />
Share premium <strong>account</strong> 386.1 384.4 386.1 384.4<br />
ESOP distribution reserve Nil 1.6 Nil 1.6<br />
Capital redemption reserve 1.7 1.7 1.7 1.7<br />
Other than the Company’s <strong>profit</strong> <strong>and</strong> <strong>loss</strong> <strong>account</strong> balance of »57.5m, none of the above reserves as at 30 April 2003 are regarded as<br />
distributable.<br />
(Loss)/<strong>profit</strong> for the financial year comprises: 2003 2002<br />
»m »m<br />
Company (578.3) (38.1)<br />
Subsidiary undertakings, joint ventures <strong>and</strong> associates 53.1 65.1<br />
(525.2) 27.0<br />
The movement in the <strong>profit</strong> <strong>and</strong> <strong>loss</strong> <strong>account</strong> is given in note 10. The movement on other reserves is as follows:<br />
<strong>Group</strong> <strong>and</strong> <strong>Group</strong> <strong>and</strong> <strong>Group</strong> <strong>and</strong><br />
company: company: company:<br />
share ESOP capital<br />
premium distribution redemption<br />
reserve<br />
reserve<br />
»m »m »m<br />
Beginning of year 384.4 1.6 1.7<br />
Arising on shares issued by QUEST 1.7 Nil Nil<br />
ESOP distributed during year Nil (1.8) Nil<br />
ESOP provided during year Nil 0.2 Nil<br />
End of year 386.1 Nil 1.7<br />
The ESOP distribution reserve represents the amount to be subscribed in connection with the approved <strong>profit</strong> sharing scheme (following an<br />
equivalent contribution by <strong>Group</strong> companies) in respect of the issue of new shares to eligible employees.<br />
Cumulative goodwill of »113.8m (2002 ^ »114.3m) has been written off against reserves in periods prior to the adoption of FRS 10<br />
‘‘Goodwill <strong>and</strong> Intangible Assets’’.<br />
67
Notes to the <strong>account</strong>s 2003<br />
Note 25 <strong>Consolidated</strong> cash flows<br />
(a) Reconciliation of operating (<strong>loss</strong>)/<strong>profit</strong> to net cash flow from operating activities 2003 2002<br />
»m »m<br />
Operating (<strong>loss</strong>)/<strong>profit</strong> of <strong>Group</strong> companies (469.8) 86.8<br />
Depreciation 105.3 112.7<br />
Impairment of tangible fixed assets at Coach USA 162.7 9.7<br />
Impairment of goodwill at Coach USA 386.8 Nil<br />
Loss on sale of tangible fixed assets, other than properties 2.7 0.1<br />
Goodwill amortisation 28.6 41.7<br />
Provision for <strong>loss</strong>es on operations to be terminated or sold 7.7 9.9<br />
Decrease/(increase) in stocks 11.7 (3.1)<br />
Decrease/(increase) in debtors 13.6 (6.6)<br />
ESOP provided for 0.2 1.8<br />
Decrease in creditors (1.7) (4.1)<br />
Increase in provisions 24.4 8.0<br />
Net cash inflow from operating activities 272.2 256.9<br />
(b) Reconciliation of net cash flow to movement in net debt 2003 2002<br />
»m »m<br />
(Decrease)/increase in cash (12.7) 28.5<br />
Bond repayments 40.0 77.7<br />
Cash flow from decrease/(increase) in debt <strong>and</strong> lease financing 95.3 (17.3)<br />
122.6 88.9<br />
Loans <strong>and</strong> finance leases of acquired/disposed subsidiaries Nil 0.5<br />
Other movements 59.9 (40.1)<br />
Movement in cash collateral 32.1 (38.2)<br />
Decrease in net debt 214.6 11.1<br />
Opening net debt (774.6) (785.7)<br />
Closing net debt (560.0) (774.6)<br />
(c) Analysis of net debt<br />
Opening Cash flows Cash Other Closing<br />
collateral movements<br />
»m »m »m »m »m<br />
Cash 107.5 (12.7) Nil (4.7) 90.1<br />
Cash collateral 42.5 38.9 (6.8) Nil 74.6<br />
Hire purchase <strong>and</strong> lease obligations (106.5) 44.4 Nil (18.5) (80.6)<br />
Bank loans <strong>and</strong> loan stock (314.0) 44.1 6.8 23.1 (240.0)<br />
Bonds (504.1) 40.0 Nil 60.0 (404.1)<br />
Totals (774.6) 154.7 Nil 59.9 (560.0)<br />
The net total of cash <strong>and</strong> cash collateral of »164.7m (2002 ^ »150.0m) is classified in the balance sheet as »164.7m (2002 ^ »150.0m) in cash<br />
at bank <strong>and</strong> in h<strong>and</strong>.<br />
(d) Restricted cash<br />
The cash collateral balance as at 30 April 2003 of »74.6m (2002 ^ »42.5m) comprises balances held in trust in respect of loan notes of<br />
»34.3m (2002 ^ »41.1m) <strong>and</strong> Coach USA letter of credit cash <strong>and</strong> insurance collateral cash of »40.3m (2002 ^ »1.4m). In addition, cash<br />
includes train operating company cash of »42.9m (2002 ^ »56.4m). Under the terms of the franchise agreements, train operating<br />
companies can only distribute cash out of retained <strong>profit</strong>s.<br />
68
Notes to the <strong>account</strong>s 2003<br />
Note 25 <strong>Consolidated</strong> cash flows (continued)<br />
(e) Purchase of subsidiary undertakings Coach USA UK Total<br />
»m »m »m<br />
Net assets acquired at fair value (see note 13) 1.3 2.3 3.6<br />
Goodwill 1.5 Nil 1.5<br />
2.8 2.3 5.1<br />
Consideration<br />
Cash <strong>and</strong> acquisition expenses paid in year 2.8 Nil 2.8<br />
Deferred consideration Nil 2.3 2.3<br />
2.8 2.3 5.1<br />
The cash paid during the year in respect of the purchase of subsidiary undertakings was as follows: »m<br />
Cash paid in respect of acquisitions in year (see above) 2.8<br />
Deferred consideration in respect of Coach USA acquisitions 7.3<br />
Companies acquired in the year did not have a material impact on cash flows.<br />
10.1<br />
(f) Disposal of subsidiaries <strong>and</strong> other businesses<br />
Details of net assets disposed of <strong>and</strong> the related sales proceeds are set out in note 13.<br />
Companies disposed of in the year did not have a material impact on cash flows.<br />
Note 26 Guarantees <strong>and</strong> other financial commitments<br />
(a) Guarantees<br />
The Company is a party to bank guarantees in respect of guarantees, loans, overdrafts <strong>and</strong> other facilities provided to certain <strong>Group</strong><br />
undertakings of which »81.0m was outst<strong>and</strong>ing at 30 April 2003 (2002 ^ »75.7m) <strong>and</strong> provides cross-guarantees to certain subsidiary<br />
undertakings under VAT group provisions.<br />
(b) Capital commitments<br />
Capital commitments are as follows: <strong>Group</strong> Company<br />
2003 2002 2003 2002<br />
»m »m »m »m<br />
Contracted for but not provided<br />
For delivery in one year 50.5 73.1 16.8 11.8<br />
At 30 April 2003, »32.6m of the total capital commitments relates to overseas operations (30 April 2002 ^ »55.6m).<br />
69
Notes to the <strong>account</strong>s 2003<br />
Note 26 Guarantees <strong>and</strong> other financial commitments (continued)<br />
(c) Operating lease <strong>and</strong> similar commitments<br />
The annual commitments due under non-cancellable operating leases are as follows: 2003 2002<br />
»m »m<br />
Under one year 80.3 77.9<br />
Between one year <strong>and</strong> five years 152.4 134.0<br />
Five years <strong>and</strong> over 3.3 74.4<br />
South West Trains Limited has contracts with Network Rail for access to the railway infrastructure (track, stations <strong>and</strong> depots) for the<br />
period until February 2007. South West Trains Limited also has contracts which commit it to lease rolling stock from Angel Trains<br />
Contracts Ltd, HSBC Rail (UK) Ltd <strong>and</strong> Porterbrook Leasing Limited.<br />
(d) Pension commitments<br />
(i) Summary of schemes operated<br />
The <strong>Group</strong> contributes to a number of pension schemes. The principal defined benefit occupational benefit schemes are as follows:<br />
* The South West Trains section of the Railways Pension Scheme (‘‘RPS’’);<br />
* The Isl<strong>and</strong> Line section of the Railways Pension Scheme (‘‘RPS’’);<br />
* The <strong>Stagecoach</strong> <strong>Group</strong> Pension Scheme (‘‘SGPS’’);<br />
* A number of UK Local Government Pension Schemes (‘‘LGPS’’).<br />
These defined benefit schemes cover the majority of the <strong>Group</strong>’s UK employees. These schemes are devised in accordance with local<br />
employment terms <strong>and</strong> conditions. Each scheme is administered independently of the employers <strong>and</strong> the scheme assets are held in trusts<br />
that are managed by investment managers appointed by the schemes’ trustees.<br />
In addition, the <strong>Group</strong> contributes to a number of defined contribution schemes covering non-UK employees.<br />
(ii) Accounting for pensions under SSAP 24<br />
The <strong>Group</strong> has applied SSAP24, ‘‘Accounting for pension costs’’ in preparing its <strong>account</strong>s. The total pension cost reported in the <strong>profit</strong> <strong>and</strong><br />
<strong>loss</strong> <strong>account</strong> <strong>and</strong> the cash outflow to the <strong>Group</strong> in the year ended 30 April 2003 can be analysed as follows:<br />
Pension cost<br />
Cash outflow<br />
2003 2002 2003 2002<br />
»m »m »m »m<br />
UK Bus/<strong>Group</strong> overheads<br />
^ SGPS 14.0 12.4 15.5 15.0<br />
^ LGPS 2.7 1.9 3.0 2.4<br />
^ Other 0.8 0.2 0.9 Nil<br />
Rail<br />
^ RPS 12.1 1.8 5.9 0.4<br />
Coach USA 1.6 1.7 1.6 1.7<br />
31.2 18.0 26.9 19.5<br />
The balance sheet position of each scheme as at 30 April 2003 is analysed below. It should be noted that the balance sheet position under<br />
SSAP 24 that is shown on page 71 is not equivalent to an actuarial estimate of the scheme’s funding position at the balance sheet date.<br />
The net balance sheet asset of »23.4m (2002 ^ »27.7m) shown below is the sum of the cumulative differences between contributions paid<br />
by the employers into the schemes <strong>and</strong> the charge to the <strong>profit</strong> <strong>and</strong> <strong>loss</strong> <strong>account</strong>.<br />
70
Notes to the <strong>account</strong>s 2003<br />
Note 26 Guarantees <strong>and</strong> other financial commitments (continued)<br />
(d) Pension commitments (continued)<br />
Prepayment Provision Net<br />
2003 2002 2003 2002 2003 2002<br />
UK Bus/<strong>Group</strong> overheads<br />
^ SGPS 20.3 18.8 Nil Nil 20.3 18.8<br />
^ LGPS 14.9 15.0 (0.2) (0.6) 14.7 14.4<br />
^ Other Nil Nil (3.3) (3.4) (3.3) (3.4)<br />
Rail<br />
^ RPS Nil Nil (8.3) (2.1) (8.3) (2.1)<br />
35.2 33.8 (11.8) (6.1) 23.4 27.7<br />
The <strong>account</strong>ing for each of the defined benefit schemes is based on the most recent formal valuation of the relevant scheme, updated<br />
where appropriate to the financial year-end immediately following the date of the valuation. The key details for each scheme are as<br />
follows:<br />
Most recent Latest actuarial Funding Market<br />
full actuarial review for Level value of<br />
valuation of SSAP 24 <strong>account</strong>ing % assets<br />
scheme purposes »m<br />
UK Bus/<strong>Group</strong> overheads<br />
^ SGPS 5 April 2002 30 April 2002 105 325.9<br />
^ LGPS 31 March 2001 30 April 2001 121 186.6<br />
Rail<br />
^ RPS 31 December 2001 31 December 2001 105 225.5<br />
The above defined benefit schemes are funded at contribution rates determined by independent actuaries on the basis of triennial<br />
valuations using the projected unit method. The assumptions that have the most significant effect on the results of valuations are those<br />
relating to the rate of return on investments <strong>and</strong> the rates of increases in earnings <strong>and</strong> pensions. The valuations referred to above for<br />
SSAP 24 <strong>account</strong>ing purposes assume that investment returns, net of management expenses, will exceed earnings growth by an average of<br />
at least 3.5% per annum. Present <strong>and</strong> future pensions are assumed to increase at an average of 2.6% per annum for SGPS <strong>and</strong> 2.5% per<br />
annum for the other defined benefit schemes.<br />
(iii) Accounting for pensions under FRS 17<br />
Under the transitional arrangements for the implementation of Financial Reporting St<strong>and</strong>ard (‘‘FRS’’) 17, ‘‘Retirement Benefits’’, the <strong>Group</strong><br />
continues to <strong>account</strong> for pensions in accordance with SSAP 24 as set out above. The additional disclosures required by FRS 17 are provided<br />
below.<br />
The calculations of FRS 17 disclosures have been based on the most recent actuarial valuations, which have been updated to 30 April 2003<br />
by an independent professionally qualified actuary to take <strong>account</strong> of the requirements of FRS 17.<br />
The main financial assumptions used by the actuary were as follows: 2003 2002<br />
% %<br />
Rate of increase in salaries 4.0 4.0<br />
Rate of increase of pensions in payment<br />
^ SGPS 2.3 2.3<br />
^ Other defined benefit schemes 2.5 2.5<br />
Discount rate 5.5 6.1<br />
Inflation 2.5 2.5<br />
In applying FRS 17, the directors believe that the RPS schemes need to be considered separately. The directors underst<strong>and</strong> that the <strong>Group</strong><br />
has no rights or obligations in respect of the RPS schemes following the expiry of the South West Trains <strong>and</strong> Isl<strong>and</strong> Line franchises.<br />
Furthermore, the franchise payments in respect of the new South West Trains franchise to February 2007 take <strong>account</strong> of the cash cost of<br />
pension scheme funding during the franchise term.<br />
The amounts relating to the RPS schemes are separately highlighted on page 72.<br />
71
Notes to the <strong>account</strong>s 2003<br />
Note 26 Guarantees <strong>and</strong> other financial commitments (continued)<br />
(d) Pension commitments (continued)<br />
The balance sheet amounts as at 30 April 2003 measured in accordance with the requirements of FRS 17 were as follows:<br />
SGPS/Other RPS LGPS Total<br />
2003 2002 2003 2002 2003 2002 2003 2002<br />
»m »m »m »m »m »m »m »m<br />
Total market value of assets 282.3 325.9 183.5 225.7 155.3 180.1 621.1 731.7<br />
Present value of liabilities (449.1) (364.8) (218.2) (213.6) (211.7) (187.4) (879.0) (765.8)<br />
Pension (liability)/asset before tax (166.8) (38.9) (34.7) 12.1 (56.4) (7.3) (257.9) (34.1)<br />
Related deferred tax asset/(liability) 50.1 11.7 10.4 (3.6) 16.9 2.2 77.4 10.3<br />
Net pension (liability)/asset (116.7) (27.2) (24.3) 8.5 (39.5) (5.1) (180.5) (23.8)<br />
The value of the assets in the schemes <strong>and</strong> the expected long-term rate of return as at 30 April were:<br />
Rate of SGPS RPS LGPS Total<br />
return<br />
2003 2002 2003 2002 2003 2002 2003 2002 2003 2002<br />
(%) (%) »m »m »m »m »m »m »m »m<br />
Equities 8.5 8.5 242.9 313.3 173.8 213.5 92.0 112.1 508.7 638.9<br />
Bonds 5.3 5.9 Nil Nil 8.5 11.6 38.3 36.9 46.8 48.5<br />
Other 5.7 6.5 39.4 12.6 1.2 0.6 25.0 31.1 65.6 44.3<br />
282.3 325.9 183.5 225.7 155.3 180.1 621.1 731.7<br />
If FRS 17 had been adopted, the amounts charged/(credited) to the <strong>profit</strong> <strong>and</strong> <strong>loss</strong> <strong>account</strong> would have been as follows:<br />
»m<br />
Charge to operating <strong>profit</strong>s<br />
^ Current service cost 30.9<br />
^ Past service cost<br />
Nil<br />
Finance (income)/cost<br />
^ Expected return on assets (60.7)<br />
^ Interest cost 48.1<br />
30.9<br />
(12.6)<br />
The following amounts would have been included within the <strong>Group</strong> statement of recognised gains <strong>and</strong> <strong>loss</strong>es (STRGL) under FRS 17:<br />
»m<br />
Actual return less expected return on pension scheme assets (185.6)<br />
Experience gains <strong>and</strong> <strong>loss</strong>es arising on the scheme liabilities 38.8<br />
Changes in assumptions underlying the present value of the scheme liabilities (85.6)<br />
Actuarial <strong>loss</strong> reported in STRGL (232.4)<br />
Actuarial <strong>loss</strong> as a percentage of scheme assets <strong>and</strong> liabilities at 30 April 2003 were as follows:<br />
%<br />
Actual return less expected return on pension scheme assets as a percentage of scheme assets (29.9%)<br />
Experience gains <strong>and</strong> <strong>loss</strong>es arising on the scheme liabilities as a percentage of the present value of scheme liabilities 4.4%<br />
Total actuarial <strong>loss</strong> recognised in STRGL as a percentage of the present value of scheme liabilities (26.4%)<br />
72
Notes to the <strong>account</strong>s 2003<br />
Note 26 Guarantees <strong>and</strong> other financial commitments (continued)<br />
(d) Pension commitments (continued)<br />
The movement in deficit during the year under FRS 17 would have been:<br />
»m<br />
Deficit in schemes at the beginning of the year (34.1)<br />
Movement in the year:<br />
Current service cost (30.9)<br />
Contributions 26.9<br />
Other finance income 12.6<br />
Actuarial <strong>loss</strong> (232.4)<br />
Deficit in schemes at the end of the year (257.9)<br />
If FRS 17 had been adopted in these financial statements, the <strong>Group</strong>’s consolidated net assets <strong>and</strong> <strong>profit</strong> <strong>and</strong> <strong>loss</strong> reserve at 30 April 2003<br />
would have been as follows:<br />
Profit <strong>and</strong> <strong>loss</strong> reserve<br />
Net assets<br />
»m »m<br />
As currently stated (77.3) 317.1<br />
Net pension liability on FRS 17 basis (180.5) (180.5)<br />
SSAP 24 net pension asset that will reverse on implementation of FRS 17 (23.4) (23.4)<br />
Deferred tax related to SSAP 24 items 7.0 7.0<br />
Adjustment to net interest in joint ventures (17.8) (17.8)<br />
Net assets on FRS 17 basis (292.0) 102.4<br />
(e) Contingent liabilities<br />
(i) The <strong>Group</strong>’s contingent liability for the full potential amount of deferred taxation on all timing differences is detailed in note 21.<br />
(ii) Certain of the <strong>Group</strong>’s properties are the subject of contractual obligations to pay a share of the open market value to the former<br />
owners but only on the occurrence of certain specified events. The periods of these contractual obligations lapse on various dates up<br />
until 2005. There are no intentions to dispose of any of these properties at 30 April 2003.<br />
(iii) A performance bond backed by an insurance arrangement for »20.9m (2002 ^ »20.9m), a season ticket bond backed by an insurance<br />
arrangement for »31.3m (2002 ^ »28.7) <strong>and</strong> a holding company guarantee of »21.0m (2002 ^ »21.0m) have been provided to the<br />
UK’s Strategic Rail Authority in support of the <strong>Group</strong>’s franchise obligations at South West Trains Limited at 30 April 2003. These<br />
contingent liabilities are not expected to crystallise.<br />
(iv) The <strong>Group</strong> <strong>and</strong> its joint venture have, in the normal course of business, entered into a number of long term supply contracts. The most<br />
significant of these relate to track, station <strong>and</strong> depot access facilities, together with new train lease <strong>and</strong> maintenance arrangements.<br />
(v) Under UK Rail franchise agreements, the <strong>Group</strong> <strong>and</strong> its joint venture have agreed with the UK’s Strategic Rail Authority annual<br />
amounts receivable or payable in respect of the operation of rail franchises for future periods.<br />
Under these agreements, there is a requirement to comply with a number of obligations. Failure to comply with these obligations<br />
would be a breach of the relevant franchise.<br />
(f) Joint venture <strong>and</strong> associates<br />
Our share of commitments <strong>and</strong> contingent liabilities in joint venture <strong>and</strong> associates shown below are based on the latest statutory<br />
<strong>account</strong>s of the relevant companies:<br />
Joint ventures Associates 2003 Total 2002 Total<br />
»m »m »m »m<br />
Annual commitments under non-cancellable operating leases 73.1 0.4 73.5 69.1<br />
Capital commitments 0.5 Nil 0.5 2.2<br />
Franchise performance bonds 14.7 Nil 14.7 14.7<br />
Bank guarantee Nil 2.4 2.4 3.1<br />
Season ticket bond 1.2 Nil 1.2 1.2<br />
Infrastructure investment commitments Nil 0.9 0.9 1.8<br />
73
Notes to the <strong>account</strong>s 2003<br />
Note 26 Guarantees <strong>and</strong> other financial commitments (continued)<br />
(f) Joint venture <strong>and</strong> associates (continued)<br />
On 15 May 2003, West Coast Trains Limited (an indirect subsidiary of Virgin Rail <strong>Group</strong> Holdings Limited, the latter being classified as a<br />
joint venture in these <strong>account</strong>s) initiated legal proceedings against ALSTOM in respect of a claim for liquidated damages <strong>and</strong> certain<br />
additional lease costs arising from the late delivery of ‘‘Pendolino’’ train sets which are being procured from ALSTOM in order to operate<br />
on the West Coast mainline. No <strong>account</strong> of any benefit from this claim has been included in the financial statements of Virgin Rail <strong>Group</strong><br />
Holdings Limited or its subsidiary companies. ALSTOM itself has made claims for extensions of time to West Coast Trains Limited in the<br />
form of notices of potential delay as well as indicating that it is entitled to recover cost overruns. ALSTOM’s counterclaim has not been<br />
fully formulated or particularised <strong>and</strong> it is not yet possible to assess the merits of this counterclaim. On receipt of their formal claim, a<br />
more detailed examination can be undertaken.<br />
Note 27 Related party transactions<br />
Transactions between <strong>Group</strong> companies that are fully eliminated on consolidation are not disclosed as permitted by FRS 8, ‘‘Related Party<br />
Disclosures’’.<br />
Transactions in which directors have had a material interest are disclosed in the Remuneration report on pages 30 to 34.<br />
At 30 April 2003, the Company had loan notes receivable of »10.0m (2002 ^ »10.0m) from Virgin Rail <strong>Group</strong> Limited. The Company<br />
earned interest of »1.0m (2002 ^ »1.0m) on the loan notes during the year.<br />
During the year, Keith Cochrane (up until his resignation on 21 July 2002), Graham Eccles <strong>and</strong> another member of the <strong>Group</strong>’s<br />
management were non-executive directors of Virgin Rail <strong>Group</strong> Holdings Limited. Fees of »25,000 (2002 ^ »25,000) were payable to the<br />
<strong>Group</strong> by Virgin Rail <strong>Group</strong> Holdings Limited in this regard.<br />
During the year, Brian Souter <strong>and</strong> Keith Cochrane (up until his resignation on 21 July 2002) <strong>and</strong> another member of the <strong>Group</strong>’s<br />
management were non-executive directors of Road King Infrastructure Limited. Fees of »35,981 (2002 ^ »33,795) were paid to the <strong>Group</strong><br />
by Road King Infrastructure Limited in this regard.<br />
Note 28 Post balance sheet events<br />
(i) Disposal of Citybus<br />
On 9 June 2003, the <strong>Group</strong> announced the disposal of Citybus to Delta Pearl Limited (‘‘the purchaser’’), a 100% indirect subsidiary of<br />
Chow Tai Fook Enterprises Limited, the privately owned company of the Cheng Yu Tung family <strong>and</strong> the major shareholder in New World<br />
Development Company Limited which in turn has an interest in New World First Bus Services Limited, one of Hong Kong’s major bus<br />
operators. The sale was completed on 23 June 2003.<br />
The gross consideration for the disposal is HK$2,200m. The net cash amount received was HK$1,646m, which represented the gross<br />
consideration less the amount of net third party debt as at 30 April 2003, being HK$554m. The purchaser assumed all of the net third<br />
party debt of Citybus.<br />
The purchaser also assumed capital commitments of approximately HK$239m relating mainly to the completion of a new depot for<br />
Citybus at Chaiwan in Hong Kong.<br />
Further details on the disposal were given in the <strong>Group</strong>’s announcement on 9 June 2003.<br />
(ii) Disposal of businesses at Coach USA<br />
Since 30 April 2003, the <strong>Group</strong> has announced the disposals of a number of parts of Coach USA in line with the restructuring plan for<br />
Coach USA announced in December 2002. The disposals announced were as follows:<br />
* On 6 June 2003, the <strong>Group</strong> announced that it had agreed terms for the sale of the South Central <strong>and</strong> West Regions of Coach USA to a<br />
newly formed affiliate of Kohlberg & Co., LLC. Completion of the transaction is subject to regulatory approval, final confirmation of<br />
financing <strong>and</strong> normal closing conditions. The gross consideration for the sale is US$155m, to be satisfied by cash of US$128.5m <strong>and</strong> an<br />
interest-bearing loan note receivable of US$26.5m repayable no later than 63 months from date of close.<br />
* On 2 June 2003, the <strong>Group</strong> announced that it had completed the sale to Peter Pan Bus Lines of the business <strong>and</strong> assets of the New<br />
Engl<strong>and</strong> Region of Coach USA. The business has been sold for a consideration of US$40m, satisfied by cash of US$33m <strong>and</strong> loan notes<br />
receivable of US$5m <strong>and</strong> US$2m repayable after three years <strong>and</strong> four years respectively, both interest bearing.<br />
* On 22 May 2003, the <strong>Group</strong> announced that it had agreed terms for the sale to First Transit, a US subsidiary of First <strong>Group</strong> plc, of the<br />
business <strong>and</strong> assets of the Transit Division of Coach USA. The transaction is subject to normal commercial closing conditions, including<br />
approval from affected public authorities, with completion anticipated before 30 June 2003. The consideration for the transaction is<br />
US$22.5m, satisfied by cash.<br />
These transactions will not result in a material gain or <strong>loss</strong> on disposal in the consolidated <strong>account</strong>s of <strong>Stagecoach</strong> <strong>Group</strong> plc. Further<br />
details on the disposals were given in the <strong>Group</strong>’s announcements of each disposal.<br />
74
Shareholder information<br />
Analysis of shareholders as at 30 April 2003<br />
Range of holdings No. of holders % Shares held %<br />
1 ^ 25,000 63,374 98.13 112,090,141 8.49<br />
25,001 ^ 250,000 911 1.41 61,025,734 4.62<br />
250,001 ^ 500,000 87 0.13 31,135,217 2.36<br />
500,001 ^ 3,750,000 160 0.25 223,171,952 16.89<br />
Over 3,750,000 50 0.08 893,522,968 67.64<br />
64,582 100.00 1,320,946,012 100.00<br />
Classification of shareholders No. of holders % Shares held %<br />
Individuals 62,057 96.09 425,922,132 32.24<br />
Other corporate bodies 74 0.11 9,689,593 0.73<br />
Banks <strong>and</strong> Nominees 2,209 3.42 817,816,640 61.92<br />
Insurance <strong>and</strong> assurance companies 1 0.00 152,616 0.01<br />
Limited companies 231 0.36 67,157,356 5.08<br />
Pension funds 10 0.02 207,675 0.02<br />
64,582 100.00 1,320,946,012 100.00<br />
Registrar <strong>and</strong> transfer office<br />
All administrative enquiries relating to shareholdings should, in the first instance, be directed to the Company’s registrar <strong>and</strong> clearly state<br />
the shareholder’s name <strong>and</strong> address. Please write to: Lloyds TSB Registrars Scotl<strong>and</strong>, PO Box 28448, Finance House, Orchard Brae,<br />
Edinburgh EH4 1WQ. Telephone 0870 601 5366.<br />
<strong>Stagecoach</strong> individual savings <strong>account</strong>s<br />
The Company has appointed Halifax Share Dealing Limited as an ISA provider <strong>and</strong> shareholders who would like further information should<br />
contact their help desk on 08457 22 55 25.<br />
The Company has also made arrangements with Stocktrade for Maxi <strong>and</strong> Mini ISAs. Full details <strong>and</strong> an application form are available from<br />
Stocktrade (a division of Brewin Dolphin), 10 George Street, Edinburgh EH2 2PZ. Telephone 0131 240 0448.<br />
Low cost share dealing facility<br />
The <strong>Group</strong> has set up a low cost execution only share dealing facility with a division of Brewin Dolphin, Stocktrade, exclusive to<br />
<strong>Stagecoach</strong> shareholders. The commission is 0.6% up to »10,000 with 0.2% being charged on the excess thereafter, subject to a<br />
»15 minimum. Shareholders who would like further information should write to Stocktrade, PO Box 1076, 10 George Street, Edinburgh<br />
EH2 2PZ. Telephone 0845 601 0995, quoting dealing reference Low Co020. Postal dealing packs are available on request.<br />
Payment of dividends by BACS<br />
Many shareholders have already arranged for dividends to be paid by m<strong>and</strong>ate directly to their bank or building society <strong>account</strong>.<br />
The m<strong>and</strong>ates enable the Company to pay dividends through the BACS (Bankers’ Automated Clearing Services) system. The benefit to<br />
shareholders of the BACS system is that the registrar posts the tax vouchers directly to them, whilst the dividend is credited on the<br />
payment date to the shareholder bank or building society <strong>account</strong>. Shareholders who wish to benefit from this service should request the<br />
Company’s registrar (address above) to send them a dividend/interest m<strong>and</strong>ate form or alternatively complete the m<strong>and</strong>ate form attached<br />
to the next dividend tax voucher they receive.<br />
Dividend Re-Investment Plan<br />
The Company operates a Dividend Re-Investment Plan which allows a shareholder’s cash dividend to be used to buy <strong>Stagecoach</strong> shares at<br />
favourable commission rates. Shareholders who would like further information should telephone LLoyds TSB Registrars Scotl<strong>and</strong> on<br />
0870 241 3018.<br />
75