Global Conflict & Terrorism Trends - START - National Consortium ...
Global Conflict & Terrorism Trends - START - National Consortium ...
Global Conflict & Terrorism Trends - START - National Consortium ...

Create successful ePaper yourself
Turn your PDF publications into a flip-book with our unique Google optimized e-Paper software.
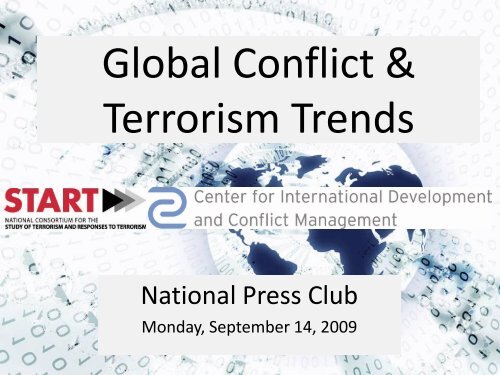
<strong>Global</strong> <strong>Conflict</strong> &<br />
<strong>Terrorism</strong> <strong>Trends</strong><br />
<strong>National</strong> Press Club<br />
Monday, September 14, 2009
Peace and <strong>Conflict</strong> Ledger and<br />
<strong>Conflict</strong> <strong>Trends</strong><br />
Joseph Hewitt<br />
CIDCM<br />
University of Maryland
Over the past two years, the risks of<br />
instability and conflict have increased<br />
significantly in the regions of the world<br />
where those dangers were already very<br />
high.
What is one of the most serious<br />
threats to international stability?<br />
The recurrence of armed hostilities in<br />
conflicts that have recently come to<br />
an end.
Peace and <strong>Conflict</strong> 2010<br />
• Making cutting edge<br />
academic research<br />
accessible to the policy<br />
community<br />
• Open-source data<br />
• Commitment to<br />
transparency<br />
• Available from<br />
Paradigm Publishers
Peace and <strong>Conflict</strong> Ledger<br />
• What does the Peace<br />
and <strong>Conflict</strong> Ledger<br />
measure?<br />
• The risk of an instability<br />
event occurring in a<br />
country in the next<br />
three years.
Some Key Details<br />
• The focus is on how structural attributes of<br />
states influence the risk of instability<br />
• Four domains of government activity<br />
(economics, politics, security, and social)<br />
• Estimated a statistical model on data from<br />
1950-2003 (training data)<br />
• Obtain country risk estimates by inputting<br />
2007 values for all countries
Indicators – The Usual Suspects<br />
Economics Politics Security Social<br />
GDP per capita<br />
GDP annual growth<br />
rate<br />
GDP 3-year growth<br />
rate<br />
CPI annual change<br />
Primary commodity<br />
dependence<br />
Ratio of trade to<br />
GDP<br />
Poverty rates<br />
Change in foreign<br />
investment<br />
Extent of<br />
factionalism<br />
Citizen participation<br />
in selecting gov’t<br />
Gov’t revenues as<br />
% of GDP<br />
Duration of present<br />
regime<br />
Regime Consistency<br />
State repression of<br />
citizens<br />
Size of military<br />
budget<br />
Number of active<br />
armed personnel<br />
Peace Duration<br />
<strong>Conflict</strong> in<br />
contiguous states<br />
Male secondary<br />
enrollment<br />
Infant Mortality<br />
Access to water<br />
supplies/ sanitation<br />
Youth literacy rates<br />
Immunization rates<br />
Level of Democracy <strong>Conflict</strong> in region Male/female literacy<br />
ratio<br />
Executive<br />
Constraints<br />
Legislative<br />
Effectiveness<br />
Number of IDPs<br />
Intensity of internal<br />
armed conflicts<br />
Cultural or religious<br />
discrimination<br />
Male/female life<br />
expectancy ratio
Risks of Instability, 2008-2010
Instability Risk: Top 25
Instability Risk: Top 25 (cont.)
Significant Increase in Risk<br />
NIGERIA<br />
• Renewed fighting in neighboring<br />
Chad DEMOCRATIC (2005) and REPUBLIC Niger (2007) OF CONGO<br />
• Transition to partial democracy<br />
• Poor performance on other<br />
indicators<br />
MAURITANIA<br />
• Tenuous democratic BURUNDI transition<br />
begins • Democratic in 2005 transition begins in<br />
• Continued 2005 low-intensity violence<br />
in • Mali Renewed and Algeria fighting in neighboring<br />
DRC (2007)
Sources of Increased Risk?<br />
Democratization<br />
Recurring Armed<br />
<strong>Conflict</strong>
New and Recurring <strong>Conflict</strong>, 1946-2007<br />
9<br />
8<br />
7<br />
6<br />
5<br />
4<br />
3<br />
2<br />
1<br />
0<br />
Number of <strong>Conflict</strong> Onsets<br />
1950 1960 1970 1980 1990 2000<br />
New<br />
Recurring
Recently Terminated <strong>Conflict</strong>s and Prospects for<br />
Recurrence, 1946-2007<br />
45<br />
40<br />
35<br />
30<br />
25<br />
20<br />
15<br />
10<br />
5<br />
0<br />
Number of Recently Terminated <strong>Conflict</strong>s<br />
1950 1960 1970 1980 1990 2000<br />
No Recurrence History<br />
Recurrence History
Conclusion<br />
• Devastating costs of state failure<br />
• Stay tuned<br />
• Diagnostic tools for policy-makers to support<br />
effective policies to mitigate conflict risks
Costs of State Failure<br />
87%<br />
12%<br />
Cost to neighbors<br />
Cost of poverty<br />
Cost of civil war<br />
1%<br />
<strong>Global</strong> estimated cost of state failure: $270 billion*<br />
* Anke Hoeffler, Peace and <strong>Conflict</strong> 2010
Conclusion<br />
• Devastating costs of state failure<br />
• Stay tuned<br />
• Diagnostic tools for policy-makers to support<br />
effective policies to mitigate conflict risks
GLOBAL TERRORISM TRENDS<br />
Gary LaFree<br />
Director, <strong>START</strong> Center<br />
University of Maryland
• Frequency of terrorist attacks is on the rise<br />
worldwide, including an increased number of<br />
fatal attacks<br />
• Terrorist activity has been especially more<br />
frequent in the Middle East and Asia this<br />
decade<br />
• Countries emerging as “terrorist hotspots” are<br />
not necessarily the countries at risk of<br />
instability
The <strong>Global</strong> <strong>Terrorism</strong> Database<br />
• Originally compiled by PGIS<br />
• 82,000+ attacks, 1970 to 2007<br />
• Open source, unclassified<br />
• Drawn from electronic databases (e.g., Lexis/<br />
Nexis); wire services (e.g., Reuters);<br />
newspapers (e.g., Washington Post); Radio/<br />
TV Transcripts; <strong>Terrorism</strong> Chronologies;<br />
Government Reports<br />
• Includes Domestic Data<br />
www.start.umd.edu/gtd
Defining <strong>Terrorism</strong><br />
The GTD defines terrorism as acts<br />
by non state actors involving the<br />
threatened or actual use of illegal<br />
force or violence to attain a<br />
political, economic, religious or<br />
social goal through fear, coercion or<br />
intimidation.
Attacks and Fatalities by Foreign Terrorist Groups<br />
Identified as Threats to the United States<br />
Includes all domestic and transnational attacks for 52 designated groups<br />
40,000<br />
35,000<br />
92.7%<br />
(35,322)<br />
30,000<br />
25,000<br />
Transnational<br />
20,000<br />
15,000<br />
93.1%<br />
(15,225)<br />
Domestic<br />
10,000<br />
5,000<br />
6.9%<br />
(1,121)<br />
7.3%<br />
(2,791)<br />
0<br />
Attacks<br />
Fatalities<br />
Source: LaFree, Yang and Crenshaw (2009)
Worldwide Terrorist Attacks, 1970-2007<br />
Comparison of all attacks vs. fatal attacks vs. mass-casualty attacks<br />
Source: <strong>Global</strong> <strong>Terrorism</strong> Database<br />
N = 81,799
Percent of Attacks<br />
Total Fatalities per Terrorist Attack, 1970-2007 (n=82,910*)<br />
60.00<br />
Fatalities per Attack, 1970-2007<br />
50.00<br />
40.00<br />
30.00<br />
55.17%<br />
20.00<br />
10.00<br />
0.00<br />
19.47%<br />
13.39%<br />
6.97%<br />
1.49%<br />
3.50%<br />
0 1 2 to 4 5 to 10 11 to 25 over 25<br />
Number of Fatalities per Attack<br />
*Data on fatalities were missing in 8.1% of cases<br />
Source: <strong>Global</strong> <strong>Terrorism</strong> Database
Terrorist Targets, 1970-2007<br />
Source: <strong>Global</strong> <strong>Terrorism</strong> Database<br />
3.15%<br />
2.62% 2.59% 2.47% 2.30% Private Citizens Property<br />
19.82%<br />
4.39%<br />
4.60%<br />
5.56%<br />
16.98%<br />
9.62%<br />
9.95%<br />
15.95%<br />
Government<br />
Business<br />
Other<br />
Police<br />
Transportation<br />
Diplomatic<br />
Utilities<br />
Religious Figures/Institutions<br />
Military<br />
Unknown<br />
Journalists and Media<br />
Educational Institutions<br />
Source: <strong>Global</strong> <strong>Terrorism</strong> Database
Terrorist Tactics, 1970-2007<br />
1.80% 1.43% 0.61% 0.36% 0.24% 0.14%<br />
3.09%<br />
Source: <strong>Global</strong> <strong>Terrorism</strong> Database<br />
Bombing<br />
Armed Attack<br />
Assassination<br />
Kidnapping<br />
Barricade/Hostage<br />
Arson<br />
Unknown<br />
Hijacking<br />
Other<br />
Unconventional Attacks<br />
15.49%<br />
25.50%<br />
51.34%<br />
Source: <strong>Global</strong> <strong>Terrorism</strong> Database
Percentage of Attacks by Tactic by Year,<br />
pre- and post-2001<br />
100%<br />
80%<br />
60%<br />
40%<br />
20%<br />
Unknown<br />
Unarmed Assault<br />
Facility/Infrastructure Attack<br />
Hostage Taking (Kidnapping)<br />
Hostage Taking (Barricade)<br />
Hijacking<br />
Bombing/Explosion<br />
Armed Assault<br />
Assassination<br />
0%<br />
1995 1996 1997 1998 1999 2000 2001 2002 2003 2004 2005 2006 2007<br />
Source: <strong>Global</strong> <strong>Terrorism</strong> Database
Terrorist Weapon Selection, 1970-2007<br />
0.26% 0.37%<br />
1.98% 9.84%<br />
7.65%<br />
Explosives/ Bombs/<br />
Dynamite<br />
Firearms<br />
Incendiary<br />
43.68%<br />
Melee<br />
Chemical<br />
36.22%<br />
Other<br />
Unknown<br />
Source: <strong>Global</strong> <strong>Terrorism</strong> Database
Number of Attacks<br />
Terrorist Usage of IEDs<br />
300<br />
Source: <strong>Global</strong> <strong>Terrorism</strong> Database<br />
250<br />
200<br />
150<br />
100<br />
50<br />
0<br />
IED_Definitely VBIED Suicide_IED Military_IED<br />
Source: <strong>Global</strong> <strong>Terrorism</strong> Database
Terrorist Attacks and Fatalities by<br />
Region, 1970-2007<br />
SOUTH AMERICA<br />
ASIA<br />
EUROPE<br />
MIDDLE EAST & NORTH AFRICA<br />
CENTRAL AMERICA & CARIBBEAN<br />
SUB-SAHARAN AFRICA<br />
NORTH AMERICA<br />
INCIDENTS<br />
RUSSIA & THE NEWLY INDEPENDENT STATES<br />
AUSTRALASIA & OCEANIA<br />
FATALITIES<br />
Source: <strong>Global</strong> <strong>Terrorism</strong> Database<br />
Source: <strong>Global</strong> <strong>Terrorism</strong> Database<br />
0% 5% 10% 15% 20% 25% 30%
Frequency<br />
1600<br />
Terrorist Activity by Region,1970-2007<br />
North America<br />
1400<br />
1200<br />
1000<br />
800<br />
600<br />
400<br />
Central America &<br />
Caribbean<br />
South America<br />
Asia<br />
Europe<br />
Middle East & North<br />
Africa<br />
Sub-Saharan Africa<br />
Russia & the Newly<br />
Independent States<br />
200<br />
0<br />
Source: <strong>Global</strong> <strong>Terrorism</strong> Database<br />
Year
Percent of Groups at this Life Span<br />
Longevity of Terrorist Groups, 1970-2007<br />
80<br />
70<br />
60<br />
50<br />
40<br />
30<br />
20<br />
10<br />
0<br />
0 1 2 3 4 5 6 7 8 9 10+<br />
Life Span of Group (In Years)<br />
Source: <strong>Global</strong> <strong>Terrorism</strong> Database
Twenty Top Countries for Terrorist Activity, 1970 to 2007<br />
Most Frequently Attacked<br />
Most Fatalities<br />
Rank Country Attack Count Country Fatality Count<br />
1 Colombia 6,770 Iraq 17,475<br />
2 Peru 6,040 Sri Lanka 14,166<br />
3 El Salvador 5,330 India 13,520<br />
4 India 4,273 Colombia 13,031<br />
5 Northern Ireland 3,774 Peru 12,829<br />
6 Spain 3,169 El Salvador 12,496<br />
7 Iraq 2,969 Nicaragua 11,324<br />
8 Turkey 2,680 Algeria 8,538<br />
9 Pakistan 2,499 Philippines 6,282<br />
10 Philippines 2,486 Pakistan 5,804<br />
11 Sri Lanka 2,393 Guatemala 5,150<br />
12 Chile 2,288 Turkey 4,658<br />
13 Guatemala 2,032 Burundi 4,084<br />
14 Nicaragua 1,987 United States 3,340<br />
15 Lebanon 1,930 Rwanda 3,200<br />
16 South Africa 1,920 Afghanistan 3,174<br />
17 Algeria 1,645 Lebanon 3,108<br />
18 Italy 1,490 Russia 3,014<br />
19 West Bank & Gaza Strip 1,372 Angola 2,871<br />
20 United States 1,347 Northern Ireland 2,844<br />
Source: <strong>Global</strong> <strong>Terrorism</strong> Database<br />
www.start.umd.edu/gtd
Trajectory Analysis of Total Attacks, 1970 to 2006
Emerging Terrorist Hotspots<br />
Afghanistan<br />
Bangladesh<br />
Indonesia<br />
Iraq<br />
Kashmir<br />
Nepal<br />
Rwanda<br />
Thailand<br />
West Bank/Gaza
Emerging Terrorist Hotspots<br />
and Risk of Instability<br />
Afghanistan<br />
Bangladesh<br />
Indonesia<br />
Iraq<br />
Kashmir<br />
Nepal<br />
Rwanda<br />
Thailand<br />
West Bank/Gaza
Trajectories of Attacks on United States by<br />
Anti-U.S. Terrorist Groups, 1970-2004
Shifting Adversaries<br />
21 st Century Boom<br />
al Qaeda<br />
Taliban<br />
80s Boom<br />
Shining Path<br />
Farabundo Marti <strong>National</strong> Liberation Front<br />
70s Boom<br />
Red Brigades<br />
People's Liberation Forces<br />
Sporadic<br />
Popular Liberation Army<br />
Moro Islamic Liberation Front
www.start.umd.edu/gtd
Thank You<br />
Gary LaFree<br />
<strong>START</strong> Director<br />
Tel: (301) 405-6600<br />
glafree@start.umd.edu<br />
GTD Online at:<br />
www.start.umd.edu
Political Organizations in the<br />
Middle East and the Use and<br />
Non-use of Violence<br />
Jonathan Wilkenfeld<br />
CIDCM, <strong>START</strong><br />
University of Maryland
Ethnic Identity in the World<br />
• More than 5,000 ethnic groups globally (UNDP 2004)<br />
• Two-thirds of the world’s countries have at least one<br />
minority that is 10% or more of its population<br />
• The Minorities at Risk project (MAR) has identified<br />
nearly 2,000 socially significant ethnic groups that<br />
comprise at least 100,000 people or 1% of a<br />
country’s population<br />
• MAR estimates that nearly 1 in 7 people in the world<br />
face some sort of discrimination based on ethnic<br />
identity
Why study ethnic organizations?<br />
• 7 of the 10 deadliest organizations have ethnically<br />
based ideology or membership, in full or in part<br />
(1998-2005 data)<br />
• MAR data demonstrates some broad preconditions<br />
for ethnic groups to use violence or terrorism, not<br />
which specific organizations may use terrorism<br />
• Most ethnic groups are represented by multiple<br />
organizations that use different mixes of strategies<br />
(violent and nonviolent).
Broader Policy Implications<br />
• Key problem with terrorism research is its<br />
exclusive focus on organizations that engage in<br />
terrorism.<br />
This limits the questions we can ask.<br />
• By focusing on ethnic organizations around the<br />
world, we have a natural control group:<br />
• We can now ask why some organizations<br />
choose violence and terrorism and others do<br />
not<br />
• We can ask why some groups start and why<br />
some groups stop using terrorism
<strong>Global</strong> Ethnic Militancy<br />
Countries with at least one militant, ethnically based organization
What is Minorities at Risk<br />
Organizational Behavior?<br />
• The MAROB project collects and analyzes data on<br />
organizations that have their core support in ethnic<br />
groups<br />
• MAROB includes both violent and nonviolent<br />
organizations<br />
• Currently, complete data available for the Middle East<br />
and North Africa, 1980-2004<br />
• Additional regions to be released soon include post-<br />
Communist states, Western Europe and Latin America
Growth in Middle East Ethnic Organizations
Ideological Change- Middle East<br />
70.00%<br />
60.00%<br />
50.00%<br />
40.00%<br />
30.00%<br />
20.00%<br />
10.00%<br />
0.00%<br />
1980<br />
1981<br />
1982<br />
1983<br />
1984<br />
1985<br />
1986<br />
1987<br />
1988<br />
1989<br />
1990<br />
1991<br />
1992<br />
1993<br />
1994<br />
1995<br />
1996<br />
1997<br />
1998<br />
1999<br />
2000<br />
2001<br />
2002<br />
2003<br />
2004<br />
% Rightist % Leftist %<strong>National</strong>ist % Democratic % Religious
60.00%<br />
Political Strategies Among Middle East<br />
Ethnic Organizations<br />
50.00%<br />
40.00%<br />
30.00%<br />
20.00%<br />
10.00%<br />
0.00%<br />
1980 1981 1982 1983 1984 1985 1986 1987 1988 1989 1990 1991 1992 1993 1994 1995 1996 1997 1998 1999 2000 2001 2002 2003 2004<br />
%Electoral Politics<br />
% Protest<br />
% Violent
Why Ethnic <strong>Terrorism</strong><br />
• Organizations professing a democratic ideology are<br />
significantly less likely engage in terrorism<br />
• Organizations with the following characteristics are<br />
more likely to engage in terrorism:<br />
• Separatism<br />
• Rhetoric justifying violence<br />
• Foreign Support<br />
• State Repression<br />
• Organizations that do not have a democratic ideology<br />
and have all the factors above have an 89% likelihood<br />
of engaging in terrorism
Percent of Organizations<br />
Changes in Ethnic <strong>Terrorism</strong><br />
30%<br />
Percent of Organizations Using <strong>Terrorism</strong><br />
(1980 - 2004)<br />
25%<br />
20%<br />
15%<br />
10%<br />
5%<br />
0%<br />
1980<br />
1982<br />
1984<br />
1986<br />
1988<br />
1990<br />
1992<br />
1994<br />
1996<br />
1998<br />
2000<br />
2002<br />
2004
Jonathan Wilkenfeld<br />
Center for International Development and <strong>Conflict</strong><br />
Management<br />
University of Maryland<br />
jwilkenf@gvpt.umd.edu<br />
www.cidcm.umd.edu/mar
<strong>Global</strong> <strong>Conflict</strong> &<br />
<strong>Terrorism</strong> <strong>Trends</strong><br />
www.start.umd.edu<br />
www.cidcm.umd.edu