Scientific Underpinnings of - START - National Consortium for the ...
Scientific Underpinnings of - START - National Consortium for the ...
Scientific Underpinnings of - START - National Consortium for the ...

You also want an ePaper? Increase the reach of your titles
YUMPU automatically turns print PDFs into web optimized ePapers that Google loves.
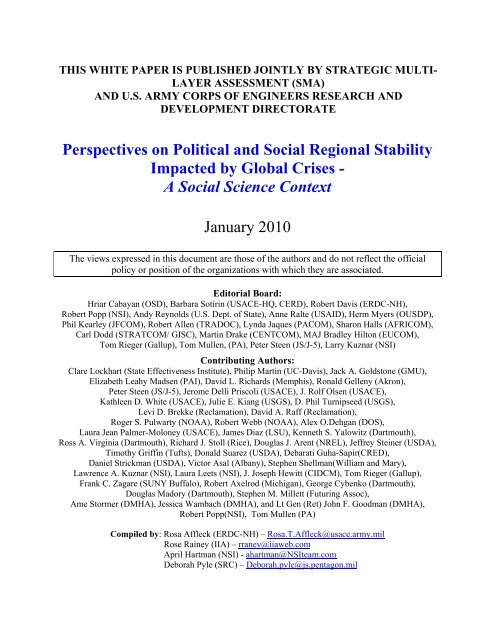
THIS WHITE PAPER IS PUBLISHED JOINTLY BY STRATEGIC MULTI-<br />
LAYER ASSESSMENT (SMA)<br />
AND U.S. ARMY CORPS OF ENGINEERS RESEARCH AND<br />
DEVELOPMENT DIRECTORATE<br />
Perspectives on Political and Social Regional Stability<br />
Impacted by Global Crises -<br />
A Social Science Context<br />
January 2010<br />
The views expressed in this document are those <strong>of</strong> <strong>the</strong> authors and do not reflect <strong>the</strong> <strong>of</strong>ficial<br />
policy or position <strong>of</strong> <strong>the</strong> organizations with which <strong>the</strong>y are associated.<br />
Editorial Board:<br />
Hriar Cabayan (OSD), Barbara Sotirin (USACE-HQ, CERD), Robert Davis (ERDC-NH),<br />
Robert Popp (NSI), Andy Reynolds (U.S. Dept. <strong>of</strong> State), Anne Ralte (USAID), Herm Myers (OUSDP),<br />
Phil Kearley (JFCOM), Robert Allen (TRADOC), Lynda Jaques (PACOM), Sharon Halls (AFRICOM),<br />
Carl Dodd (STRATCOM/ GISC), Martin Drake (CENTCOM), MAJ Bradley Hilton (EUCOM),<br />
Tom Rieger (Gallup), Tom Mullen, (PA), Peter Steen (JS/J-5), Larry Kuznar (NSI)<br />
Contributing Authors:<br />
Clare Lockhart (State Effectiveness Institute), Philip Martin (UC-Davis), Jack A. Goldstone (GMU),<br />
Elizabeth Leahy Madsen (PAI), David L. Richards (Memphis), Ronald Gelleny (Akron),<br />
Peter Steen (JS/J-5), Jerome Delli Priscoli (USACE), J. Rolf Olsen (USACE),<br />
Kathleen D. White (USACE), Julie E. Kiang (USGS), D. Phil Turnipseed (USGS),<br />
Levi D. Brekke (Reclamation), David A. Raff (Reclamation),<br />
Roger S. Pulwarty (NOAA), Robert Webb (NOAA), Alex O.Dehgan (DOS),<br />
Laura Jean Palmer-Moloney (USACE), James Diaz (LSU), Kenneth S. Yalowitz (Dartmouth),<br />
Ross A. Virginia (Dartmouth), Richard J. Stoll (Rice), Douglas J. Arent (NREL), Jeffrey Steiner (USDA),<br />
Timothy Griffin (Tufts), Donald Suarez (USDA), Debarati Guha-Sapir(CRED),<br />
Daniel Strickman (USDA), Victor Asal (Albany), Stephen Shellman(William and Mary),<br />
Lawrence A. Kuznar (NSI), Laura Leets (NSI), J. Joseph Hewitt (CIDCM), Tom Rieger (Gallup),<br />
Frank C. Zagare (SUNY Buffalo), Robert Axelrod (Michigan), George Cybenko (Dartmouth),<br />
Douglas Madory (Dartmouth), Stephen M. Millett (Futuring Assoc),<br />
Ame Stormer (DMHA), Jessica Wambach (DMHA), and Lt Gen (Ret) John F. Goodman (DMHA),<br />
Robert Popp(NSI), Tom Mullen (PA)<br />
Compiled by: Rosa Affleck (ERDC-NH) – Rosa.T.Affleck@usace.army.mil<br />
Rose Rainey (IIA) – rraney@iiaweb.com<br />
April Hartman (NSI) - ahartman@NSIteam.com<br />
Deborah Pyle (SRC) – Deborah.pyle@js.pentagon.mil
Table <strong>of</strong> Contents<br />
PREFACE (RDML John E. Roberti).......................................................................................... 3<br />
Executive Summary (Rosa Affleck, Todd Anderson, Roy Cooper, Rose Rainey).................. 4<br />
1. Stability and State Building (Clare Lockhart) ................................................................ 12<br />
2. Independent Trend and Trajectory <strong>of</strong> <strong>the</strong> Future: Issues Impacting Social Regional<br />
Stability ............................................................................................................................ 23<br />
2.1. Demographics ................................................................................................................................... 23<br />
2.1.A.<br />
Demographic and Economic Trends: Implications <strong>for</strong> International<br />
Migration (Philip Martin) ............................................................................ 23<br />
2.1.B. Demography and Security (Jack Goldstone) ............................................... 32<br />
2.1.C. Demographic Security (Elizabeth Leahy Madsen)...................................... 44<br />
2.2. Economics........................................................................................................................................... 51<br />
2.2.A. Banking Crises, Collective Protest and Rebellion (David Richards, Ronald<br />
Gelleny)........................................................................................................ 51<br />
2.2.B. Economics and Political Instability within <strong>the</strong> Global Economic Crisis<br />
(Peter Steen)................................................................................................. 73<br />
2.3. Water .................................................................................................................................................... 78<br />
2.3.A.<br />
2.3.B.<br />
Water and Security: Cause War or Help Community Building? (Jerome<br />
Delli Priscoli)............................................................................................... 78<br />
Water Resources and Stability (J. Rolf Olsen, Kathleen White, Julie Kiang,<br />
D. Phil Turnipseed, Levi Brekke, David Raff, Roger Pulwarty, Robert<br />
Webb)........................................................................................................... 89<br />
2.3.C. Water Security and Scarcity: Potential Destabilization in Western<br />
Afghanistan (Alex Dehgan, Laura Jean Palmer-Moloney).......................... 98<br />
2.4. Changing <strong>of</strong> Climate and State Wea<strong>the</strong>r ..............................................................................110<br />
2.4.A. Maintaining Geopolitical and Social Stability throughout a Global Economy<br />
in an Era <strong>of</strong> Climate Change (James Diaz)................................................ 110<br />
2.4.B. The Arctic Region: Prospects <strong>for</strong> a Great Game or International Cooperation<br />
(Kenneth Yalowitz, Ross Virginia)............................................................ 125<br />
2.4.C. Changing Climate Impacts to Water Resources: Implications <strong>for</strong> Stability<br />
(Kathleen White, J.Rolf Olsen, Levi Brekke, David Raff, Roger Pulwarty,<br />
Robert Webb)............................................................................................. 131<br />
Energy............................................................................................................................................................144<br />
2.4.D. Energy, Africa, and Civil Conflict: What Does <strong>the</strong> Future Hold? (Richard<br />
Stoll)........................................................................................................... 144<br />
2.4.E. Energy: A <strong>National</strong> and Global Issue (Douglas Arent) ............................. 150<br />
2.5. Food.....................................................................................................................................................170<br />
2.5.A. World Food Availability and <strong>the</strong> Natural Land Resources Base (Jeffrey<br />
Steiner, Timothy Griffin)........................................................................... 170<br />
2.5.B. Food Production in Arid Regions as Related to Salinity (Donald Suarez) 178<br />
2.6. Epidemics..........................................................................................................................................184<br />
2.6.A. Epidemics: A Thumbnail Sketch <strong>of</strong> <strong>the</strong> Past, Present and Future (Debarati<br />
Guha-Sapir)................................................................................................ 184<br />
i
2.6.B.<br />
Infectious Disease and Social Instability: Prevent, Respond, Repair (Daniel<br />
Strickman).................................................................................................. 190<br />
3. Social Science Modeling and Analysis Approaches ...................................................... 196<br />
3.1. Analyzing Political and Social Regional Stability with Statistics: Challenges and<br />
Opportunities (Victor Asal, Stephen Shellman) ...............................................................196<br />
3.2. The Social Stability <strong>of</strong> Societies: An Anthropological View (Lawrence Kuznar)203<br />
3.3. Quantitative Content Analysis (Laura Leets) ....................................................................213<br />
3.4. The Peace and Conflict Instability Ledger Ranking States on Future Risks (J.<br />
Joseph Hewitt) ................................................................................................................................219<br />
3.5. Perception is Reality: Stability through <strong>the</strong> Eyes <strong>of</strong> <strong>the</strong> Populace (Tom Rieger)<br />
...............................................................................................................................................................236<br />
3.6. Assessing <strong>the</strong> Stability <strong>of</strong> Interstate Relationships Using Game Theory (Frank<br />
Zagare) ...............................................................................................................................................242<br />
3.7. Theoretical Foundations <strong>of</strong> Partnerships <strong>for</strong> Economic Development (Robert<br />
Axelrod).............................................................................................................................................247<br />
3.8. Process Query System as a Framework <strong>for</strong> Modeling and Analysis <strong>of</strong> Regional<br />
Stability (George Cybenko, Douglas Madory) ...................................................................258<br />
3.9. The Use <strong>of</strong> Cross‐impact Analysis <strong>for</strong> Modeling, Simulation, and Forecasting<br />
(Stephen Millett)............................................................................................................................267<br />
3.10. Development <strong>of</strong> a Framework <strong>for</strong> Action: Community Resiliency as a Means <strong>of</strong><br />
Achieving Stability (Ame Stormer, Jessica Wambach, Lt Gen (Ret) John<br />
Goodman) .........................................................................................................................................277<br />
4. Case Studies ...................................................................................................................... 283<br />
4.1. Sudan Strategic Assessment: A Case Study <strong>of</strong> Social Science Modeling (Robert<br />
Popp)...................................................................................................................................................283<br />
4.2. Analyzing Stability Challenges in Africa: Case Study <strong>of</strong> an Approach (Tom<br />
Mullen)...............................................................................................................................................289<br />
Appendix A. Acronyms ........................................................................................................... 296<br />
ii
PREFACE (RDML John E. Roberti)<br />
This timely and important compilation <strong>of</strong> papers <strong>for</strong>ms an essential step in understanding <strong>the</strong><br />
importance and interdependency <strong>of</strong> factors effecting stability. The authors, both academicians<br />
and military subject matter experts, provide invaluable insight by adding <strong>the</strong>ir accumulated<br />
knowledge and expertise to <strong>the</strong> project.<br />
The ability to assess and <strong>for</strong>esee potential instabilities presents a challenging problem. Recent<br />
crises in political, social, economic, climatologic and energy issues represent just a few<br />
indicators <strong>of</strong> continuing global instability.<br />
As we consider <strong>the</strong> complexities <strong>of</strong> <strong>the</strong> 21st century, quantitative and qualitative approaches to<br />
<strong>the</strong> study <strong>of</strong> instability will be integral to developing an appropriate understanding <strong>of</strong> <strong>the</strong><br />
strategic context <strong>for</strong> national security. This compilation assists in building a more rigorously<br />
in<strong>for</strong>med understanding <strong>of</strong> <strong>the</strong>se key issues.<br />
It is critically important, <strong>for</strong> us to understand global strategic risk, that we identify and fully<br />
comprehend <strong>the</strong> interdependence among <strong>the</strong>se complex issues influencing regional and global<br />
stability. By determining <strong>the</strong> probability and consequence <strong>of</strong> this risk, we can take a prioritized<br />
approach to reducing instability by a well-in<strong>for</strong>med application <strong>of</strong> all elements <strong>of</strong> national power.<br />
John E. Roberti<br />
Rear Admiral, USN<br />
Deputy Director, Strategy and Policy, J-5<br />
The Joint Staff<br />
3
Executive Summary (Rosa Affleck, Todd Anderson, Roy Cooper, Rose<br />
Rainey)<br />
Authors and Organizations: Rosa Affleck, U.S. Army Engineer Research and Development<br />
Center CRREL; Todd Anderson, Roy Cooper, Rose Rainey -<br />
In<strong>for</strong>mation International Associates, Inc.<br />
Contact In<strong>for</strong>mation: Rosa.T.Affleck@usace.army.mil, tanderson@iiaweb.com,<br />
rcooper@iiaweb.com, rraney@iiaweb.com<br />
A Challenging Problem<br />
Cooperative security, stability operations and irregular warfare missions require a better<br />
understanding <strong>of</strong> <strong>the</strong> complex operational environment, notably through rich contextual<br />
understanding <strong>of</strong> <strong>the</strong> factors affecting stability. Fur<strong>the</strong>r assessment, policy, and planning need to<br />
consider factors associated with institutional per<strong>for</strong>mance (community organizations,<br />
government ministries, legal structures, etc.) based on how societies emerge, develop, and<br />
function, as well as attributes that provide resiliency and flexibility.<br />
Today, stability experts are faced with a new environment in which <strong>the</strong> world is highly<br />
interconnected, change is very rapid, and threats are multifaceted; all <strong>of</strong> <strong>the</strong>se pose very different<br />
challenges to <strong>the</strong> US Government (USG). The current financial situation underscores both <strong>the</strong><br />
rapidity and global extent <strong>of</strong> economic collapse, and it has exacerbated problems in o<strong>the</strong>r areas.<br />
Solutions in one area can have first-, second-, and third-order effects in o<strong>the</strong>r areas; <strong>the</strong>se effects<br />
can be both positive and negative. Global average food prices increased by more than 80%<br />
during 2005-2008, sparking food riots in Africa, Asia, <strong>the</strong> Middle East, <strong>the</strong> Former Soviet Union,<br />
and Central and South America. Contributing factors are complicated; <strong>for</strong> example, shifts in food<br />
demands may be contributing to <strong>the</strong> food price increases, as increasing use <strong>of</strong> food crops <strong>for</strong> bi<strong>of</strong>uels<br />
and increasing demand <strong>for</strong> protein-rich diets dramatically decreases efficient use <strong>of</strong> grain<br />
calories. Estimates <strong>of</strong> future water availability are alarming, and while earthquakes <strong>of</strong>ten impact<br />
manmade water management structures, reports also suggest that geophysical changes caused by<br />
large dams may have triggered earthquakes, including China’s 7.9 magnitude earthquake last<br />
year along a fault near <strong>the</strong> Zipingpu Dam and Reservoir that left 80,000 people missing or dead.<br />
In addition to food and water issues, severe wea<strong>the</strong>r events and climate change, shifts in<br />
demographics, increasing energy demands, pandemics, and threatened usage <strong>of</strong> nuclear weapons<br />
are threats that individually, or worse, in combination, can significantly increase <strong>the</strong> fragility <strong>of</strong><br />
world stability.<br />
While in today’s increasingly interconnected world, global crises and unstable regions pose an<br />
acute risk to world security and could provide un<strong>for</strong>eseen circumstances ripe <strong>for</strong> manipulation<br />
and exploitation, <strong>the</strong>se same threats can serve as rallying instruments, catalyzing disparate<br />
groups to work in concert to develop coordinated responses and preparedness mechanisms. This<br />
coordination can also result in development <strong>of</strong> negotiation venues <strong>for</strong> o<strong>the</strong>r issues. First-, secondand<br />
third-order effects can have positive impacts. In addition to <strong>the</strong> factors identified in <strong>the</strong><br />
frameworks above, o<strong>the</strong>r dimensions <strong>of</strong> consideration include (1) institutional per<strong>for</strong>mance<br />
(community organizations, government ministries, legal structures, etc.) as a function <strong>of</strong> how<br />
societies emerge, develop, and operate, and (2) attributes that provide resilience and flexibility.<br />
4
So <strong>the</strong> lingering question remains, where will <strong>the</strong> next occurrence <strong>of</strong> regional instability be that<br />
requires U.S. intervention? How should we shape <strong>the</strong> structure <strong>of</strong> our future <strong>for</strong>ce to respond to<br />
such instability? This white paper brings some <strong>of</strong> best minds toge<strong>the</strong>r to examine <strong>the</strong> following<br />
aspects <strong>of</strong> this challenging problem:<br />
Individual factors impacting regional stability<br />
How <strong>the</strong>se individual factors can combine to create tipping points that drive significant<br />
regional instabilities<br />
Approaches to <strong>for</strong>ecast and anticipate where future instabilities may occur to give our<br />
warfighters an unfair advantage in <strong>the</strong> future.<br />
Collecting <strong>the</strong> Best Ideas<br />
To capture <strong>the</strong> breadth <strong>of</strong> this issue, this paper examines issues ranging from political,<br />
infrastructural, demographic, economic, resource-related, climatologic, energy-related,<br />
epidemiological, sociological, and analytical issues as <strong>the</strong>y impact regional stability. Decision<br />
makers are dealing with an evolving situation in which societies are increasingly interconnected;<br />
changes occur rapidly, <strong>of</strong>ten with unexpected consequences; and threats to stability are complex.<br />
This white paper is a comprehensive compilation and assessment <strong>of</strong> complex issues influencing<br />
regional stability by a diverse group <strong>of</strong> authors that discuss <strong>the</strong> assessment <strong>of</strong> regional stability<br />
through <strong>the</strong> lens <strong>of</strong> crises in food, water, changing climate, energy, economy, demographics and<br />
epidemics. These articles, some <strong>of</strong> which have been previously published, provide critical<br />
insights into factors and tools that can apply to this complex challenge. Contributors to this white<br />
paper have provided a rich analysis <strong>of</strong> <strong>the</strong> factors affecting stability, as well as new perspectives<br />
based on careful study and experience germane to today’s issues. This compilation yields an<br />
overarching view <strong>of</strong> regional stability as it impacts global and regional crises. Through detailed<br />
citations <strong>of</strong> <strong>the</strong> scholarship and current thinking throughout <strong>the</strong>ir communities, <strong>the</strong> authors make<br />
a compelling case <strong>for</strong> how multiple factors can coalesce to result in radical impacts on regional<br />
stability.<br />
Bringing Wide-ranging Ideas Toge<strong>the</strong>r<br />
The organizational approach used to bring toge<strong>the</strong>r <strong>the</strong> wide-ranging factors associated with<br />
stability is analogous to a wheel. At <strong>the</strong> hub, <strong>the</strong> central support, we examine <strong>the</strong> nature <strong>of</strong><br />
stability and state building. What makes it work? This paper outlines <strong>the</strong> key aspects <strong>of</strong><br />
functioning states, examines how <strong>the</strong>y contribute to <strong>the</strong> good <strong>of</strong> all, and defines how <strong>the</strong>y resist<br />
threats and provide stability.<br />
Emanating from <strong>the</strong> hub are seven enablers <strong>of</strong> stability: demographics, economics, water,<br />
changing climate and wea<strong>the</strong>r, energy, food, and epidemics. Each <strong>of</strong> <strong>the</strong>se articles discusses <strong>the</strong><br />
relationship that enabler has on <strong>the</strong> stability <strong>of</strong> a society.<br />
5
The rim <strong>of</strong> <strong>the</strong> wheel is a series <strong>of</strong><br />
articles describing possible quantitative<br />
and integration methods coupled to<br />
social science modeling approaches.<br />
These approaches provide potential<br />
means to use existing and emerging<br />
in<strong>for</strong>mation to <strong>for</strong>ecast regional<br />
instabilities. The “tread” <strong>of</strong> <strong>the</strong> wheel is<br />
comprised <strong>of</strong> case studies in social<br />
science modeling. These articles provide<br />
a context and examples <strong>of</strong> unique<br />
challenges in predicting trends in social<br />
sciences.<br />
Bringing Order to a Complex Problem<br />
The factors in <strong>the</strong> frameworks discussed above <strong>for</strong>m components <strong>of</strong> a complex system that<br />
interacts in dynamic nonlinear ways and has significant emphasis on social systems. It has<br />
become sometimes painfully obvious that evasion <strong>of</strong> independent consideration <strong>of</strong> <strong>the</strong>se factors<br />
can hinder pursuing outcomes <strong>of</strong> national importance. Accordingly, <strong>the</strong> USG has considerable<br />
interest in descriptive models – with substantial attention and investment in a wide array <strong>of</strong><br />
social science models in recent years – developed to in<strong>for</strong>m a more comprehensive assessment <strong>of</strong><br />
current security conditions and to enlighten potential future security outcomes that <strong>of</strong>ten ignore<br />
geo-political boundaries, that are insensitive to cultural issues, elude legal categorizations and/or<br />
expand beyond national economic conditions.<br />
Assessment <strong>of</strong> regional stability needs to consider indicators associated with political, social and<br />
institutional per<strong>for</strong>mance based on how societies emerge, develop, and operate, as well as<br />
attributes that provide resilience and flexibility. Identifying geopolitical and socio-cultural<br />
indicators that target a confluence <strong>of</strong> factors, and establishing trigger thresholds may prove as<br />
important as defining <strong>the</strong> individual factors <strong>the</strong>mselves. At <strong>the</strong> same time, assessment must also<br />
consider indicators associated with drivers <strong>of</strong> instability and conflict (economic decline/shock,<br />
criminalized security <strong>for</strong>ces, environmental degradation, struggles <strong>for</strong> absolute power, etc.). We<br />
anticipate exploring multiple social science <strong>the</strong>ories, research methods, and well-known<br />
quantitative/statistical analysis techniques (cluster analysis, nodal analysis, cross-correlation, and<br />
factor analysis) in this white paper to (1) independently select relevant indicators (climate<br />
change/change <strong>of</strong> wea<strong>the</strong>r, economy, water, food, pandemics or epidemics, energy), (2)<br />
operationalize and validate indicator coding schemes, (3) clarify interdependencies across<br />
indicators (impact <strong>of</strong> water policy on energy, health and economy), and (4) regroup indicators by<br />
looking at a confluence <strong>of</strong> factors, priorities and contributing factors and drivers <strong>of</strong> conflict and<br />
rallying mechanisms. Finally, assessment should function from an asset-based perspective that is<br />
focused on indigenous capabilities, perceptions, systems, interactions and activities at multiple<br />
levels, at multiple stages, and accounting <strong>for</strong> variability and rate <strong>of</strong> change. The result <strong>of</strong> <strong>the</strong><br />
assessment should enable operators to understand what conditions exist, why <strong>the</strong>y exist, and how<br />
best to trans<strong>for</strong>m <strong>the</strong>m.<br />
This white paper provides a comprehensive examination <strong>of</strong> <strong>the</strong> factors that influence regional<br />
stability. Points to investments and initiatives that will likely improve our ability to predict <strong>the</strong><br />
6
consequences <strong>of</strong> crisis on regional stability can help minimize <strong>the</strong> threat <strong>of</strong> instability. Through<br />
<strong>the</strong> analysis <strong>of</strong> multiple social science <strong>the</strong>ories, research methods, and established quantitative<br />
and statistical analysis techniques, this white paper, Perspectives on Political and Social<br />
Regional Stability Impacted by Global Crises - A Social Science Context, provides a significant<br />
step along <strong>the</strong> path to resolving <strong>the</strong> complex problems critical to <strong>the</strong> future security <strong>of</strong> <strong>the</strong> U.S.<br />
This edited volume, consisting <strong>of</strong> short contributions (5-7 pages each), will describe definitions<br />
<strong>of</strong> stability, will examine assessment approaches, and will extend to encompass strategies <strong>for</strong><br />
tailored assessment and planning.<br />
Clare Lockhart (Section 1) addresses <strong>the</strong> significance <strong>of</strong> “Stability and State Building.” This<br />
paper describes how functioning states are a vital piece <strong>of</strong> global architecture and that as such<br />
<strong>the</strong>y not only provide critical resistance to a variety <strong>of</strong> threats, but <strong>the</strong>y also contribute to <strong>the</strong><br />
collective global goals and stability in <strong>the</strong> 21 st century.<br />
Philip Martin <strong>of</strong> UC-Davis (2.1.A) reviews International Migration. The number <strong>of</strong> international<br />
migrants, defined by <strong>the</strong> UN as persons outside <strong>the</strong>ir country <strong>of</strong> origin a year or more, <strong>for</strong> any<br />
reason and in any legal status, more than doubled between 1990 and 2010. Current default policy<br />
is to manage what is <strong>of</strong>ten seen as out-<strong>of</strong>-control migration and by adjusting <strong>the</strong> rights <strong>of</strong><br />
migrants, leading to conflicts over human rights. Martin’s paper analyzes long-term factors<br />
affecting migration patterns, including aging in industrial countries, rural-urban migration that<br />
spills over national borders, and <strong>the</strong> migration infrastructure <strong>of</strong> agents and networks that moves<br />
people.<br />
Jack Goldstone (2.1.B) continues this <strong>the</strong>me with “Demography and Security,” in which he<br />
discusses <strong>the</strong> five major demographic trends likely to pose significant security challenges to <strong>the</strong><br />
majority <strong>of</strong> developed nations in <strong>the</strong> next two decades. He notes that problems will be caused not<br />
by <strong>the</strong> overall population growth, but by <strong>the</strong> population distortions, in which populations grow<br />
too young or too fast, or become too urbanized.<br />
In “Demographic Security,” Elizabeth Leahy Madsen (2.1C) reviews findings regarding<br />
population and two security issues—outbreaks <strong>of</strong> civil conflict and level <strong>of</strong> democratic<br />
governance—at <strong>the</strong> global scale. The <strong>the</strong>me <strong>of</strong> her paper is that population influences security<br />
and development, and it is an important underlying variable in global stability because <strong>of</strong> its<br />
interactions with o<strong>the</strong>r factors.<br />
David Richards and Ronald Gelleny (2.2.A) address <strong>the</strong> relationship between banking crises and<br />
domestic agitation/internal conflict in “Banking Crises, Collective Protest and Rebellion.” They<br />
examine a dataset <strong>of</strong> 125 countries <strong>for</strong> <strong>the</strong> years 1981 to 2000 and find banking crises to be<br />
systematically associated with greater levels <strong>of</strong> collective protest activities such as riots, antigovernment<br />
demonstrations, and strikes.<br />
An overview <strong>of</strong> work done at <strong>the</strong> Joint Staff J-5 is outlined by Peter Steen (2.2.B) in “Economics<br />
and Political Instability within <strong>the</strong> Global Economic Crisis.” This paper provides a strategic<br />
national-level understanding <strong>of</strong> <strong>the</strong> ongoing global economic crisis, as well as investigates <strong>the</strong><br />
relationship between economics and political instability within that context.<br />
Jerome Delli Priscoli (2.3.A) <strong>of</strong> <strong>the</strong> U.S. Army Corp <strong>of</strong> Engineers discusses <strong>the</strong> role <strong>of</strong> water and<br />
its relationship to international stability with “Water & Security: Cause War or Help Community<br />
Building.” He posits that <strong>the</strong> water and security debate is driven by our notions <strong>of</strong> scarcity, and<br />
7
that ultimately, <strong>the</strong> strategic aspects <strong>of</strong> water lend <strong>the</strong>mselves to finding means <strong>for</strong> cooperation<br />
ra<strong>the</strong>r than conflict.<br />
An interagency team - Olsen and White (USACE), Brekke and Raff (US Bureau <strong>of</strong><br />
Reclamation), Kiang and Turnipseed (USGS) and Pulwarty and Webb (NOAA) - representing<br />
<strong>the</strong> two largest water resources operating agencies (USACE and Reclamation) and two major<br />
water resources data and science agencies (USGS and NOAA) (2.3.B) continue <strong>the</strong> water<br />
dialogue in “Water Resources.” Their paper describes <strong>the</strong> multiple factors that can impact and<br />
stress water resources. Due to those interactions, solutions to water resource problems should<br />
follow a comprehensive approach that integrates multiple objectives across <strong>the</strong> proper spatial and<br />
temporal scales with all relevant stakeholders participating in <strong>the</strong> decision-making process.<br />
In "Water Security and Scarcity: Potential Destabilization in Western Afghanistan," Alex<br />
Dehgan, and Laura Jean Palmer-Moloney (2.3.C) <strong>of</strong>fer a water resources case study. The paper<br />
highlights <strong>the</strong> implications <strong>of</strong> plans <strong>for</strong> upgrading and developing Afghanistan’s water<br />
infrastructure in <strong>the</strong> Helmand River watershed. While crucial to <strong>the</strong> social and economic<br />
development <strong>of</strong> Afghanistan, <strong>the</strong>se plans will also impact transboundary water flow and as a<br />
result, Afghanistan's relations with Iran.<br />
In “Maintaining Geopolitical and Social Stability throughout a Global Economy in an Era <strong>of</strong><br />
Climate Change,” James Diaz (2.4.A) describes <strong>the</strong> uni<strong>for</strong>m agreement in <strong>the</strong> international<br />
scientific community that <strong>the</strong> earth is warming from a variety <strong>of</strong> climatic effects. Ultimately, this<br />
change will have far reaching impacts on human health and public safety. Diaz believes <strong>the</strong><br />
challenge <strong>for</strong> <strong>the</strong> U.S. will be to assume leadership in maintaining geopolitical and social<br />
stability throughout <strong>the</strong> global economy in an era <strong>of</strong> climate change.<br />
Kenneth S. Yalowitz and Ross A. Virginia (2.4.B) address <strong>the</strong> role <strong>of</strong> <strong>the</strong> Arctic in <strong>the</strong> changing<br />
climatic environment in “The Arctic Region: Prospects <strong>for</strong> a Great Game or International<br />
Cooperation.” Their <strong>the</strong>ory is that <strong>the</strong> pace <strong>of</strong> ecological, political, social, and economic change<br />
in <strong>the</strong> Arctic region is accelerating due to <strong>the</strong> warming climate. The paper evaluates <strong>the</strong> prospects<br />
<strong>for</strong> contrasting outcomes in <strong>the</strong> Arctic region: a return to international power politics as states<br />
seek to claim Arctic energy, extend continental shelves, and en<strong>for</strong>ce <strong>the</strong>ir wills through military<br />
means versus <strong>the</strong> emergence <strong>of</strong> increased international cooperation around environmental<br />
protection and sustainable development.<br />
“Changing Climate Impacts to Water Resources: Implications <strong>for</strong> Stability” is authored by<br />
Kathleen D. White, J. Rolf Olsen, Levi D. Brekke, David A. Raff, Roger S. Pulwarty, and Robert<br />
Webb (2.4.C), all from <strong>the</strong> U.S. Army Corp <strong>of</strong> Engineers and discusses climate change in <strong>the</strong><br />
context <strong>of</strong> water resources, including <strong>the</strong> potential implications <strong>for</strong> stability issues. They argue<br />
that water resource managers are already accustomed to dealing with changes and <strong>the</strong>re<strong>for</strong>e <strong>of</strong>fer<br />
a potential resource to utilize <strong>for</strong> <strong>the</strong> larger issue if <strong>the</strong>y are prepared to act quickly. The authors<br />
propose a strategy encompassing both <strong>the</strong> potential <strong>for</strong> increased conflict over water and<br />
increased cooperation by water resources managers to enhance planning <strong>for</strong> stability.<br />
An introduction to <strong>the</strong> role <strong>of</strong> energy begins with “Energy, Africa and Civil Conflict: What Does<br />
<strong>the</strong> Future Hold?” by Richard J. Stoll (2.5.A). Stoll notes that Africa will likely become<br />
increasingly important to <strong>the</strong> U.S. as a source <strong>of</strong> resources, including oil. However, Africa is also<br />
rife with civil conflict. Ongoing civil conflict makes it very difficult to establish or continue <strong>the</strong><br />
exportation <strong>of</strong> natural resources. There<strong>for</strong>e, it is in <strong>the</strong> U.S.’s best interest to address <strong>the</strong> issue <strong>of</strong><br />
civil conflict in Africa.<br />
8
Douglas J. Arent (2.5.B) continues this topic <strong>of</strong> Energy with “Energy: A <strong>National</strong> and Global<br />
Issue,” and states that new energy pathways are a necessity to balance <strong>the</strong> increasingly complex<br />
policy goals <strong>of</strong> accessibility, environmental concerns, geopolitical issues, and af<strong>for</strong>dability.<br />
Continuing reliance on geographically concentrated oil and natural gas to feed <strong>the</strong> ongoing<br />
demand will threaten international energy security.<br />
Jeffrey Steiner and Timothy Griffin (2.6.A) address <strong>the</strong> role <strong>of</strong> food in relation to <strong>the</strong> larger<br />
picture <strong>of</strong> Stability in “World Food Availability and Natural Land Resources Base.” Steiner and<br />
Griffin note that <strong>the</strong>re is a need to consider how changing population and wealth patterns will not<br />
only impact food availability and consumption patterns, but also our inter-related needs <strong>for</strong><br />
energy and water. This is increasingly important in relation to <strong>the</strong> Earth’s finite land mass.<br />
Donald Suarez (2.6.B) follows with “Food Production in Arid Regions Due to Salinity.” He<br />
discusses <strong>the</strong> issue <strong>of</strong> <strong>the</strong> water supply, <strong>the</strong> impact <strong>of</strong> salinity, <strong>the</strong> potential <strong>for</strong> water reuse—both<br />
<strong>of</strong> irrigation drainage and municipal waste water—and utilization <strong>of</strong> saline waters <strong>for</strong> crop<br />
production. Improvements in irrigation practices, investment in new technologies, and<br />
development <strong>of</strong> salt-tolerant plant varieties may enable <strong>the</strong>se regions to utilize more abundant<br />
brackish and saline waters <strong>for</strong> irrigation and may minimize degradation <strong>of</strong> fresh water supplies.<br />
The discussion <strong>of</strong> Epidemics begins with “Epidemics: A Thumbnail Sketch <strong>of</strong> <strong>the</strong> Past, Present<br />
and Future,” by Debarati Guha-Spair (2.7.A). Disease outbreaks have significant impacts on<br />
factors that are critical <strong>for</strong> national and international stability. There are clear disparities between<br />
rich and poor nations and <strong>the</strong>ir abilities to react and control <strong>the</strong> situation. Balancing policies to<br />
address <strong>the</strong> problems will also be a challenge <strong>for</strong> global disease control.<br />
The Epidemics discussion continues with “Infectious Disease and Social Instability: Prevent,<br />
Respond, Repair,” by Daniel Strickman (2.7B). The effects <strong>of</strong> infectious diseases on social<br />
instability can be devastating and society’s ability to prepare and respond to an epidemic can<br />
<strong>of</strong>fer social stability. The concept <strong>of</strong> Integrated Disease Management is presented as a construct<br />
to mitigate <strong>the</strong> societal impacts <strong>of</strong> infectious disease using <strong>the</strong> functions <strong>of</strong> risk assessment,<br />
surveillance, prevention and control, and sustainable support.<br />
The role <strong>of</strong> social science modeling and its approaches to analysis is presented in Section Four.<br />
Victor Asal and Steve Shellman (3.1) begin with “Analyzing Political & Social Regional<br />
Stability with Statistics: Challenges and Opportunities.” They provide an overview <strong>of</strong> some <strong>of</strong><br />
<strong>the</strong> research on <strong>the</strong> causes <strong>of</strong> stability and instability done using statistical analysis. A discussion<br />
<strong>of</strong> <strong>the</strong> ef<strong>for</strong>ts made in <strong>the</strong> area <strong>of</strong> <strong>for</strong>ecasting is presented, as well as <strong>the</strong> challenges <strong>of</strong> statistical<br />
analysis related to issues <strong>of</strong> data and method.<br />
Larry Kuznar (3.2) presents <strong>the</strong> anthropological view in “The Social Stability <strong>of</strong> Societies: An<br />
Anthropological View.” He notes that instability does not appear overnight and that a longer<br />
term historical perspective is necessary to understand <strong>the</strong> latent factors that accumulate slowly<br />
and <strong>the</strong>n result in dramatic social collapse. Anthropology provides this perspective, and this<br />
chapter reviews insights concerning why some societies fail while o<strong>the</strong>rs prosper.<br />
“Quantitative Content” is presented by Laura Leets (3.3) and focuses on <strong>the</strong> central concepts<br />
underlying content analysis and how to conduct effective research. Content analysis is a<br />
technique <strong>for</strong> ga<strong>the</strong>ring and analyzing <strong>the</strong> content <strong>of</strong> text. Text can be anything written, visual or<br />
spoken, which serves as a medium <strong>for</strong> communication. Content analysis can be utilized in ei<strong>the</strong>r<br />
qualitative or quantitative <strong>for</strong>mat; however, this submission focuses on <strong>the</strong> quantitative uses.<br />
9
Joe Hewitt (3.4) contributes “The Peace and Conflict Instability Ledger Ranking States on Future<br />
Risks.” He presents country rankings from <strong>the</strong> 2010 Peace and Conflict Instability Ledger which<br />
are based on newly calculated risk estimates. The ledger represents a syn<strong>the</strong>sis <strong>of</strong> some <strong>of</strong> <strong>the</strong><br />
leading research on explaining and <strong>for</strong>ecasting state instability. Hewitt also discusses some <strong>of</strong> <strong>the</strong><br />
key results from <strong>the</strong> analysis, including <strong>the</strong> pivotal relationship between democratization and risk<br />
<strong>of</strong> instability.<br />
Tom Rieger (3.5) provides a discussion into <strong>the</strong> problems related to developing stability models<br />
in “Perception is Reality: Stability through <strong>the</strong> Eyes <strong>of</strong> <strong>the</strong> Populace,” <strong>the</strong> largest problem being<br />
<strong>the</strong> limitations due to what sources are available. He describes how having a robust model <strong>of</strong> <strong>the</strong><br />
level <strong>of</strong> stability in a given population based on perceptions <strong>of</strong> conditions would be a major<br />
contribution to <strong>the</strong> ability to plan <strong>for</strong>—and possibly help avoid—significant human suffering as a<br />
result <strong>of</strong> instability.<br />
In “Assessing <strong>the</strong> stability <strong>of</strong> Interstate Relationships Using Game Theory,” Frank Zagare (3.6)<br />
explains <strong>the</strong> sense in which game models can be used to establish <strong>the</strong> stability, or lack <strong>the</strong>re<strong>of</strong>, <strong>of</strong><br />
typical deterrence relationships and to understand <strong>the</strong> context <strong>of</strong> <strong>the</strong>ir policy recommendations.<br />
Game-<strong>the</strong>oretic models are a natural and intuitively satisfying framework in which to assess <strong>the</strong><br />
stability <strong>of</strong> contentious inter-state relationships.<br />
Robert Axelrod (3.7) presents a simple <strong>the</strong>oretical framework to enhance insight about<br />
partnerships <strong>for</strong> economic development. “Theoretical Foundations <strong>of</strong> Partnerships <strong>for</strong> Economic<br />
Development” clarifies <strong>the</strong> idea <strong>of</strong> <strong>the</strong>oretical foundations <strong>of</strong> partnerships by analyzing<br />
partnerships using game <strong>the</strong>ory <strong>of</strong> an iterated prisoner’s dilemma. The analysis <strong>the</strong>n reveals<br />
implications <strong>of</strong> selecting a partner, setting up a partnership, choosing a modus operandi, building<br />
trust, achieving selectivity, and per<strong>for</strong>ming monitoring and evaluation.<br />
“Process Query System as a Framework <strong>for</strong> Modeling and Analysis <strong>of</strong> Regional Stability” is<br />
authored by George Cybenko and Douglas Madory (3.8). In response to similar problems across<br />
a variety <strong>of</strong> application domains, suggesting an underlying common analytic foundation, <strong>the</strong>y<br />
propose two technologies—Process Query Systems (PQS) and Human Behavioral Modeling<br />
Language (HBML)—which could <strong>for</strong>m <strong>the</strong> foundation <strong>for</strong> a standard, common computational<br />
capability. This capability could <strong>the</strong>n be used to represent economic, health, political and<br />
environmental models related to regional stability, and reasoning about those models in <strong>the</strong><br />
context <strong>of</strong> data, observations and o<strong>the</strong>r evidence.<br />
The focus <strong>of</strong> Stephen M. Millett’s contribution (3.9), “The Use <strong>of</strong> Cross-Impact Analysis <strong>for</strong><br />
Modeling, Simulation and Forecasting,” is to assert that cross-impact analysis may be just as<br />
effective, and arguably quicker, less expensive, and more robust, than systems dynamics. Millett<br />
asserts that it is a complementary approach that provides fur<strong>the</strong>r <strong>for</strong>esight <strong>for</strong> <strong>the</strong> benefit <strong>of</strong> both<br />
<strong>for</strong>ward-looking analysts and decision-makers, and he recommends fur<strong>the</strong>r exploration as a<br />
supplementary approach to system dynamics, as well as o<strong>the</strong>r modeling, simulation and<br />
<strong>for</strong>ecasting methods.<br />
The Center <strong>for</strong> Excellence in Disaster Management and Humanitarian Assistance (3.10) submits<br />
“Development <strong>of</strong> a Framework <strong>for</strong> Action: Community Resiliency as a Means <strong>of</strong> Achieving<br />
Stability,” which outlines <strong>the</strong>ir process <strong>of</strong> creating a defining framework. The framework would<br />
determine what makes an individual household, community, and society resilient be<strong>for</strong>e, during,<br />
and after disasters.<br />
10
Finally, Section Five looks at two case studies applicable to <strong>the</strong> Stability issue. First, Robert<br />
Popp (4.1) reports on <strong>the</strong> Sudan in “Sudan Strategic Assessment: A Case Study <strong>of</strong> Social Science<br />
Modeling.” This assessment was a strategic level pro<strong>of</strong>-<strong>of</strong>-concept study in which a combination<br />
<strong>of</strong> quantitative and computational social science modeling and analysis approaches were<br />
developed and applied to better understand a complex “state” lacking true borders and<br />
encompassing many competing interests and complexities. Results demonstrated how multiple<br />
quantitative and computational social science models in conjunction with SMEs and o<strong>the</strong>r<br />
analyses are an effective, evolutionary step in <strong>the</strong> analyst toolkit, especially when <strong>the</strong> need is to<br />
provide additional lenses to look at highly complex and ambiguous stability problems (like <strong>the</strong><br />
Sudan) to in<strong>for</strong>m <strong>the</strong> decision-making process.<br />
Second, Tom Mullen (4.2) presents “Analyzing Stability Challenges in Africa: A Case Study.”<br />
He notes that, with resources spread thin, we need better ways to rapidly understand what<br />
matters in each new situation, and to better understand why particular actions worked (and o<strong>the</strong>rs<br />
did not), to aid in determining where and how those lessons might be more likely to work well.<br />
Assessment <strong>of</strong> highly complex situations quickly improves <strong>the</strong> ability to take rapid, effective<br />
action. Mullen’s case study attempts to provide lessons drawn from analyzing a number <strong>of</strong><br />
stability situations on <strong>the</strong> continent <strong>of</strong> Africa over <strong>the</strong> past three years, with a focus on lessons in<br />
analyzing complex stability situations ra<strong>the</strong>r than specific actions to apply in a wide range <strong>of</strong><br />
situations.<br />
↑ Back to <strong>the</strong> top<br />
11
1. Stability and State Building (Clare Lockhart)<br />
Author and Organization: Clare Lockhart, The Institute <strong>for</strong> State Effectiveness<br />
Contact In<strong>for</strong>mation: clareelockhart@gmail.com<br />
Introduction<br />
The international order created sixty years ago in <strong>the</strong> wake <strong>of</strong> World War II assumed a world<br />
premised on a fabric <strong>of</strong> states, each delivering core services to citizens and fulfilling its<br />
obligations to <strong>the</strong> global community <strong>of</strong> states. The visionary architects <strong>of</strong> that order succeeded in<br />
creating institutions that underpinned democratic stability and market-based economies in <strong>the</strong><br />
United States, and in Europe and Asia. While those states are not perfect, <strong>the</strong>y none<strong>the</strong>less<br />
provide <strong>the</strong>ir citizens with a degree <strong>of</strong> resilience against looming global threats, and <strong>the</strong>y remain<br />
<strong>the</strong> best instrument through which <strong>the</strong> collective aspirations <strong>of</strong> 21 st century humanity may be<br />
realized.<br />
Meanwhile, nearly two billion people remain locked out <strong>of</strong> stability and prosperity because <strong>the</strong>y<br />
live in states that have been unwilling or unable to deliver even core services. These states<br />
prevent <strong>the</strong>ir citizens from accessing <strong>the</strong> opportunities <strong>of</strong> globalization, but <strong>the</strong>y have also been<br />
unable to shield <strong>the</strong>ir citizens from <strong>the</strong> darker side <strong>of</strong> globalization. Few citizens in <strong>the</strong>se<br />
countries can participate legitimately in <strong>the</strong> unprecedented prosperity and opportunity unleashed<br />
in <strong>the</strong> last 60 years, although, through globalized media, citizens see ano<strong>the</strong>r world full <strong>of</strong><br />
opportunity, innovation and prosperity which defines <strong>the</strong>ir expectations. At <strong>the</strong> same time, <strong>the</strong>ir<br />
states are powerless over—if not complicit with—global networks <strong>of</strong> criminality and violence<br />
that thrive upon disenfranchised populations, uncontrolled territory, and weak state institutions.<br />
Such states cannot hope to meet <strong>the</strong> array <strong>of</strong> challenges presented by climate change, resource<br />
shortages, pandemics, and food and fuel price shocks. Nor can <strong>the</strong>y help position <strong>the</strong>ir citizens to<br />
take advantage <strong>of</strong> emerging global opportunities. Refugee flows, humanitarian action, and<br />
trafficking <strong>of</strong> people, arms and drugs are all symptoms <strong>of</strong> this arc <strong>of</strong> state dysfunction.<br />
The international community af<strong>for</strong>ds <strong>the</strong>se states <strong>the</strong> same legal authority that it af<strong>for</strong>ds those<br />
states actually per<strong>for</strong>ming core functions <strong>for</strong> <strong>the</strong>ir people. At <strong>the</strong> same time, recognizing <strong>the</strong><br />
constellation <strong>of</strong> problems emanating from weak or dysfunctional states, <strong>the</strong> international<br />
community draws on a pool <strong>of</strong> international institutions designed to reduce poverty, address<br />
serious humanitarian crises, and, in some cases, resort to <strong>for</strong>ce. These institutions, while staffed<br />
by competent and dedicated people, have relied upon instruments devised <strong>for</strong> a different world,<br />
and institutional silos and cultures have hampered collective and systemic understanding <strong>of</strong> <strong>the</strong><br />
problem.<br />
This paper sets out how functioning states are vital to stable global architecture, as critical<br />
providers <strong>of</strong> resilience against a range <strong>of</strong> threats, and as key instruments <strong>for</strong> <strong>the</strong> collective<br />
realization <strong>of</strong> aspirations in <strong>the</strong> 21 st century. It considers (1) <strong>the</strong> functions that a state should<br />
per<strong>for</strong>m <strong>for</strong> its citizens in <strong>the</strong> current context, (2) a framework through which state functionality<br />
could be catalyzed, (3) and how <strong>the</strong> approach described was applied in Afghanistan between<br />
2002 and 2004. Finally, this paper suggests emerging lessons and considers aspects <strong>of</strong> an<br />
approach to future state-building ef<strong>for</strong>ts in Afghanistan.<br />
12
Stability and <strong>the</strong> State<br />
For states to be stable, <strong>the</strong>y must establish and maintain relations <strong>of</strong> trust with <strong>the</strong>ir citizens.<br />
Citizens’ loss <strong>of</strong> trust in <strong>the</strong> ability <strong>of</strong> <strong>the</strong>ir state to create an inclusive political, social and<br />
economic order made predictable by rule <strong>of</strong> law will erode <strong>the</strong> state’s legitimacy. This erosion<br />
has been characterized by “an increase in illegality, in<strong>for</strong>mality, and criminality in <strong>the</strong> economy;<br />
ineffective delivery <strong>of</strong> basic services; failure to maintain or expand essential infrastructure;<br />
increase in corruption; and appropriation <strong>of</strong> public assets <strong>for</strong> private gain. As a result,<br />
administrative control weakens and <strong>the</strong> bureaucracy is seen as an instrument <strong>for</strong> abuse <strong>of</strong> power,<br />
in turn leading to a crisis in public finances—where both revenue and expenditure are<br />
unpredictable and budgeting becomes an exercise in emergency management.” 1 Ultimately <strong>the</strong><br />
state resorts to using violence internally, and armed groups begin to appear, defying state<br />
authority and taking control <strong>of</strong> sections <strong>of</strong> territory.<br />
State Dysfunction and Regional Instability<br />
The kind <strong>of</strong> instability described above poses pr<strong>of</strong>ound regional and international challenges. For<br />
<strong>the</strong>ir neighbors, such states will be a constant cause <strong>for</strong> concern. Criminal networks will take<br />
advantage <strong>of</strong> such poorly controlled environments, and <strong>the</strong>y will also operate across state borders<br />
through <strong>the</strong> trafficking <strong>of</strong> illicit goods such as drugs and arms, and o<strong>the</strong>r criminal activities. Such<br />
activities subvert rule <strong>of</strong> law and threaten stability in neighbors, particularly neighbors whose<br />
own legitimacy and capabilities are fragile. Ultimately, dysfunctional states may become bases<br />
<strong>for</strong> insurgent groups operating against neighboring states. Insurgents will interact in complex<br />
ways with criminal networks and will engage in criminal activities <strong>the</strong>mselves in order to finance<br />
and equip <strong>the</strong>ir activities. Unless states can be rehabilitated, <strong>the</strong>se dark features <strong>of</strong> globalization<br />
are extremely difficult and expensive to stifle.<br />
The State and Global Challenges<br />
As globalization has accelerated, new threats have arisen. Lessons from <strong>the</strong> first wave <strong>of</strong><br />
globalization would indicate that <strong>the</strong> spontaneous character <strong>of</strong> globalization demands that <strong>the</strong><br />
process be led ra<strong>the</strong>r than treated reactively. In this context, <strong>the</strong> task <strong>of</strong> building effective states is<br />
both more <strong>for</strong>midable and more urgent. In <strong>the</strong> 21 st century, global challenges ranging from<br />
climate change to sustainable energy and food security, to appropriate management <strong>of</strong><br />
international financial markets, all demand marshaling collective resources. Not <strong>the</strong> least <strong>of</strong> <strong>the</strong>se<br />
demands is <strong>the</strong> need <strong>for</strong> political resources, as no single state or group <strong>of</strong> states has <strong>the</strong> capacity<br />
to confront such challenges single-handedly. The task <strong>of</strong> catalyzing <strong>the</strong> emergence <strong>of</strong> effective<br />
states is essential <strong>for</strong> heading <strong>of</strong>f global challenges that threaten stability.<br />
Finally in this context, one <strong>of</strong> <strong>the</strong> key challenges to global stability is <strong>the</strong> arc <strong>of</strong> state dysfunction<br />
itself, given <strong>the</strong> constellation <strong>of</strong> regional and global criminal and military risks, and <strong>the</strong> likely<br />
humanitarian implications <strong>of</strong> ongoing state dysfunction.<br />
The State and <strong>National</strong> Resilience<br />
Citizens across <strong>the</strong> world are exposed daily to an array <strong>of</strong> powerful global <strong>for</strong>ces over which, as<br />
individuals, <strong>the</strong>y exert little influence. An effective state, however, can plan <strong>for</strong> and respond to<br />
<strong>the</strong> impact <strong>of</strong> such <strong>for</strong>ces, whe<strong>the</strong>r through implementing early warning systems and evacuation<br />
procedures <strong>for</strong> hurricanes, through providing reserves <strong>of</strong> food and water to insulate populations<br />
from shortages, maintaining cash reserves, or implementing public health interventions. The<br />
ability to effectively prepare <strong>for</strong> and prevent or mitigate <strong>the</strong> effects <strong>of</strong> a crisis is a key<br />
13
esponsibility <strong>for</strong> states, and <strong>the</strong>ir success or failure in building national resilience and partnering<br />
with o<strong>the</strong>r states to tackle international challenges will actively generate or undermine stability,<br />
because citizens judge effectiveness by per<strong>for</strong>mance.<br />
The State and Collective Aspirations<br />
On <strong>the</strong> o<strong>the</strong>r hand, while globalization has extended new opportunities and released<br />
unprecedented wealth, dysfunctional states continue to prevent <strong>the</strong>ir citizens from accessing<br />
ei<strong>the</strong>r. Instability stifles <strong>for</strong>eign investment, and failure to invest in human capital shuts doors <strong>of</strong><br />
education and economic opportunity to millions <strong>of</strong> people. Fur<strong>the</strong>rmore, instability stifles <strong>the</strong><br />
economy’s capacity to develop in <strong>the</strong> longer term, and <strong>the</strong>re<strong>for</strong>e future state revenue.<br />
Disenfranchisement naturally breeds disillusionment, and in contexts where lost generations <strong>of</strong><br />
youth have been denied an education, steady employment, or a stake in <strong>the</strong> future, predictably<br />
volatile consequences follow. Failure to meet collective aspirations is a symptom <strong>of</strong> state<br />
dysfunction and a driver <strong>of</strong> ongoing instability.<br />
1.1 The Functions <strong>of</strong> <strong>the</strong> State<br />
While agreeing that ineffective states are at <strong>the</strong> heart <strong>of</strong> enormous and overlapping global<br />
problems, international responses to state failure have frequently fallen short <strong>of</strong> <strong>the</strong>ir goals. 2 A<br />
key reason <strong>for</strong> this has been lack <strong>of</strong> understanding or consensus on what tasks a state needs to<br />
per<strong>for</strong>m in order to serve its citizens in <strong>the</strong> 21st century. Without this agreement, <strong>the</strong><br />
international community has not been able to devise instruments <strong>for</strong> helping a government<br />
acquire <strong>the</strong> capacity to serve its citizens, nor to understand <strong>the</strong> necessary timeframes, sequencing<br />
or interdependencies between state functions. While in recent years <strong>the</strong>re has been an emerging<br />
consensus on <strong>the</strong> need to build functioning states—to mitigate threats, to realize aspirations <strong>for</strong><br />
citizens, and to act as essential pillars <strong>of</strong> a functional and stable international order—consensus<br />
on a coherent approach remains vital but pending work.<br />
Because agreement on core functions is a prerequisite <strong>for</strong> concerted and effective international<br />
action, <strong>the</strong> Institute <strong>for</strong> State Effectiveness (ISE) has proposed that <strong>the</strong> state should per<strong>for</strong>m ten<br />
core functions <strong>for</strong> its citizens in <strong>the</strong> 21 st century. 3 It is hoped that <strong>the</strong>se will be subjected to<br />
discussion and debate, but based on reading <strong>of</strong> history, engagement with international<br />
development, and experience with <strong>the</strong> challenge <strong>of</strong> state-building in some <strong>of</strong> its most difficult<br />
contexts, ISE has proposed <strong>the</strong> following ten functions as critical.<br />
Rule <strong>of</strong> Law<br />
The rule <strong>of</strong> law is perhaps <strong>the</strong> most important function in that it defines <strong>the</strong> governance<br />
arrangements <strong>for</strong> all o<strong>the</strong>r functions. It sets parameters <strong>for</strong> behavior within society, opening<br />
opportunities while setting constraints. It is <strong>the</strong> glue that binds all aspects <strong>of</strong> <strong>the</strong> state toge<strong>the</strong>r,<br />
defining limits <strong>of</strong> power, rights and responsibilities <strong>for</strong> citizens and <strong>for</strong> <strong>the</strong> state itself.<br />
Monopoly on <strong>the</strong> Legitimate Means <strong>of</strong> Violence<br />
Weber’s celebrated definition <strong>of</strong> <strong>the</strong> state emphasizes this function above all o<strong>the</strong>rs, but<br />
none<strong>the</strong>less stresses <strong>the</strong> need <strong>for</strong> legitimate monopolization <strong>of</strong> <strong>the</strong> means <strong>of</strong> violence. Beyond<br />
achieving actual control over <strong>the</strong> means <strong>of</strong> violence, <strong>the</strong> state needs to subordinate decisions<br />
about <strong>the</strong> use <strong>of</strong> violence to rules recognized as legitimate.<br />
14
Administrative Control<br />
When a state is managed by a competitively recruited pr<strong>of</strong>essional cadre, administrative control<br />
is achieved by organizing a state’s functions and spatial territory via a unified body <strong>of</strong> rules and<br />
practices and a hierarchy <strong>of</strong> administrative units per<strong>for</strong>ming specialized functions.<br />
Sound Management <strong>of</strong> Public Finances<br />
Public goals can only be achieved through sound management <strong>of</strong> public finances. The budget<br />
acts as a lens through which hard decisions are made about competing priorities so that resources<br />
are allocated to translate aspirations into outcomes. Without effective systems <strong>for</strong> collecting and<br />
allocating revenues, <strong>the</strong> state will be unable to deliver services adequately.<br />
Investments in Human Capital<br />
Stability depends on <strong>for</strong>ging paths <strong>of</strong> upward social mobility and creating stakeholders in <strong>the</strong><br />
future. Such investments are <strong>the</strong> key to building domestic capacity across <strong>the</strong> full spectrum <strong>of</strong><br />
state and market activity, and as human capital becomes more important than o<strong>the</strong>r <strong>for</strong>ms <strong>of</strong><br />
capital, public investment in building human capital becomes increasingly important.<br />
Creation <strong>of</strong> Citizenship Rights through Social Policy<br />
Creating stability within <strong>the</strong> state means overcoming fragmented identities and a politics defined<br />
by zero-sum competition <strong>for</strong> control over resources by competing groups. Social policy geared to<br />
equality <strong>of</strong> opportunity, rights and responsibilities—cutting across gender, ethnicity, race, class,<br />
spatial location, and religion—can overcome this divisiveness and weave a social fabric <strong>of</strong><br />
national unity and a sense <strong>of</strong> shared destiny.<br />
Provision <strong>of</strong> Infrastructure Services<br />
In order to provide security, administration, investment in human capital, and support to <strong>the</strong><br />
market economy is <strong>the</strong> need <strong>for</strong> adequate transportation, power, water, communications and<br />
pipelines. Exploring and harnessing regional potential in infrastructure can not only create<br />
efficiencies, but can also create virtuous webs <strong>of</strong> cooperation and closer ties between states.<br />
Formation <strong>of</strong> a Market<br />
The state has critical roles to fulfill in creation and expansion <strong>of</strong> <strong>the</strong> market. It sets and en<strong>for</strong>ces<br />
<strong>the</strong> rules <strong>for</strong> commercial activity, supports <strong>the</strong> operation and development <strong>of</strong> private enterprise,<br />
and intervenes at times <strong>of</strong> market failure.<br />
Management <strong>of</strong> Public Assets<br />
The state wields an immense variety <strong>of</strong> public assets, including fixed assets like land and<br />
buildings, to natural capital, to intangible assets such as <strong>the</strong> licensing <strong>of</strong> businesses. These assets<br />
can be put to work to achieve tremendous collective benefits to citizens. Managing <strong>the</strong>se<br />
processes by defining legal frameworks, conferring rights, regulating and arbitrating, are key<br />
tasks <strong>for</strong> <strong>the</strong> state to fulfill in this regard.<br />
Effective Public Borrowing<br />
Effective public borrowing enables investments in human, physical, institutional, and social<br />
capital. If made wisely, such investments can more than pay back <strong>the</strong> debts incurred. On <strong>the</strong><br />
o<strong>the</strong>r hand, poor decisions can lead to debt crisis. The ability to steward borrowing effectively is<br />
<strong>the</strong>re<strong>for</strong>e a key element <strong>of</strong> state effectiveness and stability.<br />
15
1.2 Catalyzing State Functionality: Afghanistan 2002–2004<br />
The global aid system was designed <strong>for</strong> a different era. It assumed a world <strong>of</strong> functioning states<br />
that lacked financial capital and needed to build infrastructure. As states <strong>the</strong>mselves weakened,<br />
<strong>the</strong> aid system gradually began to assume a variety <strong>of</strong> functions on behalf <strong>of</strong> states. It evolved a<br />
series <strong>of</strong> specialized agencies that compete <strong>for</strong> resources and that exist in organizational<br />
stovepipes, with <strong>the</strong> result that <strong>the</strong>y <strong>of</strong>ten operate in splendid isolation from one ano<strong>the</strong>r. The<br />
main instruments <strong>of</strong> <strong>the</strong> aid system, <strong>the</strong> developmental project and use <strong>of</strong> technical assistance,<br />
are widely recognized to undermine state functionality by creating fragmentation, waste, and<br />
parallel structures, and by drawing government staff away from state posts to act as support staff<br />
<strong>for</strong> <strong>the</strong> international community.<br />
In 2001, following <strong>the</strong> fall <strong>of</strong> <strong>the</strong> Taliban, <strong>the</strong>se traditional aid approaches were mobilized by aid<br />
agencies to be applied in Afghanistan. However, cognizant <strong>of</strong> <strong>the</strong> problems that such a model<br />
would cause <strong>for</strong> Afghanistan, a small team <strong>of</strong> Afghan and international staff, in partnership with<br />
global leaders, believing conventional modes <strong>of</strong> assistance to be unsuited to Afghanistan’s needs,<br />
designed and began to apply an alternative model intended to overcome and avoid <strong>the</strong> problems<br />
<strong>of</strong> <strong>the</strong> global aid system.<br />
Emerging from a devastating series <strong>of</strong> conflicts lasting more than 20 years, Afghanistan faced<br />
<strong>the</strong> daunting task <strong>of</strong> reconstituting and rebuilding <strong>the</strong> entire social, political and economic fabric<br />
<strong>of</strong> <strong>the</strong> state. Afghanistan had consistently ranked among <strong>the</strong> least developed countries in <strong>the</strong><br />
world and was struggling with an estimated $240 billion in destroyed infrastructure and <strong>for</strong>egone<br />
economic opportunities since 1979. The task seemed overwhelming, and <strong>for</strong> key decisionmakers<br />
on both <strong>the</strong> government and donor sides, <strong>the</strong> choice <strong>of</strong> what to do and where to begin<br />
was not an easy one. In late 2001, an unrepresentative Interim Administration was established<br />
through a UN-mediated process in Bonn to begin <strong>the</strong> task <strong>of</strong> establishing a legitimate political<br />
center and directing national development ef<strong>for</strong>ts.<br />
In <strong>the</strong> same period, a range <strong>of</strong> development and security actors arrived in <strong>the</strong> country, each with<br />
differing aims and objectives. The International Security Assistance Force (ISAF), established in<br />
Kabul, was primarily tasked with keeping order and preventing political unrest in <strong>the</strong> capital city.<br />
Coalition <strong>for</strong>ces were present across <strong>the</strong> country to consolidate defeat <strong>of</strong> <strong>the</strong> Taliban and fight <strong>the</strong><br />
nascent terrorist insurgency. The World Bank and UN agencies led a needs assessment to help<br />
<strong>the</strong> government establish <strong>the</strong> extent <strong>of</strong> reconstruction needs and to prioritize responses. A large<br />
number <strong>of</strong> donor agencies, UN bodies, and nongovernment organizations (NGOs) established<br />
<strong>the</strong>mselves throughout <strong>the</strong> country to tackle problems ranging from infrastructure reconstruction<br />
to humanitarian assistance. At <strong>the</strong> end <strong>of</strong> 2001, without ei<strong>the</strong>r an acknowledged leader or a<br />
process <strong>for</strong> <strong>the</strong> post-war reconstruction, poverty-reduction, and humanitarian ef<strong>for</strong>ts,<br />
development ef<strong>for</strong>ts were confused and <strong>of</strong>ten contradictory. Indeed, as early as January 2002,<br />
many reconstruction teams arrived from around <strong>the</strong> world to undertake identical projects.<br />
As <strong>the</strong> political process began to establish a legitimate political center, attention turned to <strong>the</strong><br />
problem <strong>of</strong> concerting national and international activities. From <strong>the</strong> outset, a team argued <strong>the</strong><br />
case <strong>for</strong> putting a state-building approach at <strong>the</strong> center <strong>of</strong> <strong>the</strong> agenda and designed a distinctive<br />
series <strong>of</strong> “national programs” as vehicles <strong>for</strong> concerting <strong>the</strong> plethora <strong>of</strong> national and international<br />
actors behind a common strategic vision geared to building state functionality.<br />
16
1.3 <strong>National</strong> Programs in Afghanistan<br />
The first step was to <strong>for</strong>ge a consensus between Afghan citizens, <strong>the</strong> Afghan government, and<br />
<strong>the</strong>ir international partners, that <strong>the</strong> overarching goal in Afghanistan was to create a legitimate<br />
and effective state capable <strong>of</strong> delivering services to <strong>the</strong> people and fulfilling its international<br />
obligations. This consensus was built around a vision, articulated by <strong>the</strong> government, and refined<br />
in a <strong>National</strong> Development Framework (NDF). This framework included three pillars:<br />
(1) Human Capital and Social Protection, (2) Physical Infrastructure, and (3) Trade and<br />
Investment, Public Administration and Rule <strong>of</strong> Law/Security, and articulated a series <strong>of</strong> crosscutting<br />
issues, such as gender equity, security and rule <strong>of</strong> law, and administrative and financial<br />
re<strong>for</strong>m. These three pillars were <strong>the</strong>n addressed through a series <strong>of</strong> twelve <strong>National</strong> Programs.<br />
The NDF underpinned <strong>the</strong> <strong>National</strong> Development Budget, which costed <strong>the</strong> programs. The vision<br />
and strategy laid out during <strong>the</strong> course <strong>of</strong> 2002 was subsequently framed within a comprehensive<br />
document, Securing Afghanistan’s Future, presented to an assembled group <strong>of</strong> 62 finance and<br />
<strong>for</strong>eign ministers from around <strong>the</strong> world on 31 st March and April 1 st 2004 in Berlin.<br />
<strong>National</strong> Programs were designed to overcome <strong>the</strong> fragmentation and confusion <strong>of</strong> <strong>the</strong> project<br />
model. They serve as implementation mechanisms to enable a government to per<strong>for</strong>m state<br />
functions throughout its territory in an effective and transparent manner. This is accomplished by<br />
mobilizing actors (including government, private sector and/or civil society) to per<strong>for</strong>m critical<br />
tasks, translating <strong>the</strong> vision and mission <strong>for</strong> each state function into credible outcomes. By<br />
providing a unified set <strong>of</strong> rules, clear decision rights and obligations were established, generating<br />
accountability. The design <strong>of</strong> <strong>the</strong> programs was intended to harness Afghan assets and to recast<br />
international assistance as catalytic to <strong>the</strong> state-building process. The end result <strong>of</strong> <strong>the</strong>se<br />
programs was an integrated architecture <strong>for</strong> facilitating good governance and development at<br />
various levels <strong>of</strong> government.<br />
<strong>National</strong> Programs seek to avoid recognized problems with traditional approaches to<br />
development assistance by harnessing national policy oversight to national capacity and<br />
combining it with extensive outreach and consultation to ensure transparent, effective,<br />
accountable aid delivery. The Afghan economic team, in partnership with a group <strong>of</strong> creative<br />
international actors, focused relentlessly on implementation <strong>of</strong> <strong>the</strong>se programs during 2001–<br />
2004. <strong>National</strong> Programs in Afghanistan included those discussed below.<br />
<strong>National</strong> Solidarity Program (NSP)<br />
The first program to be designed by <strong>the</strong> Government, in partnership with <strong>the</strong> World Bank and<br />
UN Habitat, <strong>the</strong> NSP was designed to empower communities to manage <strong>the</strong> reconstruction<br />
process. 4 The government provided block grants <strong>of</strong> approximately $20,000 to every village in <strong>the</strong><br />
country against <strong>the</strong> requirement that each village elect a leadership council by secret ballot, hold<br />
participatory meetings to design recovery plans and projects, and post account documents in a<br />
public place. While <strong>the</strong> national government set <strong>the</strong> rules and managed financing, NGOs were<br />
contracted to manage <strong>the</strong> personnel and organizational issues, and an international firm was hired<br />
to provide management and oversight services. Thus <strong>the</strong> government provided a legal framework<br />
to empower a range <strong>of</strong> actors, including communities, while harnessing <strong>the</strong> considerable positive<br />
assets <strong>of</strong> international agencies, firms, and NGOs in a concerted, coherent fashion. Four years<br />
on, <strong>the</strong> program has seen more than 12,000 village development councils elected and more than<br />
19,000 project plans approved.<br />
17
The program has addressed <strong>the</strong> process <strong>of</strong> democratization from <strong>the</strong> ground level up, in parallel<br />
with national-level constitution-making and rule-writing at <strong>the</strong> centre, culminating in <strong>the</strong> first<br />
direct presidential election in <strong>the</strong> history <strong>of</strong> <strong>the</strong> country. The vicious cycle between government<br />
and Afghan citizens, through which successive regimes had preyed on villages and used<br />
factionalism as a means through which to entrench authoritarianism, was finally broken. The<br />
secret ballots empowered both men and women to directly elect village councils, with<br />
accountability ensured through transparent decision-making processes and close supervision <strong>of</strong><br />
block grants. At <strong>the</strong> village level, democratic decision-making processes have taken hold,<br />
challenging <strong>the</strong> assumptions, practices and legitimacy <strong>of</strong> rule by kleptocratic oligarchy.<br />
<strong>National</strong> Transportation Program<br />
The <strong>National</strong> Transportation Program created an integrated transportation system to facilitate<br />
internal markets and to connect economic hubs across Afghanistan to regional and global<br />
markets. It was also designed as a mechanism to create internal linkages <strong>for</strong> access to education<br />
and healthcare, especially in remote areas, and to ensure cross-cultural linkages. The program<br />
facilitated completion <strong>of</strong> <strong>the</strong> Afghan ring-road and its connecting spurs to <strong>the</strong> borders <strong>of</strong> <strong>the</strong><br />
country that has helped to trans<strong>for</strong>m Afghanistan into a central Asian land bridge. 5<br />
<strong>National</strong> Communications Program<br />
At <strong>the</strong> heart <strong>of</strong> <strong>the</strong> <strong>National</strong> Communications Program was <strong>the</strong> <strong>for</strong>mulation <strong>of</strong> a strategy <strong>for</strong> <strong>the</strong><br />
transparent licensing <strong>of</strong> telecoms, which resulted in <strong>the</strong> provision <strong>of</strong> four licenses in two separate<br />
tranches in 2006. Through <strong>the</strong> licensing process, <strong>the</strong> number <strong>of</strong> subscriptions to mobile phones<br />
rose from about 100 to 1.5 million in 2006; telecommunication companies provided a significant<br />
boost to domestic revenues and over $550 million in private sector investments were channeled<br />
into Afghanistan. This indicates that <strong>the</strong> management <strong>of</strong> licensing and procurement processes in<br />
a post-conflict country can be managed in a productive and transparent fashion.<br />
<strong>National</strong> Health and Education Programs<br />
A <strong>National</strong> Health Program focused on preventive medicine through restructuring <strong>the</strong> Ministry <strong>of</strong><br />
Health, essentially trans<strong>for</strong>ming it into a regulatory body through which NGOs were contracted<br />
to provide services. As a result, every child in <strong>the</strong> country was immunized. Infant (under five)<br />
and maternal mortality rates have declined markedly: a key goal <strong>of</strong> <strong>the</strong> program. The corollary in<br />
<strong>the</strong> education sector, <strong>the</strong> <strong>National</strong> Education Program, focused on school enrollment <strong>for</strong> both<br />
girls and boys, and has resulted in a massive increase in <strong>the</strong> number <strong>of</strong> children who regularly<br />
attend school.<br />
The <strong>National</strong> Accountability and Transparency Program<br />
The <strong>National</strong> Accountability and Transparency Program sought <strong>the</strong> complete overhaul <strong>of</strong> <strong>the</strong><br />
public finance system. It began with an immediate and rapid currency conversion process,<br />
followed by re<strong>for</strong>m <strong>of</strong> <strong>the</strong> budget process, <strong>the</strong> Treasury, revenue collection mechanisms,<br />
expenditure monitoring and banking system oversight. These changes were backed by<br />
improvements in accounting and auditing systems and were driven by timely and detailed reports<br />
on revenue and expenditure presented to <strong>the</strong> Cabinet and <strong>the</strong> ga<strong>the</strong>ring <strong>of</strong> national delegates at<br />
<strong>the</strong> Constitutional Loya Jirgas, and <strong>the</strong>y were also elucidated regularly to <strong>the</strong> public through <strong>the</strong><br />
media and through regular consultations with <strong>the</strong> public.<br />
Nei<strong>the</strong>r <strong>the</strong> Afghan government and people nor <strong>the</strong> international community alone could have<br />
managed <strong>the</strong> design and implementation process <strong>for</strong> <strong>the</strong> <strong>National</strong> Programs, and <strong>the</strong> Afghan<br />
18
experience broke significant new ground in terms <strong>of</strong> <strong>the</strong> collaborative ef<strong>for</strong>ts made by all<br />
stakeholders to improve aid effectiveness. The programs built stable alliances and coalitions<br />
between international program managers, Afghan <strong>of</strong>ficials, NGOs, private sector companies and<br />
<strong>the</strong> Afghan people. The partnership between <strong>the</strong> Afghan government and international partners<br />
created a common agenda. The <strong>National</strong> Programs provided a vehicle through which disparate<br />
assets and capabilities from across <strong>the</strong> spectrum <strong>of</strong> actors could be put to work in a concerted<br />
fashion.<br />
The government marshaled its rule-making powers to define spheres <strong>of</strong> operations in which<br />
national and international actors could constructively participate. In order to ensure that<br />
international donors could contribute funds directly to <strong>the</strong> government, <strong>the</strong> World Bank agreed to<br />
run a Multi-Donor Trust Fund that only released funds to <strong>the</strong> Government’s budget after<br />
satisfactory audit reports and required re<strong>for</strong>m steps—designed by <strong>the</strong> Ministry <strong>of</strong> Finance—were<br />
completed. Funding <strong>for</strong> <strong>the</strong> Trust Fund from donors was premised on <strong>the</strong> Afghan Government’s<br />
adherence to an agenda <strong>of</strong> building what ISE calls “<strong>National</strong> Accountability Systems” that create<br />
and rein<strong>for</strong>ce institutional checks and balances <strong>for</strong> collecting, allocating and spending resources.<br />
The <strong>National</strong> Programs approach faced some challenges. The UN-led needs assessment process<br />
created rival claims <strong>for</strong> resources and threatened to reproduce familiar problems, such as<br />
fragmentation <strong>of</strong> ef<strong>for</strong>ts, and undermining <strong>of</strong> state capacity. The <strong>National</strong> Programs also had<br />
Afghan challengers since <strong>the</strong>y removed sources <strong>of</strong> revenue and decision-rights from political<br />
elites across different levels <strong>of</strong> Afghan political life. After 2004, <strong>the</strong> Afghan government was<br />
increasingly affected by corruption, and new Ministers sometimes sought to make an impact by<br />
constructing <strong>the</strong>ir own projects and programs. For <strong>the</strong>se reasons, <strong>the</strong> Government itself began to<br />
dismantle parts <strong>of</strong> <strong>the</strong> <strong>National</strong> Program architecture, although some programs, such as NSP, had<br />
won such broad grass roots (and increasing international) support that <strong>the</strong>y proved very difficult<br />
to touch. Recently <strong>the</strong>re has been widespread affirmation <strong>of</strong> <strong>the</strong> <strong>National</strong> Program approach by<br />
<strong>the</strong> Afghan Government and its key partners, including <strong>the</strong> U.S. government, <strong>the</strong> UN, <strong>the</strong> World<br />
Bank, and key donors.<br />
Emerging Lessons<br />
The task <strong>of</strong> partnering with <strong>the</strong> Afghan people and government to catalyze <strong>the</strong> emergence <strong>of</strong> a<br />
state capable <strong>of</strong> per<strong>for</strong>ming core functions is daunting. Never<strong>the</strong>less, <strong>the</strong> <strong>National</strong> Programs<br />
approach has met with some significant successes, despite political opposition both domestically<br />
and at times internationally, as well as <strong>the</strong> difficulties posed by severe government corruption,<br />
narcotics, and <strong>the</strong> insurgency. If a state-building approach is to be pursued, it will need to grow<br />
both in light <strong>of</strong> experience and in order to remain relevant in <strong>the</strong> evolving context. The statebuilding<br />
agenda in Afghanistan could be enhanced through attention to improving <strong>the</strong> following<br />
six particular areas:<br />
Market Building<br />
In Afghanistan, as in every o<strong>the</strong>r post-conflict context that ISE has documented, criminalization<br />
<strong>of</strong> <strong>the</strong> economy has been a critical issue that government and international actors have been<br />
unable to prevent or control. In Afghanistan, criminalization <strong>of</strong> <strong>the</strong> economy and <strong>the</strong> infiltration<br />
<strong>of</strong> narco-mafia interests into fragile state institutions are having severe consequences across <strong>the</strong><br />
economy, polity, and civil society. This criminalization drives corruption at all levels <strong>of</strong><br />
government and society and undermines <strong>the</strong> rule <strong>of</strong> law by normalizing and rewarding illegality<br />
19
and making large numbers <strong>of</strong> citizens active or complicit in crime. Criminality also finances and<br />
equips terrorists and insurgents.<br />
An approach to criminality in Afghanistan must increase <strong>the</strong> number and strength <strong>of</strong> stakeholders<br />
in stability by growing <strong>the</strong> licit economy. Afghanistan is blessed with impressive mineral wealth<br />
and attention to harnessing that wealth to <strong>the</strong> benefit <strong>of</strong> Afghanistan. The international<br />
community could provide expertise on licensing, and risk guarantees to kick-start economic<br />
activity could do more than aid dollars.<br />
Civil Society<br />
Corruption has seriously penetrated <strong>the</strong> Afghan government, whereas most ordinary Afghan<br />
people desire decent, dependable institutions. Their disillusionment fuels insurgency and<br />
insecurity. NSP demonstrates that ordinary Afghans can be mobilized behind an agenda <strong>of</strong><br />
solidarity and national regeneration. Mechanisms are required to create <strong>the</strong> space <strong>for</strong> civil-<br />
Afghan groups working towards peaceful change. All too <strong>of</strong>ten, development assistance equates<br />
domestic civil society with <strong>for</strong>eign or domestic NGOs, whereas through <strong>the</strong> lens <strong>of</strong> citizens,<br />
NGOs are <strong>of</strong>ten perceived as parasitic organizations. Real civil society may or may not include<br />
some NGOs as a subset, but it is a much broader category. Mechanisms become critical to<br />
channel insurgents and <strong>the</strong>ir empathizers away from <strong>the</strong> organizational <strong>for</strong>m <strong>of</strong> <strong>the</strong> Taliban<br />
through o<strong>the</strong>r channels, including a national agenda <strong>of</strong> re<strong>for</strong>m, if necessary, as an opposition<br />
movement.<br />
Implementation and Accountability<br />
Some <strong>of</strong> <strong>the</strong> failures <strong>of</strong> <strong>the</strong> ef<strong>for</strong>t over <strong>the</strong> last eight years in Afghanistan relate to failure <strong>of</strong><br />
design; o<strong>the</strong>rs relate to failure <strong>of</strong> implementation. Where good designs are drawn up, <strong>the</strong>re is<br />
very little follow-through in terms <strong>of</strong> implementation, as plans, leadership, and resources are not<br />
aligned to each o<strong>the</strong>r. Part <strong>of</strong> this stems from a fragmentation in planning between key<br />
organizations: <strong>the</strong> ISAF, <strong>the</strong> World Bank, <strong>the</strong> UN, <strong>the</strong> U.S. and its key allies, and <strong>the</strong> Afghan<br />
Government. Part stems from <strong>the</strong> fact that, even when <strong>the</strong>re is agreement, decisions are not<br />
resourced, nor are organizational structures in place. What is urgently required, whe<strong>the</strong>r <strong>for</strong><br />
Afghanistan or o<strong>the</strong>r areas, is a change in <strong>the</strong> culture <strong>of</strong> execution and implementation. This must<br />
strike a careful balance between understanding when an external agent is needed to manage or<br />
produce something and when domestic actors and processes are needed to drive and implement<br />
an agenda. It is <strong>of</strong>t overlooked and very misunderstood that <strong>the</strong> internal budget and planning<br />
processes <strong>of</strong> a country are <strong>the</strong> key drivers <strong>of</strong> effectiveness. These internal accountability systems<br />
must be in place <strong>for</strong> implementation <strong>of</strong> revenue and expenditure rules.<br />
Collaboration and Coordination Plat<strong>for</strong>ms<br />
NSP demonstrates that where programs are successfully designed, a spectrum <strong>of</strong> disparate<br />
national and international participants can contribute diverse assets to achieve common goals.<br />
NSP resulted from collaboration between villages as social organizations and <strong>the</strong> budget <strong>of</strong> <strong>the</strong><br />
country, with a trust fund and technical support from NGOs. It will be necessary to move from<br />
an industrial model <strong>of</strong> top-down implementation to one which mobilizes across network and<br />
hierarchy through <strong>the</strong> appropriate plat<strong>for</strong>ms. This approach will incorporate tribal, in<strong>for</strong>mal, and<br />
Islamic contexts and can harness collective energies, synchronizing top down and bottom up.<br />
20
1.4 Conclusion<br />
The international community increasingly perceives <strong>the</strong> necessity <strong>of</strong> building effective states,<br />
and in Afghanistan, <strong>the</strong> international community’s ability to achieve this goal using conventional<br />
methods <strong>of</strong> assistance has been severely tested.<br />
Despite being challenged by a range <strong>of</strong> vested interests, <strong>the</strong> <strong>National</strong> Programs in Afghanistan<br />
<strong>of</strong>fered a distinctive approach to building state functions by harnessing a range <strong>of</strong> actors within<br />
an integrated architecture. In a context where corruption impedes <strong>the</strong> creation <strong>of</strong> an effective<br />
state, <strong>National</strong> Programs can still contribute <strong>the</strong> building blocks <strong>of</strong> a functional state, and while<br />
rallying those actors and groups who desire such a state, <strong>the</strong>y can also create new groups <strong>of</strong><br />
stakeholders willing to struggle towards that goal. Tipping <strong>the</strong> balance so that <strong>the</strong> stakeholders in<br />
a common, prosperous, and stable order come to outweigh interests <strong>of</strong> criminality, corruption,<br />
and state dysfunction requires concrete mechanisms capable <strong>of</strong> binding actors toge<strong>the</strong>r in ways<br />
that create virtuous circles. In doing this, <strong>the</strong> <strong>National</strong> Programs approach <strong>of</strong>fers a distinctive<br />
alternative to outdated international approaches.<br />
The <strong>National</strong> Programs approach also suggests that <strong>the</strong> international community possesses a<br />
stock <strong>of</strong> more or less latent assets that, if harnessed, could contribute very productively.<br />
Expertise in designing licensing was critical to success in <strong>the</strong> telecom sector. Aid in <strong>the</strong> <strong>for</strong>m <strong>of</strong><br />
risk guarantees could stimulate investment and entrepreneurship.<br />
In Afghanistan, despite receiving limited support and attention, as well as active subversion by a<br />
range <strong>of</strong> national and international interests, <strong>National</strong> Programs have achieved significant<br />
concrete successes in building state functions and creating stakeholders in a stable future. Going<br />
<strong>for</strong>ward, such programs could be refined and supplemented within Afghanistan. Attention should<br />
be given to building <strong>the</strong> legal market and to streng<strong>the</strong>ning civil society groups seeking to tackle<br />
corruption and apply pressure on <strong>the</strong> state. Such groups would <strong>of</strong>fer a re<strong>for</strong>mist alternative to<br />
insurgency as a means <strong>of</strong> expressing disillusionment.<br />
Four additional <strong>the</strong>mes emerge from recent experience <strong>of</strong> <strong>National</strong> Programs, and <strong>the</strong>se deserve<br />
consideration in future program design. First, program design must take implementation as <strong>the</strong><br />
starting point. Second, accountability systems must be written into <strong>the</strong> DNA <strong>of</strong> each program.<br />
Third, programs should serve as plat<strong>for</strong>ms or “operating systems” that allow coordination and<br />
collaboration between different stakeholders. Fourth, attention should be given to how bottom-up<br />
and top-down approaches are to be synchronized across <strong>the</strong> village, district, province and<br />
national government structures.<br />
More broadly, as a concrete mechanism that overcomes limitations upon existing aid approaches,<br />
focuses on building states, and breaks state-building into manageable and realistic tasks, <strong>National</strong><br />
Programs deserve broader study <strong>for</strong> <strong>the</strong>ir potential to contribute to <strong>the</strong> stability and resilience in<br />
o<strong>the</strong>r contexts across <strong>the</strong> world.<br />
↑ back to <strong>the</strong> top<br />
1 Ghani, A, Clare Lockhart and Michael Carnahan, “An Agenda <strong>for</strong> State-building in <strong>the</strong> Twenty-first<br />
Century. The Fletcher Forum <strong>of</strong> World Affairs, Vol. 30:1 Winter 2006, pp.101-123.<br />
2 The case <strong>of</strong> Haiti is particularly stark. See <strong>for</strong> example Buss, Terry F. and Adam Gardner, “Why<br />
Foreign Aid to Haiti Failed,” <strong>National</strong> Academy <strong>of</strong> Public Administration, 2006.<br />
21
3 ISE continues to invite discussion and debate about <strong>the</strong> proposed ten functions <strong>of</strong> <strong>the</strong> state, which were<br />
previously identified in Ghani, A., Clare Lockhart and Michael Carnahan, “Closing <strong>the</strong> Sovereignty<br />
Gap,” ODI Working Paper 253, 2005 and articulated in Ghani, A. and Clare Lockhart, “Fixing Failed<br />
States: A Framework <strong>for</strong> Rebuilding a Fractured World,” OUP 2008.<br />
4 http://www.nspafghanistan.org/content/index_eng.html<br />
5 Upon completion <strong>of</strong> this program, <strong>the</strong> capitals <strong>of</strong> Afghanistan’s Central Asian neighbors are no more<br />
than 32 hours’ drive from <strong>the</strong> Gulf.<br />
22
2. Independent Trend and Trajectory <strong>of</strong> <strong>the</strong> Future: Issues Impacting<br />
Social Regional Stability<br />
2.1. Demographics<br />
2.1.A. Demographic and Economic Trends: Implications <strong>for</strong> International<br />
Migration (Philip Martin)<br />
Author and Organization: Dr. Philip Martin, Pr<strong>of</strong>essor, University <strong>of</strong> Cali<strong>for</strong>nia Davis, UC<br />
Comparative Immigration & Integration Program<br />
Contact In<strong>for</strong>mation: martin@primal.ucdavis.edu<br />
Abstract<br />
About three percent <strong>of</strong> <strong>the</strong> world’s 6.1 billion people were international migrants in 2000.<br />
Population growth is expected to slow between 2000 and 2050 in comparison to 1950–2000, but<br />
international migration is expected to rise as persisting demographic and economic inequalities<br />
that motivate migration interact with revolutions in communications and transportation that<br />
enable people to cross borders. The default policy option to manage what is sometimes deemed<br />
out-<strong>of</strong>-control migration, adjusting <strong>the</strong> rights <strong>of</strong> migrants, is unsatisfactory, prompting this<br />
review <strong>of</strong> longer term factors affecting migration patterns, including aging in industrial countries,<br />
rural-urban migration that spills over national borders, and <strong>the</strong> migration infrastructure <strong>of</strong> agents<br />
and networks that moves people. The paper concludes with an assessment <strong>of</strong> <strong>the</strong> likely effects <strong>of</strong><br />
<strong>the</strong> 2008–09 recession on international migration.<br />
Introduction<br />
This paper outlines <strong>the</strong> major demographic and economic trends likely to affect international<br />
migration flows through 2050, with special emphasis on <strong>the</strong> effects <strong>of</strong> three factors—population<br />
aging, rural-urban movements, and <strong>the</strong> inequalities that encourage workers to move from lower<br />
to higher wage countries. The paper also reviews <strong>the</strong> “migration infrastructure,” <strong>the</strong> institutions<br />
and actors ranging from recruiters, transportation firms, and those who benefit economically<br />
from employing and integrating migrants. Finally, <strong>the</strong> paper reviews <strong>the</strong> likely effects <strong>of</strong> <strong>the</strong><br />
current recession on migration flows.<br />
The half century between 1950 and 2000 was a period <strong>of</strong> extraordinarily fast population growth<br />
and urbanization—<strong>the</strong> global population rose by 1.5 times, <strong>the</strong> populations <strong>of</strong> many countries<br />
doubled, tripled, and quadrupled, and <strong>the</strong> urban share <strong>of</strong> world’s population rose from 29 to 48<br />
percent. 1 Population growth is expected to slow, with <strong>the</strong> world’s fertility falling below <strong>the</strong><br />
replacement level <strong>of</strong> 2.1 in 2025 as urbanization continues. Unlike <strong>the</strong> past 50 years, when<br />
almost all countries had baby booms and falling mortality, <strong>the</strong> hallmark <strong>of</strong> <strong>the</strong> next half century<br />
is expected to be unevenness in demographic change. Almost all <strong>of</strong> <strong>the</strong> world’s approximately<br />
200 countries are projected to have aging populations, while a quarter <strong>of</strong> <strong>the</strong> countries are<br />
expected to have shrinking populations, and ano<strong>the</strong>r quarter <strong>of</strong> <strong>the</strong> countries are expected to<br />
continue growing at rates that will double <strong>the</strong>ir populations within 50 years.<br />
The world’s labor <strong>for</strong>ce is drawn from people 15 years <strong>of</strong> age and older. The major trends <strong>of</strong> <strong>the</strong><br />
past 50 years have been <strong>the</strong> increasing share <strong>of</strong> married women with children who work <strong>for</strong><br />
wages, later labor <strong>for</strong>ce entry due to less child labor and more education, and earlier retirement<br />
associated with better pensions. Over <strong>the</strong> next 50 years, <strong>the</strong>se trends are expected to persist,<br />
23
albeit with variations, including fewer persons self employed in agriculture and more persons<br />
employed <strong>for</strong> wages in cities. A major unknown is <strong>the</strong> age <strong>of</strong> retirement—will most workers<br />
continue to retire in <strong>the</strong>ir early 60s and rely on public and private resources <strong>for</strong> ano<strong>the</strong>r 20 to 25<br />
years, or will a rising share <strong>of</strong> workers continue working, keeping <strong>the</strong> total period <strong>of</strong> retirement<br />
closer to <strong>the</strong> current average <strong>of</strong> 15 to 20 years. In <strong>the</strong> U.S., <strong>the</strong> average age at retirement dropped<br />
from 70 in 1940 to 65 in 1970 and 62 in 2000, making <strong>the</strong> average number <strong>of</strong> years in retirement<br />
10 years in 1940, 13 in 1970, and 18 in 2000. 2<br />
Differences in demographic trends between countries are likely to combine with economic<br />
inequalities to provide incentives to migrate within and between countries. Rural-urban<br />
migration within countries is poised to continue, but patterns <strong>of</strong> international migration are<br />
harder to predict, largely because regulating <strong>the</strong> entry and stay <strong>of</strong> non-citizens is a core attribute<br />
<strong>of</strong> national sovereignty jealously that is closely guarded by most governments. Public opinion in<br />
most countries opposes large-scale immigration, and <strong>the</strong> result <strong>of</strong> sparring between employers<br />
seeking additional workers, migrants seeking opportunity, and public opposition to migrants is a<br />
mélange <strong>of</strong> guest workers, irregular migration, and o<strong>the</strong>r <strong>for</strong>ms <strong>of</strong> cross-border movement.<br />
There are two extreme scenarios <strong>for</strong> international migration over <strong>the</strong> next several decades. One<br />
imagines <strong>the</strong> emergence <strong>of</strong> bilateral and regional free-movement regimes, such as <strong>the</strong> one<br />
between Australia and New Zealand or within <strong>the</strong> European Union, and eventually a global<br />
organization such as <strong>the</strong> World Trade Organization or a new World Migration Organization with<br />
<strong>the</strong> goal <strong>of</strong> fostering more movements to increase global economic efficiency. A WTO or WMO<br />
could also give national governments facing anti-migrant publics “cover” to liberalize labor<br />
flows over national borders, as when <strong>the</strong>y say <strong>the</strong>y do not want to allow <strong>the</strong> entry <strong>of</strong> migrants,<br />
but <strong>the</strong>ir international obligations require <strong>the</strong>m to do so. The o<strong>the</strong>r scenario imagines that current<br />
levels <strong>of</strong> migration, which involve about three percent <strong>of</strong> <strong>the</strong> world’s residents, will persist, and<br />
that national governments will remain restrictive toward migrants <strong>for</strong> reasons that range from<br />
fears <strong>of</strong> crime and terrorism to <strong>the</strong> adverse effects <strong>of</strong> migrants on native workers and<br />
productivity.<br />
Most migration literature predicts and endorses regional and global liberalization <strong>of</strong> labor<br />
migration. 3,4,5<br />
The most likely scenario lies between <strong>the</strong>se extremes, meaning <strong>the</strong>re is likely to be a variety <strong>of</strong><br />
migration systems reflecting <strong>the</strong> circumstances <strong>of</strong> <strong>the</strong> countries involved. Rentier societies such<br />
as Gulf oil exporters seem poised to continue to rely on migrant workers to fill most private<br />
sector jobs; most <strong>of</strong> <strong>the</strong>se migrants are likely to rotate in and out <strong>of</strong> <strong>the</strong> country on two- and<br />
three-year contracts. More industrial countries are likely to join <strong>the</strong> four traditional immigration<br />
countries—Australia, Canada, New Zealand, and <strong>the</strong> US—to select a certain number <strong>of</strong><br />
immigrants each year and to plan <strong>for</strong> <strong>the</strong>ir integration.<br />
The great unknown factor is policy development in middle-income developing countries<br />
receiving migrants, ranging from Costa Rica to Argentina, Libya to South Africa, and Korea to<br />
Thailand. Will <strong>the</strong>y follow <strong>the</strong> lead <strong>of</strong> industrial countries and plan <strong>for</strong> immigrants based on<br />
family, economic, or o<strong>the</strong>r criteria, including <strong>the</strong> return <strong>of</strong> descendants <strong>of</strong> previous emigrants?<br />
Alternatively, <strong>the</strong>y could follow <strong>the</strong> model <strong>of</strong> Singapore, welcoming pr<strong>of</strong>essionals to settle with<br />
<strong>the</strong>ir families while aiming to rotate less skilled workers in and out <strong>of</strong> <strong>the</strong> labor <strong>for</strong>ce and<br />
country.<br />
24
<strong>National</strong> policy development is likely to be complicated because <strong>of</strong> links between rural-urban<br />
and international migration. Migration is generally a journey <strong>of</strong> hope <strong>for</strong> individuals wishing to<br />
improve <strong>the</strong>ir economic status and enjoy new opportunities. Rapid economic and job growth in<br />
urban areas <strong>of</strong> countries in <strong>the</strong> midst <strong>of</strong> rural-urban migration can provide opportunity <strong>for</strong> most<br />
migrants within borders, as in China and Turkey. Without opportunities within borders <strong>for</strong> those<br />
seeking opportunity, rural-urban migration can become international migration, as from Mexico<br />
to <strong>the</strong> U.S.<br />
Many migrants face difficult trade-<strong>of</strong>fs between economic and o<strong>the</strong>r freedoms—should <strong>the</strong>y<br />
cross national borders <strong>for</strong> higher wages if <strong>the</strong>y lose <strong>the</strong>ir right to engage in political activity to<br />
advocate <strong>for</strong> change in <strong>the</strong> circumstances in which <strong>the</strong>y live and work? The front doors <strong>for</strong> legal<br />
immigrants open widest <strong>for</strong> those with <strong>the</strong> most education and skills, raising questions about<br />
whe<strong>the</strong>r remittances are sufficient compensation <strong>for</strong> a new brain drain. Finally, many developing<br />
countries that are richer than <strong>the</strong>ir neighbors are likely to learn <strong>the</strong> lessons <strong>of</strong> <strong>the</strong> 1960s, viz, that<br />
<strong>the</strong>re is nothing more permanent than temporary workers, and that recruiting or tolerating<br />
migrant workers inevitably adds permanent residents to <strong>the</strong> population.<br />
The world in 2008–09 is in <strong>the</strong> midst <strong>of</strong> <strong>the</strong> most severe recession in half a century, marked by<br />
shrinking economies and rising unemployment. Just be<strong>for</strong>e <strong>the</strong> recession spread around <strong>the</strong><br />
world in 2008, <strong>the</strong> number <strong>of</strong> migrants and remittances were at record levels, and many analysts<br />
expected this growth to continue. Flows <strong>of</strong> labor from poorer to richer countries have slowed and<br />
in some cases reversed due to <strong>the</strong> recession, and it is not clear that migration and remittances will<br />
resume <strong>the</strong>ir upward trajectory during <strong>the</strong> economic recovery.<br />
The current recession could affect migration patterns quite differently than past recessions <strong>for</strong><br />
four major reasons.<br />
First, this global recession began in industrial countries and spread to almost all countries,<br />
limiting <strong>the</strong> ability <strong>of</strong> migrants to shift from lagging to boom areas, as <strong>the</strong>y could when high oil<br />
prices attracted migrants to <strong>the</strong> Gulf countries while doors closed to Western Europe.<br />
Second, <strong>the</strong> effects <strong>of</strong> recession are most severe in cyclically and trade-sensitive sectors such as<br />
construction to manufacturing that hire large numbers <strong>of</strong> migrant workers and may not recover<br />
quickly. Some <strong>of</strong> <strong>the</strong> “migrant jobs” in manufacturing may not return in <strong>the</strong> recovery.<br />
Third, most migrant-sending governments and development institutions have urged migrantreceiving<br />
governments to minimize disruptions to labor migration by stopping recruitment or<br />
<strong>for</strong>cing migrants to leave. (ILO DG Juan Somavia’s December 18, 2008 International Migrants<br />
Day message asked migrant-receiving countries to “assess <strong>the</strong>ir labor market needs be<strong>for</strong>e<br />
resorting to general lay<strong>of</strong>fs <strong>of</strong> migrant workers.” 6 Employers ra<strong>the</strong>r than governments usually<br />
make hiring and lay<strong>of</strong>f decisions; <strong>the</strong> message presumably argues against policies such as that<br />
adopted by <strong>the</strong> Malaysian government, which ordered migrants to be laid <strong>of</strong>f be<strong>for</strong>e Malaysian<br />
workers.) Be<strong>for</strong>e <strong>the</strong> recession, it was widely assumed that migration and remittances would<br />
continue to increase. Current projections anticipate that remittances to developing countries will<br />
decline, but far less than <strong>for</strong>eign direct investment, which is expected to fall sharply. Some<br />
migrant-sending governments have appealed to migrant-receivers to continue accepting migrants<br />
to avoid political unrest among citizens unable to find <strong>for</strong>eign jobs.<br />
The fourth issue is immigration, with <strong>the</strong> issuance <strong>of</strong> about 1.5 million visas a year to people<br />
allowed to settle and eventually naturalize in <strong>the</strong> traditional immigration countries <strong>of</strong> Australia,<br />
25
Canada, New Zealand, and <strong>the</strong> U.S. (<strong>the</strong> U.S. accepts about three-fourths <strong>of</strong> <strong>the</strong>se immigrants).<br />
Australia, Canada, and New Zealand select most <strong>of</strong> <strong>the</strong>ir immigrants on <strong>the</strong> basis <strong>of</strong> a point<br />
system that favors <strong>the</strong> admission <strong>of</strong> those most likely to be successful finding jobs, while <strong>the</strong><br />
U.S. admits mostly <strong>for</strong>eigners who are joining settled family members. Family-based<br />
immigration to <strong>the</strong> U.S. is expected to be less sensitive to recession than economically motivated<br />
migration to countries that select newcomers based primarily on economic criteria.<br />
Population Trends<br />
The world’s population, 6.8 billion in 2009, included 1.2 billion residents in “more developed”<br />
regions, and 5.4 billion or 82 percent in “less developed” regions. The world’s population is<br />
projected to rise to 9.2 billion by 2050 in <strong>the</strong> median variant. Keilman 7 finds that UN projections <strong>of</strong><br />
population are most reliable <strong>for</strong> 10-15 years into <strong>the</strong> future. 8 With almost all population growth<br />
projected to occur in what are now considered less developed regions, <strong>the</strong> share <strong>of</strong> global<br />
population in more developed countries is projected to fall from 18 percent today to 13 percent<br />
by 2050.<br />
The world’s population was about a billion in 1800 and rose to 2.5 billion in 1950. High birth<br />
rates and falling mortality rates explain <strong>the</strong> rise in <strong>the</strong> global population, and migration explains<br />
<strong>the</strong> sharp increases in <strong>the</strong> share <strong>of</strong> <strong>the</strong> global population in Latin America, North America, and<br />
Oceania.<br />
Between 1950 and 2000, when <strong>the</strong> world’s population increased from 2.5 billion to 6.1 billion,<br />
<strong>the</strong> major shifts in population weights by continent were <strong>the</strong> result <strong>of</strong> changes in fertility and<br />
mortality ra<strong>the</strong>r than large-scale migration. The most noticeable shift was <strong>the</strong> decline in <strong>the</strong> share<br />
<strong>of</strong> <strong>the</strong> world’s people in Europe, down from 22 to 12 percent, and <strong>the</strong> rising share <strong>of</strong> <strong>the</strong> world’s<br />
people in Africa, up from nine to 13 percent. This trend <strong>of</strong> an expanding Africa and shrinking<br />
Europe is expected to continue, so that by 2050, <strong>the</strong>re is projected to be three Africans <strong>for</strong> every<br />
European.<br />
Table 2.1.A-1. World Population by Continent, 1800, 1950, 2000, 2050 (Percent Shares) 9,10<br />
1800 1950 2000 2050 (projected)<br />
World (× million) 978 2,535 6,124 9,191<br />
Africa (percent) 11 9 13 20<br />
Asia 65 56 61 59<br />
Europe 21 22 12 7<br />
Latin America & Caribbean 3 7 9 9<br />
Nor<strong>the</strong>rn America 1 7 5 4<br />
Oceania 1 1 1<br />
The global population has been increasing by about 78 million a year, adding <strong>the</strong> equivalent <strong>of</strong> a<br />
Germany to <strong>the</strong> world population each year. The UN projects declining fertility, from <strong>the</strong><br />
average 2.6 children per woman in 2005 to 2.05 by 2050. Fertility in <strong>the</strong> more developed regions<br />
in 2005 was 1.6, versus 4.6 in less developed regions. Fertility is expected to rise to 1.8 by 2050<br />
in more developed regions. If fertility does not decline to below-replacement levels as projected,<br />
<strong>the</strong> global population would reach 10.8 billion by 2050. 11 A combination <strong>of</strong> below-replacement<br />
fertility and low immigration is expected to result in <strong>the</strong> shrinking <strong>of</strong> populations in a quarter <strong>of</strong><br />
26
<strong>the</strong> world’s countries, including many European countries, Russia and Eastern European<br />
countries, and Japan and Korea. 12<br />
The UN groups people into three age groups—under 15, 15 to 59 and 60 and older. The UN<br />
projects population by age <strong>for</strong> 21 five-year age groups (e.g., 0–4, 5–9, 10–14), ending with 100+.<br />
The major changes expected in <strong>the</strong> world’s population over <strong>the</strong> next four decades include a rising<br />
share <strong>of</strong> people 60 and older, and growing differences in age structures between continents.<br />
Globally, <strong>the</strong> major demographic trend is aging—10 percent <strong>of</strong> people were 60 or older in 2005,<br />
and <strong>the</strong>ir share <strong>of</strong> <strong>the</strong> global population is projected to more than double to 22 percent by 2050.<br />
Aging will be most pronounced in more developed countries, where <strong>the</strong> share <strong>of</strong> residents 60 or<br />
older is projected to rise from 20 percent in 2005 to 33 percent by 2050, so that <strong>the</strong>re will be two<br />
persons 60 and older <strong>for</strong> each child 15 and younger. 13 In less-developed countries, by contrast,<br />
<strong>the</strong>re will be far more elderly, but still about one child <strong>for</strong> each person 60 and older.<br />
Table 2.1.A-2. World Population by Age Group, 2005 and 2050 (Percent Dist) 14<br />
2005 2005 2005 2050 2050 2050<br />
0-14 15-59 60+ 0-14 15-59 60+<br />
World 28 61 10 20 58 22<br />
More Developed 17 63 20 15 52 33<br />
Less Developed 31 61 8 21 59 20<br />
Africa 41 53 5 28 62 10<br />
Asia 28 63 9 18 58 24<br />
Europe 16 64 21 15 51 34<br />
Latin America & Caribbean 30 61 9 18 58 24<br />
Nor<strong>the</strong>rn America 20 63 17 17 56 27<br />
Oceania 25 61 14 18 57 25<br />
Age differences between continents are most pronounced <strong>for</strong> <strong>the</strong> old and young. In 2005, <strong>the</strong>re<br />
were more children under 15 than residents over 60 in every continent, including 8 children <strong>for</strong><br />
every elderly adult in Africa. By 2050, <strong>the</strong>re will be more people over 60 than under 15 in every<br />
continent except Africa, including two elderly adults <strong>for</strong> each child in Europe.<br />
In four major labor-sending countries over <strong>the</strong> past half century, <strong>the</strong>re was rapid population<br />
growth, led by <strong>the</strong> Philippines. The populations <strong>of</strong> <strong>the</strong>se four countries are expected to continue<br />
increasing at a slower pace, but <strong>the</strong> population <strong>of</strong> <strong>the</strong> Philippines is projected to be greater than<br />
that <strong>of</strong> Mexico by 2050 because <strong>of</strong> higher fertility. If <strong>the</strong>se projections prove accurate, one would<br />
expect emigration pressures due to demography to decline faster in Mexico than <strong>the</strong> Philippines.<br />
Table 2.1.A-3. Population: Mexico, Morocco, Philippines, Turkey, 1950-2050 (in millions). 15<br />
1950 2000 2050 1950-00 2000-50<br />
Mexico 28 100 132 257% 32%<br />
Morocco 9 29 43 222% 48%<br />
Philippines 20 76 140 280% 84%<br />
27
Turkey 21 68 98 224% 44%<br />
Labor Force Trends<br />
The International Labor Organization (ILO) labor <strong>for</strong>ce projections add labor <strong>for</strong>ce participation<br />
rates (LFPR) to <strong>the</strong> UN’s population projections, meaning that <strong>the</strong> ILO projects an increase in<br />
<strong>the</strong> share <strong>of</strong> persons who are in <strong>the</strong> economically active population (EAP), defined as those who<br />
are employed or looking <strong>for</strong> work. Many countries do not report LFPRs, and <strong>the</strong> ILO estimates<br />
LFPRs <strong>for</strong> <strong>the</strong>m. The ILO had LFPR data <strong>for</strong> 23 <strong>of</strong> <strong>the</strong> 191 countries <strong>for</strong> which projections were<br />
made; non-reporters are generally countries that are small and poor. 16<br />
The ILO estimates LFPRs <strong>for</strong> 11 age groups, from 15–19, 20–24, etc., to over 65, and <strong>for</strong> men<br />
and women. It finds that LFPRs behave as follows:<br />
<br />
<br />
Rise from younger to older age groups.<br />
Reach <strong>the</strong>ir maximum values <strong>for</strong> men and women between <strong>the</strong> ages <strong>of</strong> 25 and 55, when<br />
90 percent or more <strong>of</strong> men are in <strong>the</strong> labor <strong>for</strong>ce (women’s LFPRs are slightly lower than<br />
men’s because <strong>of</strong> mo<strong>the</strong>rhood).<br />
Begin falling <strong>for</strong> workers after age 55.<br />
The result is a hat-shaped distribution <strong>of</strong> LFPRs, rising steeply as young people enter <strong>the</strong> labor<br />
<strong>for</strong>ce, reaching a maximum during <strong>the</strong> primary working years, and falling with retirement.<br />
Figure 2.1.A-1. EAP Share by Age Group. 17<br />
The ILO’s challenge is to apply appropriate LFPRs by age and sex to <strong>the</strong> correct base data—<strong>the</strong><br />
number <strong>of</strong> persons in each age and sex group. It does this by country, as explained in volume 10<br />
<strong>of</strong> <strong>the</strong> methodology. For example, in Mexico, male LFPRs averaged 90 percent <strong>for</strong> <strong>the</strong> 25–50 age<br />
groups, while female LFPRs averaged 40 percent <strong>for</strong> <strong>the</strong> 25–50 age groups. In 1991, about 34<br />
percent <strong>of</strong> economically active men were in agriculture, 25 percent in industry, and 41 percent in<br />
services; <strong>the</strong> distribution <strong>of</strong> economically active Mexican women was 11 percent in agriculture,<br />
19 percent in industry, and 70 percent in services. 18<br />
28
The ILO’s most recent labor <strong>for</strong>ce projections cover <strong>the</strong> 1980-2020 period. The major trend at<br />
<strong>the</strong> global level is <strong>the</strong> gradual rise in <strong>the</strong> economically active share <strong>of</strong> <strong>the</strong> total population, from<br />
43 percent in 1980 to 47 percent 2005 and 48 percent in 2020.<br />
Table 2.1.A-4. EAP (millions). 19,20,21<br />
1980 1985 1990 1995 2000<br />
World Pop 4,451 4,855 5,295 5,719 6,124<br />
World EAP 1,930 2,160 2,406 2,605 2,818<br />
Share 43% 44% 45% 46% 46%<br />
2005 2010 2015 2020 2025<br />
World Pop 6,514 6,910 7,295 7,667 8,010<br />
World EAP 3,050 3,279 3,481 3,651 3,845<br />
Share 47% 47% 48% 48% 48%<br />
2030 2035 2040 2045 2050<br />
World Pop 8,317 8,587 8,824 9,025 9,191<br />
World EAP 3,992 4,122 4,236 4,332 4,412<br />
Share 48% 48% 48% 48% 48%<br />
EAP Change 1980-90 1990-00 2000-10 2010-20 2020-30 2030-40 2040-50<br />
World EAP 25% 21% 17% 17% 9% 6% 4%<br />
If <strong>the</strong> economically active share <strong>of</strong> <strong>the</strong> global population remains at 48 percent between 2020 and<br />
2050, <strong>the</strong> world’s labor <strong>for</strong>ce will increase from about 3 billion in 2005 to 4.4 billion in 2050.<br />
However, <strong>the</strong> rate <strong>of</strong> labor <strong>for</strong>ce growth will slow. There was remarkably fast labor <strong>for</strong>ce growth<br />
in <strong>the</strong> 1980s and 1990s, when <strong>the</strong> global labor <strong>for</strong>ce expanded by over 20 percent as a result <strong>of</strong><br />
<strong>the</strong> baby boom <strong>of</strong> <strong>the</strong> 1960s and 1970s, to a projected expansion <strong>of</strong> four percent in <strong>the</strong> decade <strong>of</strong><br />
2040–50.<br />
In 2005, about 20 percent <strong>of</strong> <strong>the</strong> world’s workers were in <strong>the</strong> more developed countries, and 80<br />
percent were in <strong>the</strong> less developed countries. The labor <strong>for</strong>ce <strong>of</strong> <strong>the</strong> more developed countries is<br />
expected to remain at about 600 million if <strong>the</strong> overall LFPR remains at 48 percent, largely<br />
because <strong>of</strong> <strong>the</strong> stable populations <strong>of</strong> industrial countries. The ILO projects that <strong>the</strong> economically<br />
active share <strong>of</strong> populations in less developed countries will converge to <strong>the</strong> 48 percent <strong>of</strong> more<br />
developed countries, so <strong>the</strong> labor <strong>for</strong>ce <strong>of</strong> less developed countries will increase strictly with<br />
population after 2020. Thus, <strong>the</strong> labor <strong>for</strong>ce <strong>of</strong> more developed countries is projected to stop<br />
growing after 2020 because <strong>of</strong> <strong>the</strong> stable population, while <strong>the</strong> labor <strong>for</strong>ce <strong>of</strong> less developed<br />
countries continues rising at a slower rate and is still growing toward four billion in 2050.<br />
Conclusions<br />
The world’s population is aging at a time when almost all population and labor <strong>for</strong>ce growth is<br />
concentrated in <strong>the</strong> 170 developing countries, where over half <strong>of</strong> residents live in rural areas.<br />
29
Migration is a response to differences between areas, and millions <strong>of</strong> younger rural residents <strong>of</strong><br />
developing nations are moving in search <strong>of</strong> higher wages and more opportunities. It is easier and<br />
cheaper <strong>for</strong> additional migrants to join those who have settled in urban areas within nations and<br />
abroad.<br />
Inequalities that promote migration, coupled with communication and transportation revolutions<br />
that make it easier and cheaper to move, have prompted policy makers to turn to <strong>the</strong> instrument<br />
over which <strong>the</strong>y have most control—rights—in an ef<strong>for</strong>t to manage migration. In western Europe<br />
during <strong>the</strong> 1990s, access to <strong>the</strong> asylum system was restricted by defining some countries as safe<br />
and requiring those seeking asylum to apply <strong>for</strong> refuge in <strong>the</strong> first “safe” country <strong>the</strong>y reached, a<br />
policy change that reduced applications. In <strong>the</strong> US in <strong>the</strong> 1990s, <strong>the</strong> access <strong>of</strong> legal and<br />
unauthorized <strong>for</strong>eigners to means-tested federal assistance was reduced in an ef<strong>for</strong>t to head <strong>of</strong>f a<br />
backlash against <strong>for</strong>eigners arriving “with <strong>the</strong>ir hands out,” ra<strong>the</strong>r than seeking a “hand up” <strong>the</strong><br />
ladder <strong>of</strong> economic opportunity.<br />
Managing migration by adjusting <strong>the</strong> rights <strong>of</strong> migrants may become increasingly difficult in a<br />
world <strong>of</strong> persisting demographic and economic inequalities. For <strong>the</strong> first time in human history,<br />
sharp differences in demography are expected to exist across countries, with at least a quarter <strong>of</strong><br />
<strong>the</strong> world’s countries expected to have aging and shrinking populations. The question is whe<strong>the</strong>r<br />
<strong>the</strong>se generally richer industrial countries will open border gates to migrants, whe<strong>the</strong>r <strong>the</strong>y will<br />
raise <strong>the</strong> retirement ages, or whe<strong>the</strong>r <strong>the</strong>y will take o<strong>the</strong>r steps in an ef<strong>for</strong>t to minimize migration.<br />
Two extremes mark <strong>the</strong> spectrum <strong>of</strong> likely responses to slower population growth and aging.<br />
One imagines a world <strong>of</strong> bilateral, regional, and global migration agreements that make it easier<br />
<strong>for</strong> workers to cross national borders legally so that in a few decades, migrants will be accepted<br />
in workplaces with <strong>the</strong> same indifference as most consumers have about where <strong>the</strong>ir TVs, cars<br />
and o<strong>the</strong>r goods were made. The o<strong>the</strong>r extreme <strong>for</strong>esees relatively low levels <strong>of</strong> labor migration<br />
as aging societies that may “need” migrants resist <strong>the</strong> changes that accompany migration.<br />
Reality is likely to lie somewhere between <strong>the</strong>se extremes, making it difficult to assess <strong>the</strong><br />
implications <strong>for</strong> human development. Migration is likely to remain a journey <strong>of</strong> hope <strong>for</strong> millions<br />
<strong>of</strong> people around <strong>the</strong> world, and most <strong>of</strong> those who move are likely to find <strong>the</strong> opportunities <strong>the</strong>y<br />
are seeking. Receiving areas can benefit economically and culturally from <strong>the</strong> contributions <strong>of</strong><br />
migrants, and migrant-areas-<strong>of</strong>-origin can benefit from remittances that reduce poverty and<br />
provide a new impetus <strong>for</strong> development. However, <strong>the</strong>re are likely to be yawning gaps between<br />
<strong>the</strong> rights and protections laid out in international conventions and <strong>the</strong> realities faced by many<br />
migrants.<br />
↑ Back to <strong>the</strong> top<br />
1 World Urbanization Prospects, 2007 revision,<br />
www.un.org/esa/population/publications/wup2007/2007wup.htm.<br />
2 Aaron, 1999.<br />
3 Ghosh, 2000.<br />
4 Bhagwati, 2005.<br />
5 Helton, 2003.<br />
6 www.ilo.org/public/english/bureau/dgo/speeches/somavia/2008/migrants.pdf<br />
7 Keilman, 1998, 15.<br />
8 UN, 2007, pxxi.<br />
9 UN, 1999. The World at Six Billion, Table 2, UN. 2007.<br />
30
10 World Population Prospects, 2006 revision.<br />
11 UN, 2007, pxxi.<br />
12 UN, 2007, pxxiii.<br />
13 UN, 2007, pxxiii.<br />
14 UN. 2007. World Population Prospects. 2006 revision (pxxiii).<br />
15 UN, 2007, Vol 1. Medium variant.<br />
16 ILO (2008, 11).<br />
17 World, 2005.<br />
18 http://laborsta.ilo.org/applv8/data/SSMe.html, p 120.<br />
19 World, 1980-2020.<br />
20 http://laborsta.ilo.org (48 % EAP after 2020).<br />
21 Population data from UN, 2007, medium variant.<br />
31
2.1.B. Demography and Security (Jack Goldstone)<br />
Author and Organization: Dr. Jack A. Goldstone, Pr<strong>of</strong>essor, George Mason University<br />
Contact In<strong>for</strong>mation: jgoldsto@gmu.edu<br />
Five major demographic trends are likely to pose significant security challenges to <strong>the</strong> United<br />
States, Europe, Japan, and most o<strong>the</strong>r developed nations in <strong>the</strong> next two decades:<br />
1. Disproportionate population growth in large and Muslim countries<br />
2. Shrinking populations in Europe and <strong>the</strong> west Pacific Rim countries (Japan, S. Korea,<br />
Taiwan)<br />
3. Sharply opposing age shifts between aging developed countries and youthful developing<br />
countries<br />
4. Increased immigration from developing to developed countries<br />
5. A shift in developing countries toward rapid and dominant urbanization<br />
The security and conflict problems caused by population changes in <strong>the</strong> coming decades are not<br />
mainly due to overall population growth creating shortages <strong>of</strong> resources (although, with climate<br />
change looming, we cannot discount that possibility in some vulnerable nations). Ra<strong>the</strong>r,<br />
population distortions—in which populations grow too young, or too fast, or too urbanized—will<br />
make it difficult <strong>for</strong> prevailing economic and administrative institutions to maintain stable<br />
socialization and labor <strong>for</strong>ce absorption, leading to risks <strong>of</strong> mass migrations, government<br />
breakdowns, and international and civil conflicts and a reduced ability <strong>of</strong> <strong>the</strong> United States and<br />
its major allies to respond to <strong>the</strong>se challenges. 1,2,3<br />
Big Emerging Markets and <strong>the</strong> World Economy<br />
Countries are growing today <strong>for</strong> two major reasons: high population growth rates and<br />
demographic momentum. In some countries, mainly in Africa and <strong>the</strong> Middle East (as well as a<br />
few in Latin America and South Asia), birth rates remain much higher than mortality rates, so<br />
<strong>the</strong>ir population growth rates remain high, at more than 2.0 percent per year. In <strong>the</strong>se countries—<br />
which include Afghanistan, <strong>the</strong> Democratic Republic <strong>of</strong> <strong>the</strong> Congo, Guatemala, Iraq, Jordan,<br />
Nepal, Saudi Arabia, Pakistan, and Yemen—<strong>the</strong> population is still doubling every generation<br />
(roughly every 30-35 years). 4<br />
In o<strong>the</strong>r countries such as China, India, and Indonesia, population growth rates have recently<br />
dropped substantially; in percentage terms, <strong>the</strong>y are growing more slowly than <strong>the</strong>y have in <strong>the</strong><br />
past. 5 However, <strong>the</strong>se countries already have such a large cohort <strong>of</strong> women <strong>of</strong> childbearing age<br />
that <strong>the</strong>ir populations continue to add significant numbers each year. In China, <strong>for</strong> example,<br />
although most couples have fewer than two children, zero population growth is still several<br />
decades away. While current growth rates have sunk to around 0.6 percent per year, China will<br />
add nearly 80 million people during each <strong>of</strong> <strong>the</strong> next two decades be<strong>for</strong>e its population peaks.<br />
India, though not quite as large as China today, is growing twice as fast, at 1.4 percent per year,<br />
and will add roughly 135 million people per decade <strong>for</strong> <strong>the</strong> next two decades. Even with a<br />
continued decline in <strong>the</strong>ir birth rates, <strong>the</strong>se two countries alone are expected to add roughly 400<br />
million people by 2025—more than today’s entire populations <strong>of</strong> <strong>the</strong> United States, <strong>the</strong> United<br />
Kingdom, <strong>the</strong> Ne<strong>the</strong>rlands, and Belgium combined.<br />
32
Table 2.1.B-1. The World’s Largest Countries (Population in Thousands)<br />
(Countries in Bold have large Muslim Populations)<br />
2009 2025<br />
China 1,345,751 China 1,453,140<br />
India 1,198,003 India 1,431,272<br />
USA 314,659 USA 358,735<br />
Indonesia 229,965 Indonesia 263,287<br />
Brazil 193,734 Pakistan 246,286<br />
Pakistan 180,808 Brazil 213,802<br />
Bang’desh 162,221 Nigeria 210,057<br />
Nigeria 154,729 Bang’desh 193,752<br />
Russia 140,874 Russia 132,345<br />
Japan 127,156 Mexico 123,366<br />
Mexico 109,610 Japan 120,793<br />
Philippines 91,983 Ethiopia 119,822<br />
Vietnam 88,069 Philippines 117,270<br />
Egypt 82,999 Egypt 104,970<br />
Ethiopia 82,825 Vietnam 102,054<br />
Germany 82,167 Congo, DR 98,123<br />
Turkey 74,816 Turkey 87,364<br />
Iran 74,196 Iran 87,134<br />
Thailand 67,764 Germany 79,258<br />
Congo, DR 66,020 Thailand 72,628<br />
France 62,343 Tanzania 67,394<br />
UK 61,565 UK 66,601<br />
Italy 59,870 France 65,769<br />
S. Africa 50,110 Italy 60,018<br />
Myanmar 50,020 Myanmar 57,582<br />
Most <strong>of</strong> <strong>the</strong> 20 largest countries in <strong>the</strong> world have modest growth rates but large demographic<br />
momentum and thus will make <strong>the</strong> largest contributions to total world population growth in <strong>the</strong><br />
next 20 years. The fastest growing countries are generally smaller, but <strong>the</strong>y are facing <strong>the</strong> largest<br />
burden <strong>of</strong> additional growth on a percentage basis (see Table 2.1.B-1). For <strong>the</strong> next several<br />
decades, global population growth will be concentrated in only a few regions and countries,<br />
mainly Muslim societies (almost <strong>the</strong> entire top half <strong>of</strong> Table 2.1.B-1) and huge states with<br />
33
populations <strong>of</strong> 75 million or more. Most <strong>of</strong> <strong>the</strong> states that comprise Table 2.1.B-1 are also among<br />
<strong>the</strong> world’s lower income countries. By contrast, population growth rates in Europe and Japan<br />
are already low, and in some cases <strong>the</strong>y are negative. There<strong>for</strong>e, <strong>the</strong> proportion <strong>of</strong> <strong>the</strong> world’s<br />
population living in Muslim states, or in <strong>the</strong> very largest and very poorest states, will grow, and<br />
<strong>the</strong> proportion <strong>of</strong> <strong>the</strong> world’s population living in developed countries will shrink. The major<br />
exception is <strong>the</strong> United States, which is expected to add 50 million people in <strong>the</strong> next 20 years—<br />
mostly due to recent and projected immigration <strong>of</strong> people born elsewhere.<br />
Some countries with extremely rapid population growth are likely to manage it reasonably well<br />
due to sound management and strong economic growth (e.g., Kuwait and <strong>the</strong> United Arab<br />
Emirates). However, in a number <strong>of</strong> “flash points,” <strong>the</strong> inability to integrate rapidly expanding<br />
populations into politics and <strong>the</strong> economy will lead to radical political mobilization among those<br />
angry at not attaining <strong>the</strong> level <strong>of</strong> prosperity reached by some <strong>of</strong> <strong>the</strong>ir neighbors. Similarly, some<br />
<strong>of</strong> <strong>the</strong> extremely large countries will probably manage <strong>the</strong>ir anticipated growth without conflicts.<br />
However, <strong>the</strong> sheer size <strong>of</strong> <strong>the</strong> population increases <strong>the</strong> large countries face in coming years,<br />
combined with <strong>the</strong>ir ef<strong>for</strong>ts to rapidly industrialize, means that many will also face a “tipping<br />
point,” when uneven development leaves tens <strong>of</strong> millions <strong>of</strong> disadvantaged people to watch o<strong>the</strong>r<br />
millions reap <strong>the</strong> benefits <strong>of</strong> rapid growth. The disparities <strong>of</strong> economic <strong>for</strong>tune among classes,<br />
regions, or ethnic groups may become so great as to spark violent protests. Alternately, <strong>the</strong><br />
migration <strong>of</strong> rural masses to urban and industrial centers could produce a social crisis. We cannot<br />
predict which countries will face such crises, as <strong>the</strong> crises are due to failed political leadership<br />
and administrative management more than population changes per se. But we can say that in<br />
many <strong>of</strong> <strong>the</strong> largest countries, governments will face exceptional challenges in meeting <strong>the</strong>ir<br />
populations’ demands <strong>for</strong> both strong and equitable economic growth and sound political<br />
management.<br />
We can say with certainty that <strong>the</strong>se trends pose major dilemmas <strong>for</strong> <strong>the</strong> economic policy and<br />
development <strong>of</strong> <strong>the</strong> West, particularly Europe. In 2005, all <strong>of</strong> Europe comprised 731 million<br />
people, which is projected to shrink to just 664 million by 2050, while <strong>the</strong> rest <strong>of</strong> <strong>the</strong> world is<br />
projected to grow from 5.8 billion to 8.5 billion. 6 That is, in a single generation (<strong>the</strong> next 42<br />
years), global population outside <strong>of</strong> Europe will increase by 2.7 billion, while Europe’s<br />
population will decrease by about 67 million. The shrinking demographic weight <strong>of</strong> European<br />
countries puts <strong>the</strong>m on <strong>the</strong> horns <strong>of</strong> a dilemma. If <strong>the</strong> economies <strong>of</strong> fast-growing developing<br />
countries do not catch up to those <strong>of</strong> <strong>the</strong> richer countries, <strong>the</strong>n <strong>the</strong> standard <strong>of</strong> living enjoyed by<br />
<strong>the</strong> West will seem more elite and unfair than ever, fueling resentment <strong>of</strong> developing countries<br />
against <strong>the</strong> G-8. On <strong>the</strong> o<strong>the</strong>r hand, if economic growth in those countries does exceed that <strong>of</strong> <strong>the</strong><br />
West so that living standards in poor countries or regions starts to approach those <strong>of</strong> rich<br />
countries or regions, <strong>the</strong>n <strong>the</strong> combination <strong>of</strong> shrinking population and lagging economies will<br />
render <strong>the</strong> G-8 countries more and more irrelevant to <strong>the</strong> world economy. Greater resentment or<br />
greater irrelevance: certainly a difficult choice.<br />
Europe’s combined GDP in 2007 was US$14 trillion dollars (CIA, 2008). 7 Assuming GDP<br />
growth per capita <strong>of</strong> 2.5 percent per year and no net population growth, Europe’s economy<br />
would increase by US$9 trillion (excluding inflation) by 2025. For Asia (excluding Japan), 2007<br />
GDP was slightly larger, at US$18 trillion dollars (CIA, 2008). But due to modest growth in<br />
GDP per capita plus large population increases in most countries, total GDP is growing far more<br />
rapidly in this region. Iran and Pakistan achieved recent growth rates <strong>of</strong> 4 and 6 percent per year,<br />
respectively, while India and China were growing by 8-10 percent per year—and despite <strong>the</strong><br />
34
global economic downturn, both countries are expected to continue growing by 6-7 percent in<br />
2009. 8,9 If Asia (excluding Japan) can sustain an overall growth rate <strong>of</strong> total GDP <strong>of</strong> 5 percent<br />
per year over <strong>the</strong> next 20 years, <strong>the</strong> increase in Asia’s GDP would be US$30 trillion¸ or more<br />
than three times <strong>the</strong> total economic growth <strong>of</strong> Europe.<br />
If Asian (excluding Japanese) GDP does not grow at 5 percent per year, living standards <strong>the</strong>re<br />
will not catch up to those in Europe and Japan. Yet if Asian (excluding Japanese) GDP does<br />
grow at that pace, <strong>the</strong>n given <strong>the</strong> size <strong>of</strong> <strong>the</strong> area, <strong>the</strong> preponderance <strong>of</strong> economic growth on <strong>the</strong><br />
Eurasian continent will be occurring outside <strong>of</strong> Europe. Investment and innovation are likely to<br />
move increasingly to areas outside <strong>of</strong> Europe, fur<strong>the</strong>r weakening Europe’s economic strength<br />
and leadership. In o<strong>the</strong>r words, we are on <strong>the</strong> cusp <strong>of</strong> a global tipping point, in which East and<br />
South Asia come to eclipse Europe and Japan as major sources <strong>of</strong> global economic growth—a<br />
point made all <strong>the</strong> more sharply as Europe and Japan remained in recession in early 2009 while<br />
China is returning to rapid growth.<br />
These demographic and economic changes also indicate that <strong>the</strong> military capacities <strong>of</strong> large<br />
developing countries will increase, while <strong>the</strong> ability <strong>of</strong> rich nations to put “boots on <strong>the</strong> ground”<br />
in conflict zones will diminish. Managing conflicts involving developing countries will become<br />
more difficult, and <strong>the</strong> ef<strong>for</strong>t will put more strain on developed countries’ economies than be<strong>for</strong>e.<br />
As <strong>the</strong> portion <strong>of</strong> <strong>the</strong> global economy contributed by <strong>the</strong> G-8 countries shrinks, countries such as<br />
China, India, Turkey, Brazil, Indonesia, and Mexico will become global economic powers.<br />
Admitting major regional powers into international governance bodies is vital if those<br />
organizations are to retain legitimacy. The November 2008 Summit on Financial Markets and <strong>the</strong><br />
World Economy expanded <strong>the</strong> “G-group” to include <strong>the</strong>se big emerging democratic economies<br />
—a trend that must continue if such ef<strong>for</strong>ts are truly going to grapple with <strong>the</strong> global economy.<br />
Moreover, if <strong>the</strong> United States and Europe fail to support economic growth in <strong>the</strong> developing<br />
world, <strong>the</strong> rapidly increasing numbers <strong>of</strong> people in non-European and mainly Muslim countries<br />
is simply going to fuel ever-greater resentment <strong>of</strong> <strong>the</strong> West’s position, exacerbating <strong>the</strong> problems<br />
<strong>of</strong> terrorism, smuggling, and illegal trafficking as <strong>the</strong> ways to “get ahead” and “get even.” In<br />
short, <strong>the</strong> U.S. and Europe have no choice but to support and actively engage <strong>the</strong> fast-growing<br />
countries <strong>of</strong> <strong>the</strong> world, to improve relations with <strong>the</strong>ir populations, and to support and seek to<br />
share in <strong>the</strong>ir growth.<br />
The Great Slowdown in Population Growth in High-Income Countries<br />
During <strong>the</strong> next several decades, <strong>the</strong> population <strong>of</strong> most European countries, including Russia,<br />
Germany, Italy, Ukraine, Spain, Poland, Romania, <strong>the</strong> Czech Republic, and Hungary, will shrink<br />
substantially. This is due mainly to a sharp decline in <strong>the</strong> number <strong>of</strong> children per couple to well<br />
under 2.0 and in some cases under 1.5. 10 This slowdown will be accompanied by a rapid increase<br />
in <strong>the</strong> percentage <strong>of</strong> <strong>the</strong> population in higher age brackets, as <strong>the</strong> number <strong>of</strong> young children falls<br />
fur<strong>the</strong>r behind <strong>the</strong> number <strong>of</strong> aging baby boomers. By 2050, <strong>the</strong> percentage <strong>of</strong> Japan’s and<br />
Europe’s population over age 60 is expected to double, ultimately comprising 35 to 40 percent <strong>of</strong><br />
<strong>the</strong> total population. 11<br />
This pattern is highly novel and abnormal. Historically, population growth has stagnated on<br />
occasion or has been substantially reduced by major epidemics, with <strong>the</strong> cause being high<br />
mortality, especially among <strong>the</strong> young. Birth rates remained high, and when conditions were<br />
more propitious to growth, population increase resumed. In modern Europe, <strong>the</strong> United States,<br />
35
Canada, and Japan, decreasing birth rates have precipitated population decline. Women are<br />
marrying later, if at all, and having fewer children. The result is an unprecedented aging <strong>of</strong><br />
populations (less so in <strong>the</strong> United States), at <strong>the</strong> very same time that national economies can be<br />
expected to decline dramatically as a percentage <strong>of</strong> global GDP.<br />
This slowdown in population growth has major implications <strong>for</strong> overall economic growth. 12 The<br />
economies <strong>of</strong> aging nations will not be stimulated by growing numbers <strong>of</strong> consumers and<br />
demand <strong>for</strong> housing. The capital growth generated by larger generations <strong>of</strong> young people<br />
approaching <strong>the</strong>ir peak earning years and saving <strong>for</strong> retirement will cease as well. Even if <strong>the</strong><br />
growth <strong>of</strong> Europe’s income per capita remained constant, its overall economic growth rate would<br />
be cut in half as <strong>the</strong> population declines over <strong>the</strong> next 30-50 years. An overall growth rate this<br />
small allows few margins <strong>for</strong> accumulation to invest <strong>for</strong> <strong>the</strong> future. As Benjamin Friedman 13 has<br />
argued, substantial growth rates allow more groups to share to some degree in growth, and<br />
provide social resources <strong>for</strong> a variety <strong>of</strong> services and investments. Overall growth rates below 2<br />
percent per year, by contrast, allow <strong>for</strong> little redistribution or investment and tend to heighten<br />
social conflicts over such issues as pensions, migration, and labor/employer relations—situations<br />
we might see as <strong>the</strong> global economic downturn progresses.<br />
Opposing Age Shifts and Migration Pressures<br />
At <strong>the</strong> same time, <strong>the</strong> populations <strong>of</strong> much <strong>of</strong> <strong>the</strong> developing world will be tilted in <strong>the</strong> opposite<br />
direction, toward a larger percentage <strong>of</strong> youth. The youngest countries—all in <strong>the</strong> developing<br />
world—will have populations with only about 5 percent above age 60, but with nearly 50 percent<br />
under age 14. 14 While Europe and Japan will approach <strong>the</strong> mid-21 st century with populations that<br />
are tilted toward <strong>the</strong> old, much <strong>of</strong> <strong>the</strong> developing world will have populations that are tilted<br />
toward <strong>the</strong> young (see map).<br />
The obvious result <strong>of</strong> this imbalance is already taking place: a massive migration <strong>of</strong> young and<br />
working-age populations from <strong>the</strong> developing world to <strong>the</strong> developed world. Between 2000 and<br />
2005, 2.6 million migrants moved each year to more developed countries from less developed<br />
regions. 15 Seeking new livelihood opportunities and entry-level jobs, young people are<br />
irresistibly drawn from high-youth-density regions to those with a lower percentage <strong>of</strong> youth; <strong>the</strong><br />
OECD countries currently host 10 million <strong>for</strong>eign-born immigrants ages 15-24 and 55 million<br />
between ages 25-64. 16<br />
Yet this immigration—increasingly contentious in <strong>the</strong> developed world—is not <strong>the</strong> only<br />
consequence <strong>of</strong> this imbalance. To sustain <strong>the</strong>ir elderly populations, Europe, Japan, and North<br />
America will have to spend more money on health care and pension support. Whe<strong>the</strong>r active or<br />
ailing, <strong>the</strong> elderly population will need intensive medical procedures and medications necessary<br />
to sustain an active and healthy life into older ages—at a time when <strong>the</strong> domestic supply <strong>of</strong> new<br />
doctors and nurses will likely decline.<br />
36
Red: 40+ Pink: 30-39 Light Blue: 20-29 Dark Blue:
2. Increase Immigration. Secondly, countries could increase immigration and seek to raise<br />
immigrants’ productivity and earnings to <strong>the</strong> average level as quickly as possible. While<br />
integrating and educating immigrants can take a generation or more, <strong>the</strong> United States,<br />
Australia, and Canada have enjoyed <strong>the</strong> benefits <strong>of</strong> making it easy <strong>for</strong> immigrants<br />
(especially skilled ones) to start businesses, acquire education, and move into <strong>the</strong><br />
mainstream, such that <strong>the</strong> incomes <strong>of</strong> many immigrant groups exceeds <strong>the</strong> national norm.<br />
Even lower-skilled migrants can raise <strong>the</strong> overall productivity <strong>of</strong> a society if <strong>the</strong>y work<br />
<strong>for</strong> lower wages than had previously been paid to non-migrants <strong>for</strong> similar work.<br />
Un<strong>for</strong>tunately, both in Europe and recently in <strong>the</strong> United States, debates on immigration<br />
have exposed <strong>the</strong> fear that immigration steals wealth from <strong>the</strong> native population. This<br />
pernicious view echoes <strong>the</strong> similarly mistaken idea that protecting trade by imposing high<br />
tariffs or blocking <strong>for</strong>eign investment will preserve <strong>the</strong> prosperity <strong>of</strong> a country. Migrants<br />
tend to self-select <strong>for</strong> entrepreneurial talent, ambition, and energy, and <strong>the</strong>re<strong>for</strong>e <strong>the</strong>y<br />
produce net gains <strong>for</strong> national economies that accept <strong>the</strong>m. 19 A European country (or<br />
Japan) that has lost much <strong>of</strong> its own demographic momentum and energy can ill af<strong>for</strong>d to<br />
exclude new generations, even if <strong>the</strong>y come from abroad.<br />
3. Implement Pro-natal Policies. A third way to head <strong>of</strong>f this impending growth slowdown<br />
would be to pursue pro-natal policies that encourage larger families among <strong>the</strong> existing<br />
populations. However, it is not clear which policies would cause this result;<br />
demographers do not fully agree on <strong>the</strong> reasons underlying a baby boom. Unless societies<br />
start placing a higher worth on larger families than on expanding <strong>the</strong> consumption <strong>of</strong><br />
consumer goods, small families will continue to be preferred. In richer countries, higher<br />
fertility is mainly found among more religious families, which is one <strong>of</strong> <strong>the</strong> factors<br />
accounting <strong>for</strong> much higher population growth in <strong>the</strong> United States than in Europe. 20<br />
Short <strong>of</strong> a religious revival in Europe, a major increase in fertility and family size seems<br />
<strong>the</strong> least likely solution to <strong>the</strong> continent’s demographic and economic decline.<br />
4. Encourage Older Migrants to Relocate to Developing Countries. Fourth, and perhaps<br />
least discussed, encouraging a “reverse flow” <strong>of</strong> older migrants from developed to<br />
developing countries could create great benefits <strong>for</strong> both. If older migrants take <strong>the</strong>ir<br />
retirement along <strong>the</strong> sou<strong>the</strong>rn coast <strong>of</strong> <strong>the</strong> Mediterranean, or in Latin America or Africa,<br />
it can greatly reduce <strong>the</strong> costs <strong>of</strong> <strong>the</strong>ir retirement. Of course, developing countries will<br />
need quality residential and medical facilities to ensure that <strong>the</strong>se are desirable<br />
destinations. This ef<strong>for</strong>t could also counteract <strong>the</strong> constant drain <strong>of</strong> medical and nursing<br />
talent to rich developed countries. “Medical tourism” to many developing countries has<br />
already begun as residents <strong>of</strong> developed countries seek lower prices <strong>for</strong> medical<br />
procedures. Investment in facilities that will make long-term retirement attractive in<br />
cheaper locales will reduce <strong>the</strong> pension and medical cost burden <strong>for</strong> developed countries<br />
while channeling jobs and investment to developing countries with ample labor.<br />
While Europe, <strong>the</strong> United States, and Japan will have older populations and many nearby<br />
developing countries will have young populations, <strong>the</strong> global population as a whole will<br />
none<strong>the</strong>less be heading <strong>for</strong> a relatively healthy age distribution <strong>of</strong> population. The most logical<br />
way to overcome <strong>the</strong> population distortions in varied regions will <strong>the</strong>re<strong>for</strong>e be to ease <strong>the</strong> barriers<br />
to movement across borders to take advantage <strong>of</strong> <strong>the</strong> overall balance.<br />
No doubt, a combination <strong>of</strong> all four methods will be required to <strong>of</strong>fset <strong>the</strong> slowdown in<br />
population growth in high-income countries. However, we should recognize that one <strong>of</strong> <strong>the</strong><br />
38
iggest obstacles is <strong>the</strong> growing antagonism between <strong>the</strong> West and much <strong>of</strong> <strong>the</strong> Muslim world.<br />
The way <strong>for</strong>ward <strong>for</strong> <strong>the</strong> West lies in greater openness and integration, increased investment in<br />
growth abroad, better integration <strong>of</strong> immigrant communities, and reduced barriers to emigration<br />
from fast-growing but youthful societies. None <strong>of</strong> this is possible with <strong>the</strong> high levels <strong>of</strong> fear,<br />
mistrust, and antagonism between <strong>the</strong> West and populations <strong>of</strong> many <strong>of</strong> <strong>the</strong> largest and fastest<br />
growing countries <strong>of</strong> <strong>the</strong> world. We must reach <strong>the</strong> degree <strong>of</strong> cooperation necessary to respond to<br />
<strong>the</strong> global population changes already in place <strong>for</strong> <strong>the</strong> next half-century. Much more than<br />
terrorism, <strong>the</strong>se trends will affect <strong>the</strong> long-term prosperity <strong>of</strong> <strong>the</strong> developed but stagnating and<br />
rapidly aging populations <strong>of</strong> <strong>the</strong> West, as well as <strong>the</strong> fast-growing and extremely youthful<br />
population <strong>of</strong> <strong>the</strong> developing and largely Muslim nations.<br />
An Increasingly Urban World<br />
A hallmark <strong>of</strong> higher-income countries and regions throughout history has been <strong>the</strong> rise <strong>of</strong> large<br />
cities, from Xi’an to Rome to Constantinople (Istanbul) to Edo to London. Most low- and<br />
middle-income countries are now going through a transition from a situation in which most<br />
families were rural farm-producing families to a condition in which most families are urban<br />
consuming families. This creates new pressures on education, sanitation, energy supply,<br />
transportation, food storage, and food distribution. These pressures are greater in cities, and <strong>the</strong>se<br />
demands fall chiefly on governments which can face opposition and even violence in <strong>the</strong> absence<br />
<strong>of</strong> jobs and adequate food supplies. Today, it is not so much <strong>the</strong> number <strong>of</strong> people per se, but <strong>the</strong><br />
changing consumption and distribution patterns <strong>of</strong> populations (much <strong>of</strong> it linked to rising<br />
incomes and urbanization) that is putting pressure on global food and energy supplies.<br />
For less-developed regions as a whole, <strong>the</strong> United Nations projects <strong>the</strong> percentage <strong>of</strong> urban<br />
population will increase from 42.7% in 2005 to 56% by 2030 and 67% by 2050. That is a fifty<br />
percent increase in <strong>the</strong> urban percentage, but since this increase is occurring in fast-growing<br />
countries, <strong>the</strong> total urban population is projected to more than double by mid-century. That<br />
projection entails <strong>the</strong> incredible figure <strong>of</strong> three billion additional urban residents in <strong>the</strong> less<br />
developed countries, added to <strong>the</strong> 2.3 billion who were <strong>the</strong>re in 2005.<br />
In sub-Saharan Africa, urbanization will be even more rapid, with <strong>the</strong> urban percentage expected<br />
to almost double, from 35% in 2005 to 67% in 2050, bringing about a tripling in total urban<br />
population from roughly 300 million today to over 1 billion by mid-century. In China and India,<br />
urban populations are also expected to grow explosively to 2050, increasing to 73% <strong>of</strong> total<br />
population in China (from roughly 40%) today and rising to 55% <strong>of</strong> total population in India<br />
(from under 30% today). Toge<strong>the</strong>r, <strong>the</strong>se two mega-populations are projected to increase <strong>the</strong>ir<br />
urban populations by over one billion people. 21<br />
While <strong>the</strong>se projections may not be realized, it is vital to recognize that <strong>the</strong> “normal” urban<br />
percentage <strong>for</strong> developed countries is about 75% today, and it is logical to expect low- and<br />
middle-income countries to move toward this figure as <strong>the</strong>y develop.<br />
Since increasing employment and <strong>the</strong> efficiency <strong>of</strong> agriculture generally entails moving people<br />
<strong>of</strong>f <strong>the</strong> land and into urban centers, it is reasonable to treat <strong>the</strong>se projections as likely ra<strong>the</strong>r than<br />
as grim or abnormal.<br />
Still, <strong>the</strong>se levels <strong>of</strong> urbanization are likely to be reached at much lower levels <strong>of</strong> per capita<br />
income in most <strong>of</strong> <strong>the</strong> world than has been <strong>the</strong> case <strong>for</strong> <strong>the</strong> developed nations today. Today’s<br />
more developed regions did not attain urbanization levels <strong>of</strong> 65% until 1970, and <strong>the</strong> United<br />
39
States did not reach this level until 1950. 22 In fact, <strong>the</strong> rapid urbanization in today’s developing<br />
world is most likely to occur in a manner similar to that <strong>of</strong> 19th century in Europe, when policing<br />
was inadequate, jobs were demanding, cyclical, and unregulated, and sanitation and education<br />
were limited. The result <strong>the</strong>n was widespread labor strife, periodic urban rebellion, and even<br />
revolutions (1820s, 1830s, and 1848). Given that <strong>the</strong> developing world is facing a very similar<br />
situation <strong>of</strong> high numbers <strong>of</strong> youth, rapid development, high levels <strong>of</strong> urbanization, and relatively<br />
weak and <strong>of</strong>ten undemocratic governance, it is likely that systemic disorders will also arise<br />
unless ef<strong>for</strong>ts at global integration and support <strong>for</strong> fragile states can blunt those tendencies.<br />
However, a major concern, again, is <strong>the</strong> continuing hostility between Muslim and western<br />
nations. Urban settings—even more than remote caves—<strong>of</strong>fer excellent opportunities <strong>for</strong><br />
recruitment and hiding <strong>of</strong> terrorist networks. The sheer proliferation <strong>of</strong> mosque and<br />
neighborhood networks, access to <strong>the</strong> Internet, easy transportation links, and concentration <strong>of</strong><br />
targets mean that unless <strong>the</strong> proclivity <strong>of</strong> Jihadist groups to seek violence against <strong>the</strong> US and<br />
regimes allied to <strong>the</strong> West is sharply reduced, we can expect rapid urbanization to create<br />
increased opportunities <strong>for</strong> terrorist acts.<br />
In addition, migration from countryside to city is only one step in what tend to become growing<br />
migration networks. In <strong>the</strong>se networks, people move first from <strong>the</strong> countryside to regional urban<br />
centers, and <strong>the</strong>n a portion <strong>of</strong> those move to national metropoles, major ports or industrial<br />
centers. This provides <strong>the</strong>m with increased access to international migration networks. Increased<br />
urbanization in <strong>the</strong> developing world is thus likely to increase <strong>the</strong> flow <strong>of</strong> international migration<br />
from <strong>the</strong> developing to <strong>the</strong> developed world, again, just as <strong>the</strong> 19 th century European pattern<br />
showed increased international migration to <strong>the</strong> Americas.<br />
In short, <strong>the</strong> world <strong>of</strong> <strong>the</strong> first third <strong>of</strong> <strong>the</strong> twenty-first century will be quite different than <strong>the</strong><br />
previous half century. The future will be a world <strong>of</strong> (1) fast-growing economies,<br />
(2) predominantly urbanized populations in <strong>the</strong> developing countries, (3) population stagnation,<br />
and (4) relative economic decline in Europe, Japan, and <strong>the</strong> United States. It will be a world in<br />
which <strong>the</strong> pressures <strong>for</strong> migration <strong>of</strong> young people to <strong>the</strong> aging societies <strong>of</strong> <strong>the</strong> West will become<br />
overwhelming, and in which <strong>the</strong> center <strong>of</strong> new investment and innovation shifts to <strong>the</strong> East. It<br />
will be a world in which civil and regional conflicts over <strong>the</strong> distribution <strong>of</strong> wealth and<br />
opportunities are likely to arise, yet where <strong>the</strong> aging and relatively smaller U.S. and NATO<br />
economies are less able to act independently to keep order in relatively larger transitional<br />
societies. Overall, and most importantly, it will be a world that cannot and will not be dominated<br />
by <strong>the</strong> power and economic weight <strong>of</strong> <strong>the</strong> Atlantic and west Pacific Rim economies, but ra<strong>the</strong>r by<br />
<strong>the</strong> mainland economies <strong>of</strong> Asia, <strong>the</strong> Middle East, and parts <strong>of</strong> Africa and Latin America. It will<br />
thus be a world in which expanded cooperation and deeper integration between <strong>the</strong> West and <strong>the</strong><br />
developing (and especially Muslim) societies will be essential to maintaining order.<br />
Conclusion: Embracing Globalization and New Global Institutions<br />
As a greater portion <strong>of</strong> global economic growth and manpower shifts inevitably to Asia, Africa,<br />
and Latin America, <strong>the</strong> security and prosperity <strong>of</strong> <strong>the</strong> north Atlantic societies will depend on <strong>the</strong>ir<br />
ability to share in that growth, both by direct investment and economic linkages. At <strong>the</strong> same<br />
time, however, threats <strong>of</strong> local and regional conflicts in <strong>the</strong>se high-manpower areas will confront<br />
North Atlantic societies who will have fewer young men and fewer free resources to support<br />
<strong>the</strong>ir military power given <strong>the</strong>ir needs to support pensions and health care <strong>for</strong> <strong>the</strong>ir older<br />
population.<br />
40
These trends <strong>the</strong>re<strong>for</strong>e require action in two major respects: first in regard to <strong>the</strong> major<br />
international institutions <strong>for</strong> military, financial, and diplomatic action, and second in regard to<br />
policies <strong>for</strong> international migration and law en<strong>for</strong>cement.<br />
At this writing, <strong>the</strong> G-20 is replacing <strong>the</strong> G-8 as <strong>the</strong> international assembly that will arbitrate and<br />
coordinate global financial policies; that is <strong>the</strong> natural direction <strong>for</strong> future revision <strong>of</strong> <strong>the</strong> global<br />
institutional architecture. The global institutions established at <strong>the</strong> end <strong>of</strong> <strong>the</strong> second world war<br />
were designed to perpetuate <strong>the</strong> power <strong>of</strong> that war’s victors: The United States, France, Britain,<br />
Russia, and China (first <strong>the</strong> Republic on Taiwan, now <strong>the</strong> People’s Republic on <strong>the</strong> mainland).<br />
The World Bank, <strong>the</strong> International Monetary Fund, and <strong>of</strong> course <strong>the</strong> United Nations retain a<br />
structure giving <strong>the</strong>se countries a dominant role, yet in <strong>the</strong> near future, a realistic appraisal <strong>of</strong><br />
global economic and manpower strength would show a more diverse and more balanced roster:<br />
<strong>the</strong> United States, Russia, and China to be sure, but also <strong>the</strong> European Union as a whole (with<br />
Germany, Poland, Spain, and Italy as key players), India, Brazil, Indonesia, Pakistan, Turkey,<br />
Nigeria, South Africa, Mexico, and perhaps Iran, Ukraine, Vietnam, and o<strong>the</strong>rs. Given <strong>the</strong> rapid<br />
shifts in economic and population growth expected in <strong>the</strong> years ahead, it seems it would be wise<br />
if international institutions had a more flexible leadership structure. Ra<strong>the</strong>r than a fixed set <strong>of</strong><br />
countries filling key roles or staffing major institutions, it might be wise to stipulate that any<br />
country, or any regional group <strong>of</strong> countries that establishes a common leadership or<br />
representative faculty, which comprises 4% or more <strong>of</strong> <strong>the</strong> world’s population or 4% or more <strong>of</strong><br />
<strong>the</strong> world’s economy should have a seat at <strong>the</strong> leader’s table.<br />
While such trends seem already underway in regard to global finance, a shift in <strong>the</strong> world’s<br />
military alignments seems to be required, as well. If <strong>the</strong> major conflicts <strong>of</strong> <strong>the</strong> future are not<br />
likely to be between NATO and Russia, or between Australia and Indonesia, or between Bolivia<br />
and Brazil—in short, less likely to be international than domestic or regional conflicts brought on<br />
by state failures—<strong>the</strong>n <strong>the</strong> major international military alliances need to have <strong>the</strong> capacity to<br />
intervene <strong>for</strong> humanitarian purposes and to provide order in failed states and regions affected by<br />
<strong>the</strong>m. That is a requirement <strong>for</strong> relatively low-tech but trained military and civilian manpower<br />
that can be deployed in various regions <strong>of</strong> <strong>the</strong> world at an af<strong>for</strong>dable cost. This requirement<br />
simply cannot be supplied by NATO <strong>for</strong> <strong>the</strong> extended future, or not as NATO is currently<br />
configured. This means it will be necessary ei<strong>the</strong>r to expand NATO itself or replace it with a new<br />
global military alliance (with similar shared training and equipment to allow coordinated joint<br />
functions) geared to moving large numbers <strong>of</strong> military and civilian units into unstable areas and<br />
supporting <strong>the</strong>m <strong>the</strong>re. This will clearly require a partnership that spans regions and that includes<br />
both countries with large numbers <strong>of</strong> moderate-cost military and civilians available, and<br />
countries with logistic and financial resources to support <strong>the</strong>m. More explicitly, this means<br />
incorporating countries such as Brazil, Indonesia, and possibly Pakistan, <strong>the</strong> Philippines, South<br />
Africa, and o<strong>the</strong>rs into a joint structure. Right now, <strong>the</strong> United Nations’ blue helmets draw on<br />
such countries precisely <strong>for</strong> such stabilization and peace-keeping missions. However, <strong>the</strong>ir<br />
resources are limited, and <strong>the</strong>ir joint training and coordination a work-in-progress. Moreover,<br />
<strong>the</strong>y have <strong>the</strong> anomalous character <strong>of</strong> being deployed (and <strong>of</strong>ten commanded) by <strong>the</strong> decisions <strong>of</strong><br />
<strong>the</strong> UN Security Council, which is dominated by <strong>the</strong> handful <strong>of</strong> WWII dominant nations but is<br />
manned mainly by troops from poorer countries who are <strong>of</strong>ten unrepresented on <strong>the</strong> Security<br />
Council. Given <strong>the</strong> likely prevalence <strong>of</strong> such missions in <strong>the</strong> future, driven by growing numbers<br />
<strong>of</strong> young men and urban expansion in developing economies affected by climate change and<br />
economic change, it would seem prudent to prepare <strong>the</strong> most effective <strong>for</strong>ces <strong>for</strong> such missions<br />
by pooling <strong>the</strong> resources <strong>of</strong> diverse nations.<br />
41
Finally, given <strong>the</strong> huge pressures <strong>for</strong> migration from poor to rich countries that will arise in <strong>the</strong><br />
coming decades, it seems <strong>the</strong> choice faced by rich countries is whe<strong>the</strong>r to struggle against it or<br />
take measures that will make such migration more peaceful and productive. Aside from <strong>the</strong> fact<br />
that fighting such migration is unlikely to work, it will deny <strong>the</strong> rich countries <strong>the</strong> young workers<br />
<strong>the</strong>y desperately need, and it will also deny poorer countries <strong>the</strong> safety-valve and means <strong>of</strong><br />
training entrepreneurs that <strong>the</strong>y desperately need. It would be more fruitful to invest in ways to<br />
integrate migrants, encourage circular migration (e.g., departure after a period <strong>of</strong> work), and even<br />
stimulate reverse migration to send retirees and medical-care and second career workers from <strong>the</strong><br />
rich world to developing countries.<br />
Yet it must be recognized that with growing migration and international economic flows will<br />
come opportunities <strong>for</strong> illicit trafficking, smuggling, and even terror operations. There<strong>for</strong>e, <strong>the</strong><br />
need <strong>for</strong> international cooperation in policing (not merely military actions), border patrol, and<br />
extradition will grow rapidly, as well. Again, new international arrangements <strong>for</strong> joint action and<br />
coordination will be necessary if <strong>the</strong> legitimate authorities are to keep pace with <strong>the</strong> globalization<br />
<strong>of</strong> criminal actions.<br />
While population change poses major challenges, <strong>the</strong>re is no reason to fear adverse consequences<br />
unless <strong>the</strong>re is an attempt to willfully try to preserve a vanishing past in which a handful <strong>of</strong><br />
dominant nations that dominated global growth since 1800 continue to regard <strong>the</strong>mselves as<br />
primary and <strong>the</strong> rest <strong>of</strong> <strong>the</strong> world as secondary in power and importance. In fact, <strong>the</strong> population<br />
and economic growth <strong>of</strong> <strong>the</strong> developing world is a great opportunity <strong>for</strong> all people <strong>of</strong> <strong>the</strong> world<br />
to share in ano<strong>the</strong>r century <strong>of</strong> economic growth and enriched cultural and technical diversity.<br />
Canadian tourists visiting <strong>the</strong> Brazilian or Indonesian rain<strong>for</strong>ests in solar power vehicles and<br />
wearing natural/organic garments produced in African and south Asia while pondering <strong>the</strong>ir<br />
investments in new communication and entertainment technologies is <strong>the</strong> future we should seek.<br />
Enabling that future and avoiding risks <strong>of</strong> chaos will require new economic and military<br />
institutions that allow a closer meshing <strong>of</strong> peoples and economies while maintaining a<br />
framework <strong>for</strong> preserving order in a more globalized world.<br />
↑ Back to <strong>the</strong> top<br />
1 Goldstone, Jack A. (2002). “Population and security: How demographic change can lead to violent<br />
conflict. Columbia Journal <strong>of</strong> International Affairs 56, 245-263.<br />
2 Cincotta, Richard, Robert Engelman, & Daniele Anastasion. (2003). The Security Demographic.<br />
Washington, DC: Population Action International.<br />
3 Leahy, Elizabeth, with Robert Engelman, Carolyn Gibb Vogel, Sarah Haddock, & Tod Preston. (2007).<br />
The shape <strong>of</strong> things to come. Washington, DC: Population Action International.<br />
4 UN Population Division. (2007). World population prospects, 2006 revision [Database]. Available<br />
online at http://esa.un.org/unpp/<br />
5 UN Population Division. (2007). World population prospects, 2006 revision [Database]. Available<br />
online at http://esa.un.org/unpp/<br />
6 UN Population Division. (2008). World urbanization prospects: The 2007 revision population Database<br />
[Database]. Available online at http://esa.un.org/unup/<br />
7 Central Intelligence Agency (CIA). (2008). World factbook. Washington, DC: U.S. Government<br />
Printing Office. Available online at https://www.cia.gov/library/publications/<strong>the</strong>-world-factbook/<br />
8 Central Intelligence Agency (CIA). (2008). World factbook. Washington, DC: U.S. Government<br />
Printing Office. Available online at https://www.cia.gov/library/publications/<strong>the</strong>-world-factbook/<br />
42
9 Economist Intelligence Unit. (2008, December 1). Country Forecast December 2008 Updater. Available<br />
online at www.eiu.com<br />
10 UN Population Division. (2007). World population prospects, 2006 revision [Database]. Available<br />
online at http://esa.un.org/unpp/<br />
11 Jackson, Richard, & Neil Howe, with Rebecca Strauss & Keisuke Nakashima. (2008). The graying <strong>of</strong><br />
<strong>the</strong> great powers: Demography and geopolitics in <strong>the</strong> 21st century. Washington, DC: Center <strong>for</strong><br />
Strategic and International Studies.<br />
12 Eberstadt, Nicholas. (2001, March/April). “The population implosion.” Foreign Policy.<br />
13 Friedman, Benjamin. (2005). The moral consequences <strong>of</strong> economic growth. New York: Alfred Knopf.<br />
14 UN Population Division. (2007). World population prospects, 2006 revision [Database]. Available<br />
online at http://esa.un.org/unpp/<br />
15 UN Population Division. (2006, March). International migration 2006. New York: United Nations.<br />
Available online at<br />
http://www.un.org/esa/population/publications/2006Migration_Chart/Migration2006.pdf<br />
16 Longman, Philip. (2006, March/April). “The return <strong>of</strong> patriarchy.” Foreign Policy. Organisation <strong>for</strong><br />
Economic Cooperation and Development (OECD). (2008). OECD. Statistical Extracts [Database].<br />
Available online at http://stats.oecd. org/wbos/index.aspx?lang=en<br />
17 Goldstone, Jack A. (2006). “Engineering, culture, innovation, and modern wealth creation.” In Irene<br />
Johansson (Ed.), Innovations and entrepreneurship in functional regions, Uddevalla Symposium 2005<br />
(pp. 455-474). Trollhattan, Sweden: University West.<br />
18 United States Department <strong>of</strong> Labor (DOL). (2008). Chartbook <strong>of</strong> international labor comparisons: The<br />
Americas, Asia, Europe. Washington, DC: DOL.<br />
19 Simon, Julian L. (1999). The economic consequences <strong>of</strong> immigration (2nd ed). Ann Arbor, MI:<br />
University <strong>of</strong> Michigan Press.<br />
20 Longman, Philip. (2006, March/April). “The return <strong>of</strong> patriarchy.” Foreign Policy. Organisation <strong>for</strong><br />
Economic Cooperation and Development (OECD). (2008). OECD. Statistical Extracts [Database].<br />
Available online at http://stats.oecd. org/wbos/index.aspx?lang=en<br />
21 UN Population Division. (2008). World urbanization prospects: The 2007 revision population<br />
Database [Database]. Available online at http://esa.un.org/unup/<br />
22 UN Population Division. (2008). World urbanization prospects: The 2007 revision population<br />
Database [Database]. Available online at http://esa.un.org/unup/<br />
43
2.1.C. Demographic Security (Elizabeth Leahy Madsen)<br />
Author and Organization: Elizabeth Leahy Madsen, Senior Research Associate, Population<br />
Action International<br />
Contact In<strong>for</strong>mation: emadsen@popact.org<br />
This paper reviews findings related to population and two aspects <strong>of</strong> stability—outbreaks <strong>of</strong> civil<br />
conflict and level <strong>of</strong> democratic governance—at <strong>the</strong> global scale. Because future stability will in<br />
part be shaped by <strong>the</strong> demographic trends that are already underway, this paper evaluates <strong>the</strong><br />
implications <strong>of</strong> population projections and <strong>the</strong> assumptions that will be required to achieve <strong>the</strong>m.<br />
The <strong>the</strong>me <strong>of</strong> <strong>the</strong> paper is that population influences security and development and is an<br />
important underlying variable in global stability because <strong>of</strong> its interactions with o<strong>the</strong>r factors.<br />
Research has demonstrated that countries with rapidly growing populations, and <strong>the</strong> youthful age<br />
structures <strong>the</strong>y entail, are more likely to experience outbreaks <strong>of</strong> civil conflict and undemocratic<br />
regimes, in addition to o<strong>the</strong>r development challenges related to poverty, health and natural<br />
resources. These relationships are complex and should not be distilled to simple cause and effect;<br />
however, demography is a key component <strong>of</strong> future-oriented assessments and planning.<br />
Although absolute population size has historically been considered an indicator <strong>of</strong> political<br />
power, current studies typically measure <strong>the</strong> impact <strong>of</strong> demographics through various<br />
categorizations <strong>of</strong> age structure—<strong>the</strong> relative size <strong>of</strong> age groups within a population—as well as<br />
through population growth rates and density. All countries’ populations can be classified into one<br />
<strong>of</strong> four major age structure types based on <strong>the</strong>ir progression through <strong>the</strong> demographic transition:<br />
very young, youthful, transitional, and mature. The transition is <strong>the</strong> decades-long shift from high<br />
mortality and fertility rates, beginning with initial longer life expectancies, and later, smaller<br />
family size. The four-age structure types relate <strong>the</strong> share <strong>of</strong> a population comprised <strong>of</strong> children<br />
and young adults under <strong>the</strong> age <strong>of</strong> 30 to <strong>the</strong> share <strong>of</strong> older adults above age 60 and are termed<br />
very young, youthful, transitional and mature. 1<br />
Generally, countries with a very young age structure are those in which two-thirds or more <strong>of</strong> <strong>the</strong><br />
population is younger than 30; in 2005, <strong>the</strong>re were 64 such countries with a total population <strong>of</strong> more<br />
than one billion, including nearly all <strong>of</strong> sub-Saharan Africa, Afghanistan and Pakistan. In such countries,<br />
<strong>the</strong> youngest age groups comprise successively larger shares <strong>of</strong> <strong>the</strong> population, creating a pyramidshaped<br />
age structure (see Yemen in Figure 2.1.C-1). Once a country’s fertility rate declines below four<br />
children per woman, it is likely to reach <strong>the</strong> second category <strong>of</strong> age structures along <strong>the</strong> demographic<br />
transition, those termed youthful. The 31 countries in this category in 2005, with a combined population<br />
<strong>of</strong> nearly two billion, included India and most <strong>of</strong> North Africa. Countries in <strong>the</strong> middle <strong>of</strong> <strong>the</strong><br />
demographic transition with a “transitional” age structure all have fertility rates lower than three<br />
children per woman, and between 45 and 60 percent <strong>of</strong> <strong>the</strong>ir population is comprised <strong>of</strong> young people<br />
under age 30. These 45 countries, including China, have a combined population <strong>of</strong> 2.4 billion. At <strong>the</strong><br />
end <strong>of</strong> <strong>the</strong> demographic transition, countries with a mature age structure have fertility rates at <strong>the</strong><br />
replacement level <strong>of</strong> 2.1 children per woman or below; less than 45 percent <strong>of</strong> <strong>the</strong>ir population is under<br />
age 30, while up to one-quarter <strong>of</strong> <strong>the</strong> population is comprised <strong>of</strong> older adults above 60. In 2005, <strong>the</strong> 56<br />
countries with this type <strong>of</strong> age structure totaled 1.3 billion people and included nearly all <strong>of</strong> Europe. 2<br />
The United States, with 42 percent <strong>of</strong> its population under age 30, had among <strong>the</strong> more youthful <strong>of</strong> <strong>the</strong><br />
countries with “mature” age structures in 2005, given its relatively high replacement-level fertility rate,<br />
44
which results in an age structure that is fairly balanced among children, youth and working-age adults<br />
(see Figure 2.1.C-1).<br />
Figure 2.1.C-1. Age Structure Types along <strong>the</strong> Demographic Transition 3<br />
Population, Conflict and Governance<br />
In an analysis <strong>of</strong> all new outbreaks <strong>of</strong> civil conflict with at least 25 battle deaths over <strong>the</strong> period<br />
between 1970 and 2007, countries with a very young age structure type (in which at least twothirds<br />
<strong>of</strong> <strong>the</strong> population is younger than 30) were more than three times as likely to have<br />
experienced conflict than those with mature age structures that had completed <strong>the</strong> demographic<br />
transition. 4 Although <strong>the</strong>re is a decline in <strong>the</strong> risk <strong>of</strong> conflict with each successive age structure<br />
type, <strong>the</strong> most pr<strong>of</strong>ound drop in vulnerability lies between <strong>the</strong> first two categories <strong>of</strong> age<br />
structures, as shown in Figure 2.1.C-2. Countries with very young age structures are twice as<br />
likely to have experienced civil conflict as those with youthful age structures, demonstrating that<br />
some degree <strong>of</strong> fertility decline, even if fertility rates remain well above replacement level, may<br />
have broader ramifications.<br />
45
Figure 2.1.C-2. Risk <strong>of</strong> Civil Conflict by Age Structure Type 5<br />
These associations between age structure and conflict are verified and fur<strong>the</strong>r quantified by<br />
empirical analysis. In a study controlling <strong>for</strong> level <strong>of</strong> development, regime type and previous<br />
incidence <strong>of</strong> conflict, countries in which <strong>the</strong> share <strong>of</strong> young people aged 15 to 24 exceeded 35<br />
percent <strong>of</strong> <strong>the</strong> total adult population were 150 percent more likely to experience an outbreak <strong>of</strong><br />
civil conflict between 1950 and 2000 than those with a more balanced age structure. 6 A young<br />
age structure is most strongly correlated with outbreaks <strong>of</strong> conflict in <strong>the</strong> case <strong>of</strong> countries with<br />
ongoing high fertility rates. Once fertility rates begin to decline and <strong>the</strong> demographic transition is<br />
underway, even though a country retains a youthful age structure <strong>for</strong> a few decades due to<br />
previous high fertility, outbreaks <strong>of</strong> conflict are less likely. Many researchers suggest that <strong>the</strong><br />
link between population and conflict lies in competition over resources, especially economic<br />
resources, namely jobs. Unemployment, especially after education, or <strong>the</strong> ability to only eke out<br />
a meager living, enables resentment and hopelessness that can easily be drawn into uprisings or<br />
rebellions. The members <strong>of</strong> a “youth bulge” are not inherently dangerous, but without<br />
employment or <strong>the</strong> prospects <strong>of</strong> stability, <strong>the</strong>y can be vulnerable <strong>for</strong> recruitment into a movement<br />
promising <strong>the</strong>m income and perceived well-being, especially networks that attribute <strong>the</strong>ir<br />
troubles to <strong>the</strong> state or o<strong>the</strong>r groups.<br />
Research is also underway on <strong>the</strong> relationship between age structure and governance. Cincotta<br />
finds that although a very young age structure creates “a social environment where <strong>the</strong> regime’s<br />
legitimacy is strained and <strong>the</strong> political mobilization <strong>of</strong> young men is relatively easy,” this volatile<br />
situation rarely results in sustained new democratic governments. Instead, autocracies and partial<br />
democracies are more likely in countries with a youthful age structure precisely because<br />
countries with such demographic pr<strong>of</strong>iles are also prone to instability and conflict; given <strong>the</strong><br />
option, societies would choose <strong>the</strong> security <strong>of</strong> a heavy-handed ruler over <strong>the</strong> unknown threats <strong>of</strong><br />
civil violence. Moreover, if states with a young age structure do attain liberal democracy, <strong>the</strong>y<br />
are prone to backsliding or o<strong>the</strong>rwise reverting towards authoritarianism. This analysis finds that<br />
once <strong>the</strong> “youth bulge” ratio <strong>of</strong> young adults aged 15 to 29, as a share <strong>of</strong> <strong>the</strong> working-age adult<br />
population, falls below 40 percent, countries are more likely to have regimes characterized by<br />
liberal democracy. After this demographic change, lower dependency ratios allow <strong>for</strong> greater<br />
46
savings and investments in health and education, a more highly trained work<strong>for</strong>ce, and economic<br />
growth, if governments invest in human capital and financial systems. In such situations,<br />
authoritarian leaders can be more willing to loosen political restrictions, or elites may create<br />
pressure <strong>for</strong> a change in government. 7<br />
In a historical analysis similar to that described above <strong>for</strong> civil conflict, <strong>the</strong> likelihood <strong>of</strong> a<br />
government being rated as a full democracy progressively increases as countries pass through <strong>the</strong><br />
demographic transition. Between 1970 and 2007, 14 percent <strong>of</strong> countries with very young age<br />
structures and 80 percent <strong>of</strong> countries with mature age structures were classified as full<br />
democracies, on average, at <strong>the</strong> end <strong>of</strong> each decade, as shown in Figure 2.1.C-3. 8 This pattern<br />
continues with o<strong>the</strong>r measurements <strong>of</strong> governance: countries with very young and youthful age<br />
structures are also more likely to be characterized by weak institutional capacity, government<br />
corruption, poor regulatory quality, and fewer political freedoms and civil liberties. Countries<br />
that have passed through <strong>the</strong> demographic transition and achieved transitional or, in particular,<br />
mature age structures, are rated much more highly in terms <strong>of</strong> <strong>the</strong>se governance measures. 9<br />
Figure 2.1.C-3. Likelihood <strong>of</strong> Democratic Governance by Age Structure Type 10<br />
It is clear that <strong>the</strong>re is no direct causal relationship between population and conflict or population<br />
and democracy—no single demographic threshold that, once crossed, leaves a state doomed to<br />
upheaval or tyranny. Most countries with youthful, growing populations pass through decades<br />
free from outbreaks <strong>of</strong> conflict despite demographic pressures, and <strong>the</strong> ultimate successes and<br />
challenges to development depend on individual context. Researchers have widely reiterated that<br />
<strong>the</strong> presence <strong>of</strong> a youthful age structure is not sufficient to create conflict; nor does a mature age<br />
structure guarantee domestic peace and democracy. Ra<strong>the</strong>r, underlying social conditions that<br />
create grievance and make involvement in an insurgency a viable or even appealing option are<br />
necessary. In fact, because <strong>of</strong> <strong>the</strong> interplay <strong>of</strong> factors such as poverty, inequity, and institutional<br />
capacity, <strong>the</strong> relationship is more holistically framed as one between population and<br />
development.<br />
47
The influence <strong>of</strong> age structure on development is driven by <strong>the</strong> three <strong>for</strong>ces <strong>of</strong> demographic<br />
change (fertility, mortality and migration), each <strong>of</strong> which have <strong>the</strong>ir own distinct and variable<br />
drivers, and <strong>the</strong> ways in which demographic <strong>for</strong>ces exacerbate or mitigate o<strong>the</strong>r structural <strong>for</strong>ces.<br />
Considered alone, demography is unlikely to be <strong>the</strong> tipping point that leads a country into war or<br />
ensures its stability and <strong>the</strong> rule <strong>of</strong> law. However, <strong>the</strong> role <strong>of</strong> demography as an underlying <strong>for</strong>ce<br />
influences a state’s path. Meanwhile, <strong>the</strong> elements that motivate demographic change are fairly<br />
well understood, and its future course can be fairly clearly outlined, yet demography is <strong>of</strong>ten<br />
neglected by policymakers.<br />
Population Projections and Future Trajectories<br />
The most notable characteristic <strong>of</strong> current population trends is <strong>the</strong>ir disparity, which has created<br />
a demographic divide that is unparalleled in history. This divide is most evident between <strong>the</strong><br />
most- and least-developed countries <strong>of</strong> <strong>the</strong> world. Currently, most population trends—whe<strong>the</strong>r<br />
growth or decline—are caused by fertility rates. Mortality rates have declined everywhere,<br />
though <strong>the</strong>y still remain high in some places. Still, because most children who are born today<br />
survive to adulthood, <strong>the</strong> number <strong>of</strong> children born per woman drives <strong>the</strong> pace at which<br />
populations grow. Mortality still plays a role, especially in cases like HIV/AIDS, where disease<br />
reached an epidemic scale. However, even in <strong>the</strong> south African countries that have been hardest<br />
hit by AIDS, birth rates are higher than death rates, and populations are growing. Migration also<br />
plays a role. About 3 percent <strong>of</strong> world’s population lives in countries o<strong>the</strong>r than those in which<br />
<strong>the</strong>y were born. In countries like <strong>the</strong> United States that receive a large share <strong>of</strong> migrants, this has<br />
made labor <strong>for</strong>ces larger than <strong>the</strong>y o<strong>the</strong>rwise would be, and to a certain extent has <strong>of</strong>fset <strong>the</strong><br />
effect <strong>of</strong> population aging.<br />
Because steady fertility declines have occurred in most regions <strong>of</strong> <strong>the</strong> developing world, and<br />
because industrialized countries face <strong>the</strong> emerging challenges <strong>of</strong> sustained low birth rates, it<br />
would be easy to surmise that population aging is inevitable. However, rapid population growth<br />
will remain <strong>the</strong> main demographic focus <strong>for</strong> <strong>the</strong> <strong>for</strong>eseeable future in a wide swath <strong>of</strong> <strong>the</strong><br />
developing world, incorporating most <strong>of</strong> sub-Saharan Africa, as well as countries in southwest<br />
Asia such as Afghanistan, Pakistan and Yemen. For <strong>the</strong> entire sub-Saharan African region,<br />
fertility rates have declined less than 20 percent since 1960 and remain very high at 5.5 children<br />
per woman. 11 Fifty-eight percent <strong>of</strong> <strong>the</strong> world’s people live in countries with fertility rates higher<br />
than replacement level, guaranteeing ongoing population growth <strong>for</strong> <strong>the</strong> long term. Within this<br />
group, almost one billion people, including 91 percent <strong>of</strong> sub-Saharan Africa, live in countries<br />
with fertility rates above four children per woman, a level that would lead <strong>the</strong>ir populations to<br />
double in less than 35 years. Meanwhile, 42 percent <strong>of</strong> <strong>the</strong> world’s population resides in<br />
countries at <strong>the</strong> end <strong>of</strong> <strong>the</strong> demographic transition, with fertility rates at or below replacement<br />
level. According to United Nations population estimates, 17 countries are losing population.<br />
These countries are concentrated in Eastern Europe, but <strong>the</strong>y also include Germany, Japan and<br />
Russia.<br />
However, <strong>the</strong> scale <strong>of</strong> demographic change is also bifurcated across countries experiencing<br />
growth or aging. While <strong>the</strong> region with <strong>the</strong> highest pace <strong>of</strong> population decline, Eastern Europe, is<br />
projected to see its collective population shrink by seven percent between 2005 and 2025, <strong>the</strong><br />
fastest-growing region, Eastern Africa, is projected to have a population increase <strong>of</strong> 63 percent in<br />
<strong>the</strong> same time period. 12 The challenges faced by such regions with youthful age structures and<br />
rapidly growing populations are sometimes recognized by government <strong>of</strong>ficials and <strong>the</strong> broader<br />
policy community. A report outlining guidelines <strong>for</strong> U.S. policy towards Africa has described<br />
48
demographic trends as one <strong>of</strong> three “megachallenges” facing <strong>the</strong> continent because “<strong>the</strong>y can<br />
create a context in which insecurity thrives.” 13<br />
Demography is unique among <strong>the</strong> social sciences because current conditions reliably in<strong>for</strong>m us<br />
<strong>of</strong> much that lies ahead. Most <strong>of</strong> <strong>the</strong> world’s population twenty years hence is alive today. Along<br />
with assessments <strong>of</strong> <strong>the</strong> present situation, projections <strong>of</strong> <strong>the</strong> future <strong>of</strong> demographic trends are a<br />
second major component in policy design, particularly those projections occurring <strong>the</strong> relatively<br />
short term <strong>of</strong> <strong>the</strong> next 20 to 30 years. However, it is too <strong>of</strong>ten that policymakers and o<strong>the</strong>rs<br />
presume that projections are sure predictions when in fact <strong>the</strong>y are based on a series <strong>of</strong> uncertain<br />
assumptions. For this reason, <strong>the</strong> trends set into motion by current indicators and policies, not<br />
demographers’ best projections, are <strong>the</strong> true determining <strong>for</strong>ces <strong>of</strong> future populations.<br />
The most commonly cited and complete set <strong>of</strong> demographic estimates and projections at <strong>the</strong><br />
national level is revised biannually by <strong>the</strong> United Nations Population Division. The projections<br />
are grouped into variants based on assumptions related to fertility, mortality, and migration.<br />
Fertility carries <strong>the</strong> most weight in influencing current demographic trends, and <strong>the</strong> majority <strong>of</strong><br />
<strong>the</strong> UN variants are associated with differing assumptions about fertility. The medium-fertility<br />
variant assumes that all countries’ fertility rates will eventually converge at a universal level <strong>of</strong><br />
1.85 children per woman and begin movement toward that level virtually immediately,<br />
regardless <strong>of</strong> whe<strong>the</strong>r <strong>the</strong>ir current total fertility rate is far above or far below that figure.<br />
These projections can seem optimistic <strong>for</strong> countries at both ends <strong>of</strong> <strong>the</strong> demographic transition<br />
due to <strong>the</strong>ir discrepancy with recent historical trends. Two-thirds <strong>of</strong> <strong>the</strong> countries in sub-Saharan<br />
Africa where survey data are available have had no significant decline in fertility rates in recent<br />
years. 14 Such stalls in fertility decline can wreak havoc with <strong>the</strong> projections, as was recently <strong>the</strong><br />
case with Kenya. Between 1998 and 2003, Kenya’s total fertility rate rose slightly from 4.7 to<br />
4.8 children per woman. Because <strong>the</strong> UN assumed a declining fertility rate during that period, <strong>the</strong><br />
projection <strong>of</strong> Kenya’s total population in 2050 nearly doubled from 44 to 83 million. 15<br />
The assumption that countries will quickly undergo <strong>the</strong> rapid changes in fertility rates that would<br />
be needed to achieve a standard level is at odds with <strong>the</strong> paths many countries’ demographics<br />
have followed dating back decades. Under <strong>the</strong> medium-fertility variant, Uganda’s total fertility<br />
rate would decline to 4.8 children per woman by 2025. This would require that fertility decline<br />
by 28 percent over <strong>the</strong> next 20 years, a pace more than four times faster than that <strong>of</strong> <strong>the</strong> previous<br />
two decades. Although rapid fertility declines in short timeframes have occurred in several<br />
countries and may well do so in <strong>the</strong> future, Uganda is not <strong>for</strong>emost among <strong>the</strong> likely candidates<br />
<strong>for</strong> rapid demographic change.<br />
The UN projections also assume an outright reversal <strong>of</strong> recent demographic trends in countries<br />
experiencing population aging. Between 1960 and 2005, <strong>the</strong> total fertility rate <strong>for</strong> <strong>the</strong> world’s<br />
developed countries as a whole declined by 43 percent to 1.6 children per woman. 16 According<br />
to <strong>the</strong> UN projections, fertility in <strong>the</strong>se countries is expected to rise 14 percent by 2050. China’s<br />
administrative regions <strong>of</strong> Hong Kong and Macao, where fertility currently averages less than one<br />
child per woman, are <strong>the</strong> lowest fertility areas <strong>of</strong> <strong>the</strong> future, with <strong>the</strong>ir fertility projected to rise to<br />
almost 1.4.<br />
The relationships between demographics, conflict and governance described above demonstrate<br />
that analysis <strong>of</strong> population projections and <strong>the</strong>ir assumptions is an important element <strong>of</strong> future<br />
stability planning. For <strong>the</strong> U.S. and many developed countries, <strong>the</strong> geographic focus <strong>for</strong> security<br />
and development ef<strong>for</strong>ts is shrinking. The <strong>National</strong> Intelligence Council notes that <strong>the</strong> number <strong>of</strong><br />
49
countries with youthful populations in <strong>the</strong> conflict-prone “arc <strong>of</strong> instability” is in decline, and<br />
those receiving <strong>the</strong> most attention in <strong>the</strong> near future are likely to be mostly in sub-Saharan<br />
Africa, as well as parts <strong>of</strong> <strong>the</strong> Middle East and sou<strong>the</strong>rn Asia. This geographic focus aligns with<br />
<strong>the</strong> countries facing <strong>the</strong> youngest age structures, which compounds <strong>the</strong>ir vulnerability to<br />
instability now and in <strong>the</strong> future. Population projections assume that <strong>the</strong>se countries will follow<br />
<strong>the</strong> path <strong>of</strong> o<strong>the</strong>rs through <strong>the</strong> demographic transition and that <strong>the</strong>ir age structures will become<br />
more balanced over time. However, such trajectories are far from guaranteed and may in fact be<br />
overly optimistic. Demography is a powerful and dynamic <strong>for</strong>ce, but it is <strong>the</strong> aggregation <strong>of</strong><br />
individual decisions, and it is subject to <strong>the</strong> policy decisions made today.<br />
↑ Back to <strong>the</strong> top<br />
1 Leahy, E., et. al., The Shape <strong>of</strong> Things to Come: Why Age Structure Matters to a Safer, More Equitable<br />
World, Population Action International, Washington, DC, 2007.<br />
2 Data <strong>for</strong> age structure are calculated by <strong>the</strong> author using United Nations Population Division, World<br />
Population Prospects: The 2008 Revision, United Nations Population Division, New York, 2009.<br />
3 Figure created by Population Action International. U.S. figure originally printed in Leahy et. al. 2007.<br />
4 These findings are based on <strong>the</strong> 2007 PAI report The Shape <strong>of</strong> Things to Come, updated to include <strong>the</strong><br />
years 2000-2007. Data <strong>for</strong> conflict are drawn from <strong>the</strong> Uppsala Conflict Data Program/International<br />
Peace Research Institute Armed Conflict Dataset (Version 4, 2008).<br />
5 Figure generated by author using Population Action International age structure data and conflict data<br />
from Uppsala Conflict Data Program/International Peace Research Institute 2008.<br />
6 Urdal, H. "A Clash <strong>of</strong> Generations? Youth Bulges and Political Violence." International Studies<br />
Quarterly 50(3): 607-629, 2006.<br />
7 Cincotta, R. “Half a Chance: Youth Bulges and Transitions to Liberal Democracy.” Environmental<br />
Change and Security Program Report 13:10-18, 2009<br />
8 Center <strong>for</strong> Systemic Peace. Polity IV Project: Political Regime Characteristics and Transitions.<br />
Available at http://www.systemicpeace.org/polity/polity4.htm.<br />
9 Freedom House. Freedom in <strong>the</strong> World. Available at<br />
http://www.freedomhouse.org/template.cfm?page=15; World Bank. Governance Matters: Worldwide<br />
Governance Indicators. Available at http://info.worldbank.org/governance/wgi/index.asp.<br />
10 Figure generated by author using Population Action International age structure data and governance<br />
data from Center <strong>for</strong> Systemic Peace.<br />
11 All data in this paragraph are derived from United Nations Population Division 2009.<br />
12 United Nations Population Division 2009. These projections assume significant changes in fertility in<br />
all countries toward a universal rate below replacement level.<br />
13 Gavin, M. “Africa’s Looming Megachallenges.” In Cooke, J. and J.S. Morrison (eds.). U.S. Africa<br />
Policy Beyond <strong>the</strong> Bush Years, Center <strong>for</strong> Strategic and International Studies, Washington, DC, 2009.<br />
14 Bongaarts, J. “Fertility Transitions in Developing Countries: Progress or Stagnation?” Working Paper<br />
No. 7. Population Council, New York, 2008.<br />
15 United Nations Population Division 2003 and United Nations Population Division 2005.<br />
16 United Nations Population Division 2009.<br />
50
2.2. Economics<br />
2.2.A.<br />
Banking Crises, Collective Protest and Rebellion (David Richards,<br />
Ronald Gelleny)<br />
Authors and Organization: David L. Richards, Department <strong>of</strong> Political Science, University <strong>of</strong><br />
Memphis and Ronald Gelleny, Dept <strong>of</strong> Political Science, University <strong>of</strong> Akron<br />
Contact In<strong>for</strong>mation: drich1@memphis.edu; rgelleny@hotmail.com<br />
Abstract<br />
Both developed and developing countries have experienced turmoil associated with banking<br />
sector failures. However, while literature exists studying <strong>the</strong> economic costs <strong>of</strong> banking<br />
meltdowns, little scholarly attention has been devoted to examining <strong>the</strong> relationship between<br />
banking crises and domestic agitation (internal conflict). The failure to explore <strong>the</strong> impact <strong>of</strong><br />
banking crises on domestic agitation risks excluding a key component in understanding <strong>the</strong><br />
puzzle <strong>of</strong> domestic political stability. Examining a dataset <strong>of</strong> 125 countries <strong>for</strong> <strong>the</strong> years 1981 to<br />
2000, we find banking crises to be systematically associated with greater levels <strong>of</strong> collective<br />
protest activities such as riots, anti-government demonstrations, and strikes.<br />
Introduction<br />
Regardless <strong>of</strong> <strong>the</strong>ir geographic regions, developed and developing countries have experienced<br />
economic and political turmoil associated with banking sector failures. Economists <strong>of</strong>ten<br />
acknowledge <strong>the</strong> existence <strong>of</strong> political pressures associated with <strong>the</strong> containment and solution to<br />
banking failures. However, analyses <strong>of</strong> corrective bank intervention policies routinely discount<br />
or downplay <strong>the</strong> potential political hazards and costs associated with such policies. 1,2,3,4,5 (Mahon<br />
and Corrales [2002] observed that while scholars were closely following [and predicting]<br />
Argentina’s financial crisis, little speculation was devoted to <strong>the</strong> political consequences <strong>of</strong> <strong>the</strong><br />
banking crisis that eventually led to <strong>the</strong> resignation <strong>of</strong> four presidents. 6 ) Thus, while <strong>the</strong>re is a<br />
growing body <strong>of</strong> literature studying <strong>the</strong> economic costs <strong>of</strong> banking meltdowns, little scholarly<br />
attention has been devoted to actually examining <strong>the</strong> relationship between banking crises and<br />
domestic agitation (internal conflict).<br />
The authors believe that <strong>the</strong> failure to explore <strong>the</strong> impact <strong>of</strong> banking crises on domestic agitation<br />
risks excluding a key component in understanding <strong>the</strong> puzzle <strong>of</strong> domestic political stability. The<br />
financial sector plays <strong>the</strong> crucial role <strong>of</strong> dispersing capital to competing domestic interests, and<br />
<strong>the</strong> failure <strong>of</strong> domestic banks has significant repercussions on domestic economic and societal<br />
stability. 7,8,9 Fur<strong>the</strong>rmore, banks are generally considered more fragile and subject to failure than<br />
o<strong>the</strong>r firms. 10,11<br />
Consequently, owing to <strong>the</strong> banking sector’s fragility and economic importance, some studies <strong>of</strong><br />
domestic agitation may be seriously flawed due to <strong>the</strong> problem <strong>of</strong> misspecification. Fur<strong>the</strong>rmore,<br />
since financial investments (and by implication <strong>the</strong> accompanying financial institutional<br />
framework) are critical to <strong>the</strong> globalization process, it is important to understand <strong>the</strong> relationship<br />
between banking crises and domestic agitation. After all, domestic stability—political as well as<br />
economic—is widely considered to be a key element in attracting and maintaining <strong>for</strong>eign<br />
investment. Understanding <strong>the</strong> consequences <strong>of</strong> <strong>the</strong> relationship between <strong>the</strong> two variables can<br />
help us understand <strong>the</strong> tide <strong>of</strong> <strong>the</strong> globalization process.<br />
51
This article attempts to address what we perceive to be a gap in <strong>the</strong> stability literature by<br />
empirically investigating <strong>the</strong> relationship between banking crises and domestic agitation. We<br />
per<strong>for</strong>m our empirical examination on a cross-sectional time-series data set comprising 125<br />
economically developed and developing countries <strong>of</strong> <strong>the</strong> world <strong>for</strong> <strong>the</strong> years 1981 through 2000.<br />
Ra<strong>the</strong>r than focusing on a single indicator <strong>of</strong> domestic agitation, we conduct a dimensional<br />
analysis <strong>of</strong> <strong>the</strong> concept and ultimately employ two separate indicators: collective protest and<br />
rebellion/internal war. This allows us to paint a broad picture <strong>of</strong> how banking crises affect<br />
domestic political stability. We find a country’s level <strong>of</strong> banking crisis to be strongly associated<br />
with its level <strong>of</strong> collective protest activities, but not at all associated with its level <strong>of</strong><br />
rebellion/internal war activities.<br />
Banking Crises and <strong>the</strong> Economy<br />
A banking crisis is a situation where a country’s banking system has exhausted most <strong>of</strong> its<br />
banking capital and has become pr<strong>of</strong>oundly “unsound.” 12 By and large, <strong>the</strong> soundness <strong>of</strong> a<br />
banking system is measured by its “ability to withstand adverse events.” 13 More fully:<br />
A sound banking system may be defined as one in which most banks (those accounting <strong>for</strong><br />
most <strong>of</strong> <strong>the</strong> system’s assets and liabilities) are solvent and are likely to remain so.<br />
Solvency is reflected in <strong>the</strong> positive net worth <strong>of</strong> a bank, as measured by <strong>the</strong> difference<br />
between <strong>the</strong> assets and liabilities (excluding capital and reserves) in its balance sheet. In<br />
o<strong>the</strong>r words, <strong>the</strong> distance between soundness and insolvency can be gauged in terms <strong>of</strong><br />
capitalization, since net worth is equivalent to capital plus reserves. 14<br />
Undercapitalized banks are thought more likely to be prone to political, economic or even<br />
nature-induced shocks and thus are more likely to collapse.<br />
Banks play a unique role in an economy. The financial sector can be described as <strong>the</strong> “brain <strong>of</strong><br />
<strong>the</strong> economy.” 15 . It is <strong>the</strong> banking sector that directs scarce capital to competing domestic<br />
interests. Without a sound banking sector, macroeconomic stability can be difficult to achieve<br />
and, <strong>the</strong>reby, <strong>the</strong> country is more prone to economic crisis. 16,17,18 ). (Clearly, <strong>the</strong> reverse is also<br />
true. That is, <strong>the</strong> banking system is much more likely to be stable if <strong>the</strong> macroeconomic<br />
condition <strong>of</strong> a country is sound [i.e., steady economic growth and low inflation rates].) 19 This is<br />
particularly true <strong>for</strong> less developed countries (LDCs), where banks <strong>of</strong>ten provide <strong>the</strong> vast<br />
majority <strong>of</strong> finance through <strong>the</strong> allocation <strong>of</strong> <strong>the</strong> nation’s savings to creditworthy individuals and<br />
corporations. For most LDCs, alternative financial instruments (stocks and equities) are limited,<br />
and <strong>the</strong>re<strong>for</strong>e indigenous economic actors must rely on domestic banks. Without available<br />
financial resources, domestic enterprises cannot access <strong>the</strong> capital required to maintain, let alone<br />
expand, levels <strong>of</strong> production. Declining levels <strong>of</strong> income and continued economic hardship are<br />
associated with falling production levels. 20,21 Solvent banks with a steady source <strong>of</strong> financial<br />
capital are essential <strong>for</strong> <strong>the</strong> process <strong>of</strong> late industrialization. 22,23<br />
Regardless <strong>of</strong> international economic standing, all countries that are exposed to a banking crisis<br />
experience negative economic costs. At a minimum, citizens experience some loss <strong>of</strong> wealth and<br />
a disruption to <strong>the</strong> supply <strong>of</strong> credit <strong>for</strong> investment projects. 24 None<strong>the</strong>less, <strong>the</strong> depth <strong>of</strong> any<br />
particular crisis is dependent upon several factors, namely <strong>the</strong> size <strong>of</strong> <strong>the</strong> banking sector relative<br />
to <strong>the</strong> total wealth <strong>of</strong> <strong>the</strong> economy and <strong>the</strong> number <strong>of</strong> sound banks in <strong>the</strong> system. 25,26 For<br />
example, although <strong>the</strong> Savings and Loan crisis <strong>of</strong> <strong>the</strong> late 1980s eventually cost <strong>the</strong> United States<br />
economy well over $100 billion. The huge US economy, combined with <strong>the</strong> existence <strong>of</strong> a large<br />
number <strong>of</strong> healthy banks, was able to absorb <strong>the</strong> loss without experiencing a significant<br />
52
economic downturn. However, LDCs have been especially vulnerable to banking crises due to<br />
<strong>the</strong> weakness <strong>of</strong> <strong>the</strong>ir domestic economies and <strong>the</strong> frailness <strong>of</strong> many financial institutions. For<br />
instance, <strong>the</strong> expense <strong>of</strong> bailing out <strong>the</strong> banking sector following <strong>the</strong> Mexican crisis <strong>of</strong> 1994–<br />
1995 has been estimated at 14.4 percent <strong>of</strong> Mexico’s GDP <strong>for</strong> 1997, to be amortized over 30<br />
years during <strong>the</strong> lifetime <strong>of</strong> <strong>the</strong> programmes. Moreover, in 1995, <strong>the</strong> Mexican economy slowed<br />
by 6.2 percent and inflation climbed to over 52 percent. 27 (It is also important to remember that<br />
Mexico was given an approximately US$40 billion lifeline from <strong>the</strong> US government. Most less<br />
developed countries [LDCs] cannot count on such support to wea<strong>the</strong>r economic turbulence.)<br />
Similarly, between 1988 and 1996, 20 African countries experienced banking crises, <strong>of</strong> which<br />
five had to spend more than 10 percent <strong>of</strong> <strong>the</strong>ir GDP to repair <strong>the</strong> damage. 28 Thus, banking crises<br />
impose economic strains on all countries, but <strong>the</strong>y are particularly expensive to those nations<br />
already in a fragile economic condition.<br />
Although it is widely accepted that banking crises impose significant costs on affected countries,<br />
it is not as easy to identify how or when banking crises occur. 29,30,31 There are, however, several<br />
key dangers that appear to be prevalent in many banking crises. For one, many banks have<br />
established connected lending patterns. That is, bank managers <strong>of</strong>ten <strong>for</strong>m relationships with<br />
companies and/or government <strong>of</strong>ficials that <strong>the</strong>y lend to at very reasonable interest rates. After<br />
some time, it becomes extremely difficult to deviate from this established pattern, regardless <strong>of</strong><br />
<strong>the</strong> risk <strong>of</strong> <strong>the</strong> venture, thus inviting more bad loans to follow. 32,33 On August 11, 2001, Antonio<br />
Siba-Siba Macuacua, an economist hired to investigate <strong>the</strong> bank failure <strong>of</strong> Mozambique’s Banco<br />
Austral, was found murdered at <strong>the</strong> bank’s headquarters. Siba-Siba had begun a process <strong>of</strong><br />
reducing <strong>the</strong> size <strong>of</strong> <strong>the</strong> work<strong>for</strong>ce and had moved to recover loans that had been made<br />
predominately to members <strong>of</strong> <strong>the</strong> governing elite. 34 For example, South Korea is an example <strong>of</strong><br />
<strong>the</strong> ill effects <strong>of</strong> “connected” borrowing. South Korean government <strong>of</strong>ficials applied considerable<br />
pressure on banks to support domestic projects and to funnel loans to large industrial<br />
conglomerates. In particular, bank loans were directed to <strong>the</strong> giant steel firm Hanbo, although <strong>the</strong><br />
firm was failing to generate any pr<strong>of</strong>its by <strong>the</strong> mid-1990s. The result was that South Korean bank<br />
portfolios were dominated by non-per<strong>for</strong>ming loans. Hanbo alone is reported to have cost South<br />
Korean banks around US $7 billion. 35<br />
Additionally, many governments see <strong>the</strong> banking sector as ano<strong>the</strong>r tool <strong>for</strong> it to carry out illfounded<br />
industrial policy. In <strong>the</strong> 1980s <strong>the</strong> Zambian government set up a number <strong>of</strong> state-owned<br />
banks <strong>for</strong> <strong>the</strong> purpose <strong>of</strong> funding public sector companies. By <strong>the</strong> 1990s most were insolvent,<br />
with billions <strong>of</strong> dollars having been wasted. 36 Lastly, poor and/or fraudulent bank management<br />
can lead to bank failures. 37 The Bank <strong>of</strong> New England, <strong>for</strong> example, found itself buried in nonper<strong>for</strong>ming<br />
loans by <strong>the</strong> end <strong>of</strong> <strong>the</strong> 1980s due to overexposure <strong>of</strong> loans in <strong>the</strong> real estate market<br />
(that is, a lack <strong>of</strong> loan diversity). A study by <strong>the</strong> US Office <strong>of</strong> Comptroller <strong>of</strong> <strong>the</strong> Currency<br />
reviewed about 160 cases <strong>of</strong> national bank failures since 1979 and found that in most cases banks<br />
failed to have an adequate loan policy, or if a policy was in place, <strong>the</strong>y failed to follow it. 38 (It is<br />
interesting to note that Claude Trichet, governor <strong>of</strong> France’s Central Bank, was investigated <strong>for</strong><br />
complicity in falsifying <strong>the</strong> 1992 accounts <strong>of</strong> <strong>the</strong> loss-making Credit Lyonnais. The eventual cost<br />
<strong>of</strong> bailing out Credit Lyonnais to <strong>the</strong> French taxpayers was approximately US $17 billion.)<br />
53
Banking Crises and Domestic Agitation<br />
What is <strong>the</strong> relationship between banking crises and domestic sociopolitical conditions? The<br />
most immediate impact <strong>of</strong> financial unsoundness is that banks become vulnerable to deposit<br />
runs. When citizens are threatened with <strong>the</strong> loss <strong>of</strong> <strong>the</strong>ir savings, <strong>the</strong>y will scramble to recover<br />
<strong>the</strong>ir money be<strong>for</strong>e <strong>the</strong> banks can close <strong>the</strong>ir doors. That is, citizens demand full and immediate<br />
access to <strong>the</strong>ir financial funds during a financial crisis. The failure <strong>of</strong> citizens to recoup <strong>the</strong>ir<br />
savings can incite violent dissatisfaction with <strong>the</strong> government. As noted by <strong>for</strong>mer Uruguayan<br />
president Julio Maria Sanguinette, “The banking system will never take you to paradise, but it<br />
can bury you in hell in an afternoon.” 39<br />
Moreover, <strong>the</strong> attempt to revitalize <strong>the</strong> banking sector is an extremely costly endeavor. Funds<br />
that could have been used <strong>for</strong> social programmes or job creation projects are instead funneled<br />
into repairing <strong>the</strong> banking sector and implementing policies designed to recover domestic and<br />
<strong>for</strong>eign investor confidence. The result is budget cutbacks that <strong>of</strong>ten eliminate subsidies and<br />
programmes <strong>for</strong> <strong>the</strong> middle and lower classes, <strong>the</strong>reby decreasing domestic political support <strong>for</strong><br />
<strong>the</strong> government. 40 Fur<strong>the</strong>rmore, well-connected bankers <strong>of</strong>ten use <strong>the</strong>ir political influence to<br />
exempt <strong>the</strong>mselves from intervention policies enacted to stabilize <strong>the</strong> banking crisis.<br />
Consequently, political leaders are hesitant to impose interventionist policies in a swift and<br />
decisive manner. 41,42 (If governments fail to impose interventionist policies that gain <strong>the</strong><br />
confidence <strong>of</strong> bank depositors, <strong>the</strong> demise <strong>of</strong> a bank can quickly spill over to o<strong>the</strong>r banks,<br />
<strong>the</strong>reby worsening <strong>the</strong> financial sector. 43 )<br />
In <strong>the</strong> late 1990s and early 2000s, many countries had <strong>the</strong> mis<strong>for</strong>tune <strong>of</strong> experiencing banking<br />
crises. In many <strong>of</strong> <strong>the</strong>se cases, governments were faced with an angry citizenry demanding full<br />
access to <strong>the</strong>ir deposits. For instance, in December 2001, Argentina experienced economic and<br />
political turmoil because <strong>of</strong> a significant bank failure. In an attempt to end a depositor run on <strong>the</strong><br />
banks, <strong>the</strong> government imposed a temporary suspension on access to bank accounts. Specifically,<br />
<strong>the</strong> government limited cash withdrawals to $250 per week <strong>for</strong> a period <strong>of</strong> 90 days, and overseas<br />
cash transfers were limited to $1000. The only exception to <strong>the</strong>se caps was <strong>the</strong> allowance <strong>of</strong> <strong>the</strong><br />
continued use <strong>of</strong> credit and debit cards. 44,45,46 The policy had <strong>the</strong> effect <strong>of</strong> enraging millions <strong>of</strong><br />
middle-class and poor Argentines who lacked access to banking credit. Consequently, President<br />
Adolfo Rodriquez Saa’s government was <strong>for</strong>ced to resign after facing a large general strike<br />
organized by trade unions and countrywide violent street protests responding to <strong>the</strong><br />
government’s bank intervention policies.<br />
Argentina was not <strong>the</strong> only South American country to experience political unrest owing to<br />
banking failures. In 1999, <strong>the</strong> Ecuadorian government was <strong>for</strong>ced to close eight banks due to<br />
insolvency. (In this case, non-per<strong>for</strong>ming loans were caused by <strong>the</strong> widespread “El Nino” floods<br />
<strong>of</strong> <strong>the</strong> previous year. 47 ) In order to limit a run on <strong>the</strong> banks, <strong>the</strong> government ordered <strong>the</strong> freezing<br />
<strong>of</strong> all bank deposits. In response, trade unions, indigenous organizations, and grassroots activists<br />
staged a general strike that crippled <strong>the</strong> country. To stop <strong>the</strong> ensuing social unrest, <strong>the</strong> president<br />
<strong>of</strong> <strong>the</strong> country imposed a state <strong>of</strong> emergency. In 2000, Nicaragua also experienced a banking<br />
crisis in which authorities limited access to deposits. Once again, this policy was met with angry<br />
and loud street protests. In <strong>the</strong> end, public pressure <strong>for</strong>ced <strong>the</strong> government to guarantee all<br />
depositors full recovery <strong>of</strong> <strong>the</strong>ir savings.<br />
Restructuring <strong>the</strong> banking sector <strong>of</strong>ten includes <strong>the</strong> loss <strong>of</strong> jobs as banks are streamlined to<br />
decrease financial losses. At <strong>the</strong> extreme, many banks may be closed, resulting in a permanent<br />
54
loss <strong>of</strong> jobs in <strong>the</strong> financial sector. For example, <strong>the</strong> French government’s restructuring <strong>of</strong> Credit<br />
Lyonnais included <strong>the</strong> closure <strong>of</strong> 73 branches at <strong>the</strong> cost <strong>of</strong> numerous jobs. Well over 2,000<br />
employees protested in <strong>the</strong> streets <strong>of</strong> Paris over <strong>the</strong> job cuts. 48<br />
Long-term externalities may also accompany banking crises. For one, firms that require<br />
financing are negatively affected by <strong>the</strong> ensuing credit crunch that inevitably ensues. Simply,<br />
firms are <strong>of</strong>ten unable to obtain <strong>the</strong> necessary financial support to stay in business. The<br />
Nicaraguan government’s decision to close <strong>the</strong> Bancafe bank in 2000 threatened <strong>the</strong> livelihood<br />
<strong>of</strong> farmers since it was one <strong>of</strong> <strong>the</strong> few banks that lent money to farmers and ranchers. Not<br />
surprisingly, hundreds <strong>of</strong> farmers protested in front <strong>of</strong> <strong>the</strong> bank’s <strong>of</strong>fices throughout <strong>the</strong> country.<br />
The financial meltdown in Sou<strong>the</strong>ast Asia in <strong>the</strong> late 1990s also provides an example <strong>of</strong> <strong>the</strong><br />
adverse effects <strong>of</strong> a credit crunch. Because South Korean banks lacked <strong>the</strong> capacity to lend, <strong>the</strong><br />
small- and medium-sized firms increasingly faced a credit shortage, thus adding to <strong>the</strong> economic<br />
woes <strong>of</strong> <strong>the</strong> country. The result was increased domestic agitation as unions and citizens<br />
increasingly protested <strong>the</strong> economic situation. As a consequence, a union rally protesting <strong>the</strong><br />
economic crisis in May 1998 resulted in a violent riot.<br />
A lack <strong>of</strong> government willingness to enact a reputable banking intervention policy can also<br />
contribute to domestic political and economic turmoil. For example, if influential banks are<br />
exempted from closure policies, <strong>the</strong> public trust in <strong>the</strong> overall intervention strategy may crumble.<br />
This is exactly what occurred in Indonesia in 1997, when <strong>the</strong> government allowed wellconnected<br />
owners <strong>of</strong> banks to resume operations and <strong>the</strong> cost <strong>of</strong> solving <strong>the</strong> banking crisis<br />
continued to climb. (The failure to close insolvent banks <strong>of</strong>ten encourages banker managers to<br />
accept high-risk loans in hopes <strong>of</strong> high returns. Inevitably <strong>the</strong> bank continues to accrue<br />
significant losses, <strong>the</strong>reby increasing <strong>the</strong> costs <strong>of</strong> future financial bailouts.) As a result,<br />
disillusioned Indonesians lost confidence in <strong>the</strong> intervention plan and continued to withdraw<br />
funds from banks 49 Moreover, <strong>the</strong> political and economic conditions in Indonesia worsened as<br />
government corruption in <strong>the</strong> banking sector was exposed. Unable to establish political and<br />
economic stability, <strong>the</strong> government <strong>of</strong> President Suharto experienced severe domestic strain. 50 In<br />
an ef<strong>for</strong>t to end <strong>the</strong> run on banks and restore confidence in <strong>the</strong> economy, President Suharto<br />
decided to guarantee all bank deposits and liabilities. Although bank runs began to subside, anger<br />
at his government continued to grow.<br />
In an ef<strong>for</strong>t to fur<strong>the</strong>r shore up <strong>the</strong> financial sector and stabilize its balance <strong>of</strong> payment crisis,<br />
Indonesia turned to <strong>the</strong> International Monetary Fund (IMF) <strong>for</strong> financial help. In turn, <strong>the</strong> IMF<br />
demanded that <strong>the</strong> Suharto government reign in domestic spending. The chief opponents to<br />
Suharto tended to be labour unions, political rivals <strong>of</strong> <strong>the</strong> government, and students disenchanted<br />
with <strong>the</strong> corruption <strong>of</strong> <strong>the</strong> Suharto family and its political allies. In addition to protests and riots,<br />
Indonesian citizens targeted <strong>the</strong> ethnic Chinese community <strong>for</strong> revenge. The eventual outcome<br />
was <strong>the</strong> overthrow <strong>of</strong> <strong>the</strong> Suharto regime. (Similar events occurred in Malaysia and Thailand.<br />
The two respective governments failed to effectively monitor domestic banking crises, and<br />
economic growth stalled. In an ef<strong>for</strong>t to create domestic jobs [and perhaps to deflect attention<br />
from <strong>the</strong>ir inadequate handling <strong>of</strong> <strong>the</strong> banking crisis], both governments deported <strong>for</strong>eign<br />
workers. The end result was a series <strong>of</strong> massive protests and riots.)<br />
Additionally, banking crises can <strong>of</strong>ten be associated with severe economic downturns. 51,52 This<br />
can happen when a banking crisis is accompanied with a currency crisis, thus causing a<br />
significant outflow <strong>of</strong> investment capital. (Even if governments guarantee deposits, this places an<br />
additional strain on government resources, particularly <strong>for</strong> LDCs, since <strong>the</strong> government is<br />
55
esponsible <strong>for</strong> all refunds. Fur<strong>the</strong>rmore, this policy invokes <strong>the</strong> issue <strong>of</strong> moral hazard. That is, if<br />
bankers know that depositors will not punish <strong>the</strong>m, <strong>the</strong>y have a greater incentive to act<br />
irresponsibly.) As a result, inflation is likely to increase rapidly, thus <strong>for</strong>cing <strong>the</strong> government to<br />
raise interest rates. Moreover, since <strong>the</strong>re is no longer an ample source <strong>of</strong> credit available to<br />
domestic enterprises (or available only at high interest rates), economic growth can slow<br />
dramatically. Consequently, LDCs are <strong>of</strong>ten <strong>for</strong>ced to appeal to <strong>the</strong> IMF <strong>for</strong> loans that require<br />
weighty decreases in public spending and o<strong>the</strong>r economic liberalization measures. (The<br />
elimination <strong>of</strong> public projects as a condition <strong>of</strong> IMF loans was met negatively by Mahathir<br />
Mohamad, <strong>the</strong> prime minister <strong>of</strong> Malaysia, since <strong>the</strong>se projects were to supply a substantial<br />
number <strong>of</strong> jobs <strong>for</strong> <strong>the</strong> country.) All <strong>of</strong> <strong>the</strong>se factors contribute to a substantial increase in<br />
unemployment rates. The overall costs <strong>of</strong> <strong>the</strong> crisis and <strong>the</strong> resulting adjustment programmes fall<br />
disproportionately on middle-to-low income households, causing decreased support <strong>for</strong> <strong>the</strong><br />
prevailing government. In <strong>the</strong> mid-1990s, <strong>for</strong> instance, Venezuela’s government assumed control<br />
<strong>of</strong> over 43 financial institutions, and by <strong>the</strong> end <strong>of</strong> <strong>the</strong> crisis, <strong>the</strong> government owned over 70<br />
percent <strong>of</strong> <strong>the</strong> banking system. 53 To help stabilize <strong>the</strong> financial system and correct a balance <strong>of</strong><br />
payments problem, <strong>the</strong> Venezuelan government turned to <strong>the</strong> IMF. The ensuing austerity<br />
programme was protested by thousands <strong>of</strong> public employees opposing <strong>the</strong> suspension <strong>of</strong> pay<br />
wages. O<strong>the</strong>rs protested <strong>the</strong> decision to eliminate subsidies to <strong>the</strong> poor. The result <strong>of</strong> <strong>the</strong> banking<br />
crisis was <strong>the</strong> decision by <strong>the</strong> government to temporarily suspend six constitutional guarantees.<br />
The above discussion provides us with a testable hypo<strong>the</strong>sis regarding <strong>the</strong> relationship between<br />
banking crises and domestic agitation: countries experiencing a banking crisis will encounter a<br />
contemporaneous increase in domestic agitation. A corollary <strong>of</strong> this hypo<strong>the</strong>sis is that <strong>the</strong>se<br />
effects may carry over into <strong>the</strong> future. Below we describe our research design and findings.<br />
Data, Models and Estimation<br />
Data and Models. For our empirical analyses, we employ a pooled cross-sectional time series<br />
data set comprised <strong>of</strong> 125 economically developed and developing countries <strong>for</strong> <strong>the</strong> years 1981<br />
to 2000. This period is lower bound by <strong>the</strong> availability <strong>of</strong> our banking crisis data and upper<br />
bound by <strong>the</strong> availability <strong>of</strong> both our domestic agitation data and banking crisis data. The<br />
country-years included are those that were common to all source-datasets used in <strong>the</strong> analyses.<br />
Our data are representative <strong>of</strong> all geopolitical regions <strong>of</strong> <strong>the</strong> world, as well as all regime types.<br />
To examine <strong>the</strong> relationship between banking crises and domestic agitation, we examine both <strong>the</strong><br />
contemporaneous and lagged relationship between a country’s level <strong>of</strong> banking crisis and its<br />
level <strong>of</strong> two types <strong>of</strong> domestic agitation. The variables included in our models are discussed<br />
below, and each variable’s expected relationship with domestic agitation is stated.<br />
Domestic Agitation. This study differs from some o<strong>the</strong>r large cross-national empirical studies <strong>of</strong><br />
contentious politics in that <strong>the</strong> chief concept <strong>of</strong> interest is not government-based action such as<br />
negative sanctions, 54,55,56,57,58,59 or human rights violations, 60,61,62,63 but ra<strong>the</strong>r, <strong>the</strong> chief concept<br />
is collective action taken by citizens against government. We are interested in what causes<br />
domestic agitation by citizens ra<strong>the</strong>r than what causes government repression <strong>of</strong> citizens.<br />
In our previous discussions, we have used <strong>the</strong> term “domestic agitation” to represent a varied<br />
group <strong>of</strong> collective activities which citizens may employ to agitate against a government. To test<br />
our central hypo<strong>the</strong>sis that banking crises may instigate domestic agitation, however, we must be<br />
able to distinguish between various types <strong>of</strong> such agitation. Gurr (1970), Hibbs (1973) and<br />
Lichbach and Gurr (1981) imply that <strong>the</strong> important sources <strong>of</strong> variation between agitation<br />
56
activities are (1) <strong>the</strong> extent <strong>of</strong> organization, (2) <strong>the</strong> scope <strong>of</strong> citizen participation, and (3) <strong>the</strong><br />
violent0non-violent nature <strong>of</strong> activities. 64,65,66 Gurr (1970) distinguishes between turmoil (mass,<br />
spontaneous unorganized violence) and revolution (consisting <strong>of</strong> conspiracy and internal war,<br />
both <strong>of</strong> which are organized violence, but differ in scope <strong>of</strong> citizen participation). 67 Hibbs (1973)<br />
differentiates between what he calls collective protest (riots, anti-government demonstrations and<br />
politicized strikes) and internal war (armed attacks, assassinations). 68 Similarly, Lichbach and<br />
Gurr (1981: 5) distinguish protest activities which are “short-lived challenges by members <strong>of</strong><br />
associational groups” (demonstrations, strikes, riots) from protracted rebellion activities, which<br />
involve combat between rebels and governments. 69 (O<strong>the</strong>rs, such as Muller and Seligson [1987]<br />
take a unidimensional view. Concerned with <strong>the</strong> relationship between inequality and insurgency<br />
[political violence], <strong>the</strong>y operationalize this type <strong>of</strong> agitation as “<strong>the</strong> death rate from domestic<br />
conflict per one million population.” 70 ) Essentially, <strong>the</strong>se studies posit dimensions <strong>of</strong> domestic<br />
agitation.<br />
Our domestic agitation data come from Arthur S. Banks’s Cross-<strong>National</strong> Time-Series Domestic<br />
Conflict Data. 71 Banks provides annual event-count indicators <strong>of</strong> six types <strong>of</strong> agitation:<br />
assassinations, general strikes, guerrilla activities, riots, revolutions, and antigovernment<br />
demonstrations. Based on Hibbs (1973) 72 and on Lichbach and Gurr (1981), 73 we would expect<br />
to see two dimensions in our domestic agitation data. First, we would expect to see a “collective<br />
protest” dimension associated with activities such as riots, anti-government demonstrations, and<br />
strikes. Second, we would expect to see a “rebellion/internal war” dimension associated with<br />
activities such as guerrilla activities, assassinations, terrorism and revolution. According to Gurr<br />
(1970), we would expect to see three dimensions: (1) a “turmoil” dimension associated with<br />
mass spontaneous unorganized violence such as riots or large-scale demonstrations, (2) a<br />
“conspiracy” dimension associated with organized violence <strong>of</strong> limited participatory scope, such<br />
as assassinations and o<strong>the</strong>r very selective <strong>for</strong>ms <strong>of</strong> terrorism, and (3) an “internal war” dimension<br />
characterized by organized mass violence such as all-out guerrilla warfare and revolution. 74<br />
Table 2.2.A-1 shows <strong>the</strong> results <strong>of</strong> a varimax principal component analysis used to determine<br />
how our data con<strong>for</strong>ms to any <strong>of</strong> <strong>the</strong> a<strong>for</strong>ementioned dimensional expectations. We find that <strong>the</strong><br />
two-dimensional schemes <strong>of</strong> Hibbs (1973) 75 and Lichbach and Gurr (1981) 76 are clearly<br />
supported, while Gurr’s (1970) three-dimensional scheme is not. 77 The analysis returned two<br />
identifiable factors, each <strong>of</strong> which clearly included three <strong>of</strong> our six indicators. Factor 1 includes<br />
riots, anti-government demonstrations and general strikes. This would be <strong>the</strong> “collective protest”<br />
dimension. Factor 2 includes guerrilla activity, revolutions and assassinations. This would be <strong>the</strong><br />
“rebellion/internal war” dimension.<br />
Table 2.2.A-1. Varimax Principal Component Analysis <strong>of</strong> Six Types <strong>of</strong> Domestic Agitation<br />
Type <strong>of</strong> Agitation Factor 1<br />
Factor 2<br />
collective protest rebellion/internal war<br />
Assassinations .14 .58<br />
General strikes .61 .07<br />
Guerrilla warfare .10 .84<br />
Riots .86 .05<br />
Revolutions .03 .79<br />
Anti-government demonstrations .86 .05<br />
57
Thus, <strong>the</strong> analyses in this article will examine <strong>the</strong> relationship between banking crises and two<br />
types <strong>of</strong> domestic agitation, “collective protest” and “rebellion/internal war.” The two indicators<br />
<strong>of</strong> domestic agitation used as dependent variables in this study were created by using principal<br />
components analysis to create factor scores from <strong>the</strong> raw event-count data. (Principal<br />
components analysis produces a variable that lends itself to regression analysis. By trans<strong>for</strong>ming<br />
a “given set <strong>of</strong> observed variables into ano<strong>the</strong>r set <strong>of</strong> variables,” principal components analysis<br />
helps achieve “economy <strong>of</strong> representation” with <strong>the</strong> objective <strong>of</strong> accounting <strong>for</strong> as much variance<br />
in <strong>the</strong> data as possible. For a discussion on how this economy is achieved, see Kim and Mueller<br />
(1978). 78 Two scores were generated <strong>for</strong> each country-year, one representing <strong>the</strong> level <strong>of</strong><br />
collective protest activities, and one indicating <strong>the</strong> level <strong>of</strong> rebellion/internal war activities. For<br />
use in our analyses, we log <strong>the</strong> factor scores <strong>for</strong> both domestic agitation indicators.<br />
Bank Crises<br />
The IMF and <strong>the</strong> World Bank have developed an ordinal indicator measuring <strong>the</strong> level <strong>of</strong><br />
banking system crises in IMF member-states, 1980–2000. 79,80 This measure uses solvency as a<br />
proxy <strong>for</strong> <strong>the</strong> degree to which a banking system is sound (or lacking crisis). The indicator is<br />
coded as indicated in Table 2.2.A-2 below:<br />
Table 2.2.A-2. Ordinal Indicators <strong>for</strong> Banking System Crises in IMF Member-states.<br />
Score<br />
Indication<br />
(0) No crisis<br />
(1) Significant0non-systemic problem<br />
(2) Crisis/systemic<br />
Lindgren et al. (1996: 20) 81 explain that, following <strong>the</strong> lead <strong>of</strong> Sundararajan and Balino (1991), 82<br />
cases “where <strong>the</strong>re were runs or o<strong>the</strong>r substantial portfolio shifts, collapses <strong>of</strong> financial firms, or<br />
massive government interventions [are referred to as] crises. Extensive unsoundness short <strong>of</strong> a<br />
crisis is termed significant.” While <strong>the</strong>re is some deal <strong>of</strong> subjectivity in this measure, it is <strong>the</strong><br />
only one that we have found to exist, and to its credit, <strong>the</strong> country-specific case evidence<br />
provided along with <strong>the</strong>se rankings is considerable.<br />
The costs <strong>of</strong> banking crises vary considerably and are not restricted to any particular geographic<br />
region. For example, in 1997 Nigeria experienced financial distress that accounted <strong>for</strong> about 4<br />
percent <strong>of</strong> banking systems assets. 83 However, between 1980 and 1982, Argentina experienced a<br />
catastrophic systemic crisis in <strong>the</strong> financial sector. In fact, around 170 financial institutions<br />
experienced central bank intervention and/or were dissolved. In total, <strong>the</strong> financial cost to<br />
Argentina amounted to about 55 percent <strong>of</strong> its gross domestic product. 84,85 Countries that<br />
experience crisis/systemic financial problems are experiencing capital exhaustion. Countries that<br />
are facing significant0non-systemic problems continue to retain a majority <strong>of</strong> banks that are<br />
solvent.<br />
We use this ordinal measure as our indicator <strong>of</strong> a country’s level <strong>of</strong> banking crisis. The data are<br />
taken from <strong>the</strong> International Monetary Fund’s Bank Soundness 86 and <strong>the</strong> World Bank’s Episodes<br />
<strong>of</strong> Systemic and Borderline Financial Crises. 87<br />
Control Variables. We include indicators in our analyses that account <strong>for</strong> some <strong>of</strong> <strong>the</strong><br />
competing hypo<strong>the</strong>ses regarding <strong>the</strong> causes <strong>of</strong> domestic agitation.<br />
58
Democracy<br />
The first alternative hypo<strong>the</strong>sis is that regime type may affect citizen propensity towards agitated<br />
behaviour. We would expect a different relationship between <strong>the</strong> extent to which a regime is<br />
democratized and both <strong>of</strong> our indicators <strong>of</strong> domestic agitation. Most empirical studies that<br />
examine <strong>the</strong> relationship between democracy and political agitation or repression assume a linear<br />
association. Yet many scholars argue that a curvilinear relationship exists between <strong>the</strong> two<br />
variables. Tilly (1978) asserts that we would expect democracies to be more able and willing to<br />
be facilitative to powerful contenders engaging in larger-scale activities, possibly short-circuiting<br />
revolution (and a necessarily linear relationship between democracy and rebellion/internal war<br />
actions). 88 Also, newly established democracies face a myriad <strong>of</strong> obstacles to overcome. These<br />
include <strong>the</strong> <strong>for</strong>mation <strong>of</strong> new political institutions, <strong>the</strong> elimination <strong>of</strong> state restrictions on<br />
individual behaviour and social inhibitions, and <strong>the</strong> perplexity regarding standards <strong>of</strong> morals. 89<br />
The initiation <strong>of</strong> free elections also requires politicians to compete <strong>for</strong> votes. Huntington (1997)<br />
argues that it is relatively easy <strong>for</strong> inexperienced politicians to solicit public support by appealing<br />
to ethnic, religious and moral differences, <strong>the</strong>reby exacerbating social, ethnic and religious<br />
conflict. 90 (The <strong>for</strong>mer Soviet Union and Yugoslavian Republic provide examples <strong>of</strong> this<br />
problem.)<br />
Fur<strong>the</strong>rmore, newly <strong>for</strong>med democracies are responsible <strong>for</strong> solving <strong>the</strong> problems inherited from<br />
<strong>the</strong>ir predecessors. These <strong>of</strong>ten include economic stagnation, corruption, an inept bureaucracy<br />
and public mistrust. 91,92,93,94 If <strong>the</strong> new democratic government fails to successfully address <strong>the</strong>se<br />
problems, public anxiety and unrest are likely to erupt. Only when democracy is fully<br />
consolidated (that is, it becomes <strong>the</strong> “only game in town”) does it play a wholly stabilizing role<br />
in <strong>the</strong> domestic political environment. 95,96,97 At this stage, individuals and political organizations<br />
rely on <strong>the</strong> <strong>for</strong>mal rules <strong>of</strong> conduct and sanctions to vie <strong>for</strong> political power, and no major<br />
political group seriously attempts to overthrow <strong>the</strong> democratic regime. 98,99 Thus, we might<br />
reasonably expect to see a nonlinear relationship between democracy and domestic agitation that<br />
takes an upside-down “U” shape. To test <strong>for</strong> this non-linear relationship, we express democracy<br />
as a quadratic polynomial.<br />
Our measure <strong>of</strong> democracy is a 21-point ordinal regime-type indicator from <strong>the</strong> Polity IV:<br />
Political Regime Characteristics and Transitions, 1800–2002 dataset. 100 This measure is<br />
constructed by subtracting <strong>the</strong> ordinal Polity measure <strong>of</strong> a country’s level <strong>of</strong> institutionalized<br />
autocracy from <strong>the</strong> ordinal measure <strong>of</strong> a country’s level <strong>of</strong> institutionalized democracy. This<br />
results in an ordinal variable ranging from 10 (strongly autocratic) to +10 (strongly<br />
democratic). Since we needed to create a polynomial <strong>for</strong> use in our analyses, it was necessary to<br />
modify <strong>the</strong> original scale <strong>of</strong> <strong>the</strong> original regime-type variable. The fact that <strong>the</strong> variable had both<br />
negative and positive values created a potential problem <strong>for</strong> substantive interpretation after<br />
squaring scale values. Thus, we shifted <strong>the</strong> original scale to 0 through 20 be<strong>for</strong>e creating <strong>the</strong><br />
polynomial used in our analyses. We expect <strong>the</strong> linear democracy indicator to manifest a positive<br />
relationship with domestic agitation, and <strong>the</strong> polynomial indicator to manifest a negative<br />
relationship with domestic agitation.<br />
Level <strong>of</strong> Economic Development<br />
We include an indicator to control <strong>for</strong> <strong>the</strong> alternative hypo<strong>the</strong>sis that a country’s level <strong>of</strong><br />
economic development may influence <strong>the</strong> propensity <strong>of</strong> its citizenry to engage in domestic<br />
agitation. As previously discussed, countries with stronger economies are more likely to be able<br />
59
to af<strong>for</strong>d and withstand a banking crisis. Fur<strong>the</strong>rmore, Gurr (1994: 359) points out that at least in<br />
terms <strong>of</strong> ethno-political conflict (such as in our Indonesian or Malaysian examples), it is easy to<br />
specify why poverty may cause more frequent and more severe conflict, as “systemic poverty<br />
means limited state capacity: substantial concessions to communal contenders <strong>the</strong>re<strong>for</strong>e are<br />
prohibitively costly ... and conflicts over power and material issues tend to be seen by all<br />
contenders in zero-sum terms.” 101 Lichbach (1989: 464) notes that while “some dimensions <strong>of</strong><br />
economic inequality might be related to some dimensions <strong>of</strong> conflict under some conditions ...<br />
no empirical work has so far established this claim.” 102 Thus, this indicator is <strong>of</strong> interest.<br />
Like Cingranelli and Richards (1999), Mitchell and McCormick (1988), Poe et al. (1999) and<br />
Richards et al. (2001), we use <strong>the</strong> logged per capita value <strong>of</strong> a state’s gross domestic product<br />
(GDP) (purchasing power parity) as our indicator <strong>of</strong> economic development. 103,104,105,106 The fact<br />
that, by definition, GDP per capita does not take into account distributional issues has not gone<br />
unnoticed here. However, statistical examinations employing o<strong>the</strong>r measures, such as <strong>the</strong><br />
Physical Quality <strong>of</strong> Life Index (PQLI) and <strong>the</strong> Human Development Index (HDI), do not<br />
produce results different from those produced using GDP per capita in constant dollars. Thus, we<br />
use <strong>the</strong> logged value <strong>of</strong> GDP per capita (purchasing power parity), as it is a more widely<br />
(spatially and temporally) and readily available indicator than ei<strong>the</strong>r PQLI or HDI. Data were<br />
ga<strong>the</strong>red from <strong>the</strong> World Bank’s World Development Indicators 2004 dataset. 107 We would<br />
expect <strong>the</strong> level <strong>of</strong> domestic agitation to rise as <strong>the</strong> level <strong>of</strong> economic development falls.<br />
Repression<br />
Our next alternative hypo<strong>the</strong>sis is that <strong>the</strong> level <strong>of</strong> government repression in a society may be<br />
related to <strong>the</strong> propensity <strong>of</strong> citizens to engage in domestic agitation. That is, does repression lead<br />
to turmoil? Jackson et al. (1978) 108 and Lichbach and Gurr (1981) 109 have both posited that<br />
increased repression leads to increased rebellion. Indeed, in a longitudinal analysis <strong>of</strong> Chile,<br />
Davis and Ward (1990: 468) find evidence that “rebellion is (primarily) a response to<br />
government repressiveness in <strong>the</strong> <strong>for</strong>m <strong>of</strong> deaths from political violence.” 110<br />
While many agree that some relationship exists between repression and turmoil, <strong>the</strong>re is some<br />
debate surrounding <strong>the</strong> nature <strong>of</strong> this relationship. Many have specified this relationship as<br />
linear, while o<strong>the</strong>rs have made <strong>the</strong> case that <strong>the</strong> relationship is actually more complex than that.<br />
Gartner and Regan (1996: 285) note <strong>the</strong> following:<br />
One widely held view [<strong>of</strong> <strong>the</strong> interaction between opposition groups and a government]<br />
posits that as government coercion increases political dissent will increase accordingly,<br />
though at some point, where government coercion becomes particularly oppressive, <strong>the</strong><br />
marginal effect <strong>of</strong> <strong>the</strong> continued coercion will generate a decrease in overt political<br />
dissent. 111<br />
This non-linear approach suggests that an upside-down “U”-shaped relationship exists between<br />
repression and domestic agitation such that repression, up to some point, will produce greater<br />
turmoil until this coercion becomes so overwhelming that it actually decreases levels <strong>of</strong> dissent.<br />
(Gartner and Regan [1996] do not test this exact relationship; ra<strong>the</strong>r, <strong>the</strong>y are concerned with<br />
levels <strong>of</strong> regime coercion relative to opposition demand levels, given international and domestic<br />
costs associated with this ratio. They do, however, make a strong general case that <strong>the</strong><br />
relationship between coercion and protest is in some way nonlinear.) 112<br />
60
This approach assumes that repression works. That is, if a regime bears down hard enough on an<br />
opposition by, say, eliminating its leaders and jailing its rank-and-file, agitated opposition will, at<br />
some point, deteriorate. A tabular analysis <strong>of</strong> our cross-national data strongly indicates that such<br />
a nonlinear relationship is a possibility, and certainly, many states with high equilibrium levels <strong>of</strong><br />
repression have very low levels <strong>of</strong> domestic agitation. As Gartner and Regan state, a linear<br />
relationship between coercion and repression would lead to an ever-increasing game <strong>of</strong> “tit-<strong>for</strong>tat”<br />
culminating in civil war. 113<br />
To control <strong>for</strong> this nonlinear alternative hypo<strong>the</strong>sis, we include an indicator <strong>of</strong> repression from<br />
Arthur S. Banks’ Cross-<strong>National</strong> Time-Series Domestic Conflict Data that counts <strong>the</strong> number <strong>of</strong><br />
“[s]ystematic elimination[s] by jailing or execution <strong>of</strong> political opposition within <strong>the</strong> ranks <strong>of</strong> <strong>the</strong><br />
regime or <strong>the</strong> opposition.” 114 In our models, we include a quadratic polynomial to account <strong>for</strong><br />
nonlinearity. (In our analyses, we replaced Banks’ measure with <strong>the</strong> CIRI physical integrity<br />
rights index [Cingranelli and Richards, 2005] 115 as a simple sensitivity analysis. Our results were<br />
substantively unchanged.) We expect <strong>the</strong> linear repression indicator to manifest a positive<br />
relationship with domestic agitation, and <strong>the</strong> polynomial indicator to manifest a negative<br />
relationship with domestic agitation.<br />
Discrimination<br />
Our final alternative hypo<strong>the</strong>sis posits that high degrees <strong>of</strong> economic and political discrimination<br />
may lead to turmoil. This hypo<strong>the</strong>sis is based in <strong>the</strong> framework <strong>of</strong> relative<br />
deprivation. 116,117,118,119,120 The basic logic <strong>of</strong> relative deprivation is straight<strong>for</strong>ward. It assumes<br />
people compare <strong>the</strong>ir condition, ei<strong>the</strong>r as individuals or members <strong>of</strong> a group (or both), with <strong>the</strong><br />
conditions <strong>of</strong> o<strong>the</strong>rs. To <strong>the</strong> extent that one’s own condition, or that <strong>of</strong> one’s group, is inferior or<br />
degraded relative to that <strong>of</strong> o<strong>the</strong>rs, one is likely to become dissatisfied/frustrated. Incorporating<br />
<strong>the</strong> frustration-aggression model <strong>of</strong> behaviour, relative deprivation <strong>the</strong>ory asserts that <strong>the</strong> more<br />
frustrated one becomes at this perceived lack <strong>of</strong> status relative to o<strong>the</strong>rs, <strong>the</strong> more likely one is to<br />
become aggressive or to engage in violence. There is a strong parallel to <strong>the</strong> hypo<strong>the</strong>sis that as<br />
economic inequality grows in society, so does <strong>the</strong> risk <strong>of</strong> violent behavior. 121,122,123,124<br />
We focus on what is known as fraternal relative deprivation, whereby group status is <strong>the</strong> mode <strong>of</strong><br />
comparison. 125,126 . That is, to <strong>the</strong> point one’s group (however self-identified) is seen as degraded<br />
relative to o<strong>the</strong>r groups, <strong>the</strong> more potential <strong>for</strong> dissatisfaction and perhaps, ultimately, violence.<br />
We work from <strong>the</strong> assumption that individuals as members <strong>of</strong> groups are cognizant <strong>of</strong> <strong>the</strong>ir status<br />
relative to o<strong>the</strong>r groups in society. It follows, importantly, that <strong>the</strong>y are <strong>the</strong>n aware <strong>of</strong><br />
discrimination against <strong>the</strong>m (fraternal relative deprivation) and that this discrimination can lead<br />
to violent behaviour as a result.<br />
The results <strong>of</strong> empirical tests <strong>of</strong> both relative deprivation and economic inequality as wellsprings<br />
<strong>of</strong> violence have been famously mixed. 127,128 Canache (1996) notes, however, that this is largely<br />
<strong>the</strong> result <strong>of</strong> flawed research designs and data not suited <strong>for</strong> <strong>the</strong>se tests. 129 Our data on<br />
discrimination against groups in society come from <strong>the</strong> Minorities at Risk (MAR) Project. 130,131<br />
(We also tried using a country’s GINI coefficient score as a measure <strong>of</strong> economic inequality<br />
and/or relative deprivation, 132,133,134 but because <strong>of</strong> <strong>the</strong> cross-regional nature <strong>of</strong> our study, even<br />
<strong>the</strong> most comprehensive source <strong>of</strong> GINI data [Version 2.0a <strong>of</strong> <strong>the</strong> UNU/WIDER World Income<br />
Inequality Database {WIID}] significantly reduced our N <strong>for</strong> analysis. Indicators from <strong>the</strong> World<br />
Bank’s World Development Indicators database <strong>of</strong> percentage <strong>of</strong> population at <strong>the</strong> top and<br />
bottom quintiles <strong>of</strong> income were subject to even greater missing data problems. 135 Our analyses<br />
61
conducted using GINI had an overall N <strong>of</strong> 625, and while <strong>the</strong>re was no substantive effect on our<br />
relationship <strong>of</strong> chief <strong>the</strong>oretical interest [banking crises and domestic turmoil]. The GINI<br />
measure itself was statistically insignificant.) The MAR Project defines a “minority at risk” as<br />
“an ethnopolitical group (non-state communal group) that: collectively suffers, or benefits from,<br />
systematic discriminatory treatment vis-à-vis o<strong>the</strong>r groups in a society; and0or collectively<br />
mobilizes in defense or promotion <strong>of</strong> its self-defined interests.” 136 Our indicator <strong>of</strong> fraternal<br />
relative deprivation additively combines <strong>the</strong> MAR indices <strong>of</strong> both a country’s mean level <strong>of</strong><br />
political discrimination and economic discrimination against groups. The MAR indicators<br />
describe “<strong>the</strong> role <strong>of</strong> public policy and social practice in maintaining or redressing political<br />
inequalities.” 137 Our indicator is continuous and ranges from zero (no such discrimination) to<br />
eight (a high level <strong>of</strong> discrimination). We would expect domestic agitation to increase along with<br />
increased discrimination.<br />
Estimation Technique<br />
Because our data are in pooled cross-section time-series <strong>for</strong>m (with significantly more spatial<br />
units than temporal units), we employ <strong>the</strong> generalized estimation equation (GEE) estimation<br />
technique with robust standard errors. The GEE approach was developed to extend “generalized<br />
linear models (GLMs) to a regression setting with correlated observations within subjects,”<br />
making it very attractive <strong>for</strong> use with panel data. 138 When “<strong>the</strong> primary question <strong>of</strong> interest is ...<br />
comparison across groups or subpopulations,” GEE is a more appropriate estimation technique<br />
than “conditional” models (e.g., fixed-effects). 139 Fur<strong>the</strong>r, GEE allows researchers to specify<br />
correlation patterns within clusters. We specify an exchangeable correlation structure, where<br />
covariance is assumed to be equal within any given individual cluster. This correlation structure<br />
corresponds to a random-effects model.<br />
Findings<br />
In <strong>the</strong> majority <strong>of</strong> cases in our data (approximately 61percent), no banking system problem was<br />
present. Approximately 16 percent <strong>of</strong> our cases were coded as having significant banking<br />
problems, while approximately 22 percent <strong>of</strong> <strong>the</strong> cases were identified as having full-blown<br />
banking crises. Thus, roughly 38 percent <strong>of</strong> our cases had some banking problem. It was<br />
mentioned earlier that <strong>the</strong> creators <strong>of</strong> <strong>the</strong> banking crisis indicator acknowledge that <strong>the</strong>re is some<br />
degree <strong>of</strong> subjectivity involved in differentiating between a “significant banking problem” and a<br />
“banking crisis.” Were <strong>the</strong>se categories independent <strong>for</strong> <strong>the</strong> purposes <strong>of</strong> our analysis, we might<br />
expect to see a statistically significant difference in <strong>the</strong> mean level <strong>of</strong> domestic agitation. That is,<br />
we would see a statistically significant different mean level <strong>of</strong> agitation between “no banking<br />
crisis,” “significant problem” and “banking crisis” cases. Using a difference-<strong>of</strong> means test we<br />
find that in <strong>the</strong> collective protest context, <strong>the</strong> “significant problem” and “banking crises”<br />
categories are not statistically independent, and that in <strong>the</strong> rebellion/internal war context, <strong>the</strong>y are<br />
barely independent.<br />
This might indicate that <strong>the</strong>se data really represent only two categories <strong>of</strong> in<strong>for</strong>mation, “no<br />
banking crisis” or “banking crisis,” and not three. To test this possibility, we created a<br />
dichotomous version <strong>of</strong> <strong>the</strong> banking crisis variable, leaving “no banking crisis” as one category,<br />
and combining <strong>the</strong> o<strong>the</strong>r two categories into a single “banking crisis” category. However, when<br />
employed in <strong>the</strong> regression analyses reported below, this indicator returned substantively<br />
identical results compared to <strong>the</strong> original ordinal indicator.<br />
62
Table 2.2.A-3 presents <strong>the</strong> results <strong>of</strong> two regressions, examining <strong>the</strong> contemporaneous<br />
relationship between a country’s level <strong>of</strong> banking crisis and its level <strong>of</strong> two types <strong>of</strong> domestic<br />
agitation. Chi-squared tests show that both models are statistically significant from <strong>the</strong>ir null<br />
counterparts at <strong>the</strong> .00 level <strong>of</strong> significance. We see that a country’s level <strong>of</strong> banking crisis is a<br />
statistically significant predictor <strong>of</strong> its level <strong>of</strong> collective protest activities, but not its<br />
rebellion/internal war activities. We find a weak positive linear relationship between collective<br />
protest activities and democracy, although <strong>the</strong>re is no evidence <strong>for</strong> a nonlinear relationship. No<br />
statistically reliable relationship is found between democracy and rebellion/internal war.<br />
Table 2.2.A-3. GEE Estimates <strong>of</strong> <strong>the</strong> Contemporaneous Relationship between Level <strong>of</strong> Banking<br />
Crisis and Two Types <strong>of</strong> Domestic Agitation.<br />
Level <strong>of</strong> Banking Crisis<br />
Type <strong>of</strong> Domestic Agitation<br />
Collective Protest<br />
Rebellion/Internal War<br />
Level <strong>of</strong> Banking Crisis<br />
.10** -.00<br />
(.04) (.03)<br />
Level <strong>of</strong> Democracy<br />
.05** .04<br />
(.02) (.04)<br />
Level <strong>of</strong> Democracy Squared<br />
-.00 -.00<br />
(.00) (.00)<br />
Level <strong>of</strong> Economic Development<br />
.04 -.18**<br />
(.04) (.05)<br />
Repression<br />
.90** 1.13**<br />
(.41) (.39)<br />
Repression Squared<br />
-.31* -.36**<br />
(.16) (.16)<br />
Discrimination<br />
.06** .08**<br />
(.02) (.02)<br />
Constant<br />
-.82** 1.04**<br />
(.36) (.43)<br />
N 1525 1521<br />
Prob > Chi-squared .000 .000<br />
Figures in paren<strong>the</strong>ses are heteroskedasticity-corrected standard errors.<br />
*p ≤ .10 **p ≤ .05<br />
In line with our a priori expectations, we found a negative relationship between level <strong>of</strong><br />
economic development and context <strong>of</strong> rebellion/internal war activities. That is, from <strong>the</strong>se<br />
results, we would expect levels <strong>of</strong> rebellion/internal war activities to fall when a country’s level<br />
<strong>of</strong> economic development rises, and vice versa. No statistically reliable relationship was found<br />
between level <strong>of</strong> economic development and collective protest. In both models, we found<br />
evidence <strong>of</strong> a nonlinear relationship between domestic agitation activities and repression such<br />
that domestic agitation seems to be greatest at middle values <strong>of</strong> repression.<br />
Finally, Table 2.2.A-3 demonstrates a statistically reliable and positive relationship between<br />
discrimination and both types <strong>of</strong> domestic agitation activities. That is, increases in political and<br />
economic discrimination against minorities at risk should be expected to be accompanied by<br />
increased levels <strong>of</strong> collective protest and rebellion/internal war activities. The relationship is<br />
slightly stronger in <strong>the</strong> case <strong>of</strong> rebellion/internal war activities.<br />
63
The models used <strong>for</strong> <strong>the</strong> analyses in Table 2.2.A-4 are similar to those used in <strong>the</strong> previous<br />
analysis, except that <strong>the</strong>y take into account <strong>the</strong> fact that <strong>the</strong> effects <strong>of</strong> banking crises may extend<br />
to a following year. Thus, along with our indicator <strong>of</strong> <strong>the</strong> level <strong>of</strong> banking crisis at time (t), we<br />
also employ an indicator <strong>of</strong> <strong>the</strong> level <strong>of</strong> banking crisis at time (t-1). The Kendall’s Tau estimation<br />
<strong>of</strong> <strong>the</strong> association between level <strong>of</strong> banking crisis at time (t) and time (t-1) is 0.77, indicating<br />
less-than-perfect correlation and thus, <strong>the</strong> presence <strong>of</strong> some variation between <strong>the</strong> two time<br />
points. (See Friedrich [1982] 140 or Jaccard, Turrissi and Wan [1990] 141 <strong>for</strong> a discussion on <strong>the</strong><br />
effects <strong>of</strong> less-than-perfect multicollinearity among indicators in a regression. Our assumption is<br />
that less-than-perfect correlation is not a problem.) As in Table 2.2.A-3, chi-squared tests show<br />
that both models are statistically significant from <strong>the</strong>ir null counterparts at <strong>the</strong> .00 level <strong>of</strong><br />
significance.<br />
In Table 2.2.A-4, we first see that a country’s level <strong>of</strong> banking crisis at time (t) is only reliably<br />
associated with domestic agitation in <strong>the</strong> context <strong>of</strong> collective protest activities. In nei<strong>the</strong>r<br />
context <strong>of</strong> domestic agitation, however, is a state’s level <strong>of</strong> banking crisis at time (t-1) a<br />
significant indicator <strong>of</strong> domestic agitation at time (t). In terms <strong>of</strong> significance and direction <strong>of</strong><br />
relationship, o<strong>the</strong>r variables per<strong>for</strong>m as in <strong>the</strong> non-lagged models.<br />
Looking at our raw data, we find different combinations <strong>of</strong> collective protest activities to be<br />
associated with similar levels <strong>of</strong> changes in <strong>the</strong> level <strong>of</strong> banking crises, although<br />
continued/increased demonstrations seem to be a mainstay. For example, Senegal in 1982 to<br />
1983 went from no crisis to severe crisis and saw an increase in demonstrations. Given <strong>the</strong> same<br />
increase in <strong>the</strong> level <strong>of</strong> banking crisis, Bangladesh in 1987 to 1988 saw increases in riots and<br />
demonstrations and a continued level <strong>of</strong> strikes. Lebanon in 1987 to 1988 saw an increase in<br />
riots. Given <strong>the</strong> establishment here <strong>of</strong> a banking crisis-collective protest relationship at <strong>the</strong> macro<br />
level <strong>of</strong> analysis, future studies, perhaps region-specific ones, would do well to examine<br />
collective protest activities in a disaggregated fashion.<br />
Table 2.2.A-4. GEE Estimates <strong>of</strong> <strong>the</strong> Lagged (t-1) Relationship between Level <strong>of</strong> Banking<br />
Crisis and Two Types <strong>of</strong> Domestic Agitation<br />
Level <strong>of</strong> Banking Crisis<br />
Type <strong>of</strong> Domestic Agitation<br />
Collective Protest Rebellion/Internal War<br />
Level <strong>of</strong> Banking Crisis<br />
.10** -.03<br />
(.04) (.03)<br />
Banking Crisis (T-1)<br />
.01 .04<br />
(.03) (.03)<br />
Level <strong>of</strong> Democracy<br />
.04* .04<br />
(.02) (.04)<br />
Level <strong>of</strong> Democracy Squared<br />
-.00 -.00<br />
(.00) (.00)<br />
Level <strong>of</strong> Economic Development<br />
.03 -.18**<br />
(.04) (.05)<br />
Repression<br />
-.90** -1.14**<br />
(.41) (.39)<br />
Repression Squared<br />
-.31* -.36**<br />
(.16) (.16)<br />
Discrimination<br />
.06** .08**<br />
(.02) (.02)<br />
Constant -.77** 1.04**<br />
64
Table 2.2.A-4. GEE Estimates <strong>of</strong> <strong>the</strong> Lagged (t-1) Relationship between Level <strong>of</strong> Banking<br />
Crisis and Two Types <strong>of</strong> Domestic Agitation<br />
Level <strong>of</strong> Banking Crisis<br />
Type <strong>of</strong> Domestic Agitation<br />
Collective Protest Rebellion/Internal War<br />
(.35) (.43)<br />
N 1514 1510<br />
Prob > Chi-squared .000 .000<br />
Figures in paren<strong>the</strong>ses are heteroskedasticity-corrected standard errors.<br />
*p ≤ .10 **p ≤ .05<br />
Conclusion<br />
The findings <strong>of</strong> this study have important implications <strong>for</strong> understanding <strong>the</strong> puzzle <strong>of</strong> domestic<br />
political stability. We posited that banking crises appear to be a sufficient factor in causing<br />
domestic agitation, as citizens protest against both <strong>the</strong> direct negative effects <strong>of</strong> a banking crisis<br />
itself (such as <strong>the</strong> loss <strong>of</strong> access to savings and credit), and against a government’s handling <strong>of</strong> an<br />
economy adversely affected by a banking crisis. These protests are <strong>of</strong>ten manifested as food<br />
riots, labour strikes, and anti-austerity demonstrations.<br />
Using a cross-national data set comprised <strong>of</strong> 125 countries <strong>for</strong> <strong>the</strong> years 1981 through 2000, we<br />
tested our hypo<strong>the</strong>sis that banking crises are a significant factor in fomenting domestic agitation.<br />
We found a contemporaneous relationship between a country’s level <strong>of</strong> banking crisis and its<br />
level <strong>of</strong> collective protest activities. The relationship was such that we would reliably expect to<br />
see collective protest in countries experiencing a banking crisis (<strong>the</strong> worse <strong>the</strong> crisis, <strong>the</strong> more<br />
domestic agitation). This finding is supported by our case examples, where we almost<br />
exclusively saw collective protest activities, such as strikes, anti-government demonstrations and<br />
riots, directly resulting from <strong>the</strong> effects <strong>of</strong> banking crises on citizens. Thus, <strong>the</strong> impact <strong>of</strong> a<br />
banking crisis on political stability was found to be immediate and damaging. The silver lining<br />
here may be that such ill effects appear to be relatively short lived. This is supported by <strong>the</strong><br />
finding that <strong>the</strong> lagged banking crisis variable demonstrated no significant association with<br />
collective protest or rebellion/internal war.<br />
Although <strong>the</strong>re was a considerable amount <strong>of</strong> rebellion/internal war activity in our sample, our<br />
analyses seem to indicate that <strong>the</strong> effects <strong>of</strong> banking crises on types <strong>of</strong> collective action are<br />
bounded. On average, <strong>the</strong> effect <strong>of</strong> a banking crisis appears to stop short <strong>of</strong> being related to<br />
widely participatory and organized violence against a government. Instead, banking crises seem<br />
to be reliably associated with immediate and intense protests by adversely affected individuals.<br />
Certainly no less interesting was <strong>the</strong> support we found <strong>for</strong> a relationship between fraternal<br />
relative deprivation and amounts <strong>of</strong> both types <strong>of</strong> domestic agitation such that greater relative<br />
deprivation is associated with greater domestic agitation. In addition, lending support to many<br />
who have so surmised, our findings suggest that nascent democracy is a seemingly<br />
accommodating context <strong>for</strong> collective protest activities. We found a negative relationship<br />
between level <strong>of</strong> economic development and rebellion/internal war activity. This relationship<br />
was expected, as economic growth is expected to alleviate <strong>the</strong> plight <strong>of</strong> poverty and positions<br />
countries to better withstand <strong>the</strong> cost <strong>of</strong> banking crises, <strong>the</strong>reby lowering <strong>the</strong> likelihood <strong>of</strong><br />
citizens participating in rebellion/internal war.<br />
65
We found some support <strong>for</strong> those who posit nonlinear relationships between domestic agitation<br />
and repression. In particular, we found possible empirical support <strong>for</strong> Gartner and Regan’s<br />
(1996) supposition that while low-to-moderate levels <strong>of</strong> repression may spur domestic agitation;<br />
agitation will actually decline in <strong>the</strong> face <strong>of</strong> higher levels <strong>of</strong> repression. 142 This is an interesting<br />
finding and certainly deserves future consideration.<br />
Our findings should be <strong>of</strong> some interest to those seeking to identify <strong>the</strong> causes <strong>of</strong> banking crises<br />
<strong>the</strong>mselves. Economists have yet to generate any uni<strong>for</strong>m agreement regarding <strong>the</strong> specific<br />
causes <strong>of</strong> banking crises. While <strong>the</strong>re is agreement that a particular set <strong>of</strong> conditions may be<br />
present <strong>for</strong> one particular crisis, it is by no means accepted that <strong>the</strong>se conditions will be present<br />
at o<strong>the</strong>r financial crises. Certainly, <strong>the</strong> discovery <strong>of</strong> a reliable association between banking crises<br />
and collective action activities makes discovering <strong>the</strong> causes <strong>of</strong> banking crises all <strong>the</strong> more<br />
important.<br />
To summarize, we found a country’s level <strong>of</strong> banking crisis to be reliably associated with its<br />
level <strong>of</strong> collective protest activities. Given <strong>the</strong> frequency <strong>of</strong> banking crises and <strong>the</strong> fragility and<br />
importance <strong>of</strong> <strong>the</strong> banking sector, this is a significant finding. A government experiencing a<br />
banking crisis faces not only certain economic costs, but also should probably expect to face<br />
social disruptions such as strikes, riots and antigovernment demonstrations. Moreover, our<br />
findings add to <strong>the</strong> ongoing discussion regarding <strong>the</strong> economic globalization process. The results<br />
<strong>of</strong> <strong>the</strong> study clearly suggest that banking crises impose economic and political costs on domestic<br />
governments. To reestablish a stable political environment, including <strong>the</strong> settlement <strong>of</strong> strikes<br />
and anti-government demonstrations, governments may be required to limit participation in<br />
international markets. While firm agreement on this will require fur<strong>the</strong>r study, it is clear that <strong>the</strong><br />
interconnection between economic and political frontiers adds greater pressure to better<br />
understand <strong>the</strong> determinants and consequences <strong>of</strong> banking crises; not only to avoid economic<br />
distress, but also to avoid <strong>the</strong> pain <strong>of</strong> social agitation.<br />
↑ Back to <strong>the</strong> top<br />
1<br />
Enoch, Charles. 2000. “Interventions in Banks During Banking Crises: The Experience <strong>of</strong> Indonesia.”<br />
IMF Policy Discussion Paper 00/2. Washington, DC: International Monetary Fund.<br />
2<br />
Frydl, Edward J. and Marc Quintyn. 2000. “The Benefits and Costs <strong>of</strong> Intervening in Banking Crises.”<br />
IMF Working Paper 00/147. Washington, DC: The International Monetary Fund.<br />
3<br />
Garcia, Gillian. 1997. “Protecting Bank Deposits.” Economic Issues. Washington, DC: International<br />
Monetary Fund.<br />
4<br />
Kaufman, George G. and Steven A. Seelig. 2001. “Post Resolution Treatment <strong>of</strong> Depositors at Failed<br />
Banks: Implications <strong>for</strong> <strong>the</strong> Severity <strong>of</strong> Banking Crises, Systemic Risk, and Too-Big-To-Fail.” IMF<br />
Working Paper 01/83.Washington, DC: International Monetary Fund.<br />
5<br />
Lindgren, Carl-Johan, Gillian Garcia and Mat<strong>the</strong>w I. Saal. 1996. Bank Soundness and Macroeconomic<br />
Policy. Washington, DC: International Monetary Fund.<br />
6<br />
Mahon, James E. and Javier Corrales. 2002. “Pegged <strong>for</strong> Failure? Argentina’s Crisis.” Current History<br />
101: 72–75.<br />
7<br />
Carstens, Agustin, Daniel Hardy and Ceyla Pazarbasioglu. 2004. “Avoiding Banking Crises in Latin<br />
America.” Financial Development 41: 30–3.<br />
8<br />
Hardy, Daniel C. 1998. “Are Banking Crises Predictable?” Finance and Development 35 (December):<br />
38–41.<br />
9<br />
Stiglitz, Joseph E. 2003. Globalization and its Discontents. New York: W.W. Norton & Company, Inc.<br />
10 Rennhack, Robert. 2000. “Banking Supervision.” Finance and Development 37: 9–15.<br />
66
11 Kaufman, 2000.<br />
12 Caprio, Gerard and Daniela Klingebiel. 2003. “Episodes <strong>of</strong> Systemic and Borderline Financial Crises.”<br />
http://econ.worldbank.org/view.php?id=23456 (February 20, 2006).<br />
13 Lindgren, Carl-Johan, Gillian Garcia and Mat<strong>the</strong>w I. Saal. 1996. Bank Soundness and Macroeconomic<br />
Policy. Washington, DC: International Monetary Fund.<br />
14 Lindgren, Carl-Johan, Gillian Garcia and Mat<strong>the</strong>w I. Saal. 1996. Bank Soundness and Macroeconomic<br />
Policy. Washington, DC: International Monetary Fund.<br />
15 Stiglitz, Joseph E. 2003. Globalization and its Discontents. New York: W.W. Norton & Company, Inc.<br />
16 The Economist. 1997. “The end <strong>of</strong> <strong>the</strong> miracle?” November 29, 21–23.<br />
17 Eichengreen, Barry. 1997. “The Tyranny <strong>of</strong> <strong>the</strong> Financial Markets.” Current History 96: 377–82.<br />
18 Hardy, 1999.<br />
19 Knight, Malcolm. 1999. “Developing and Transition Countries Confront Financial Globalization.”<br />
Finance and Development 36: 32–5.<br />
20 Kaufman, George. 1996. “Banking Failures, Systemic Risk, and Bank Regulation.” Cato Journal 16:<br />
17–45.<br />
21 Hardy, 1999.<br />
22 Garcia, Gillian and Carl-Hohan Lindgren. 1998. “Averting <strong>the</strong> Crash: Economic Institutions and<br />
Financial Sector Soundness.” SIAS Review 33: 20–32.<br />
23 Singh, Ajit and Bruce A.Weisse. 1998. “Emerging Stock Markets, Portfolio Capital Flows and Longterm<br />
Economic Growth: Micro and Macroeconomic Perspectives.” World Development 26: 607–22.<br />
24 Hardy, Daniel C. 1998. “Are Banking Crises Predictable?” Finance and Development 35 (December):<br />
38–41.<br />
25 Enoch, Charles. 2000. “Interventions in Banks during Banking Crises: The Experience <strong>of</strong> Indonesia.”<br />
IMF Policy Discussion Paper 00/2. Washington, DC: International Monetary Fund.<br />
26 Frydl, Edward J. and Marc Quintyn. 2000. “The Benefits and Costs <strong>of</strong> Intervening in Banking Crises.”<br />
IMF Working Paper 00/147. Washington, DC: The International Monetary Fund.<br />
27 Martinez, Guillermo Ortiz. 1998. “What Lessons Does <strong>the</strong> Mexican Crisis Hold <strong>for</strong> Recovery in<br />
Asia?” Finance and Development 35 (June): 6–9.<br />
28 Valencia, Mat<strong>the</strong>w. 1997. “Fragile, handle with care.” The Economist, April 10, 1–40.<br />
29 Carstens, Agustin, Daniel Hardy and Ceyla Pazarbasioglu. 2004. “Avoiding Banking Crises in Latin<br />
America.” Financial Development 41: 30–3.<br />
30 Ouattara, Alassane. 1998. “Globalization, Lessons from <strong>the</strong> Asian Crisis and Central Bank Policies.”<br />
Paper presented at <strong>the</strong> Reunion des Gouverneurs des Banques Centrales des Pays, Ottawa.<br />
31 Schwartz, Anna J. 1998. “International Financial Crises: Myths and Realities.” The Cato Journal 17:<br />
251–56.<br />
32 Lindgren, Carl-Johan, Gillian Garcia and Mat<strong>the</strong>w I. Saal. 1996. Bank Soundness and Macroeconomic<br />
Policy. Washington, DC: International Monetary Fund.<br />
33 Lindgren, Carl-John, Gillian Garcia and Mat<strong>the</strong>w I. Saal. 1999. Financial Sector Crisis and<br />
Restructuring: Lessons from Asia.Washington, DC: International Monetary Fund.<br />
34 Hanlon, Joseph. 2001. “Corruption Busting Bank Chairman Assassinated.” Sou<strong>the</strong>rn African Regional<br />
Poverty Network. http://www.sarpn.org.za/countryPovertyPapers/Mozambique/Assassin/index.php<br />
(April 1, 2006).<br />
35 Valencia, Mat<strong>the</strong>w. 1997. “Fragile, handle with care.” The Economist, April 10, 1–40.<br />
36 Valencia, Mat<strong>the</strong>w. 1997. “Fragile, handle with care.” The Economist, April 10, 1–40.<br />
37 Madura, Jeff. 1998. Financial Markets and Institutions. Cincinnati: South-Western College<br />
Publishing.<br />
38 Madura, Jeff. 1998. Financial Markets and Institutions. Cincinnati: South-Western College<br />
Publishing.<br />
67
39 Carstens, Agustin, Daniel Hardy and Ceyla Pazarbasioglu. 2004. “Avoiding Banking Crises in Latin<br />
America.” Financial Development 41: 30–3.<br />
40 Mydans, Seth. 1998. “Newly Jobless—and Newly Angry—Threaten Indonesia’s Stability.” The New<br />
York Times, January 29, A3.<br />
41 Enoch, Charles. 2000. “Interventions in Banks During Banking Crises: The Experience <strong>of</strong> Indonesia.”<br />
IMF Policy Discussion Paper 00/2. Washington, DC: International Monetary Fund.<br />
42 Kaufman, George G. and Steven A. Seelig. 2001. “Post Resolution Treatment <strong>of</strong> Depositors at Failed<br />
Banks: Implications <strong>for</strong> <strong>the</strong> Severity <strong>of</strong> Banking Crises, Systemic Risk, and Too-Big-To-Fail.” IMF<br />
Working Paper 01/83.Washington, DC: International Monetary Fund.<br />
43 Garcia, Gillian. 1999. “Deposit Insurance: A Survey <strong>of</strong> Actual and Best Practices.” IMF Working<br />
Paper 99/54. Washington, DC: International Monetary Fund.<br />
44 The Economist. 2002. “Between <strong>the</strong> creditors and <strong>the</strong> streets.” January 5, 29–30.<br />
45 Keesings. 2001. Keesings Record <strong>of</strong> World Events. Be<strong>the</strong>sda, MD: Keesings Worldwide LLC.<br />
46 Pearlstein, Steven. 2001. “Argentina’s Financial Quandary Is No Surprise.” Washington Post,<br />
December 21, A38.<br />
47 Keesings. 2000. Keesings Record <strong>of</strong> World Events. Be<strong>the</strong>sda, MD: Keesings Worldwide LLC.<br />
48 The Economist. 1998. “The last bailout <strong>of</strong> Credit Lyonnais.” May 23, 67.<br />
49 Enoch, Charles. 2000. “Interventions in Banks During Banking Crises: The Experience <strong>of</strong> Indonesia.”<br />
IMF Policy Discussion Paper 00/2. Washington, DC: International Monetary Fund.<br />
50 Uchitelle, Louis. 1998. “Economists Blame Short-Term Loans <strong>for</strong> Asian Crisis.” The New York Times,<br />
January 8, D4.<br />
51 Eichengreen, Barry. 1997. “The Tyranny <strong>of</strong> <strong>the</strong> Financial Markets.” Current History 96: 377–82.<br />
52 Valencia, Mat<strong>the</strong>w. 1997. “Fragile, handle with care.” The Economist, April 10, 1–40.<br />
53 Keesings. 1995. Keesings Record <strong>of</strong> World Events. Be<strong>the</strong>sda, MD: Keesings Worldwide LLC.<br />
54 Davenport, Christian. 1995. “Multi-Dimensional Threat Perception and State Repression: An Inquiry<br />
into Why States Apply Negative Sanctions.” American Journal <strong>of</strong> Political Science 39: 683–713.<br />
55 Davenport, Christian. 1996. “The Weight <strong>of</strong> <strong>the</strong> Past: Exploring Lagged Determinants <strong>of</strong> Political<br />
Repression.” Political Research Quarterly 49: 377–403.<br />
56 Davenport, Christian. 1998. “Liberalizing Event or Lethal Episode?: An Empirical Assessment <strong>of</strong> How<br />
<strong>National</strong> Elections Affect <strong>the</strong> Suppression <strong>of</strong> Political and Civil Liberties.” Social Science Quarterly<br />
79: 321–41.<br />
57 Francisco, Ronald A. 1996. “Coercion and Protest: An Empirical Test in Two Democratic States.”<br />
American Journal <strong>of</strong> Political Science 40: 1179–1204.<br />
58 King, John C. 1998. “Repression, Domestic Threat, and Interactions in Argentina and Chile.” Journal<br />
<strong>of</strong> Political and Military Sociology 26: 191–211.<br />
59 Ziegenghagen, Eduard. 1986. The Regulation <strong>of</strong> Political Conflict. New York: Praeger.<br />
60 Cingranelli, David L. and David L. Richards. 1999. “Respect <strong>for</strong> Human Rights after <strong>the</strong> End <strong>of</strong> <strong>the</strong><br />
Cold War.” Journal <strong>of</strong> Peace Research 36: 511–34.<br />
61 Mitchell, Neil J. and James M. McCormick. 1988. “Economic and Political Explanations <strong>of</strong> Human<br />
Rights Violations.” World Politics 40: 476–98.<br />
62 Poe, Steven C., C. Neal Tate and Linda Camp-Keith. 1999. “Repression <strong>of</strong> <strong>the</strong> Human Right to<br />
Personal Integrity Revisited: A Global Cross-national study Covering The Years 1976–1993.”<br />
International Studies Quarterly 43: 291–313.<br />
63 Richards, David L., Ronald D. Gelleny and David H. Sacko. 2001. “Money with a Mean Streak?<br />
Foreign Economic Penetration and Government Respect <strong>for</strong> Human Rights in Developing Countries.”<br />
International Studies Quarterly 45: 219–239.<br />
64 Gurr, Ted Robert. 1970. Why Men Rebel. Princeton: Princeton University Press.<br />
65 Hibbs, Douglas A. 1973. Mass Political Violence: A Cross-<strong>National</strong> Causal Analysis. New York: John<br />
Wiley.<br />
68
66 Lichbach, Mark Irving and Ted Robert Gurr. 1981. “The Conflict Process: A Formal Model.” Journal<br />
<strong>of</strong> Conflict Resolution 25: 3–29.<br />
67 Gurr, Ted Robert. 1970. Why Men Rebel. Princeton: Princeton University Press.<br />
68 Hibbs, Douglas A. 1973. Mass Political Violence: A Cross-<strong>National</strong> Causal Analysis. New York: John<br />
Wiley.<br />
69 Lichbach, Mark Irving and Ted Robert Gurr. 1981. “The Conflict Process: A Formal Model.” Journal<br />
<strong>of</strong> Conflict Resolution 25: 3–29.<br />
70 Muller, Edward N. and Mitchell A. Seligson. 1987. “Inequality and Insurgency.” American Political<br />
Science Review 81: 425–52.<br />
71 Banks, Arthur S. 2003. Cross-<strong>National</strong> Time-Series Data Archive. http://www.databanks.<br />
sitehosting.net (April 1, 2006).<br />
72 Hibbs, Douglas A. 1973. Mass Political Violence: A Cross-<strong>National</strong> Causal Analysis. New York: John<br />
Wiley.<br />
73 Lichbach, Mark Irving and Ted Robert Gurr. 1981. “The Conflict Process: A Formal Model.” Journal<br />
<strong>of</strong> Conflict Resolution 25: 3–29.<br />
74 Gurr, Ted Robert. 1970. Why Men Rebel. Princeton: Princeton University Press.<br />
75 Hibbs, Douglas A. 1973. Mass Political Violence: A Cross-<strong>National</strong> Causal Analysis. New York: John<br />
Wiley.<br />
76 Lichbach, Mark Irving and Ted Robert Gurr. 1981. “The Conflict Process: A Formal Model.” Journal<br />
<strong>of</strong> Conflict Resolution 25: 3–29.<br />
77 Gurr, Ted Robert. 1970. Why Men Rebel. Princeton: Princeton University Press.<br />
78 Kim, Jae-On and CharlesW. Mueller. 1978. Factor Analysis: Statistical Methods and Practical Issues.<br />
Beverly Hills: Sage Publications.<br />
79 Caprio, Gerard and Daniela Klingebiel. 2003. “Episodes <strong>of</strong> Systemic and Borderline Financial Crises.”<br />
http://econ.worldbank.org/view.php?id=23456 (February 20, 2006).<br />
80 Lindgren, Carl-Johan, Gillian Garcia and Mat<strong>the</strong>w I. Saal. 1996. Bank Soundness and Macroeconomic<br />
Policy. Washington, DC: International Monetary Fund.<br />
81 Lindgren, Carl-Johan, Gillian Garcia and Mat<strong>the</strong>w I. Saal. 1996. Bank Soundness and Macroeconomic<br />
Policy. Washington, DC: International Monetary Fund.<br />
82 Sundararajan, V. and Tomas J.T. Balino. 1991. “Issues in Recent Banking Crises.” In Banking Crises:<br />
Cases and Issues, eds. V. Sundararajan and Tomas J.T. Balino. Washington, DC: International<br />
Monetary Fund.<br />
83 Caprio, Gerard and Daniela Klingebiel. 2003. “Episodes <strong>of</strong> Systemic and Borderline Financial Crises.”<br />
http://econ.worldbank.org/view.php?id=23456 (February 20, 2006).<br />
84 Caprio, Gerard and Daniela Klingebiel. 2003. “Episodes <strong>of</strong> Systemic and Borderline Financial Crises.”<br />
http://econ.worldbank.org/view.php?id=23456 (February 20, 2006).<br />
85 Lindgren, Carl-Johan, Gillian Garcia and Mat<strong>the</strong>w I. Saal. 1996. Bank Soundness and Macroeconomic<br />
Policy. Washington, DC: International Monetary Fund.<br />
86 Lindgren, Carl-Johan, Gillian Garcia and Mat<strong>the</strong>w I. Saal. 1996. Bank Soundness and Macroeconomic<br />
Policy. Washington, DC: International Monetary Fund.<br />
87 Caprio, Gerard and Daniela Klingebiel. 2003. “Episodes <strong>of</strong> Systemic and Borderline Financial Crises.”<br />
http://econ.worldbank.org/view.php?id=23456 (February 20, 2006).<br />
88 Tilly, Charles. 1978. From Mobilization to Revolution. Reading, MA: Addison-Wesley.<br />
89 Huntington, Samuel P. 1997. “Democracy <strong>for</strong> <strong>the</strong> Long Haul.” In Consolidating <strong>the</strong> Third Wave<br />
Democracies, ed. Larry Diamond. Baltimore: The Johns Hopkins University Press.<br />
90 Huntington, Samuel P. 1997. “Democracy <strong>for</strong> <strong>the</strong> Long Haul.” In Consolidating <strong>the</strong> Third Wave<br />
Democracies, ed. Larry Diamond. Baltimore: The Johns Hopkins University Press.<br />
91 Narayan, Deepa. 2000. Voices <strong>of</strong> <strong>the</strong> Poor: Can Anyone Hear Us? Washington, DC: The World Bank.<br />
69
92 Rose, Richard, Doh C. Shin and Neil Munro. 1999. “Tensions Between <strong>the</strong> Democratic Ideal and<br />
Reality: South Korea.” In Critical Citizens: Global Support <strong>for</strong> Democratic Governance, ed. Pippa<br />
Norris. Ox<strong>for</strong>d: Ox<strong>for</strong>d University Press.<br />
93 Snow, Donald M. 1997. Distant Thunder. London: M.E. Sharpe, Inc.<br />
94 Wiarda, Howard J. 2004. Political Development in Emerging Nations: Is There Still a Third World?<br />
Belmont: Thomson/Wadsworth.<br />
95 Diamond, Larry. 1999. Developing Democracy: Toward Consolidation. Baltimore: The Johns Hopkins<br />
University Press.<br />
96 Newton, Kenneth. 1999. “Social and Political Trust in Established Democracies.” In Critical Citizens:<br />
Global Support <strong>for</strong> Democratic Governance, ed. Pippa Norris. Ox<strong>for</strong>d: Ox<strong>for</strong>d University Press.<br />
97 Snow, Donald M. 1997. Distant Thunder. London: M.E. Sharpe, Inc.<br />
98 Linz, Juan J. and Alfred Stepan. 1997. “Toward Consolidated Democracies.” In Consolidating <strong>the</strong><br />
Third Wave Democracies, ed. Larry Diamond. Baltimore: The Johns Hopkins University Press.<br />
99 Newton, Kenneth. 1999. “Social and Political Trust in Established Democracies.” In Critical Citizens:<br />
Global Support <strong>for</strong> Democratic Governance, ed. Pippa Norris. Ox<strong>for</strong>d: Ox<strong>for</strong>d University Press.<br />
100 Marshall, Monty G. and Keith Jaggers. 2003. Polity IV: Political Regime Characteristics and<br />
Transitions, 1800–2002. http://www.cidcm.umd.edu/inscr/polity (April 1, 2006).<br />
101 Gurr, Ted Robert. 1994. “Peoples Against States: Ethnopolitical Conflict and <strong>the</strong> Changing World<br />
System.” International Studies Quarterly 38: 347–77.<br />
102 Lichbach, Mark Irving. 1989. “An Evaluation <strong>of</strong> ‘Does Economic Inequality Breed Political Conflict?’<br />
Studies.” World Politics 41: 431–70.<br />
103 Cingranelli, David L. and David L. Richards. 1999. “Respect <strong>for</strong> Human Rights after <strong>the</strong> End <strong>of</strong> <strong>the</strong><br />
Cold War.” Journal <strong>of</strong> Peace Research 36: 511–34.<br />
104 Mitchell, Neil J. and James M. McCormick. 1988. “Economic and Political Explanations <strong>of</strong> Human<br />
Rights Violations.” World Politics 40: 476–98.<br />
105 Poe, Steven C., C. Neal Tate and Linda Camp-Keith. 1999. “Repression <strong>of</strong> <strong>the</strong> Human Right to<br />
Personal Integrity Revisited: A Global Cross-national study Covering The Years 1976–1993.”<br />
International Studies Quarterly 43: 291–313.<br />
106 Richards, David L., Ronald D. Gelleny and David H. Sacko. 2001. “Money with a Mean Streak?<br />
Foreign Economic Penetration and Government Respect <strong>for</strong> Human Rights in Developing Countries.”<br />
International Studies Quarterly 45: 219–239.<br />
107 World Bank. 2004. World Development Indicators on CD-ROM. Washington, DC: World Bank.<br />
108 Jackson, Steven, Bruce Russett, Duncan Snidal and Donald Sylvan. 1978. “Conflict and Coercion in<br />
Dependent States.” Journal <strong>of</strong> Conflict Resolution 22: 627–57.<br />
109 Lichbach, Mark Irving and Ted Robert Gurr. 1981. “The Conflict Process: A Formal Model.” Journal<br />
<strong>of</strong> Conflict Resolution 25: 3–29.<br />
110 Davis, David R. and Michael D. Ward. 1990. “They Dance Alone: Deaths and <strong>the</strong> Disappeared in<br />
Contemporary Chile.” Journal <strong>of</strong> Conflict Resolution 34: 449–75.<br />
111 Gartner, Scott Sigmund and Patrick M. Regan. 1996. “Threat and Repression: The Non- Linear<br />
Relationship Between Government and Opposition Violence.” Journal <strong>of</strong> Peace Research 33: 273–87.<br />
112 Gartner, Scott Sigmund and Patrick M. Regan. 1996. “Threat and Repression: The Non- Linear<br />
Relationship Between Government and Opposition Violence.” Journal <strong>of</strong> Peace Research 33: 273–87.<br />
113 Gartner, Scott Sigmund and Patrick M. Regan. 1996. “Threat and Repression: The Non- Linear<br />
Relationship Between Government and Opposition Violence.” Journal <strong>of</strong> Peace Research 33: 273–87.<br />
114 Banks, Arthur S. 2003. Cross-<strong>National</strong> Time-Series Data Archive. http://www.databanks.<br />
sitehosting.net (April 1, 2006).<br />
115 Cingranelli, David L. and David L. Richards. 2005. The CIRI Human Rights Dataset, Version<br />
2005.10.12. http://www.humanrightsdata.org (April 1, 2006).<br />
116 Crosby, Faye. 1976. “A Model <strong>of</strong> Egoistical Relative Deprivation.” Psychological Review 83: 85–113.<br />
70
117 Gurr, Ted Robert. 1970. Why Men Rebel. Princeton: Princeton University Press.<br />
118 Hibbs, Douglas. 1974. Industrial Conflict in Advanced Industrial Societies. Cambridge, MA: MIT<br />
Center <strong>for</strong> International Studies.<br />
119 Runciman, Walter Garrison. 1966. Relative Deprivation and Social Justice: A Study <strong>of</strong> Attitudes to<br />
Social Inequality in Twentieth Century England. Berkeley: University <strong>of</strong> Cali<strong>for</strong>nia Press.<br />
120 Stouffer et al., 1949.<br />
121 Gurr, Ted Robert. 1970. Why Men Rebel. Princeton: Princeton University Press.<br />
122 Hey, John D. and Peter J. Lambert. 1980. “Relative Deprivation and <strong>the</strong> Gini Coefficient: Comment.”<br />
The Quarterly Journal <strong>of</strong> Economics 95.3: 567–73.<br />
123 Tilly, Charles. 1978. From Mobilization to Revolution. Reading, MA: Addison-Wesley.<br />
124 Yitzhaki, Shlomo. 1979. “Relative Deprivation and <strong>the</strong> Gini Coefficient.” The Quarterly Journal <strong>of</strong><br />
Economics 93: 321–24.<br />
125 Crosby, Faye. 1979. “Relative Deprivation Revisited: A Response to Miller, Bolce, and Halligan.”<br />
American Political Science Review 73: 103–12.<br />
126 Runciman, Walter Garrison. 1966. Relative Deprivation and Social Justice: A Study <strong>of</strong> Attitudes to<br />
Social Inequality in Twentieth Century England. Berkeley: University <strong>of</strong> Cali<strong>for</strong>nia Press.<br />
127 Canache, Damarys. 1996. “Looking out My Back Door: The Neighborhood Context and Perceptions<br />
<strong>of</strong> Relative Deprivation.” Political Research Quarterly 49: 547–571.<br />
128 Lichbach, Mark Irving. 1989. “An Evaluation <strong>of</strong> ‘Does Economic Inequality Breed Political Conflict?’<br />
Studies.” World Politics 41: 431–70.<br />
129 Canache, Damarys. 1996. “Looking out My Back Door: The Neighborhood Context and Perceptions<br />
<strong>of</strong> Relative Deprivation.” Political Research Quarterly 49: 547–571.<br />
130 Davenport, Christian. 2003. “Minorities At Risk: Dataset Users Manual 030703.” The Minorities At<br />
Risk (MAR) Project. Center <strong>for</strong> International Development and Conflict Management. University <strong>of</strong><br />
Maryland, Baltimore. http://www.cidcm.umd.edu/inscr/mar/margene/MAR-codebook_040903.doc<br />
(April 1, 2006).<br />
131 Gurr, Ted Robert. 2000. Peoples Versus States: Minorities at Risk in <strong>the</strong> New Century. Washington,<br />
DC: United States Institute <strong>of</strong> Peace Press.<br />
132 Hey, John D. and Peter J. Lambert. 1980. “Relative Deprivation and <strong>the</strong> Gini Coefficient: Comment.”<br />
The Quarterly Journal <strong>of</strong> Economics 95.3: 567–73.<br />
133 Lichbach, Mark Irving. 1989. “An Evaluation <strong>of</strong> ‘Does Economic Inequality Breed Political Conflict?’<br />
Studies.” World Politics 41: 431–70.<br />
134 Yitzhaki, Shlomo. 1979. “Relative Deprivation and <strong>the</strong> Gini Coefficient.” The Quarterly Journal <strong>of</strong><br />
Economics 93: 321–24.<br />
135 World Bank. 2004. World Development Indicators on CD-ROM. Washington, DC: World Bank.<br />
136 Davenport, Christian. 2003. “Minorities At Risk: Dataset Users Manual 030703.” The Minorities At<br />
Risk (MAR) Project. Center <strong>for</strong> International Development and Conflict Management. University <strong>of</strong><br />
Maryland, Baltimore. http://www.cidcm.umd.edu/inscr/mar/margene/MAR-codebook_040903.doc<br />
(April 1, 2006).<br />
137 Davenport, Christian. 2003. “Minorities At Risk: Dataset Users Manual 030703.” The Minorities At<br />
Risk (MAR) Project. Center <strong>for</strong> International Development and Conflict Management. University <strong>of</strong><br />
Maryland, Baltimore. http://www.cidcm.umd.edu/inscr/mar/margene/MAR-codebook_040903.doc<br />
(April 1, 2006).<br />
138 Horton, Nicholas J. and Stuart R. Lipsitz. 1999. “Review <strong>of</strong> S<strong>of</strong>tware to Fit Generalized Estimating<br />
Equation Regression Models.” The American Statistician 53: 160–69.<br />
139 Zorn, Christopher J. W. 2001. “Generalized Estimating Equation Models <strong>for</strong> Correlated Data: A<br />
Review with Applications.” American Journal <strong>of</strong> Political Science 45: 470– 90.<br />
140 Friedrich, Robert J. 1982. “In Defense <strong>of</strong> Multiplicative Terms in Multiple Regression Equations.”<br />
American Journal <strong>of</strong> Political Science 26: 797–833.<br />
71
141 Jaccard, James, Robert Turrisi and Choi K. Wan. 1990. Interaction Effects in Multiple Regression.<br />
Newbury Park, Cali<strong>for</strong>nia: Sage Publications.<br />
142<br />
Gartner, Scott Sigmund and Patrick M. Regan. 1996. “Threat and Repression: The Non-<br />
Linear Relationship Between Government and Opposition Violence.” Journal <strong>of</strong> Peace<br />
Research 33: 273–87.<br />
72
2.2.B.<br />
Economics and Political Instability within <strong>the</strong> Global Economic Crisis<br />
(Peter Steen)<br />
Author and Organization: Peter Steen, Analytic Services, Inc., in support <strong>of</strong> <strong>the</strong> Deputy<br />
Directorate <strong>for</strong> Strategy and Policy, Joint Staff<br />
Contact In<strong>for</strong>mation: steenpm@js.pentagon.mil; peter.steen@anser.org<br />
Introduction<br />
This paper provides an overview <strong>of</strong> work completed at <strong>the</strong> Joint Staff J-5, seeking to provide a<br />
strategic, national-level understanding on <strong>the</strong> interplay between economics and political<br />
instability within <strong>the</strong> context <strong>of</strong> <strong>the</strong> ongoing Global Economic Crisis. The paper begins with key<br />
definitions. From that baseline, a brief discussion <strong>of</strong> methods provides insight into how <strong>the</strong> Joint<br />
Staff arrived at a variety <strong>of</strong> conclusions. Conclusions are delineated based on completed analysis.<br />
The next section delineates a model <strong>for</strong> linking economics with national security. The paper ends<br />
with a brief discussion <strong>of</strong> future analysis.<br />
Grounds <strong>for</strong> Analysis and Definitions<br />
The Deputy Directorate <strong>for</strong> Strategy and Policy at <strong>the</strong> Joint Staff drafts key strategy and policy<br />
documents <strong>for</strong> <strong>the</strong> Chairman. In order to accomplish this, an encompassing and inclusive<br />
understanding <strong>of</strong> <strong>the</strong> context within which military strategy and policy operates must be<br />
maintained. As Lehman Bro<strong>the</strong>rs failed in late 2008, it became clear that <strong>the</strong> economic context<br />
within which <strong>the</strong> U.S. military operates was undergoing fundamental turmoil. What would that<br />
turmoil mean to <strong>the</strong> U.S. military? It was necessary to define <strong>the</strong> most important aspect <strong>of</strong> <strong>the</strong><br />
problems be<strong>for</strong>e <strong>the</strong>y could be investigated and <strong>the</strong>ir significance to <strong>the</strong> military could be<br />
determined.<br />
Definitions<br />
There were several key aspects <strong>of</strong> this ef<strong>for</strong>t: economics, political instability, U.S. national<br />
security, and <strong>the</strong> global economic crisis.<br />
Economics encompasses <strong>the</strong> creation, exchange and non-authoritative distribution <strong>of</strong> value<br />
within a society. This definition includes <strong>the</strong> production and trade <strong>of</strong> goods (material or nonmaterial)<br />
and services, as well as <strong>the</strong> distribution <strong>of</strong> income based, at least in part, on that<br />
production.<br />
Global Economic Crisis is <strong>the</strong> drop in global production, trade, and financial flows, as well as<br />
<strong>the</strong> turmoil in financial markets that has been called <strong>the</strong> “Great Recession.” The fall <strong>of</strong> Lehman<br />
Bro<strong>the</strong>rs has been pointed to as <strong>the</strong> culmination <strong>of</strong> behind-<strong>the</strong>-scenes trends that led to <strong>the</strong> drastic<br />
financial turmoil and economic negative growth characterizing <strong>the</strong> last quarter <strong>of</strong> 2008 and <strong>the</strong><br />
first quarter <strong>of</strong> 2009.<br />
Political instability describes unexpected change in <strong>the</strong> society’s system <strong>of</strong> authoritative<br />
allocation <strong>of</strong> value. This general definition can be clarified through <strong>the</strong> identification <strong>of</strong> two<br />
types <strong>of</strong> political instability. Type 1 is unexpected changes in <strong>the</strong> political system that occur<br />
within and do not result in changes to <strong>the</strong> rule set <strong>of</strong> <strong>the</strong> political system. Type 2 is unexpected<br />
change that occurs outside <strong>of</strong> <strong>the</strong> rule set or legal framework, <strong>of</strong>ten this is extra-legal, usually,<br />
violent, political change.<br />
73
U.S. national security is defined as accomplishing <strong>the</strong> goals articulated within <strong>the</strong> U.S. <strong>National</strong><br />
Security Strategy.<br />
Methods<br />
The Deputy Directorate <strong>for</strong> Strategy and Policy within <strong>the</strong> Joint Staff has significant background<br />
knowledge and data in quantitative and qualitative research. The objective was to (1) ga<strong>the</strong>r<br />
in<strong>for</strong>mation on what books/experts said about <strong>the</strong> driving question above, (2) empirically test<br />
<strong>the</strong>se assertions, and (3) ground findings in empirical analysis.<br />
A “mixed methods” research agenda was implemented <strong>for</strong> this ef<strong>for</strong>t. First, experts and key<br />
<strong>the</strong>oretical propositions within <strong>the</strong> relevant literature were identified. Second, statistical analyses<br />
were conducted, including <strong>the</strong> adoption <strong>of</strong> both hypo<strong>the</strong>sis testing and exploratory data analysis<br />
approaches. Third, experts were interviewed. Fourth, fur<strong>the</strong>r statistical analyses were conducted.<br />
Economics and Political Instability<br />
First, <strong>the</strong> Political Instability Task Force (PITF) provided key assistance. Goldstone et al (2005)<br />
measured political instability as one or more <strong>of</strong> one <strong>of</strong> <strong>the</strong> following instances <strong>of</strong> state failure:<br />
“Revolutionary Wars, Ethnic Wars, Adversary Regime Changes, and Genocides and<br />
Politicides.” 1 The PITF tested hundreds <strong>of</strong> economic variables against this very strict definition<br />
<strong>of</strong> political instability and found “most economic, demographic, geographic, and political<br />
variables do not have consistent and statistically significant effects on <strong>the</strong> risk <strong>of</strong> instability<br />
onset.” Infant mortality was found to be a predictor <strong>of</strong> <strong>the</strong> onset <strong>of</strong> political instability 2 years<br />
out. No o<strong>the</strong>r economic variable was found to be a useful predictor <strong>of</strong> political instability.<br />
Second, we went “back to <strong>the</strong> drawing board.” Strategy and Policy leadership changed its focus<br />
away from explaining <strong>the</strong> onset <strong>of</strong> instability toward uncovering <strong>the</strong> potential <strong>for</strong> political<br />
instability. There<strong>for</strong>e, <strong>the</strong> research agenda changed to index creation. The agenda was simple:<br />
review <strong>the</strong> literature and identify candidate measures that could be used to identify <strong>the</strong> potential<br />
<strong>for</strong> political instability. This loose, exploratory data analysis agenda allowed <strong>for</strong> <strong>the</strong><br />
identification <strong>of</strong> over 90 variables, over half <strong>of</strong> which were economic. These variables were <strong>the</strong>n<br />
logistically regressed against <strong>the</strong> countries’ PITF scores (0 or 1) four years into <strong>the</strong> future. Our<br />
goal was to have a useful tool <strong>for</strong> assessing <strong>the</strong> potential <strong>for</strong> political instability. This had to be<br />
balanced against practical, statistical considerations, all <strong>of</strong> which resulted in <strong>the</strong> 4-year time<br />
frame <strong>of</strong> this work. No economic measures were found to be significant in predicting <strong>the</strong> PITF<br />
score. The initial statistical ef<strong>for</strong>ts yielded a fundamental finding: <strong>the</strong>re was no statistical support<br />
<strong>for</strong> <strong>the</strong> assertion that economic measures can <strong>for</strong>ecast political instability four years from <strong>the</strong> date<br />
<strong>of</strong> measurement. (For example, no economic measure in 2001 could be found to <strong>for</strong>ecast political<br />
instability in 2005). The statistical analysis revealed that <strong>the</strong> World Governance Indicators<br />
(WGIs) were predictors. 2 An index was constructed using <strong>the</strong> WGIs.<br />
Third, a meeting was held with Dr. Jack Goldstone and o<strong>the</strong>rs in an ef<strong>for</strong>t to get a richer<br />
understanding as to <strong>the</strong> nature <strong>of</strong> political instability. 3 These interviews resulted in a new<br />
conceptualization <strong>of</strong> political instability as described above: Type 1 (unexpected, peaceful<br />
change within <strong>the</strong> system), and Type 2 (unexpected and violent change to <strong>the</strong> system), as<br />
described above in <strong>the</strong> “Definitions” section. With that new conceptualization in mind, we<br />
returned to <strong>the</strong> statistics.<br />
Fourth, <strong>the</strong> research approach turned back to statistical analysis. Could empirical support be<br />
found <strong>for</strong> <strong>the</strong> assertion that economic variables explain changes in <strong>the</strong> different types <strong>of</strong> political<br />
74
instability? The dependent variable had been changed. Be<strong>for</strong>e, <strong>the</strong> PITF dichotomous measure<br />
<strong>of</strong>fered no gradation in instability. In order to operationalize <strong>the</strong> new two-type concept <strong>of</strong><br />
political instability discussed above, statistical analysis was modified to include three values <strong>for</strong><br />
every country <strong>of</strong> <strong>the</strong> world. Countries could be highly unstable as measured by <strong>the</strong> PITF data,<br />
countries could be unstable as measured by an irregular regime change in <strong>the</strong> Archigos Dataset 4<br />
or non-violent “campaign,” 5 or countries could be stable (by not being in ei<strong>the</strong>r <strong>of</strong> <strong>the</strong> first two<br />
categories). Leveraging <strong>the</strong> previous work, because <strong>of</strong> time constraints and data availability,<br />
research focused on 11 possible economic predictors <strong>of</strong> political instability:<br />
Commercial openness Agricultural exports<br />
GDP per capita Oil imports<br />
Inflation Oil exports<br />
Foreign direct investment Metal exports<br />
Infant mortality Diversification<br />
Agricultural imports<br />
Preliminary findings were that only infant mortality and commercial openness were significant<br />
predictors <strong>of</strong> <strong>the</strong> new operationalization <strong>of</strong> political instability four years out.<br />
The four research steps involved a variety <strong>of</strong> qualitative and quantitative analyses. In this<br />
analysis, infant mortality, as well as commercial openness, can be used to <strong>for</strong>ecast <strong>the</strong> likelihood<br />
<strong>of</strong> political instability four years from <strong>the</strong> date <strong>of</strong> measurement. As infant mortality improves,<br />
data indicate that <strong>the</strong> likelihood <strong>of</strong> political instability to declines. As commercial openness<br />
improves, data indicate that <strong>the</strong> likelihood <strong>of</strong> political instability declines. These findings were<br />
based on correlation; <strong>the</strong> analysis could be <strong>the</strong> basis <strong>for</strong> fur<strong>the</strong>r study that could identify<br />
causation.<br />
Economics and U.S. <strong>National</strong> Security<br />
The current 2006 <strong>National</strong> Security Strategy (NSS) 6 states <strong>the</strong> following: “Promoting free and<br />
fair trade has long been a bedrock tenet <strong>of</strong> American <strong>for</strong>eign policy. Greater economic freedom<br />
is ultimately inseparable from political liberty.” It calls <strong>for</strong> several initiatives relating to<br />
economics: (1) “opening markets and integrating developing countries,” (2) “opening,<br />
integrating, and diversifying energy markets to ensure energy independence,” (3) “Re<strong>for</strong>ming <strong>the</strong><br />
International Financial System to ensure Stability and Growth.” Even be<strong>for</strong>e <strong>the</strong> economic crisis<br />
that became so evident in late 2008, U.S. national security included an economic aspect.<br />
As <strong>the</strong> economic crisis developed, senior leaders stated <strong>the</strong> importance <strong>of</strong> <strong>the</strong> economic crisis in<br />
disrupting <strong>the</strong> context within which U.S. national security is executed. 7 How might <strong>the</strong> economic<br />
crisis actually affect U.S. national security, beyond impacting <strong>the</strong> above initiatives?<br />
Various groups within and outside <strong>the</strong> Defense Department were convened in order to properly<br />
answer this question. The figure shown below was developed to delineate <strong>the</strong> ways in which<br />
economic instability could affect U.S. national security.<br />
75
Linkages: Economics to U.S. <strong>National</strong> Security<br />
Domestic<br />
International<br />
DoD<br />
Budget<br />
Defense<br />
Industrial Base<br />
Political<br />
Instability<br />
Key<br />
Partners<br />
Global<br />
Systems<br />
Figure 2.2.B-1. Economic Instability’s Impact on U.S. <strong>National</strong> Security.<br />
This model illustrates <strong>the</strong> relationships between economic and political instability. Economics<br />
can be traced through a variety <strong>of</strong> avenues <strong>of</strong> effect on U.S. national security. The political<br />
instability box depicts <strong>the</strong> proposition that political instability could lead to changes in countries<br />
that were friends and allies <strong>of</strong> <strong>the</strong> U.S. Such an unexpected change could hinder or even counter<br />
accomplishment <strong>of</strong> <strong>the</strong> NSS objectives. Conversely, political instability in a country that is<br />
currently hindering or countering accomplishment <strong>of</strong> NSS objectives could be a positive. Ei<strong>the</strong>r<br />
way, political instability matters from a national security perspective. The left side <strong>of</strong> Figure<br />
2.2.B-1 shows <strong>the</strong> domestic avenues <strong>of</strong> effect. Shrinking GDP indicates shrinking tax bases and<br />
increased difficulty in non-deficit financing <strong>of</strong> defense. As <strong>the</strong> Defense Industrial Base is<br />
integrated into <strong>the</strong> greater economy, and as <strong>the</strong> greater economy suffers, suppliers and o<strong>the</strong>r<br />
firms that are important players in defense may be hurt or even rendered insolvent due to <strong>the</strong><br />
market shocks outside <strong>of</strong> defense.<br />
The international avenue <strong>of</strong> effect has at least three lanes. Political instability has already been<br />
discussed. Changing economic <strong>for</strong>tunes can affect <strong>the</strong> wills and/or capabilities <strong>of</strong> key<br />
international partners to carry out operations in support <strong>of</strong> shared objectives. Finally (this is <strong>the</strong><br />
least developed <strong>of</strong> <strong>the</strong> lanes) global systems were considered. Economics affect <strong>the</strong> systems<br />
within which international interactions occur. For example, economic strength can be articulated<br />
through institutions such as <strong>the</strong> International Monetary Fund (IMF). As economic strength is<br />
redistributed, demands grow to change <strong>the</strong> IMF’s governance to reflect <strong>the</strong> new realities.<br />
Future Analysis<br />
This paper describes <strong>the</strong> ground covered by <strong>the</strong> Joint Staff J-5 Deputy Directorate <strong>for</strong> Strategy<br />
and Policy, as it explored <strong>the</strong> relationship between economics and political instability. The Joint<br />
Staff discovered a variety <strong>of</strong> players who provided key insight into <strong>the</strong> question. The most<br />
important player in this field is clearly <strong>the</strong> Political Instability Task Force (PITF), which<br />
provided very useful data and analyses <strong>for</strong> policy and strategy development that were key to our<br />
analysis.<br />
The way <strong>for</strong>ward is to move out on two tracks. First, different techniques must be examined and<br />
tested to uncover possible relationships between economics and political instability. This area <strong>of</strong><br />
work encompasses two main ef<strong>for</strong>ts: research <strong>of</strong> <strong>the</strong> modeling <strong>of</strong> economic volatility (ra<strong>the</strong>r than<br />
static economic measures) and political instability, (2) research <strong>of</strong> more current measures <strong>of</strong><br />
economics. Un<strong>for</strong>tunately, <strong>the</strong> standard measures <strong>of</strong> economy, such as GDP per capita, are<br />
released well after <strong>the</strong> year in question. Very <strong>of</strong>ten data are already two years’ old when <strong>the</strong>y are<br />
finalized (2006 data becoming available in 2008). This makes <strong>the</strong> data “vintage” and inhibits<br />
76
<strong>for</strong>ecasting. Investigations are being conducted to determine what economic data might be<br />
available that are less “vintage” to allow <strong>for</strong> better <strong>for</strong>ecasting.<br />
Second, <strong>the</strong> concept <strong>of</strong> political instability must be differentiated into a more nuanced variable<br />
showing “shades <strong>of</strong> gray.” Dichotomous measures <strong>of</strong> political instability <strong>of</strong>fer very useful<br />
insights into state failure, but <strong>the</strong>y inhibit identification <strong>of</strong> political stability trends within <strong>the</strong><br />
“stable” and “unstable” categories. Methods are being reviewed <strong>for</strong> index creation, and <strong>the</strong><br />
underlying dynamics within this complex concept <strong>of</strong> political instability are being examined. As<br />
<strong>the</strong> conceptualization changes to reflect <strong>the</strong> requirements <strong>of</strong> Joint Staff strategy and policy<br />
development, <strong>the</strong> operationalization will inevitably alter, as well.<br />
This paper reports on nearly a year <strong>of</strong> work at <strong>the</strong> Joint Staff, attempting to in<strong>for</strong>m military<br />
strategy and policy development through systematic analysis <strong>of</strong> <strong>the</strong> relationship between<br />
economics and political instability. This first year was <strong>the</strong> first step in a long journey. Lessons<br />
and insights from <strong>the</strong> o<strong>the</strong>r authors in this volume will be key in keeping <strong>the</strong> Joint Staff in<strong>for</strong>med<br />
as development and revision <strong>of</strong> national level strategy and policy continue.<br />
↑ Back to <strong>the</strong> top<br />
1 Goldstone, Jack, Robert Bates, Ted Robert Gurr, Michael Lustik, Monty Marshall, Jay Ulfelder, and<br />
Mark Woodward. “A Global Forecasting Model <strong>of</strong> Political Instability.” APSA Paper, 2005.<br />
2 http://info.worldbank.org/governance/wgi/pdf/wgidataset.xls.<br />
3 SDD interviewed over 20 experts. Particularly important were <strong>the</strong> 10 March 2009 interview <strong>of</strong> Jack<br />
Goldstone (George Mason), <strong>the</strong> 23 March 2009 interview <strong>of</strong> Joe Hewitt (U <strong>of</strong> MD), multiple thinkers at<br />
<strong>the</strong> Center <strong>for</strong> a New America Security 9 October 2008, and multiple sessions with <strong>the</strong> Defense<br />
Business Board.<br />
4 Gleditsch, Kristian. “Archigos: A New Database <strong>of</strong> Political Leaders.” Paper presented at <strong>the</strong> annual<br />
meeting <strong>of</strong> <strong>the</strong> International Studies Association, Hilton Hawaiian Village, Honolulu, Hawaii, Mar 05,<br />
2005. 2009-05-26 (http://www.allacademic.com/meta/p71997_index.html).<br />
5 Chenoweth, Erica and Maria Stephan. 2008. “Why Civil Resistance Works: <strong>the</strong> Strategic Logic <strong>of</strong><br />
Nonviolent Conflict,” International Security 33(1). (http://echenoweth.faculty.wesleyan.edu/researchand-data/).<br />
6 http://georgewbush-whitehouse.archives.gov/nsc/nss/2006/.<br />
7 CNN quotes Dennis Blair speaking to Congress: “The primary near-term security concern <strong>of</strong> <strong>the</strong> United<br />
States is <strong>the</strong> global economic crisis and its geopolitical implications.”<br />
77
2.3. Water<br />
2.3.A. Water and Security: Cause War or Help Community Building? (Jerome<br />
Delli Priscoli)<br />
Author and Organization: Dr. Jerome Delli Priscoli, Senior Advisor, IWR –USACE, Governor <strong>of</strong><br />
WWC, Editor in Chief, Water Policy: Institute <strong>for</strong> Water Resources, U.S. Army<br />
Corps <strong>of</strong> Engineer<br />
Contact In<strong>for</strong>mation: Jerome.DelliPriscoli@usace.army.mil; priscoli@erols.com<br />
Introduction<br />
Our news has been filled with statements like “water as <strong>the</strong> next oil,” “water wars,” and “water<br />
as <strong>the</strong> liquid <strong>of</strong> <strong>the</strong> 21 st century.” For example:<br />
“The only matter that could take Egypt to war again is water.”(Anwar Saddat, 1979)<br />
“The next war in <strong>the</strong> Middle East will be fought over water, not politics.”(Boutros<br />
Boutros Ghali, 1985)<br />
“The wars <strong>of</strong> <strong>the</strong> next century will be about water.”(Ismail Seageldin, VP World Bank,<br />
1995)<br />
But are <strong>the</strong>se remarks more misleading than illuminating? In 1995, <strong>the</strong> Israeli Defense Forces<br />
analyst responsible <strong>for</strong> long-term planning during <strong>the</strong> 1982 invasion <strong>of</strong> Lebanon noted <strong>the</strong><br />
following:<br />
Why go to war over water? For <strong>the</strong> price <strong>of</strong> one week's fighting, you could build five<br />
desalination plants. No loss <strong>of</strong> life, no international pressure, and a reliable supply you<br />
don’t have to defend in hostile territory. 1<br />
Even some <strong>of</strong> <strong>the</strong> commentators <strong>the</strong>mselves seem to be changing. For example:<br />
“Fierce competition <strong>for</strong> fresh water may well become a source <strong>of</strong> conflict and wars in <strong>the</strong><br />
future.”(K<strong>of</strong>i Annan, March 2001).<br />
“But <strong>the</strong> water problems <strong>of</strong> our world need not be only a cause <strong>of</strong> tension; <strong>the</strong>y can also<br />
be a catalyst <strong>for</strong> cooperation...If we work toge<strong>the</strong>r, a secure and sustainable water future<br />
can be ours.”(K<strong>of</strong>i Annan, January 2002).<br />
If one sees water as a resource to be fought over in terms <strong>of</strong> allocations <strong>of</strong> limited flows, as many<br />
in our security community now seem to, it is easy to come to <strong>the</strong> conclusion that water wars will<br />
result. However, <strong>the</strong> history <strong>of</strong> water resource management’s role in <strong>the</strong> development <strong>of</strong><br />
civilizations has been very different, especially at <strong>the</strong> macro social levels. That history <strong>of</strong> water<br />
resource management has been one <strong>of</strong> learning (albeit <strong>of</strong>ten painfully) to jointly create and share<br />
benefits beyond <strong>the</strong> river through use <strong>of</strong> water.<br />
Oregon State University (OSU) data indicate that <strong>for</strong> 1,831conflicting and cooperative water<br />
interactions over <strong>the</strong> last fifty years, 7 disputes involved violence, 507 conflictive events have<br />
occurred, 200 were treaties signed, and <strong>the</strong>re were 1,228 cooperative events.<br />
78
Fifty years <strong>of</strong> 1,831conflicting and cooperative interactions over <strong>the</strong> last fifty years.<br />
- 7 disputes involved violence; 507 conflictive events have occurred<br />
- 200 treaties signed;1,228 cooperative events.<br />
Figure 2.3.A-1. Water Vector <strong>of</strong> Cooperation vs. Source <strong>of</strong> Conflict. 2<br />
Strategic arguments do not point to water as cause <strong>of</strong> war. There are rich shared interests around<br />
water. Institutions can be developed so that <strong>the</strong>y are resilient and can change with new needs.<br />
Economically, it makes little sense to fight over water, and <strong>the</strong>re are increasing trends toward<br />
cooperative behavior, as noted below. 3<br />
• Technical in<strong>for</strong>mation beginning to bond vs.. separate<br />
• Price <strong>for</strong> control over river = cooperation<br />
• Opportunity costs <strong>for</strong> not cooperating growing<br />
• New actors/new claims that cross jurisdictions<br />
• Austerity requires multipliers<br />
• Events <strong>of</strong> 1990’s in world water community<br />
• Science showing cooperation as root to evolution and<br />
security<br />
• Functional and second track diplomacy<br />
• Accept facilitator vs.. expert dictator role<br />
• Technologies now cheap and facilitative<br />
• O<strong>the</strong>rs<br />
Figure 2.3.A-2. Trends toward Cooperation.<br />
79
There are, however, river basins at risk, especially if <strong>the</strong>y are left unattended with poor water<br />
management. Forty percent <strong>of</strong> <strong>the</strong> world’s population lives on shared basins, which comprise<br />
more than 50% <strong>of</strong> <strong>the</strong> Earth’s landmass. The OSU database identifies 16 basins at risk, including<br />
51 nations on five continents, 8 <strong>of</strong> which are in Africa, and 6 <strong>of</strong> which are in Asia.<br />
Figure 2.3.A-3. Water Stress Level <strong>of</strong> Major River Basins, around 2002. 4<br />
The likelihood <strong>of</strong> conflict in basins rises as <strong>the</strong> rate <strong>of</strong> change within <strong>the</strong> basin exceeds <strong>the</strong><br />
institutional capacity to absorb that change. The basin characteristics which enhance resilience to<br />
change include <strong>the</strong> following:<br />
International and intra-state, cross-jurisdictional agreements and institutions (e.g.,<br />
River Basin Organizations) 5<br />
A history <strong>of</strong> collaborative projects<br />
Generally positive political relations<br />
Higher levels <strong>of</strong> economic development<br />
The basin characteristics which indicate vulnerability include <strong>the</strong> following:<br />
Rapid environmental change<br />
Rapid population growth or asymmetric economic growth<br />
Major unilateral development projects<br />
The absence <strong>of</strong> institutional and/or organizational capacity<br />
Generally hostile relations<br />
The world’s renewable freshwater is in lakes, surface run<strong>of</strong>f and in groundwater and equals<br />
40,000 cubic kilometers available/year; 10% is withdrawn, 5% is consumed, and <strong>the</strong> remainder<br />
goes to stream and aquifers. 6 The key problems are (1) managing <strong>the</strong> time and place <strong>of</strong> water,<br />
(2) managing uncertainty, and (3) aligning people with water. A large portion <strong>of</strong> water is located<br />
where <strong>the</strong>re are no people, in areas such as <strong>the</strong> Amazon, Canada, and Alaska. Security issues<br />
arise in cases where a large portion <strong>of</strong> water arrives where people live in very short periods <strong>of</strong><br />
time (e.g., in Asia, more <strong>the</strong> 2/3 <strong>of</strong> people live in areas where 80% rainfall arrives in 25% /year) 7 .<br />
A large portion <strong>of</strong> <strong>the</strong> remainder <strong>of</strong> water is degraded, and a high portion <strong>of</strong> available water is<br />
used (e.g., in arid areas that is 90%++). Overall, <strong>the</strong> patterns <strong>of</strong> water use are roughly 70% <strong>for</strong><br />
agriculture, 20% <strong>for</strong> industry, and 10% <strong>for</strong> municipal. 8 Most <strong>of</strong> <strong>the</strong> world is struggling to<br />
80
determine how to realign <strong>the</strong>se uses to fit our changing needs that stem from changing<br />
demographics.<br />
The water crisis is mainly one <strong>of</strong> distribution <strong>of</strong> water, knowledge, and resources and is not one<br />
<strong>of</strong> absolute scarcity. However, <strong>the</strong> water and security debate is driven by our notions <strong>of</strong> scarcity.<br />
Water is rarely <strong>the</strong> cause <strong>of</strong> war or large-scale social violence. However, such focus dominates<br />
<strong>the</strong> security and water debates.<br />
Consequently, <strong>the</strong> most salient aspects <strong>of</strong> water are <strong>of</strong>ten passed over in <strong>the</strong> debate, including <strong>the</strong><br />
water’s powerful role in <strong>the</strong> following:<br />
Building <strong>the</strong> social community<br />
Generating wealth through established preconditions <strong>of</strong> economic activities<br />
Convening adversaries and providing common language <strong>for</strong> joint and creative dialogue<br />
<br />
<br />
Practically integrating diverse interests and values<br />
Providing a principle tool <strong>for</strong> preventive diplomacy and <strong>for</strong> building cultures <strong>of</strong><br />
cooperation, if not peace<br />
Strategy: Using <strong>the</strong> “Small s” Water Actions, to Achieve <strong>the</strong> Ends <strong>of</strong> <strong>the</strong> “Big S,” Security<br />
War and large-scale violence are what we might call <strong>the</strong> “Big S security” or <strong>the</strong> traditional<br />
concerns <strong>of</strong> <strong>the</strong> security community. Within this framework, water is seen as independent<br />
variable, <strong>the</strong> lack <strong>of</strong> which can be seen as a cause <strong>of</strong> war, a tool <strong>of</strong> war, a trigger <strong>for</strong> large social<br />
violence, and as a cause <strong>of</strong> eco-shocks leading to social unrest.<br />
Our English dictionaries define security as, “freedom from danger, from fear or anxiety, from<br />
want or deprivation.” Security is <strong>the</strong> basis <strong>of</strong> humanity’s historical management <strong>of</strong> water, <strong>of</strong><br />
taking measures (1) to assure that we have good water in <strong>the</strong> right quantity at <strong>the</strong> proper time and<br />
place, (2) to predict floods, (3) to impound water <strong>for</strong> droughts, and (4) to use water to help us<br />
generate wealth and avoid deprivation. This is what we might call <strong>the</strong> “small s security.” Within<br />
this framework, water is seen more as a means to achieving important social ends. This “small s<br />
security” framework is <strong>the</strong> key to understanding water and its role in civilizations and to see how<br />
water relates to today’s security issues.<br />
Early humans in ancient Mesopotamia, China, Egypt, and o<strong>the</strong>r parts <strong>of</strong> <strong>the</strong> world sought to<br />
predict floods and droughts and to manage such events and <strong>the</strong>ir potential impacts on people.<br />
Herodotus ascribes <strong>the</strong> beginning <strong>of</strong> geometry in ancient Egypt to trying to predict floods. As<br />
humans focused on water <strong>the</strong>y worked to create irrigation systems and o<strong>the</strong>r water works. These<br />
water actions effectively helped humans to adapt to <strong>the</strong> uncertainties <strong>of</strong> nature. In so doing, <strong>the</strong>y<br />
reduced <strong>the</strong>ir fear and anxieties about <strong>the</strong>se exigencies <strong>of</strong> nature. They changed from <strong>the</strong> fatalism<br />
<strong>of</strong> being victims to a sense <strong>of</strong> creating and molding <strong>the</strong>ir societies. As Jacob Bronowski notes in<br />
<strong>the</strong> beginning <strong>of</strong> his Ascent <strong>of</strong> Man, “humans are not just <strong>the</strong> perfectly adapted one cell being,<br />
<strong>the</strong>y have made <strong>the</strong>ir home.” This illustrates how “small s security” water actions are effective<br />
adaptive behavior.<br />
To <strong>the</strong> degree that humans have enhanced <strong>the</strong>ir personal sense <strong>of</strong> security and reduced internal<br />
fears from <strong>the</strong> fatalism <strong>of</strong> droughts and floods, <strong>the</strong>y began to create. They invented languages,<br />
<strong>the</strong>y freed up time to invest in developing tools and systems, and <strong>the</strong>y started to create and mold<br />
<strong>the</strong>ir homes. The definition <strong>of</strong> security as freedom from fear anxiety, want and deprivation, has<br />
been enhanced. All rich civilizations have invested <strong>the</strong>ir social capital in actions to help achieve<br />
<strong>the</strong> sense <strong>of</strong> managing such uncertainties as a precursor to growth and prosperity. When such<br />
81
ef<strong>for</strong>ts deteriorated, so too did societies, and <strong>the</strong> same is true today, as evidenced in poor African<br />
countries.<br />
The notion that <strong>the</strong> lack <strong>of</strong> water can cause war should be reconsidered. Ra<strong>the</strong>r than considering<br />
how water distributions or flows might lead to war, we should identify strategic regions and ask<br />
how investment in water resources management and investments (as a means) might help<br />
achieve strategic ends to ensuring <strong>the</strong> availability <strong>of</strong> water. This approach allows <strong>for</strong> water<br />
investment to serve as a means to achieving security ra<strong>the</strong>r than as an end itself that drives<br />
security. Water actions are key societal adaption tools. Investments in <strong>the</strong> “small s” become<br />
critical to enhancing and ensuring <strong>the</strong> “large S.” How does this work? Figure 3.3.A-4 illustrates<br />
<strong>the</strong> process.<br />
Theory: Water Actions as Key Societal<br />
Adaptation Tools<br />
Investment in Water Infrastructure, Integrated Water<br />
Water Resources Management, Flood Management<br />
Water Security (small s)<br />
Minimum Plat<strong>for</strong>m <strong>for</strong> Growth<br />
Internal Stability<br />
and Security (large S)<br />
Strategic<br />
Security<br />
Figure 2.3.A-4. Water Actions as Key Societal Adaptation Tools.<br />
The climate change environmental shocks projected to impact society are primarily water related<br />
(e.g.,) droughts, floods, tsunamis, and rising sea-levels. This puts projections <strong>of</strong> <strong>the</strong>se<br />
environmental shocks and ways to deal with <strong>the</strong>m in <strong>the</strong> historical purview <strong>of</strong> water resource<br />
management. Both behavioral and hard infrastructure water actions are prime societal means to<br />
adapt to and manage <strong>the</strong> uncertainties <strong>of</strong> change. Ra<strong>the</strong>r than longer term mitigation measures,<br />
<strong>the</strong>se more immediate adaptations are <strong>the</strong> keys to social resilience and thus keys to achieving <strong>the</strong><br />
small “s” <strong>of</strong> security. To <strong>the</strong> degree that <strong>the</strong>y achieve stability, <strong>the</strong>y contribute to larger sense <strong>of</strong><br />
security through a reduced sense <strong>of</strong> vulnerability, <strong>the</strong>re<strong>for</strong>e contributing to <strong>the</strong> “large s” security.<br />
82
EQ Shocks<br />
Societal Impacts/<br />
Reactions<br />
Security<br />
Types <strong>of</strong> Shocks<br />
Floods<br />
Droughts<br />
Sea Level Rise<br />
Water Actions<br />
Key Adaptation<br />
Tools <strong>for</strong><br />
Societies<br />
Social Resilience:<br />
Adaptation Means<br />
Hard & S<strong>of</strong>t Tools to<br />
absorb shocks<br />
Key Societal Adaptation Tool:<br />
Capacity to Manage Uncertainty<br />
Variability<br />
Flatten Hydrographs<br />
Water Infrastructure<br />
Consequences<br />
Stability/Absorption<br />
Violence<br />
Revolution<br />
Disruption<br />
Deprivations<br />
O<strong>the</strong>rs<br />
Figure 2.3.A-5. Environment/Water Actions as Adaptation Tools and Keys to Societal<br />
Security/Stability.<br />
Water and Security Today<br />
The gross domestic products (GDPs) <strong>of</strong> Zimbabwe, Ethiopia, Kenya and Mozambique all seem<br />
to vary with rainfall. In fact, <strong>the</strong> variations in GDP due to <strong>the</strong> inability to deal with variations in<br />
rainfall (<strong>the</strong> peaks and valleys<br />
<strong>of</strong> <strong>the</strong> hydrograph or <strong>of</strong> floods<br />
Economy-wide impacts<br />
and droughts) might account<br />
15.0<br />
3.0<br />
2.0<br />
<strong>for</strong> almost 25% <strong>of</strong> variations<br />
10.0<br />
1.0<br />
in <strong>the</strong>se countries’ GDPs.<br />
5.0<br />
0.0<br />
-1.0<br />
0.0<br />
Societies that do not work to<br />
-2.0<br />
-5.0<br />
attenuate <strong>the</strong> impact <strong>of</strong> flood<br />
Real GDP grow th (%)<br />
-3.0<br />
Variability in Rainfall (Meter)<br />
-10.0<br />
-4.0 and drought occurrences have<br />
Years<br />
Rainfall & GDP growth: Zimbabwe 1978-1993<br />
little chance to develop, and<br />
<strong>of</strong>ten become fatalistic,<br />
80<br />
25<br />
20<br />
60<br />
accepting and actually coming<br />
15<br />
40<br />
10<br />
20<br />
5<br />
to accept <strong>the</strong> fate <strong>of</strong> being<br />
0<br />
0<br />
-5<br />
wiped out and having to start<br />
-20<br />
-10<br />
-15<br />
-40<br />
rainfall variation around <strong>the</strong> mean<br />
over again every several years.<br />
-20<br />
-60<br />
GDP growth<br />
-25<br />
-80<br />
-30<br />
Fear and <strong>the</strong> “small s security<br />
year<br />
are pervasive in this setting.<br />
percentage<br />
1982<br />
1983<br />
1984<br />
1985<br />
1986<br />
1987<br />
1988<br />
1989<br />
1990<br />
1991<br />
1992<br />
1993<br />
1994<br />
1995<br />
1996<br />
1997<br />
1998<br />
1999<br />
2000<br />
Rainfall & GDP growth: Ethiopia 1982-2000<br />
Real GDP growth (%)<br />
1979<br />
1980<br />
1981<br />
1982<br />
1983<br />
1984<br />
1985<br />
1986<br />
1987<br />
1988<br />
As psychologists point out,<br />
Figure 2.3.A-6. Economy-wide Impacts <strong>of</strong> Rainfall. this becomes a cycle <strong>of</strong><br />
thinking that itself fur<strong>the</strong>r<br />
defeats development—a deterministic fatalism. This mindset <strong>of</strong>ten results in pockets <strong>of</strong> poverty,<br />
and no money moves in <strong>the</strong>ir directions. These pockets <strong>of</strong> poverty are <strong>the</strong>n vulnerable to <strong>for</strong>ces<br />
conspiring to “big S Security” actions <strong>of</strong> violence and disruption.<br />
1989<br />
1990<br />
1991<br />
1992<br />
1993<br />
Variability in Rainfall (Meter)<br />
83
What Does This Mean to Water and Security?<br />
First, one may notice that<br />
flattening out <strong>the</strong> peaks and<br />
valleys <strong>of</strong> <strong>the</strong> curves is what<br />
hydrology is all about. For <strong>the</strong><br />
last 500 years that is how and<br />
why humans—in <strong>the</strong> broad<br />
social sense—became<br />
engineers: to build more<br />
certainty into an uncertain<br />
environment, to manage<br />
uncertainty so as to build<br />
stable expectations, and to<br />
create time <strong>for</strong> investment in<br />
o<strong>the</strong>r areas, which in turn<br />
creates more resources, which<br />
leads to more innovation.<br />
Second, where <strong>the</strong>re are Figure 2.3.A-7. Climate Variability Undermines Growth.<br />
droughts <strong>the</strong>re are floods.<br />
They are opposite sides <strong>of</strong> <strong>the</strong> same coin, and <strong>the</strong>y coexist with <strong>the</strong> poverty and <strong>the</strong> poorest <strong>of</strong> <strong>the</strong><br />
poor.<br />
Third, we might posit a hypo<strong>the</strong>sis: <strong>the</strong>re is a minimum plat<strong>for</strong>m <strong>of</strong> water resources<br />
q y<br />
infrastructure and<br />
institutions necessary to<br />
achieve “water security.” 9<br />
Water security is essential<br />
-23% <strong>for</strong> sustained economic<br />
+44%<br />
growth and poverty<br />
eradication. Water security<br />
is achieved through<br />
balancing <strong>the</strong> productive<br />
use <strong>of</strong> water with managing<br />
vulnerabilities to water’s<br />
destructive power; to<br />
balancing access to water<br />
with living within<br />
acceptable levels <strong>of</strong> risks<br />
Figure 2.3.A-8. Rainfall Affects Growth: The Case <strong>of</strong> from unpredicted events.<br />
Mozambique’s Year 2000 Floods.<br />
84
From Fighting over Allocation <strong>of</strong> Flows to Jointly Creating Benefits from Water Use: Water<br />
Security is More Than Access<br />
Water:<br />
productive & destructive<br />
a source <strong>of</strong> production,<br />
health, growth &<br />
cooperation<br />
AND…<br />
a source <strong>of</strong> destruction,<br />
poverty and dispute<br />
Figure 2.3.A-9. Water Security.<br />
‘Water Security’<br />
reliable availability <strong>of</strong><br />
acceptable quantity & quality <strong>of</strong><br />
water <strong>for</strong> production,<br />
livelihoods & health<br />
AND…<br />
acceptable level <strong>of</strong> risk<br />
to society <strong>of</strong><br />
unpredictable waterrelated<br />
impacts<br />
Increasing <strong>the</strong> Pie<br />
Benefits Created<br />
Throughout history, water<br />
has been a venue <strong>for</strong> dialog<br />
<strong>of</strong>ten where dialog is<br />
prohibited, and this continues<br />
today. The question is, why?<br />
Ensuring water security<br />
involves more than ensuring<br />
access. Water’s many uses<br />
include irrigation, flood<br />
damage reduction, drought<br />
prevention, ecological flows,<br />
hydropower, energy coolant,<br />
navigation, and recreation.<br />
These multiple purposes or<br />
uses <strong>of</strong> water allow <strong>for</strong> joint<br />
creation <strong>of</strong> benefits from <strong>the</strong><br />
instead <strong>of</strong> fighting over allocation <strong>of</strong> flows. Achieving this realization is a key to understanding<br />
water as a venue <strong>of</strong> dialog.<br />
Throughout history, water actions have been a means to achieving o<strong>the</strong>r macro social goals. In<br />
this manner, water has <strong>of</strong>ten<br />
expanded <strong>the</strong> negotiating pie<br />
instead <strong>of</strong> requiring<br />
reallocation <strong>of</strong> <strong>the</strong> limited pie.<br />
This means that decisions were<br />
really about relative and not<br />
absolute scarcity. This history<br />
fits well with new paradigms <strong>of</strong><br />
negotiations and with interest-<br />
and needs-based approaches to<br />
negotiations. In this sense,<br />
water is seen as humanity’s<br />
proving ground <strong>for</strong> building a<br />
community ra<strong>the</strong>r than as a<br />
generator <strong>of</strong> war.<br />
Mitigating against<br />
Decreasing Pie<br />
Role <strong>of</strong> IW RM?<br />
Figure 2.3.A-10. Negotiating Arenas: Benefits - Interests<br />
This is not new. Implementing multiple uses <strong>of</strong> <strong>the</strong> same water to create joint benefits has been<br />
<strong>the</strong> hallmark <strong>of</strong> water management in <strong>the</strong> wealthy or developed world. As <strong>the</strong> figure below<br />
shows, it was central to nation building in North America,<br />
85
Marshal<br />
Gibbons<br />
Ogden<br />
1808: Gallatin Report<br />
Waterways to be used <strong>for</strong>:<br />
•Building Political Unity and Nation<br />
•<strong>National</strong> Defense<br />
•Economic Development<br />
1824: GIBBONS VS. OGDEN<br />
(Estbl. Federal Powers vs. States)<br />
Claims are said to be repugnant–<br />
1st. To that clause in <strong>the</strong> constitution which<br />
authorizes Congress to regulate commerce.<br />
2d. To that which authorizes Congress to<br />
promote <strong>the</strong> progress <strong>of</strong> science and useful arts.<br />
1920’s -“308” Reports: Congress Authorizes USACE do Comp.<br />
assessments <strong>of</strong> all major rivers <strong>of</strong> <strong>the</strong> US<br />
Figure. 2.3.A-11. Water Ways and Establishing <strong>National</strong><br />
Federal Interventions over Interstate Issues.<br />
This approach is known as<br />
integrated water resources<br />
management (IWRM). 10<br />
Water can serve many<br />
purposes: hydropower, flood<br />
control, navigation, water<br />
supply <strong>for</strong> cities and farms,<br />
ecological maintenance,<br />
recreation, and o<strong>the</strong>rs. USACE<br />
has been a means to achieve<br />
IRWM in North America, with<br />
<strong>the</strong> potential <strong>of</strong> providing<br />
<strong>the</strong>se services around <strong>the</strong><br />
world. USACE has pioneered<br />
IRWM concepts on <strong>the</strong><br />
Columbia, Missouri,<br />
Mississippi, Ohio and o<strong>the</strong>r<br />
rivers.<br />
Successful implementation <strong>of</strong> IRWM is an essential key to unleashing development, creating a<br />
plat<strong>for</strong>m <strong>for</strong> growth in various economic and social areas. IRWM has been a prerequisite <strong>for</strong><br />
successful development in <strong>the</strong> US, and this development can clearly being seen as a prerequisite<br />
<strong>for</strong> supporting and maintaining social stability, as well as reducing violence in <strong>the</strong> third world.<br />
IRWM requires water infrastructure investment that brings multipurpose uses and options to<br />
decision makers.<br />
The reapportionment or reconfiguration <strong>of</strong> purpose <strong>for</strong> which <strong>the</strong> current U.S. water<br />
infrastructure is used in <strong>the</strong> U.S. and in o<strong>the</strong>r wealthy countries will be a central focus as we<br />
adapt to climate changes, ecological changes and changing demographic patterns; likewise, it<br />
will be key to maintaining national security.<br />
Conclusions: A Strategic Argument<br />
The strategic aspects <strong>of</strong> water seem to lend <strong>the</strong>mselves to finding means <strong>for</strong> cooperation.<br />
Evidence abounds. Look at <strong>the</strong> Middle East Table Talks, during which parties were at war, <strong>the</strong><br />
Multilateral Water Talks in <strong>the</strong> Middle East, <strong>the</strong> World Bank and US interventions in <strong>the</strong> Indus<br />
River Treaty <strong>of</strong> <strong>the</strong> 1950s and its current arbitration, <strong>the</strong> Recent Istanbul World Water Forum,<br />
and <strong>the</strong> meetings <strong>of</strong> <strong>the</strong> riparian <strong>of</strong> T-E River, and o<strong>the</strong>rs.<br />
Sou<strong>the</strong>rn Africa is a region with prime strategic importance to <strong>the</strong> U.S. Sou<strong>the</strong>rn Africa is<br />
dependent on water. Investment in <strong>the</strong> “small s security” in Sou<strong>the</strong>rn Africa could pay huge<br />
dividends to <strong>the</strong> “big S security” and ultimately to US security interests. However, <strong>the</strong> water<br />
system in this region is hugely complex. The roles <strong>of</strong> international rivers are a chief element <strong>of</strong> a<br />
region’s security complex, but this role in Sou<strong>the</strong>rn Africa is as yet largely unexplored. Threats<br />
to economic security derive from <strong>the</strong> role <strong>of</strong> water as a foundation <strong>for</strong> <strong>the</strong> economic growth and<br />
prosperity <strong>of</strong> a given state. International river basins <strong>for</strong>m an important element <strong>of</strong> <strong>the</strong> Sou<strong>the</strong>rn<br />
African Regional Security Complex.<br />
The horn <strong>of</strong> Africa is clearly an area <strong>of</strong> strategic interest to <strong>the</strong> US. Opportunities, as opposed to<br />
only difficulties, abound in <strong>the</strong> Nile Basin. There are major potential win-win benefits from<br />
86
cooperative development. For example, in power production/trade, 90% hydropower potential is<br />
undeveloped, and 85% <strong>of</strong> <strong>the</strong> population is un-served. In food production and trade, 60% <strong>of</strong><br />
irrigable land is un-irrigated. Multipurpose storage potential is huge, but <strong>the</strong>re is very little being<br />
implemented despite very high rainfall variability. Environmental sustainability could be<br />
enhanced on watersheds, soils, wetlands, and lakes. It is important to note that, in conflict<br />
prevention, reduced tensions promote integration.<br />
Today <strong>the</strong> old Red Dead Canal is once again alive. New reports now present <strong>the</strong> project as a<br />
significant means <strong>for</strong> cooperation in <strong>the</strong> volatile region, whereas <strong>the</strong> focus <strong>of</strong> such reports has<br />
historically been focused on <strong>the</strong> associations between water and war. The famed Israeli<br />
billionaire Tshuva stated, “This is <strong>the</strong> only way to get out <strong>of</strong> <strong>the</strong> cycle <strong>of</strong> violence and <strong>the</strong> dead<br />
end in <strong>the</strong> area,…..jobs and prosperity,… would moderate Arabs in <strong>the</strong> region and give <strong>the</strong>m an<br />
alternative to violence and terror…….peace will be made not by peace agreements but by<br />
making cooperation and goodwill among <strong>the</strong> peoples <strong>of</strong> <strong>the</strong> region. The Valley <strong>of</strong> Peace will<br />
provide a solution <strong>for</strong> generations to come.”<br />
Environmental communities are also engaged in this dialogue. Israeli environmentalists accused<br />
<strong>the</strong> World Bank <strong>of</strong> stacking <strong>the</strong> timetable <strong>of</strong> <strong>the</strong> Red Sea-Dead Sea Canal project discussions in<br />
<strong>the</strong>ir favor. Many conferences, reports, and policies are implemented which hinder meaningful<br />
dialog and <strong>the</strong> relationships necessary to support <strong>the</strong> approaches outlined.<br />
To move down <strong>the</strong> strategic path suggested, <strong>the</strong> rhetoric <strong>of</strong> <strong>the</strong> wealthy vs. poor dialog should be<br />
changed. Often prescriptions from <strong>the</strong> wealthy nations are borne from unconscious assumptions<br />
embedded in <strong>the</strong> water experiences gained in those situations. What may seem to be obviously<br />
correct may not be what o<strong>the</strong>rs in different cultures and situations need. U.S. investments in<br />
water infrastructure actually helped build a regionally divided nation into one; <strong>the</strong>y trans<strong>for</strong>med<br />
major regions from poverty to productivity and affluence. The Pacific Northwest transitioned<br />
from deep poverty in <strong>the</strong> 1930s to a region with one <strong>of</strong> <strong>the</strong> largest GDPs in <strong>the</strong> world. The same<br />
was true and even more dramatic in <strong>the</strong> sou<strong>the</strong>ast due to <strong>the</strong> Tennessee Valley Authority, an<br />
infrastructure & management<br />
Many<br />
developing<br />
countries<br />
All<br />
industrial<br />
countries<br />
organization that now oversees<br />
some <strong>of</strong> <strong>the</strong> richest soil in <strong>the</strong><br />
US. Parts <strong>of</strong> this region were<br />
once so poor agriculturally or<br />
were inundated with floods to <strong>the</strong><br />
point that little could grow. TVA<br />
is now <strong>the</strong> second largest tax<br />
payer in <strong>the</strong> sou<strong>the</strong>rn U.S.<br />
Figure 2.3.A-12 shows that type<br />
1 countries (poor/developing) are<br />
spending much higher<br />
Developed countries are more likely to think <strong>of</strong> environment and percentages on infrastructure<br />
security in terms <strong>of</strong> global environmental changes and developing<br />
countries more with <strong>the</strong> human security implications <strong>of</strong> local and<br />
investment than on management<br />
regional problems.<br />
investments. Type 3 (<strong>the</strong> US and<br />
o<strong>the</strong>r wealthy nations) spend<br />
Figure 2.3.A-12. Relations between Developed and more on management<br />
Developing Worlds.<br />
investments and less on<br />
infrastructure. While type 1<br />
countries can learn from type 3 countries about conservation or o<strong>the</strong>r measures, <strong>the</strong>y can also<br />
87
learn about how type 3 countries invested and used water. Then type 3 countries can outline <strong>the</strong><br />
unanticipated costs over time and help design measures to allow investment while mitigating or<br />
avoiding unwanted effects through sound design.<br />
Ultimately, <strong>the</strong> creation <strong>of</strong> plat<strong>for</strong>ms <strong>for</strong> growth is essential to breaking <strong>the</strong> fatalism and poverty<br />
throughout <strong>the</strong> world, enhancing <strong>the</strong> focus on <strong>the</strong> “small s security,” which in turn will pay<br />
subsequent dividends to <strong>the</strong> “big S Security.” Those plat<strong>for</strong>ms <strong>for</strong> growth depend greatly on<br />
water actions and investments. Water actions, in turn, are directly related to “small s security,”<br />
and wide dispersions <strong>of</strong> <strong>the</strong> “small s security” are a key ingredient to <strong>for</strong> achieving goals <strong>of</strong> <strong>the</strong><br />
“big S security.”<br />
In Africa <strong>the</strong> US could fund and convene major discussions on key river basins that represent<br />
strategic areas <strong>of</strong> concern to <strong>the</strong> US and could conduct studies on how IRWM might increase<br />
“small s security,” consequently paying dividends to “big S Security.” outlined. Such discussions<br />
would place <strong>the</strong> US in a leadership role in an area where it really has comparative advantage, and<br />
it could also produce new coalitions and partnerships <strong>of</strong> investments.<br />
Priority areas <strong>of</strong> U.S. security concerns could be as follows:<br />
<br />
<br />
How can water actions be used as a means to achieve security ends in each priority area?<br />
How can we work to prevent and reduce vulnerability to disasters?<br />
How can be used to create a plat<strong>for</strong>m <strong>for</strong> growth while limiting mitigation cost to <strong>the</strong><br />
environment?<br />
↑ Back to <strong>the</strong> top<br />
1 Jerome Delli Priscoli and Aaron T. Wolf, Managing and Trans<strong>for</strong>ming Water Conflicts, Cambridge<br />
University Press, New York, 2009, Chapter 2 pages 9-28.<br />
2 Wolf, A; Y<strong>of</strong>fie, S. Giordano, M. Forthcoming. International Waters: Identifying Basins at Risk.<br />
Corvallis, University <strong>of</strong> Oregon.<br />
3 Delli Priscoli and Wolf, op. cit., Chapter 2 and page 3.<br />
4 Smakhtin, Revenga, and Döll, 2004.<br />
5 Delli Priscoli and Wolf, op. cit., Appendix B<br />
6 The United Nations, Water in a Changing World, UNESCO Publishing, Paris, 2009, Chapter 2 pages<br />
80-95.<br />
7 Delli Priscoli and Wolf, op. cit., page xxii<br />
8 United Nations, op. cit., Chapter 2.<br />
9 Sink or Swim? Water Security <strong>for</strong> Growth and Development, David Grey and Claudia W. Sad<strong>of</strong>f,<br />
Water Policy, June 2007, page 17.<br />
10 Presentation by Jerome Delli Priscoli, “Water and Security,” Johns Hopkins University (SAIS)<br />
November 18, 2008, Washington, D.C.<br />
88
2.3.B. Water Resources and Stability (J. Rolf Olsen, Kathleen White, Julie<br />
Kiang, D. Phil Turnipseed, Levi Brekke, David Raff, Roger Pulwarty,<br />
Robert Webb)<br />
Authors and Organizations: J. Rolf Olsen and Kathleen D. White, US Army Corps <strong>of</strong> Engineers;<br />
Julie E. Kiang and D. Phil Turnipseed, U.S. Geological Survey;<br />
Levi D. Brekke and David A. Raff , US Bureau <strong>of</strong> Reclamation; and Roger S.<br />
Pulwarty and Robert Webb, <strong>National</strong> Oceanic and Atmospheric Administration<br />
Contact In<strong>for</strong>mation: J.Rolf.Olsen@usace.army.mil, Kathleen.D.White@usace.army.mil,<br />
jkiang@usgs.gov, pturnip@usgs.gov, LBrekke@usbr.gov; DRAFF@do.usbr.gov;<br />
Roger.Pulwarty@noaa.gov, Robert.S.Webb@noaa.gov<br />
Abstract<br />
Water is a fundamental requirement <strong>for</strong> ecosystems, human health, and economic growth, and<br />
consequently <strong>the</strong> management <strong>of</strong> this resource is closely linked to social stability. Water<br />
resources have been managed to provide water <strong>for</strong> irrigated agriculture, municipal, rural and<br />
industrial water supply, energy, and o<strong>the</strong>r uses. However, water resources are stressed by<br />
multiple factors, including population growth and demographic changes, urbanization, land use<br />
changes, water pollution, climate change, and inadequate financing and investment. Droughts<br />
and floods can cause catastrophic losses <strong>for</strong> poor countries. Integrated water resources<br />
management (IWRM) is an effective approach <strong>for</strong> addressing water resources problems because<br />
it follows a comprehensive approach that integrates multiple objectives <strong>for</strong> all stakeholders over<br />
<strong>the</strong> relevant spatial scale and time horizon. An IWRM approach includes a framework <strong>for</strong><br />
evaluation <strong>of</strong> potential impacts to society and ecosystems that could contribute to social<br />
instability.<br />
Introduction<br />
Water is critical to <strong>the</strong> well being <strong>of</strong> humans and ecosystems. According to <strong>the</strong> United Nations,<br />
“Adequate water in both quantity and quality underpins health and basic quality <strong>of</strong> life.” 1 This<br />
paper describes why water is essential to social stability. Water resources affect ecosystems,<br />
human health, and economic development. Hydrologic extremes can cause major social<br />
disruptions. The paper also describes <strong>the</strong> multiple factors that can impact and stress water<br />
resources. Because <strong>of</strong> <strong>the</strong>se interactions, solutions to water resources problems should follow a<br />
comprehensive approach that integrates multiple objectives across <strong>the</strong> proper spatial and<br />
temporal scales. All relevant stakeholders should participate in <strong>the</strong> decision making process.<br />
The Need <strong>for</strong> Water<br />
Water is essential <strong>for</strong> plant, animal, and human life. Water availability is a limiting factor <strong>for</strong><br />
primary productivity <strong>of</strong> terrestrial ecosystems because living things require water to grow and<br />
survive. Water supports terrestrial ecosystems and <strong>the</strong> services <strong>the</strong>y provide people: agriculture<br />
<strong>for</strong> food production, <strong>for</strong>ests <strong>for</strong> firewood and construction materials, and grasslands <strong>for</strong> grazing<br />
animal habitat. Water is <strong>the</strong> medium <strong>of</strong> life <strong>for</strong> aquatic ecosystems. Lakes, streams and rivers<br />
support fisheries which are a major component <strong>of</strong> <strong>the</strong> diet in many countries.<br />
Clean water is also essential to human health. According to <strong>the</strong> World Health Organization,<br />
“Adequate quantities <strong>of</strong> safe water <strong>for</strong> consumption and its use to promote hygiene are<br />
complementary measures <strong>for</strong> protecting health.” 2 Waterborne diseases include cholera and<br />
89
typhoid, dysentery, hepatitis A and diarrhea. Water-washed diseases occur when people have<br />
inadequate water to keep <strong>the</strong>ir hands, bodies and domestic environments clean. 3<br />
Water resources availability and management are one determinant <strong>of</strong> a country’s growth. 4<br />
“Societies do not become wealthy first and <strong>the</strong>n invest in water management; <strong>the</strong>y find ways to<br />
manage water and risk first, which <strong>the</strong>n leads to wealth.” 5 Irrigation can improve agricultural<br />
productivity. Safe drinking water and sanitation cut <strong>the</strong> loss <strong>of</strong> life from a number <strong>of</strong> illnesses, so<br />
that health resources can be spent on o<strong>the</strong>r conditions. Water also must be provided <strong>for</strong> energy<br />
and industrial production.<br />
Managed Water Resources. Water provides <strong>for</strong> multiple social uses. One <strong>of</strong> <strong>the</strong> major uses <strong>of</strong><br />
water is <strong>for</strong> irrigated agriculture. More than 80% <strong>of</strong> agriculture depends only on adequate rain<br />
and is subject to <strong>the</strong> variability <strong>of</strong> climate. Only 18% <strong>of</strong> agricultural land is irrigated, but <strong>the</strong><br />
irrigated land produces half <strong>of</strong> <strong>the</strong> world’s grain supply. 6 About 70% <strong>of</strong> all freshwater<br />
withdrawals go to irrigated agriculture. 7<br />
Ano<strong>the</strong>r important use <strong>for</strong> water is <strong>for</strong> human drinking water in both urban and rural<br />
communities. In urban areas, water supply infrastructure is necessary to supply water to <strong>the</strong><br />
population. Water supply in rural areas may be simpler but is still necessary. 8 The Second World<br />
Water Forum and <strong>the</strong> United Nations Millennium Declaration endorsed a target <strong>of</strong> reducing by<br />
one-half <strong>the</strong> proportion <strong>of</strong> people without sustainable access to adequate quantities <strong>of</strong> af<strong>for</strong>dable<br />
and safe water by 2015. However, 18% <strong>of</strong> <strong>the</strong> world population (1.1 billion people) does not<br />
have access to improved water supply. 9 A related issue is access to sanitation facilities. An<br />
estimated 2.4 billion people lack access to improved sanitation. 10 The areas lagging behind<br />
achieving improvements in sustainable water supply and sanitation include sub-Saharan Africa<br />
and low-income Arab states, 11 which are regions <strong>of</strong> concern <strong>for</strong> social stability.<br />
Water is important <strong>for</strong> energy production and electrical generation. Water not only provides<br />
hydropower, but it also is used as cooling water <strong>for</strong> <strong>the</strong>rmal power plants. Rivers are used by<br />
both developed and developing countries <strong>for</strong> transportation <strong>of</strong> both people and freight. Aquatic<br />
systems may compete <strong>for</strong> water with human needs. Ecosystems require water, but ecosystems<br />
also provide multiple benefits <strong>for</strong> human and social well being, including food and fiber.<br />
Conflicting Water Uses. There is <strong>of</strong>ten a perceived conflict between providing water <strong>for</strong> human<br />
needs and supporting aquatic ecosystems. There are different stakeholders <strong>for</strong> different uses. For<br />
example, urban dwellers benefit from lower electric costs, while fishermen depend on a<br />
productive aquatic habitat. An example <strong>of</strong> <strong>the</strong> potential trade<strong>of</strong>f between hydroelectricity and<br />
fisheries is <strong>the</strong> Pak Mun Dam in Nor<strong>the</strong>ast Thailand. Pak Mun Dam is a run-<strong>of</strong>-<strong>the</strong>-river<br />
hydropower plant on <strong>the</strong> Mun River just upstream from its confluence with <strong>the</strong> Mekong. Even<br />
though a fish ladder was built, fish species that migrate and depend on <strong>the</strong> river rapids are<br />
seriously affected because <strong>the</strong> migration route is blocked in <strong>the</strong> beginning <strong>of</strong> <strong>the</strong> rainy season.<br />
Be<strong>for</strong>e dam construction, local communities depended on river fisheries <strong>for</strong> food and income.<br />
After <strong>the</strong> dam construction, fishermen reported a 50-100% decline in <strong>the</strong>ir fish catch.<br />
Households that depended on fisheries upstream <strong>of</strong> <strong>the</strong> dam declined from 95.6% to 66.7%.<br />
Many villagers have been unable to find alternative means <strong>of</strong> livelihood, and many have<br />
migrated to <strong>the</strong> cities looking <strong>for</strong> wage labor. Compensation was provided to <strong>the</strong> fishermen, but<br />
it was not sufficient to replace <strong>the</strong>ir loss <strong>of</strong> livelihood. 12<br />
90
Hydrological Extremes and Social Stability<br />
Precipitation varies across time and space. Hydrological extremes <strong>of</strong> droughts and floods can<br />
have major impacts on human society and ecosystems. Economic losses from global disasters,<br />
including floods, have been increasing in recent decades. 13 The cost <strong>of</strong> disasters as a percentage<br />
<strong>of</strong> gross domestic product (GDP) is much higher in poor countries than in developed countries. 14<br />
Droughts. Droughts are episodic dry periods caused by a period <strong>of</strong> abnormally low precipitation.<br />
Meteorological drought is generally defined by a deficit <strong>of</strong> precipitation and/or increased<br />
evaporation. Hydrological drought is concerned with reduced surface and/or subsurface water<br />
supply, including streamflow, reservoir and lake levels, as well as groundwater levels.<br />
Agricultural drought deals with <strong>the</strong> impact <strong>of</strong> moisture deficiency on agricultural production.<br />
Droughts have a wide range <strong>of</strong> social impacts. Drought can reduce <strong>the</strong> available water supply in<br />
groundwater and reservoir levels. Reduced streamflow can degrade water quality since pollutants<br />
become less diluted. Drought reduces crop yields in rain-fed agriculture, and it also reduces <strong>the</strong><br />
available supply <strong>for</strong> irrigated fields. Droughts provide favorable conditions <strong>for</strong> some insects that<br />
fur<strong>the</strong>r destroy crops, such as locusts. Dry vegetation also increases <strong>the</strong> potential <strong>for</strong> wildfires.<br />
Some fish species face increased mortality as lake and river levels fall, 15 affecting those who<br />
depend on <strong>the</strong> fish <strong>for</strong> <strong>the</strong>ir food or livelihood. Droughts can have especially serious<br />
consequences <strong>for</strong> poor countries. Droughts and <strong>the</strong> resulting famine in Ethiopia killed about<br />
400,000 people in <strong>the</strong> 1970s and about 1 million in <strong>the</strong> 1980s. Millions more were displaced. 16<br />
Floods. Too much water also causes major social impacts. Flooding is <strong>the</strong> most destructive<br />
natural disaster. One study found that flooding accounts <strong>for</strong> two-thirds <strong>of</strong> <strong>the</strong> people affected by<br />
natural disasters each year. 17 In addition to causing deaths and damages to settlements, floods<br />
can damage agricultural production, threaten water supplies, lead to outbreaks <strong>of</strong> waterborne<br />
disease, and damage terrestrial and aquatic habitat. 18 Hurricane Mitch caused massive<br />
destruction in Central America, with economic losses in Honduras estimated as being about 69%<br />
<strong>of</strong> <strong>the</strong>ir annual GDP in 1998. 19 In Bangladesh, a flood in 1998 inundated over two-thirds <strong>of</strong> <strong>the</strong><br />
country, and over 10% <strong>of</strong> <strong>the</strong> estimated rice production was lost. 20<br />
Stresses and Changes Affecting Water Resources<br />
While water resources affect society in numerous ways, water resources are, in turn, affected by<br />
many dynamic processes, including societal change. Population growth increases <strong>the</strong> demand<br />
<strong>for</strong> water. Society’s vulnerability to floods depends on where people live and increases when<br />
people move to coastal areas and flood plains. Changes in land use patterns and land cover can<br />
cause changes in run<strong>of</strong>f patterns and <strong>the</strong> hydrologic cycle. Ground-water supply can be depleted.<br />
Water pollution threatens human health and aquatic ecosystems. Natural resources can be<br />
overharvested.<br />
91
Population Changes. The world’s population tripled during <strong>the</strong> 20 th century. 21 From 1990 to<br />
2000, <strong>the</strong> population increased by 15% to over 6 billion people. 22 Larger population and related<br />
economic growth increase <strong>the</strong> demand <strong>for</strong> water. Estimated water withdrawals have increased by<br />
seven times in <strong>the</strong> 20 th century. 23 Vorosmarty and o<strong>the</strong>rs 24 evaluated <strong>the</strong> vulnerability <strong>of</strong> water<br />
supply in 2025 by estimating <strong>the</strong> ratio <strong>of</strong> water withdrawals to discharges. They concluded “that<br />
impending global-scale changes in population and economic development over <strong>the</strong> next 25 years<br />
will dictate <strong>the</strong> future relation between water supply and demand to a much greater degree than<br />
will changes in mean climate.”<br />
Population and economic growth have also occurred in areas that are subject to flooding and<br />
coastal storms. Analyses <strong>of</strong> long-term records <strong>of</strong> disaster losses indicate that population growth<br />
and more economic development in vulnerable locations are <strong>the</strong> principal factors responsible <strong>for</strong><br />
increasing losses from hurricanes and floods. 25<br />
Urbanization. The growth rate <strong>of</strong> <strong>the</strong> world’s urban population has exceeded <strong>the</strong> general<br />
population growth rate. In 2000, 47% <strong>of</strong> <strong>the</strong> world’s population lives in cities, up from 43.5% in<br />
1990. 26 The increase in urban population has placed a strain on water supply and wastewater<br />
treatment infrastructure in urban environments. 27 Urbanization also affects <strong>the</strong> hydrologic cycle.<br />
Ro<strong>of</strong>s, paved roads and parking lots are generally impervious and prevent precipitation from<br />
infiltrating into <strong>the</strong> ground. The amount <strong>of</strong> run<strong>of</strong>f generally increases as <strong>the</strong> percentage <strong>of</strong><br />
impervious area increases. In urban areas, run<strong>of</strong>f is <strong>of</strong>ten quickly concentrated into open<br />
channels and storm sewers. Peak flow rates tend to increase in urban areas due to higher run<strong>of</strong>f<br />
volume and higher velocity. 28<br />
Land Use Changes. Land use changes affect <strong>the</strong> hydrology <strong>of</strong> a watershed. Af<strong>for</strong>estation and<br />
de<strong>for</strong>estation are <strong>the</strong> largest land cover changes in terms <strong>of</strong> area. 29 The amount <strong>of</strong> infiltration is<br />
generally higher in <strong>for</strong>ested land cover compared to grass, agricultural, or urban land cover.<br />
Plants absorb water, which is <strong>the</strong>n transpired through <strong>the</strong> plant and eventually escapes through<br />
<strong>the</strong> leaf pores into <strong>the</strong> atmosphere. The overall effect <strong>of</strong> <strong>for</strong>est is a reduction <strong>of</strong> run<strong>of</strong>f from<br />
storms compared to grass or crop land. 30 Af<strong>for</strong>estation can reduce both annual run<strong>of</strong>f and flood<br />
discharges. De<strong>for</strong>estation has <strong>the</strong> opposite effect, reducing interception <strong>of</strong> precipitation,<br />
evaporation, and transpiration, and subsequently increasing run<strong>of</strong>f. De<strong>for</strong>estation may have<br />
worsened <strong>the</strong> impact <strong>of</strong> flooding in <strong>the</strong> Yangtze River basin in China and in Central America<br />
from Hurricane Mitch, both in 1998. 31<br />
Agricultural practices can alter <strong>the</strong> hydrologic cycle and water quality. For example, increased<br />
irrigation can cause or exacerbate problems with groundwater depletion. Run<strong>of</strong>f from<br />
agricultural fields can increase nutrient loads in rivers, leading to hypoxia in downstream lakes<br />
and estuaries. Loss <strong>of</strong> wetlands reduces storage in <strong>the</strong> watershed and affects run<strong>of</strong>f patterns.<br />
Groundwater Depletion. In many parts <strong>of</strong> <strong>the</strong> world, groundwater is a major source <strong>of</strong> water<br />
supply. Groundwater extraction data are highly uncertain, but most <strong>of</strong> <strong>the</strong> pumped groundwater<br />
is used <strong>for</strong> agriculture, with domestic uses being second. Areas irrigated with groundwater have<br />
substantially higher agricultural yield than regions irrigated from surface supplies, 32 as<br />
groundwater is typically a more stable source <strong>of</strong> water during drought.<br />
Prior to development, a groundwater system is in equilibrium, and inflow equals outflow.<br />
Groundwater is recharged by infiltration from precipitation and surface water. It discharges<br />
naturally to springs or as base flow in streams. When groundwater is pumped, however, <strong>the</strong> total<br />
discharge may no longer equal <strong>the</strong> recharge, resulting in declining groundwater levels. 33<br />
92
Extraction rates exceed recharge rates in a number <strong>of</strong> areas in <strong>the</strong> world, including several<br />
countries in <strong>the</strong> Middle East. These countries include Saudi Arabia, United Arab Emirates,<br />
Libya, Egypt, Algeria, Pakistan and Mauritania. 34 As groundwater levels decline, <strong>the</strong> water must<br />
be pumped from deeper levels up to <strong>the</strong> surface, increasing energy costs. If <strong>the</strong> levels decline<br />
below <strong>the</strong> bottom <strong>of</strong> <strong>the</strong> existing pump, <strong>the</strong> pump must be lowered or <strong>the</strong> well must be deepened.<br />
Yields decline and <strong>the</strong> cost <strong>of</strong> <strong>the</strong> water increases. Groundwater pumping reduces <strong>the</strong> base flow<br />
<strong>for</strong> streams and can cause land subsidence. In coastal areas, groundwater pumping can cause<br />
saltwater to migrate inland, resulting in saltwater intrusion into <strong>the</strong> water supply. 35<br />
Water Pollution. Water has been used <strong>for</strong> disposing <strong>of</strong> domestic, agricultural and industrial<br />
waste. Deteriorating water quality caused by this pollution is a worsening problem that threatens<br />
human health and aquatic ecosystems. Insufficient sanitation infrastructure is one source <strong>of</strong><br />
pollution. Nutrient loading is ano<strong>the</strong>r problem. Humans have doubled <strong>the</strong> amount <strong>of</strong> reactive<br />
nitrogen in streams. High levels <strong>of</strong> nitrogen contribute to eutrophication <strong>of</strong> freshwater and<br />
coastal marine ecosystems and acidification <strong>of</strong> freshwater and terrestrial ecosystems. 36<br />
Ecosystem Changes. Ecosystems face multiple stressors, in addition to concerns with water<br />
quantity and water quality. One problem is overharvesting, especially overfishing. At least one<br />
quarter <strong>of</strong> commercial fish stocks are overharvested. 37 Invasive species (introduced ei<strong>the</strong>r<br />
accidentally or intentionally) compete with native species and upset <strong>the</strong> balance <strong>of</strong> native<br />
ecosystems. Land use changes such as de<strong>for</strong>estation and destruction <strong>of</strong> wetlands cause habitat<br />
fragmentation. Species may <strong>the</strong>n be limited in <strong>the</strong>ir ability to migrate if <strong>the</strong>y are under pressure<br />
due to o<strong>the</strong>r changes in <strong>the</strong>ir habitat.<br />
Climate Change. The best available scientific evidence indicates that <strong>the</strong> Earth is warming.<br />
Climate change has <strong>the</strong> potential to affect many sectors in water resources. 38 The<br />
Intergovernmental Panel on Climate Change (IPCC) says with high confidence that “observed<br />
warming over several decades has been linked to changes in <strong>the</strong> large-scale hydrological<br />
cycle.” 39 The IPCC projects that <strong>the</strong> frequency <strong>of</strong> heavy precipitation events is very likely to<br />
increase, while <strong>the</strong> proportion <strong>of</strong> land in drought at any time is also likely to increase. Sea level is<br />
expected to rise due to warming ocean temperatures, as well as melting glaciers and ice sheets. A<br />
higher sea level will increase <strong>the</strong> potential <strong>for</strong> flooding <strong>of</strong> people living in low-lying coastal<br />
areas. Global warming may affect agriculture and food production and could impact water<br />
availability. Climate change may aggravate <strong>the</strong> effects <strong>of</strong> o<strong>the</strong>r stresses on aquatic ecosystems. 40<br />
Financing and Investment in Water Resources. Water resources management costs money.<br />
New water supply storage, municipal water infrastructure, and sanitation facilities require capital<br />
investments. Water management functions such as flood risk management, environmental<br />
protection, monitoring, administration, planning and research need funding <strong>for</strong> labor.<br />
Infrastructure deteriorates over time and must be repaired and rehabilitated. Structures need to be<br />
maintained to stay functional, and deferred maintenance accelerates deterioration. Adequate<br />
financing <strong>of</strong>ten limits water resources management. One study placed <strong>the</strong> world’s gap in annual<br />
capital requirements <strong>for</strong> water supply and wastewater services at $67.5 to $115.2 billion . 41<br />
Water resources management will likely continue to be constrained by a lack <strong>of</strong> financial<br />
resources.<br />
93
Integrated Water Resources Management (IWRM)<br />
Water management is <strong>of</strong>ten fragmented among sectors. It is <strong>of</strong>ten controlled by top-down<br />
institutions, “<strong>the</strong> legitimacy and effectiveness <strong>of</strong> which have increasingly been questioned.” 42<br />
IWRM is being advocated as an alternative approach to water management.<br />
IWRM can be defined in various ways, 43,44 but <strong>the</strong> approach usually requires <strong>the</strong> use <strong>of</strong> a<br />
comprehensive systems approach applied throughout a watershed ra<strong>the</strong>r than focusing on a<br />
single project or sector. 45,46 Integration should be per<strong>for</strong>med across space, objectives,<br />
institutions, and time. 47 An appropriate spatial region should be defined <strong>for</strong> <strong>the</strong> problem. For<br />
surface water, this region is usually a basin or watershed, but <strong>the</strong> bounds <strong>of</strong> an aquifer should be<br />
included when conjunctive use <strong>of</strong> ground and surface water is considered. The vertical bounds<br />
may range from <strong>the</strong> lithosphere to <strong>the</strong> atmosphere. Integrated water resources management must<br />
integrate multiple objectives. For example, <strong>the</strong> need <strong>for</strong> water supply storage and hydropower<br />
must be balanced with <strong>the</strong> need to sustain aquatic environments and fisheries. To be most<br />
effective, IWRM should follow a real participatory approach in which all stakeholders are part <strong>of</strong><br />
a collaborative decision process. IWRM should also integrate across temporal scales to ensure<br />
that ecosystems, economics, and society are sustainable over <strong>the</strong> long term.<br />
IWRM can include some <strong>of</strong> <strong>the</strong> following specific activities.<br />
<br />
<br />
<br />
<br />
<br />
Land management and planning can be integrated with water management and planning.<br />
Conjunctive use <strong>of</strong> groundwater and surface water can be considered.<br />
Planners can evaluate alternatives <strong>for</strong> a range <strong>of</strong> possible future conditions, including<br />
climate change, to account <strong>for</strong> future uncertainty.<br />
Truly integrative water planning should evaluate ecosystem and social impacts in<br />
addition to economic development.<br />
IWRM should also consider <strong>the</strong> needs <strong>of</strong> all segments <strong>of</strong> a society, including groups that<br />
may be disadvantaged.<br />
Although IWRM may be a desired paradigm <strong>for</strong> water management, <strong>the</strong>re are certainly<br />
impediments to its implementation. Many societies lack a participatory process that brings<br />
toge<strong>the</strong>r all stakeholders. Groups in power may not want to share decision making with o<strong>the</strong>r<br />
stakeholders. Lack <strong>of</strong> adequate funding may be ano<strong>the</strong>r roadblock to implementation <strong>of</strong> IWRM.<br />
Conclusion<br />
Water is intrinsically tied to a nation’s economic development, human health and wellbeing, and<br />
<strong>the</strong> conditions <strong>of</strong> ecosystems. Hydrologic extremes <strong>of</strong> droughts and floods can lead to severe<br />
social disruptions. Stability operations need to recognize water’s important role. Water resources<br />
could be impacted by multiple changes in <strong>the</strong> future, including climate change, population<br />
increases, urbanization, land use changes, and depletion <strong>of</strong> resources. Water resources<br />
management is likely to be chronically underfunded. A comprehensive framework is needed to<br />
understand <strong>the</strong> potential impact <strong>of</strong> <strong>the</strong>se stresses on water and social stability. The IWRM<br />
provides a framework that considers <strong>the</strong> sustainability <strong>of</strong> water resources over time. A holistic<br />
approach recognizes that water management decisions can impact many sectors affecting<br />
environmental and social wellbeing. IWRM can evaluate <strong>the</strong> potential <strong>for</strong> social instability from<br />
water resources stresses and <strong>the</strong> potential alternatives that could be employed by water managers.<br />
94
↑ Back to <strong>the</strong> top<br />
1 “Status Report on IWRM and Water Efficiency Plans <strong>for</strong> CSD16,” United Nations-Water, 2008.<br />
available at http://www.un.org/esa/dsd/resources/res_publsdt_wat.shtml<br />
2 “Global Water Supply and Sanitation Assessment 2000 Report.” World Health Organization (WHO)<br />
and United Nations Children’s Fund, 2000.<br />
3 “Global Water Supply and Sanitation Assessment 2000 Report.” World Health Organization (WHO)<br />
and United Nations Children’s Fund, 2000.<br />
4 “The United Nations World Water Development Report 3: Water in a Changing World.” World Water<br />
Assessment Programme (WWAP), 2009. Paris: UNESCO, and London: Earthscan, available at<br />
http://www.unesco.org/water/wwap/wwdr/wwdr3/table<strong>of</strong>contents.shtml<br />
5 “The United Nations World Water Development Report 3: Water in a Changing World.” World Water<br />
Assessment Programme (WWAP), 2009. Paris: UNESCO, and London: Earthscan, available at<br />
http://www.unesco.org/water/wwap/wwdr/wwdr3/table<strong>of</strong>contents.shtml<br />
6 Bates, B.C., Z.W. Kundzewicz, S. Wu and J.P. Palutik<strong>of</strong>, Eds., 2008: “Technical Paper <strong>of</strong> <strong>the</strong><br />
Intergovernmental Panel on Climate Change,” Climate Change and Water. IPCC Secretariat, Geneva,<br />
210 pp.<br />
7 “The United Nations World Water Development Report 3: Water in a Changing World.” World Water<br />
Assessment Programme (WWAP), 2009. Paris: UNESCO, and London: Earthscan, available at<br />
http://www.unesco.org/water/wwap/wwdr/wwdr3/table<strong>of</strong>contents.shtml<br />
8 Helweg, Otto J., 2000. “Water <strong>for</strong> a Growing Population Water Supply and Groundwater Issues in<br />
Developing Countries,” International Water Resources Association, 25 (1), pp. 33-39.<br />
9 “Global Water Supply and Sanitation Assessment 2000 Report.”World Health Organization (WHO) and<br />
United Nations Children’s Fund, 2000.<br />
10 “Global Water Supply and Sanitation Assessment 2000 Report.” World Health Organization (WHO)<br />
and United Nations Children’s Fund, 2000.<br />
11 “The United Nations World Water Development Report 3: Water in a Changing World.” World Water<br />
Assessment Programme (WWAP), 2009. Paris: UNESCO, and London: Earthscan, available at<br />
http://www.unesco.org/water/wwap/wwdr/wwdr3/table<strong>of</strong>contents.shtml<br />
12 “Pak Mun Dam Mekong River Basin Thailand.” World Commission on Dams (WCD), 2000.<br />
13 Höppe, P. and R.A. Pielke, Jr. (eds.), 2006. “Understanding and Attributing Trends and Projections,”<br />
Final Workshop Report. Workshop on Climate Change and Disaster Losses. Hohenkammer, Germany,<br />
25-26 May, Available at<br />
http://sciencepolicy.colorado.edu/sparc/research/projects/extreme_events/munich_workshop/full_works<br />
hop_report.pdf<br />
14 Delli Priscoli, J., and A. T. Wolf. 2009. “Managing and Trans<strong>for</strong>ming Water Conflicts.” International<br />
Hydrology Series. Cambridge, UK: Cambridge University Press.<br />
15 Cooley, Hea<strong>the</strong>r, 2006. “Floods and Droughts,” in Peter Gleick, The World’s Water 2006-2007, Island<br />
Press.<br />
16 United Nations Environment Programme (UNEP), 2002. Africa Environment Outlook Past, present and<br />
future perspectives, available at http://hqweb.unep.org/dewa/Africa/publications/AEO-1/index.htm<br />
17 United Nations (UN), 2004.Guidelines <strong>for</strong> Reducing Flood Losses, available at<br />
www.unisdr.org/eng/library/Literature/8689.pdf<br />
18 Cooley, Hea<strong>the</strong>r, 2006. “Floods and Droughts,” in Peter Gleick, The World’s Water 2006-2007, Island<br />
Press.<br />
19 “Guidelines <strong>for</strong> Reducing Flood Losses,” United Nations (UN), 2004, available at<br />
www.unisdr.org/eng/library/Literature/8689.pdf<br />
20 Del Ninno, Carlo, Paul A Dorosh, Lisa C. Smith, and Dilip K. Roy, 2001. “The 1998 floods in<br />
Bangladesh: disaster impacts, household coping strategies,” International Food Policy Research<br />
Institute.<br />
95
21 “Integrated Water Resources Management,” TAC Background Paper No. 4. Global Water Partnership<br />
(GWP), Technical Advisory Committee (TAC), 2000.<br />
22 “Global Water Supply and Sanitation Assessment 2000 Report.” World Health Organization (WHO)<br />
and United Nations Children’s Fund, 2000.<br />
23 “Integrated Water Resources Management,” TAC Background Paper No. 4. Global Water Partnership<br />
(GWP), Technical Advisory Committee (TAC), 2000.<br />
24 Vorosmarty, C.J., P. Green, J. Salisbury, R.B. Lammers, 2000. “Global Water Resources: Vulnerability<br />
from Climate Change and Population Growth,” Science 289: 284-287.<br />
25 Höppe, P. and R.A. Pielke, Jr. (eds.), 2006. “Understanding and Attributing Trends and Projections,”<br />
Final Workshop Report.Workshop on Climate Change and Disaster Losses. Hohenkammer, Germany,<br />
25-26 May, Available at<br />
http://sciencepolicy.colorado.edu/sparc/research/projects/extreme_events/munich_workshop/full_works<br />
hop_report.pdf<br />
26 “Global Water Supply and Sanitation Assessment 2000 Report.” World Health Organization (WHO)<br />
and United Nations Children’s Fund, 2000.<br />
27 Helweg, Otto J., 2000. “Water <strong>for</strong> a Growing Population Water Supply and Groundwater Issues in<br />
Developing Countries,” International Water Resources Association, 25 (1), pp. 33-39.<br />
28 Urbonas, B.R. and L.A. Roesner, 1993. “Hydrologic Design <strong>for</strong> Urban Drainage and Flood Control.”<br />
Handbook <strong>of</strong> Hydrology. David R. Maidment, ed. New York: McGraw-Hill, Inc. pp. 28.1-28.52.<br />
29 Calder, Ian R., 1993. “Hydrologic Effects <strong>of</strong> Land-Use Change.” Handbook <strong>of</strong> Hydrology. David R.<br />
Maidment, ed. New York: McGraw-Hill, Inc. pp. 13.1-13.50.<br />
30 Calder, Ian R., 1993. “Hydrologic Effects <strong>of</strong> Land-Use Change.” Handbook <strong>of</strong> Hydrology. David R.<br />
Maidment, ed. New York: McGraw-Hill, Inc. pp. 13.1-13.50.<br />
31 United Nations (UN), 2004.Guidelines <strong>for</strong> Reducing Flood Losses, available at<br />
www.unisdr.org/eng/library/Literature/8689.pdf<br />
32 Moench, Marcus, 2004. “Groundwater: The Challenge <strong>of</strong> Monitoring and Management,” in Peter<br />
Gleick, The World's Water 2004-2005, Island Press.<br />
33 Bartolino, J.R. and W.L. Cunningham, 2003. “Ground-Water Depletion across <strong>the</strong> Nation.” U.S<br />
Geological Survey Fact Sheet 103-03, November 2003, available at http://pubs.usgs.gov/fs/fs-103-03/<br />
34 Moench, Marcus, 2004. “Groundwater: The Challenge <strong>of</strong> Monitoring and Management,” in Peter<br />
Gleick, The World's Water 2004-2005, Island Press.<br />
35 Bartolino, J.R. and W.L. Cunningham, 2003. “Ground-Water Depletion across <strong>the</strong> Nation.” U.S<br />
Geological Survey Fact Sheet 103-03, November 2003, available at http://pubs.usgs.gov/fs/fs-103-03/<br />
36 “Millennium Ecosystem Assessment,” 2005. Ecosystems and Human Well-Being, Island Press,<br />
Washington, DC.<br />
37 “Millennium Ecosystem Assessment,” 2005. Ecosystems and Human Well-Being, Island Press,<br />
Washington, DC.<br />
38 Brekke, L.D., Kiang, J.E., Olsen, J.R., Pulwarty, R.S., Raff, D.A., Turnipseed, D.P., Webb, R.S., and<br />
White, K.D., 2009, “Climate change and water resources management—A federal perspective.” U.S.<br />
Geological Survey Circular 1331, 65 p. (Also available online at http://pubs.usgs.gov/circ/1331/.)<br />
39 Bates, B.C., Z.W. Kundzewicz, S. Wu and J.P. Palutik<strong>of</strong>, Eds., 2008: “Climate Change and Water.”<br />
Technical Paper <strong>of</strong> <strong>the</strong> Intergovernmental Panel on Climate Change, IPCC Secretariat, Geneva, 210 pp.<br />
40 Bates, B.C., Z.W. Kundzewicz, S. Wu and J.P. Palutik<strong>of</strong>, Eds., 2008: “Climate Change and Water.”<br />
Technical Paper <strong>of</strong> <strong>the</strong> Intergovernmental Panel on Climate Change, IPCC Secretariat, Geneva, 210 pp.<br />
41 “The United Nations World Water Development Report 3: Water in a Changing World.” World Water<br />
Assessment Programme (WWAP), 2009. Paris: UNESCO, and London: Earthscan, available at<br />
http://www.unesco.org/water/wwap/wwdr/wwdr3/table<strong>of</strong>contents.shtml<br />
42 “TAC Background Paper No. 4,” Integrated Water Resources Management Global Water Partnership<br />
(GWP), Technical Advisory Committee (TAC) 2000.<br />
96
43 Jonch-Clause, T, 2004. “Integrated Water Resources Management (IWRM) and Water Efficiency Plans<br />
by 2005: Why, What and How? Global Water Partnership,” TEC Report No. 10, Elanders Infologistics<br />
Väst AB: Sweden. 45pp.<br />
44 Biswas, A.K., 2004. “Integrated water resources management: a reassessment.” Water International,<br />
29(2):249-256.<br />
45 Bauwer, H., 2000. “Integrated water management: emerging issues and challenges.” Agricultural Water<br />
Management 45(3): 217-228.<br />
46 Thomas, J-S and B. Durham, “2003. Integrated water resources management: looking at <strong>the</strong> whole<br />
picture.” Desalinization 156: 21-28.<br />
47 Cardwell, H., R. Cole, L. Cartwright, and L. Martin, 2006. “Integrated Water Resources Management:<br />
Definitions and Conceptual Musings,” Pages 8-17 in B. Hooper (Editor). “Integrated Water Resources<br />
Management: New Governance, Tools, and Challenges—Selected International Perspectives.” Journal<br />
<strong>of</strong> Contemporary Water Research & Education. Issue 135.<br />
97
2.3.C. Water Security and Scarcity: Potential Destabilization in Western<br />
Afghanistan (Alex Dehgan, Laura Jean Palmer-Moloney)<br />
Authors and Organizations: Dr. Alex Dehgan, Senior Advisor, Office <strong>of</strong> <strong>the</strong> Science and<br />
Technology Advisor to <strong>the</strong> Secretary, Department Of State;<br />
Dr. Jean Palmer-Moloney, Senior Research Geographer, U.S. Army Corps <strong>of</strong><br />
Engineers, Engineer Research & Development Center, Alexandria, VA (<strong>for</strong>merly<br />
with <strong>National</strong> Geospatial-Intelligence Agency)<br />
Contact In<strong>for</strong>mation: DehganAO@state.gov; laura.j.palmer-moloney@usace.army.mil<br />
Summary<br />
Iran sees current Afghan stabilization and reconstruction ef<strong>for</strong>ts--agricultural development and<br />
water withdrawal, diversion, and containment projects--in <strong>the</strong> middle and lower Helmand River,<br />
<strong>the</strong> Farah River, and <strong>the</strong> Hari Rud watersheds <strong>of</strong> Afghanistan--as undermining water security in<br />
eastern Iran. The concern is particularly relevant in <strong>the</strong> region known as Sistan and Baluchestan,<br />
<strong>the</strong> most desolate, <strong>the</strong> poorest, and <strong>the</strong> most unstable <strong>of</strong> Iran’s provinces. This is Iran’s Achilles<br />
Heel, and Iran is sensitive to <strong>the</strong> region’s stability. Accordingly, U.S. & Afghan ef<strong>for</strong>ts to<br />
harness or divert water from <strong>the</strong>se watersheds without resolution <strong>of</strong> <strong>the</strong> water dispute between<br />
Afghanistan and Iran – one that has endured since 1870 – has encouraged Iran to adopt a mixed<br />
strategy <strong>of</strong> destabilization and cooperation in Afghanistan. Iranian destabilization activities<br />
include support <strong>for</strong> <strong>the</strong> Taliban and direct action against water diversion targets. Though<br />
population growth and consumption patterns are at <strong>the</strong> root <strong>of</strong> short-term water challenges in<br />
both Iran and Afghanistan, changes in climate are expected to exacerbate <strong>the</strong> situation (Alcamo<br />
et al., 2007; Asian Development Bank, 2009; Zimmerman et al., 2009). Projected climate<br />
models <strong>of</strong> <strong>the</strong> region predict that less water will flow through <strong>the</strong>se watersheds due to decreased<br />
rainfall, and more water will be lost to evaporation due to increased temperatures. This will<br />
fur<strong>the</strong>r undermine stability and increase tensions within countries and between <strong>the</strong>m. Failure to<br />
address water concerns has <strong>the</strong> potential to increase tensions between both countries explosively,<br />
slowing or even preventing stability gains in Afghanistan’s Western provinces. However,<br />
handling water concerns adroitly could encourage closer cooperation on stability and<br />
development in Afghanistan.<br />
Background<br />
Five <strong>of</strong> Afghanistan’s six major river basins extend beyond its borders and are a source <strong>of</strong><br />
tension with its neighbors. Accordingly, any water-based development projects in Afghanistan<br />
must take into account <strong>the</strong> equities <strong>of</strong> Afghanistan’s neighbors and <strong>the</strong> rights and obligations<br />
imposed on Afghanistan by international law, bilateral treaties, and state practice on <strong>the</strong> use <strong>of</strong><br />
water from shared basins. At <strong>the</strong> same time, Afghanistan’s immediate future economic growth<br />
will occur through agriculture, which requires increasing water use, improving irrigation and<br />
distribution systems, and increasing water efficiency. Water is necessary <strong>for</strong> Afghanistan’s<br />
development, security, and stability.<br />
The Helmand River is <strong>the</strong> longest (1,150 km) and among <strong>the</strong> most strategic <strong>of</strong> <strong>the</strong> country’s<br />
watersheds. It rises in <strong>the</strong> Hindu Kush Mountains and crosses south-west through <strong>the</strong> desert <strong>of</strong><br />
Dashti Margo, where it, along with <strong>the</strong> Farah River, feed into <strong>the</strong> Sistan Depression at <strong>the</strong><br />
Afghan-Iranian border, a large complex <strong>of</strong> wetlands, lakes and lagoons, internationallyrecognized<br />
as a haven <strong>for</strong> wildlife. Water <strong>of</strong> <strong>the</strong> Helmand River and its tributaries is used<br />
98
extensively <strong>for</strong> irrigation in <strong>the</strong> middle and lower reaches <strong>of</strong> <strong>the</strong> watershed, in Kandahar,<br />
Helmand, and Nimruz provinces <strong>of</strong> Afghanistan, and in <strong>the</strong> Sistan and Baluchestan province <strong>of</strong><br />
Iran, part <strong>of</strong> <strong>the</strong> Persian granary. The Helmand River Basin is inhabited by more than 7 million<br />
people.<br />
The Helmand River is a renewable water resource, but it is vulnerable to overuse and seasonal<br />
exhaustion. Though <strong>the</strong> river and its tributaries are fed annually by melting snow from <strong>the</strong><br />
highlands <strong>of</strong> central Afghanistan (Favre et al., 2004), recent below-average snowfall and reduced<br />
water in <strong>the</strong> snow pack have led to reduced water in <strong>the</strong> overall drainage system. Two major<br />
dams, constructed circa 1950 (<strong>the</strong> Kajakai dam and <strong>the</strong> Arghandab dam), help control seasonal<br />
flooding and release water into <strong>the</strong> river during <strong>the</strong> seasonally dry times (FAO, 1962; US Army<br />
Geospatial Center, 2009; US Army Engineer Research and Development Center, 2002).<br />
Predictable year-round flow <strong>of</strong> surface water is not guaranteed, and groundwater drawn from<br />
wells is <strong>the</strong> traditional and most reliable source <strong>of</strong> water <strong>for</strong> communities in <strong>the</strong> area. US <strong>for</strong>ces<br />
bombed <strong>the</strong> Kajakai dam on Halloween, 2001, and started reconstruction <strong>of</strong> its 3 turbines in<br />
2004.<br />
Water Insecurity in Iran & Afghanistan<br />
Iran’s agricultural sector accounts <strong>for</strong> about one-fifth <strong>of</strong> its GDP, employs one-third <strong>of</strong> its<br />
work<strong>for</strong>ce, and is necessary <strong>for</strong> <strong>the</strong> country’s goals <strong>of</strong> achieving food absence. Although<br />
developments <strong>of</strong> agriculture and food self-sufficiency are important goals <strong>of</strong> <strong>the</strong> Iranian<br />
government, strong population growth in recent decades has left Iran unable to grow enough<br />
food to feed its population. The processes <strong>of</strong> urbanization, industrialization and <strong>the</strong> development<br />
<strong>of</strong> irrigated agriculture to support population growth have raised <strong>the</strong> demand <strong>for</strong> water, and<br />
simultaneously reduced <strong>the</strong> supply. This increased demand has drawn down Iran’s aquifers.<br />
More than 90 percent <strong>of</strong> <strong>the</strong> country’s renewable water resources are used in agriculture, but<br />
because <strong>of</strong> low irrigation & transport efficiency, about 50-60% <strong>of</strong> <strong>the</strong> water is lost during <strong>the</strong><br />
process.<br />
Although only ten percent <strong>of</strong> Iran’s water resources originate outside <strong>the</strong> country, those regions<br />
dependent on transboundary water resources are highly susceptible to its scarcity. In 1999, <strong>the</strong><br />
Taliban-led Afghan government reduced <strong>the</strong> flow <strong>of</strong> <strong>the</strong> Helmand River to Iran by 98 percent at<br />
<strong>the</strong> peak <strong>of</strong> tension with Iran and in <strong>the</strong> midst <strong>of</strong> a 5-year drought. As a result, Iran’s Hamun<br />
Lake dried up and sandstorms buried more than a hundred villages and destroyed farmland. Iran<br />
is dependent on 80% <strong>of</strong> <strong>the</strong> Helmand’s current downstream flow <strong>for</strong> agriculture. This region is<br />
economically important to Iran, having frequently been referred to in <strong>the</strong> historical documents as<br />
<strong>the</strong> "bread basket" <strong>of</strong> Central Asia. However, Sistan's traditional economic <strong>for</strong>tune has<br />
diminished as a result <strong>of</strong> <strong>the</strong> diminishing water supplies from <strong>the</strong> Helmand. Iran has similar<br />
concerns over <strong>the</strong> planned Salma Dam <strong>of</strong> <strong>the</strong> Hari Rud River, which <strong>for</strong>ms <strong>the</strong> border between<br />
Iran, Turkmenistan, and Afghanistan. Iran perceives <strong>the</strong> construction <strong>of</strong> <strong>the</strong> Salma dam, like<br />
current NATO/USAID ef<strong>for</strong>ts to rehabilitate <strong>the</strong> Kajakai dam on <strong>the</strong> Helmand River, as a direct<br />
security threat.<br />
In Afghanistan, at least 97 percent <strong>of</strong> <strong>the</strong> water being withdrawn from <strong>the</strong> Helmand Basin is used<br />
in <strong>the</strong> agriculture sector. Moreover, 90% <strong>of</strong> <strong>the</strong> Afghan population is dependent on natural<br />
resources management – primarily animal husbandry and agriculture (Batson, 2008). Future<br />
agricultural development—a key portion <strong>of</strong> Obama’s strategy to rapidly increase economic<br />
activity as a bulwark against <strong>the</strong> insurgency—will depend on having sufficient water resources<br />
99
<strong>for</strong> expansion (Wegerich, 2009). Although Afghanistan has <strong>the</strong>oretically sufficient water <strong>for</strong> its<br />
needs, it is hampered by poor infrastructure damaged by 30 years <strong>of</strong> war. Population growth and<br />
climate change also fur<strong>the</strong>r increasingly undermine Afghanistan’s water security.<br />
Predicted Changes to Water Availability<br />
Proposed population growth, increased agricultural expansion, and climate change conditions are<br />
likely to exacerbate existing tension with Iran over dams and o<strong>the</strong>r water control features on <strong>the</strong><br />
Helmand River. The most recent climate projections from <strong>the</strong> Intergovernmental Panel on<br />
Climate Change, coupled with downscaled modeling <strong>of</strong> <strong>the</strong> IPCC global predictions <strong>for</strong> <strong>the</strong><br />
region, suggest that water stress will continue to increase in sou<strong>the</strong>ast Iran and southwest<br />
Afghanistan (Alcamo et al., 2007). As <strong>the</strong> population in <strong>the</strong> lower Helmand watershed grows, it<br />
will place more demands on water supply <strong>for</strong> domestic consumption, business, and food<br />
production. Current reconstruction ef<strong>for</strong>ts in Afghanistan – particularly in <strong>the</strong> agricultural sector<br />
– are proceeding haphazardly, with no understanding <strong>of</strong> <strong>the</strong> total impact such activities will have<br />
on <strong>the</strong> water flow to Iran and o<strong>the</strong>r countries, or on <strong>the</strong> existing aquifers in Afghanistan. As seen<br />
in examples from o<strong>the</strong>r arid regions, i.e., Iraq (Lightfoot, 2009) and Pakistan (Mustafa, 2007),<br />
when new groundwater wells are drilled and water is pumped from deep aquifers, <strong>the</strong> water table<br />
can fall rapidly in some places, at least disrupting water availability and at worst causing entire<br />
villages to be abandoned (Lightfoot, 2009; Warner et al., 2009). There is insufficient systematic<br />
monitoring <strong>of</strong> ground water tables, salinization, water flow, snow pack, and rainfall to<br />
understand how water flow and availability is changing in <strong>the</strong> Helmand basin. Similar problems<br />
exist <strong>for</strong> <strong>the</strong> o<strong>the</strong>r Afghan river basins. Moreover, a 30-year gap in Afghanistan’s<br />
hydrometeorological data (Williams-Se<strong>the</strong>r, 2008; Whitney, 2006) fur<strong>the</strong>r undermines<br />
Afghanistan’s ability to manage its water resources wisely.<br />
The decreased water flow in <strong>the</strong> region not only affects <strong>the</strong> water table, but also increases<br />
desertification. Sandstorms that scoured southwestern Afghanistan in early June-Sep 2003 -<br />
called <strong>the</strong> worst in living memory by residents <strong>of</strong> <strong>the</strong> area - buried villages, filled waterways,<br />
destroyed crops, and killed livestock. Though locally strong wind (known as <strong>the</strong> Wind <strong>of</strong> 120<br />
Days) occurs annually (Whitney, 2006), wind-generated sandstorms persisted longer than<br />
expected in <strong>the</strong> recent years <strong>of</strong> drought, creating a huge environmental problem <strong>for</strong> <strong>the</strong> residents<br />
<strong>of</strong> this region. Most <strong>of</strong> <strong>the</strong> windblown dust originated in <strong>the</strong> Sistan Basin wetlands in <strong>the</strong> beds <strong>of</strong><br />
<strong>the</strong> dried out hamuns (lakes). Persistent drought conditions <strong>the</strong>re, coupled with increased<br />
irrigation drawn from <strong>the</strong> Helmand River, have quickly turned <strong>the</strong>se wetlands into arid salt pans<br />
(IRIN 2007, UNEP, 2003 and 2006).<br />
Negotiations between Iran and Afghanistan<br />
Although <strong>the</strong> headwaters <strong>of</strong> <strong>the</strong> Helmand watershed is within Afghanistan’s territorial<br />
boundaries, Afghanistan’s rights to <strong>the</strong> use <strong>of</strong> that water are limited under international law, state<br />
practice, and long-standing water sharing agreements with Iran. Under customary international<br />
law, no riparian state has <strong>the</strong> exclusive right to <strong>the</strong> use <strong>of</strong> a transboundary river; instead each<br />
state’s sovereign right to develop a river is limited by <strong>the</strong> equal rights <strong>of</strong> o<strong>the</strong>r states to develop.<br />
The Goldsmid Arbitration Award in 1872 gave equal shares <strong>of</strong> <strong>the</strong> water in <strong>the</strong> lower reach <strong>of</strong><br />
<strong>the</strong> river to both Afghanistan and Iran. A key portion <strong>of</strong> <strong>the</strong> award language provides:<br />
"It is, moreover, to be well understood that no works are to be carried out on<br />
ei<strong>the</strong>r side calculated to interfere with <strong>the</strong> requisite supply <strong>of</strong> water <strong>for</strong> irrigation<br />
on both banks <strong>of</strong> Hirmand."<br />
100
After <strong>the</strong> Helmand River changed its course in 1896 and after a severe drought in 1902, <strong>the</strong> two<br />
governments attempted through arbitration to reach agreements in 1905 and again in 1938, but<br />
were unsuccessful. On September 7, 1950, <strong>the</strong> Afghan and Iranian governments signed <strong>the</strong><br />
“Terms <strong>of</strong> Reference <strong>of</strong> <strong>the</strong> Helmand River Delta Commission and an interpretative statement<br />
relative <strong>the</strong>reto, agreed by Conferees <strong>of</strong> Afghanistan and Iran” and established <strong>the</strong> Helmand<br />
River Delta Commission, with <strong>the</strong> assistance <strong>of</strong> <strong>the</strong> US Department <strong>of</strong> State. This Commission<br />
was designed to elaborate on <strong>the</strong> technical methods <strong>for</strong> sharing waters <strong>of</strong> <strong>the</strong> Helmand River, and<br />
was to be composed <strong>of</strong> three technical experts from disinterested states, with powers <strong>of</strong><br />
recommendation only. The 1951 recommendation <strong>of</strong> <strong>the</strong> Commission was rejected by both<br />
countries and <strong>the</strong> dispute over <strong>the</strong> division <strong>of</strong> water continued.<br />
Building <strong>of</strong> <strong>the</strong> Kajakai Dam in 1953 increased in-stream flow during <strong>the</strong> dry season but reduced<br />
<strong>the</strong> flood waters on which pastoralists were dependent <strong>for</strong> fertilization. Removing water from<br />
<strong>the</strong> river system upstream from <strong>the</strong> historical point-<strong>of</strong>-measurement (at Kamal Khan)<br />
complicated water sharing dialogue. Iranian Prime Minister Amir Abbas Hoveida and Afghan<br />
Prime Minister Mohammad Musa Shafiq signed an accord in 1973 that determined <strong>the</strong> specific<br />
amount <strong>of</strong> water that should flow into Iran: 22 cubic meters per second--with an option <strong>for</strong> Iran<br />
to purchase an additional 4 cubic meters per second in “normal” water years. However, this<br />
agreement was never fully implemented due to <strong>the</strong> Afghan coup d’état, <strong>the</strong> Soviet invasion <strong>of</strong><br />
Afghanistan, <strong>the</strong> Islamic revolution, and tensions between <strong>the</strong> Wahhabist Taliban and <strong>the</strong> Shia<br />
Tehran government. Although Iran and Afghanistan have held discussions with <strong>the</strong> Karzai<br />
government under <strong>the</strong> framework <strong>of</strong> <strong>the</strong> 1973 agreement, <strong>the</strong>y have been inconclusive to date.<br />
Current Status<br />
The Iranians have been eager to negotiate <strong>the</strong> status <strong>of</strong> <strong>the</strong> Helmand, Farah, and Hari Rud rivers<br />
in Afghanistan. They have tried to get Afghanistan to sign agreements over water, but <strong>the</strong><br />
Afghans have continued to demur claiming <strong>the</strong>y lack expertise and capacity to participate in<br />
transboundary water negotiation (EastWest Institute, 2009). The Afghans are correct in noting<br />
that <strong>the</strong>re are huge data gaps about local hydrology and water use that would need to be filled<br />
be<strong>for</strong>e negotiations were conducted, but at <strong>the</strong> same time, Afghanistan is, with US assistance,<br />
seeking to use and capture an increasing share <strong>of</strong> <strong>the</strong> Helmand, Farah, and Hari Rud rivers<br />
through agricultural projects and new dam construction and revitalization without conducting a<br />
comprehensive study on how <strong>the</strong> net effect <strong>of</strong> <strong>the</strong>se individuals projects would affect overall<br />
water flow and availability (USAID Water Atlas, 2008). These projects have raised concerns in<br />
Tehran over <strong>the</strong> geopolitical use <strong>of</strong> water. Fur<strong>the</strong>rmore, international donors are unlikely to be<br />
willing to fund needed infrastructure in Afghanistan if <strong>the</strong>re is no agreement governing water use<br />
between <strong>the</strong> two countries.<br />
For Iran, this is a serious security issue. Baluchistan is one <strong>of</strong> Iran’s most volatile regions, and<br />
Iran is sensitive to fears <strong>of</strong> <strong>for</strong>eign interference seeking to destabilize <strong>the</strong> Baluch population.<br />
Since 2004, Iran’s Sistan and Baluchistan province has witnessed regular attacks, bombings, and<br />
kidnappings at <strong>the</strong> hands <strong>of</strong> Jundullah, an ethnic Sunni Baluch group, which Iran has accused <strong>the</strong><br />
United States <strong>of</strong> supporting (<strong>the</strong> most recent attack was on Oct. 15, 2009). Moreover,<br />
Baluchistan remains Iran’s poorest and least educated region, and <strong>the</strong> population already feels<br />
disenfranchised by Tehran, isolation made worse by <strong>the</strong> blatantly fabricated results <strong>of</strong> Iran’s June<br />
elections. Iran’s reported support <strong>for</strong> different Taliban factions in Western Afghanistan could be<br />
potentially linked to its concerns over its water security, and Iran will likely continue to<br />
101
destabilize Western Afghanistan if <strong>the</strong> water dispute is not resolved. In March 2009, Afghan<br />
security <strong>for</strong>ces found a cache <strong>of</strong> Iranian-made explosives and ammunition around <strong>the</strong><br />
Bakhashabad Dam in Farah Province. The 2.2 million U.S. dollar construction project will<br />
substantially bolster <strong>the</strong> water and power supply to Afghan communities, but at <strong>the</strong> cost <strong>of</strong><br />
reducing <strong>the</strong> flow <strong>of</strong> water into neighboring Iran.<br />
Discussion & Strategy<br />
Afghanistan cannot proceed to build new dams, restore old dams, and take an increasingly<br />
greater fraction <strong>of</strong> shared groundwater and surface water resources from <strong>the</strong> Helmand, Farah,<br />
and Hari Rud rivers in Afghanistan without serious consequences if it does not equitably address<br />
<strong>the</strong> transboundary water issues with Iran. Moreover, international donors will not fund <strong>the</strong>se<br />
projects if an agreement with Iran, <strong>the</strong> downstream riparian, is not reached. As Afghanistan<br />
claims that it lacks <strong>the</strong> capacity and data to enter into any such negotiations, <strong>the</strong> US should be<br />
focused on increasing capacity on <strong>the</strong> technical level, creating monitoring systems that are<br />
transparent and shared, and building mechanisms <strong>for</strong> technical cooperation to <strong>the</strong> benefit <strong>of</strong> both<br />
countries. The proposed strategy implements this approach.<br />
1. Develop transparent and shared monitoring systems and databases <strong>for</strong> Afghanistan’s<br />
transboundary river basins to improve <strong>the</strong> scientific basis <strong>for</strong> any agreement. The major<br />
technological and knowledge deficit in <strong>the</strong> water sector restricts prospects <strong>for</strong> efficient<br />
management and use <strong>of</strong> water resources and hinders <strong>the</strong> policy development process<br />
(Homayoonnezhad et al., 2008; Meybeck et al., 2004; Peyman et al., 2006; Rahimzadeh et<br />
al., 2008; and Van Beek et al., 2008). Decision-makers need to know <strong>the</strong> quantity and quality<br />
<strong>of</strong> water in transboundary river basins be<strong>for</strong>e moving <strong>for</strong>ward with upstream projects that<br />
will affect in-stream flow as well as ground water levels. Accordingly, <strong>the</strong> international<br />
community—possibly under <strong>the</strong> direction <strong>of</strong> UNESCO, UNDP, or UNEP —should continue<br />
to help Afghanistan put in stream gauges, map glacier melt, record changes in precipitation<br />
and snow fall, and monitor water table depth and inflows and outflows to underground<br />
aquifers associated with those river basins. Based on <strong>the</strong>se data, dynamic models <strong>of</strong> water<br />
flow <strong>for</strong> each transboundary basin should be developed to predict <strong>the</strong> potential impacts <strong>of</strong><br />
agricultural projects, population growth, climate change, and infrastructure projects on<br />
downstream water flow and quantity. Development <strong>of</strong> this knowledge base would allow <strong>the</strong><br />
parties to negotiate water sharing agreements that are more sensitive to and cognizant <strong>of</strong><br />
seasonal, interannual, and long-term changes in water flow in Afghanistan and throughout<br />
<strong>the</strong> region. These data should be available on-line in close to real time, and shared with<br />
surrounding countries. The monitoring stations and infrastructure should be opened to<br />
inspections by participating countries, as well as observer states and organizations. The<br />
international community should look beyond aid delivery at just <strong>the</strong> national level and<br />
incorporate regional water strategies into policy development and aid programming, and<br />
work with <strong>the</strong> UN Assistance Mission to Afghanistan to improve coordination <strong>of</strong> waterrelated<br />
donor aid.<br />
2. Identify historical hydrometeorological baseline data to better understand changes in water<br />
availability in Afghanistan’s river systems. Afghanistan’s 30 years <strong>of</strong> civil war have<br />
interrupted data collection on <strong>the</strong> amount <strong>of</strong> water moving through its river basins since <strong>the</strong><br />
agreements negotiated in <strong>the</strong> 1950s-1970s (Helmand River Delta Commission Report, 1951).<br />
102
Discussions with scientists at <strong>the</strong> <strong>National</strong> Center <strong>for</strong> Atmosphere Research suggest that<br />
Afghanistan’s river systems probably have less water in <strong>the</strong> last fifty years due to global<br />
warming, similar to patterns found in o<strong>the</strong>r transboundary river systems in <strong>the</strong> region, and<br />
may see fur<strong>the</strong>r decreases in <strong>the</strong> future. There are ways to develop proxies <strong>for</strong> past changes<br />
in water distribution and flow, including looking at past records <strong>of</strong> well depth, time series<br />
remote sensing imaging <strong>of</strong> glaciers, snow cover, and rivers, and pre-existing river gauges.<br />
The United States should assist Afghanistan in establishing historical baseline in<strong>for</strong>mation on<br />
water flow – such as obtaining <strong>the</strong> Fairchild Aerial Survey dataset and sharing commercial<br />
remotely sensed images <strong>of</strong> its critical watersheds. Establishing <strong>the</strong> extent <strong>of</strong> previous water<br />
flow is important to adequately predict future changes, and to adjust previous water sharing<br />
agreements in light <strong>of</strong> current realities.<br />
3. Create a Transboundary Commission between Afghanistan & Iran to manage transboundary<br />
water resources. The Transboundary Commission should serve as a <strong>for</strong>mal body to<br />
negotiate water sharing agreements, collect and share data, and building confidence and<br />
capacity on both sides. It should have as its initial mandate <strong>the</strong> creation <strong>of</strong> a technical<br />
working group <strong>of</strong> 3 representatives from disinterested countries (agreed upon by Iran and<br />
Afghanistan) to review <strong>the</strong> entire course <strong>of</strong> <strong>the</strong> Helmand and to assess existing and planned<br />
infrastructure, agriculture production, and population density and growth. The technical<br />
working group would oversee data collection, monitoring, and modeling <strong>of</strong> <strong>the</strong> Helmand<br />
River Basin (including <strong>the</strong> Farah River), assess future changes, and make recommendations.<br />
4. Build capacity <strong>for</strong> water management and increase irrigation efficiency. The United States,<br />
U.N. and international organizations and agencies, and partner states, should build capacity<br />
in Iran and Afghanistan to collect, interpret, model, and maintain <strong>the</strong> water databases, to<br />
better understand international law governing shared water resources, and to build capacity<br />
<strong>for</strong> negotiations (Chavoshian et al., 2005; McMurray et al., 2005). Technical <strong>of</strong>ficials from<br />
<strong>the</strong>se states should study to o<strong>the</strong>r regional water sharing commissions, such as <strong>the</strong> Mekong<br />
River Commission, Colorado River Commission and <strong>the</strong> Nile River Basin Commission.<br />
5. Build an international support network <strong>for</strong> negotiations on water. The United States is no<br />
longer a disinterested country, nor necessarily a trusted partner, <strong>for</strong> ei<strong>the</strong>r party to <strong>the</strong><br />
dispute. Accordingly, <strong>the</strong> US should continue ef<strong>for</strong>ts to build an international support<br />
network <strong>for</strong> resolution <strong>of</strong> <strong>the</strong> transboundary water dispute. The US should push <strong>for</strong><br />
expansion <strong>of</strong> <strong>the</strong> existing Water Sector Group – which includes <strong>the</strong> United Nations<br />
Assistance Mission in Afghanistan, <strong>the</strong> Canadian International Development Agency, <strong>the</strong><br />
United States Army Corps <strong>of</strong> Engineers, <strong>the</strong> European Commission, <strong>the</strong> German<br />
Development Association (GTZ), USAID, and <strong>the</strong> Dutch Embassy to include o<strong>the</strong>r potential<br />
donors and implementing agencies. These may include <strong>the</strong> UNDP, UNEP, OSCE, World<br />
Bank, and Asian Development Bank, as well as key NGOs such as <strong>the</strong> Wildlife Conservation<br />
Society, which work in both countries.<br />
Conclusion<br />
Afghanistan’s plans <strong>for</strong> upgrading and developing its water infrastructure on each <strong>of</strong> its major<br />
river basins are aimed at exploiting <strong>the</strong> irrigation and energy potential <strong>of</strong> its rivers and at<br />
mitigating floods. While crucial to <strong>the</strong> social and economic development <strong>of</strong> Afghanistan, <strong>the</strong>se<br />
plans will also impact transboundary water flow and as a result Afghanistan’s relations with its<br />
neighbors. Failure to address water concerns in <strong>the</strong> middle and lower Helmand River, <strong>the</strong> Farah<br />
River, and <strong>the</strong> Hari Rud watersheds can have <strong>the</strong> potential to increase tensions between Iran and<br />
103
Afghanistan explosively, slowing or preventing stability gains in Afghanistan’s West, and<br />
interfering with <strong>the</strong> success <strong>of</strong> important development projects in agriculture and energy<br />
generation. Moreover, Iran increasingly sees threats to its water security as threats to its own<br />
security, and will seek to destabilize <strong>the</strong> region, possibly through support <strong>for</strong> its natural<br />
adversaries, such as <strong>the</strong> Taliban. However, <strong>the</strong> adroit handling <strong>of</strong> water concerns could<br />
encourage closer cooperation with Iran on stability and development in Afghanistan and<br />
potentially even create a framework <strong>for</strong> U.S. cooperation with Iran.<br />
104
Appendix 1: Projected Changes in Global Water Stress<br />
Figure 1: Projected changes in global water stress. Source: Alcamo, J. et al. 2007. “Future long-term changes in<br />
global water resources driven by socio-economic and climatic changes,” Journal <strong>of</strong> Hydrological Sciences 52(2).<br />
105
Appendix 2.<br />
Figure 2. Central Afghanistan Winter Snow Pack Comparison (Though 2 years <strong>of</strong> data do not indicate a “trend,”<br />
<strong>the</strong>se examples illustrate <strong>the</strong> wide range <strong>of</strong> coverage difference. N.B.: These images do NOT address <strong>the</strong> amount <strong>of</strong><br />
water that is in <strong>the</strong> snow pack.)<br />
Figure 3. Change in crop production from 2007-2008. (Note “better than last year” color in Nimruz Province. If<br />
water is redirected upstream, less will be available <strong>for</strong> irrigation in this potentially productive area.)<br />
106
Source <strong>for</strong> Figures 2 and 3: USDA Foreign Agricultural Service, Commodity Intelligence Report.<br />
“AFGHANISTAN: Severe Drought Causes Major Decline in 2008/09 Wheat Production” August 12, 2008.<br />
↑ Back to <strong>the</strong> top<br />
References:<br />
Alcamo, J., M. Florke, and M. Marker. 2007. “Future long-term changes in global water<br />
resources driven by socio-economic and climatic changes,” in Hydrological Sciences Journal,<br />
Vol. 52, Issue 2, (April), pgs. 247-275.<br />
Arbitral Opinion <strong>of</strong> General Sir Frederic Goldsmid, arbitrator <strong>for</strong> adjustment and settlement <strong>of</strong><br />
<strong>the</strong> rights <strong>of</strong> Iran and Afghanistan with regard to land and water problems <strong>of</strong> <strong>the</strong> Seistan, 1872.<br />
Unpublished manuscript. (When we have received permission to share <strong>the</strong> original document,<br />
access in<strong>for</strong>mation will be provided.)<br />
Asian Development Bank (ADB) 2009. Climate change threatens water, food security <strong>of</strong> 1.6<br />
billion South Asians. Available from Relief Web,<br />
http://www.reliefweb.int/rw/rwb.nsf/db900SID/KHII-7VH7TW?OpenDocument [Accessed 06<br />
Sept 2009].<br />
Award <strong>of</strong> Arbitration by Col. I. H. McMahon, Special Envoy <strong>of</strong> H. M. <strong>the</strong> King <strong>of</strong> England and<br />
Emperor <strong>of</strong> India and Arbitrator <strong>for</strong> <strong>the</strong> delimitation <strong>of</strong> <strong>the</strong> frontier between Iran and Afghanistan<br />
and <strong>the</strong> water questions in Seistan, 1905. Unpublished manuscript. (When we have received<br />
permission to share <strong>the</strong> original document, access in<strong>for</strong>mation will be provided.)<br />
Bates, B., Z.W. Kundzewicz, W. Shaohong, and J. Palutik<strong>of</strong> (eds.) 2008. Climate Change and<br />
Water. Technical Paper <strong>of</strong> <strong>the</strong> Intergovernmental Panel on Climate Change, IPCC Secretariat,<br />
Geneva, 210 pp.<br />
Batson, D. 2008. Registering <strong>the</strong> Human Terrain: A Valuation <strong>of</strong> Cadastre. Washington, DC:<br />
<strong>National</strong> Defense Intelligence College.<br />
Chavoshian, S. A., K. Takeuchi, and S. Funada. 2005. “An Overview to Transboundary and<br />
Shared Water Resources Management in Iran, Technical Challenges and Solutions,” in Role <strong>of</strong><br />
Water Science in Transboundary River Basin Management. (volume editor and publisher not<br />
given. Place <strong>of</strong> publication given as “Thailand.”)<br />
Collins, M., CMIP Modelling Groups (BMRC (Australia), CCC (Canada), CCSR/NIES (Japan),<br />
CERFACS (France), CSIRO (Australia), MPI (Germany), GFDL (USA), GISS (USA), IAP<br />
(China), INM (Russia), LMD (France), MRI (Japan), NCAR (USA), NRL (USA), Hadley Center<br />
(UK), and YNU (South Korea)). 2005. “El Nino or La Nina-like climate change?” in Climate<br />
Dynamics, vol 24, pgs. 89-104 (DOI 10.1007/s00382-004-0478x)<br />
Dept <strong>of</strong> State In<strong>for</strong>mation Memorandum. 2009. “Afghan Trans-boundary/Riparian Rights<br />
Dialog—time <strong>for</strong> Action,” from ECON- Tom Engle, Counselor to Anthony Wayne.<br />
East West Institute. 2009. Symposium “Alternative Futures <strong>for</strong> Afghanistan and <strong>the</strong> Stability <strong>of</strong><br />
Southwest Asia: Improving Regional cooperation on Water. Session 4: The Helmand River<br />
Basin and <strong>the</strong> Harirud and Murghab Rivers,” 25 June 2009, EastWest Institute Brussels Centre,<br />
Brussels, Belgium. See http://www.ewi.info/water-security-southwest-asia [Accessed 06 Sept<br />
2009]<br />
107
Food and Agriculture Organization (FAO) <strong>of</strong> <strong>the</strong> United Nations. 1962. Survey <strong>of</strong> Land and<br />
Water Resources: AFGHANISTAN General Report. New York: United Nations Special Fund.<br />
Favre, R. and G. M. Kamal. 2004. Watershed Atlas <strong>of</strong> Afghanistan: 1st Edition Working<br />
Document <strong>for</strong> Planners. AIMS and FAO supported publication.<br />
(need to get web address!)<br />
Heath, R. 1983. Basic ground-water hydrology: U.S. Geological Survey Water-Supply Paper<br />
2220, 86 p.<br />
Helmand River Delta Commission Report and Recommendation on <strong>the</strong> Distribution <strong>of</strong> Helmand<br />
Water, 1951. (This in<strong>for</strong>mation came from <strong>the</strong> unpublished draft manuscript <strong>of</strong> The Hirmand<br />
River Dispute.)<br />
Homayoonnezhad, P. I., Amirian, and I. Piri. 2008. “Investigation on Water Quality <strong>of</strong> Zabol<br />
Chahnimeh Reservoirs, The Effective Means <strong>for</strong> Development <strong>of</strong> Water Management <strong>of</strong> Sistan<br />
and Baloochestan Province, Iran,” in world Applied Sciences Journal, vol. 5, issue 3, pgs. 378-<br />
382.<br />
IRIN NEWS.ORG. 30 July 2007. AFGHANISTAN: Environmental crisis looms as conflict goes<br />
on. United Nations Office <strong>for</strong> <strong>the</strong> Coordination <strong>of</strong> Humanitarian Affairs. Available from<br />
http://www.globalsecurity.org/military/library/news/2007/07/mil-070730-irin01.htm [Accessed<br />
06 Sept 2009].<br />
Lightfoot, D. 2009. Survey <strong>of</strong> Infiltration Karez in Nor<strong>the</strong>rn Iraq: History and Current Status <strong>of</strong><br />
Underground Aqueducts. UNESCO publication. Accessed 08 November 2009 at<br />
http://www.iauiraq.org/reports/UNESCO_Karez_survey_report_FINAL.pdf<br />
McMurray, J.C. and d. Tarlock. 2005. “The Law <strong>of</strong> Later-Developing Riparian States: The Case<br />
<strong>of</strong> Afghanistan,” in NYU Environmental Law Journal, vol. 12, pgs. 711-763.<br />
Meybeck, M. and C. Vorosmarty. 2004. “The Integrity <strong>of</strong> River and Drainage Basin Systems:<br />
Challenges from Environmental Changes,” in Kabat, P., et al. Eds., Vegetation, Water, Humans,<br />
and <strong>the</strong> Climate: A New Perspective on an Interactive System. Global Environmental Action<br />
International Conference, Tokyo, Oct 14-16.<br />
Mustafa, D. and M. U. Qazi. 2007. “Transition from Karez to Tubewell Irrigation:<br />
Development, Modernization, and Social Capital in Balochistan, Pakistan,” in World<br />
Development, vol. 35, number 10, pp. 1796-1813.<br />
Peyman, D. A. And M. Tajrishy. 2006. “Estimation <strong>of</strong> Free Water Evaporation from hamun<br />
Wetlands Using Satellite Imagery,” Available from<br />
http://ewrc.sharif.edu/pdf_folder/01%20Arasteh.pdf [Accessed 06 Sept 2009].<br />
Rahimzadeh, F., A. Asgari, and E. Fattahi. 2008. “Variability <strong>of</strong> extreme temperature and<br />
precipitation in Iran during recent decades,” in International Journal <strong>of</strong> Climtology, DOI:<br />
10.1002/joc.1739.<br />
USDA Foreign Agricultural Service, Commodity Intelligence Report. 2008.<br />
“AFGHANISTAN: Severe Drought Causes Major Decline in 2008/09 Wheat Production”<br />
August 12, 2008<br />
108
UNEP. 29 January 2003. UNEP report chronicles environmental damage <strong>of</strong> <strong>the</strong> Afghanistan<br />
conflict. Available from<br />
http://new.unep.org/Documents.Multilingual/Default.asp?DocumentID=277&ArticleID=3201&l<br />
=en [Accessed 17 April 2009].<br />
UNEP Post-Conflict Branch. 2006. History <strong>of</strong> Environmental Change in <strong>the</strong> Sistan Basin Based<br />
on Satellite Image Analysis: 1976-2005. Nairobi, Kenya: UNEP/PCoB.<br />
USAID. 2008. Water Atlas (Afghanistan), sections 19-20 on middle and lower Helmand and<br />
section 21 on Sistan watershed contain discharge data from 1978.<br />
U. S. Army Engineer Research and Development Center. 2002. Water Resources Areal<br />
Appraisal <strong>of</strong> Afghanistan. Alexandria, VA: USACE Topographic Engineering Center.<br />
(This publication notes that <strong>the</strong> water table may have wide seasonal fluctuations. Recommends<br />
“extensive reconnaissance and exploratory drilling are necessary to locate zones <strong>of</strong> maximum<br />
yield and best quality water.”)<br />
U.S. Army Geospatial Center. 2009. Provincial Water Resources Data Summary <strong>of</strong> Helmand<br />
(Province), Afghanistan. Alexandria, VA: USACE AGC. Local Reality: Afghanistan Research<br />
and Evaluation Unit Issues Paper Series. Available from www.areu.org.af [Accessed 25 May<br />
2009].<br />
Whitney, J. W. 2006. Geology, water, and wind in <strong>the</strong> lower Helmand Basin, sou<strong>the</strong>rn<br />
Afghanistan: U.S. Geological Survey <strong>Scientific</strong> Investigation Report 2006-5182, 40 p.<br />
Williams-Seth, T. 2008. Streamflow Characteristics <strong>of</strong> Streams in <strong>the</strong> Helmand Basin,<br />
Afghanistan. USGS Fact Sheet 2008-3059.<br />
Zimmerman, J. B., J. R. Mihelcic, and J. Smith. 2009. “Global Stressors on Water Quality and<br />
Quantity,” in Environmental Science & Technology, (June 15), pgs. 4247-4254.<br />
(This publication only covers <strong>the</strong> middle Helmand River in Helmand Province.)<br />
Van Beek, E., B. Bozorgy, Z. Vekerdy, and K. Meijer. 2008. “Limits to agricultural growth in<br />
<strong>the</strong> Sistan closed Inland Delta, Iran,” in Irrigation Drainage Systems, vol 22, pgs. 131-143.<br />
Warner, K., C. Ehrhart, A. deSherbinin, S. Adamo, and T. Chai-Onn. 2009. In Search <strong>of</strong> Shelter:<br />
Mapping <strong>the</strong> Effects <strong>of</strong> Climate Change on Human Migration and Displacement. Available from<br />
http://ciesin.columbia.edu/publications.html [Accessed 20 July 2009]<br />
Wegerich, Kai. Water Strategy Meets<br />
109
2.4. Changing <strong>of</strong> Climate and State Wea<strong>the</strong>r<br />
2.4.A. Maintaining Geopolitical and Social Stability throughout a Global<br />
Economy in an Era <strong>of</strong> Climate Change (James Diaz)<br />
Author and Organization: Dr. James Diaz, Pr<strong>of</strong>essor <strong>of</strong> Public Health and Preventive Medicine,<br />
Director, Environmental and Occupational Health Sciences, Schools <strong>of</strong> Public<br />
Health and Medicine, Louisiana State University<br />
Contact In<strong>for</strong>mation: jdiaz@lsuhsc.edu<br />
Introduction<br />
In its 2007 Fourth Assessment Report, <strong>the</strong> Intergovernmental Panel on Climate Change (IPCC)<br />
concluded that mean land surface temperatures had increased by 0.74° C every decade since. 1<br />
Thus, <strong>the</strong>re now appears to be uni<strong>for</strong>m agreement in <strong>the</strong> international scientific community that<br />
<strong>the</strong> earth is warming from a variety <strong>of</strong> climatic effects. Although <strong>the</strong> exact contributions <strong>of</strong><br />
climatic effects on global warming are unknown, <strong>the</strong> major climatic effects include long-term<br />
cyclical wea<strong>the</strong>r patterns and, even more importantly, manmade greenhouse gas emissions and<br />
<strong>the</strong>ir cascading effects on melting polar icecaps and rising sea levels.<br />
Most reports to date <strong>of</strong> <strong>the</strong> public health impact <strong>of</strong> global warming have featured heat stroke<br />
deaths following heat waves, drowning deaths in floods and tsunamis, and mosquito-borne<br />
disease outbreaks following prolonged drought-flood cycles. As nighttime temperatures warm<br />
and glaciers and permafrost retreat into <strong>the</strong> highlands, <strong>the</strong> geographic distribution ranges <strong>of</strong><br />
mosquito and tick-borne diseases have now extended to higher altitudes and to new regions in<br />
<strong>for</strong>merly disease-free areas with competent insect vectors. The ultimate effects <strong>of</strong> global<br />
warming on rainfall, drought, tropical cyclone (hurricane), and tsunami activity will have far<br />
reaching human health and public safety impacts; not only on wea<strong>the</strong>r-related infectious disease<br />
outbreaks, but also on world food production and supplies, access to clean drinking water,<br />
immigration, urban relocation, and civil strife. The ultimate challenge <strong>for</strong> <strong>the</strong> US will be to<br />
assume leadership in maintaining geopolitical and social stability throughout <strong>the</strong> global economy<br />
in an era <strong>of</strong> climate change.<br />
For starting targets, <strong>the</strong> World Health Organization (WHO) has now specifically identified and<br />
ranked <strong>the</strong> five major health consequences <strong>of</strong> climate change that need to be addressed to<br />
preserve <strong>the</strong> global economy and to reduce worldwide civil strife, including piracy, coups<br />
d’états, sectarian and tribal violence. The WHO’s five major health consequences <strong>of</strong> climate<br />
change include (1) <strong>the</strong> vulnerability <strong>of</strong> food supplies to droughts, floods, over-fishing, and poor<br />
agricultural practices, such as soil conservation, with consequent malnutrition, famine, and<br />
refugee relocation, (2) waterborne infectious disease outbreaks, especially cholera in Africa and<br />
Bangladesh, following prolonged drought, and poisoning from contaminated water wells (usually<br />
by arsenic in Bangladesh), (3) diarrheal diseases following more frequent drought-flood cycles,<br />
(4) heat waves in mega-cities with high <strong>the</strong>rmal masses (also known as urban “heat-islands”)<br />
with increasing heat-related morbidity and mortality in <strong>the</strong> elderly with chronic cardiovascular<br />
diseases and in persons with ozone-sensitive asthma, and (5) vector-borne disease outbreaks,<br />
especially malaria, Chikungunya virus, and dengue fever, following more frequent drought-flood<br />
cycles, in expanded geographic distributions.<br />
110
How Good are <strong>the</strong> Prediction Models?<br />
Since <strong>the</strong> 1980s, <strong>the</strong> outcomes <strong>of</strong> climatic change on human health have received more attention,<br />
climate-change-associated infectious disease outbreaks have been described and investigated,<br />
and several climate prediction models have been developed by nations and intergovernmental<br />
panels. Recently, <strong>the</strong>se global climate models have become even more comprehensive and<br />
include more detailed analyses at finer geospatial resolutions <strong>of</strong> ocean temperature fluctuations,<br />
ice cap and sea ice thickness, carbon cycle dynamics, greenhouse gas emissions, outgoing long<br />
wave radiation effects (as surrogates <strong>for</strong> drought conditions), and vegetation indices (as<br />
surrogates <strong>for</strong> rainfall). Some <strong>of</strong> <strong>the</strong> areas <strong>of</strong> convergence and divergence among global climate<br />
change models are compared in Table 2.4.A-1. 2,3<br />
Table 2.4.A-1. The Predictive Models <strong>of</strong> Climate Change<br />
Climate<br />
Changes<br />
Temperature<br />
Drought<br />
Precipitation<br />
Tropical<br />
Cyclones<br />
(Hurricanes)<br />
Intergovernmental Panel on<br />
Climate Change-Fourth<br />
Assessment Report<br />
Uneven Warming<br />
Troposphere > Stratosphere<br />
Land > Sea<br />
Higher > Lower Latitudes<br />
Night > Day<br />
British Hadley Centre<br />
<strong>for</strong> Climate Prediction<br />
and Research<br />
Slower Warming<br />
Canadian Centre <strong>for</strong><br />
Climate Modeling and<br />
Analysis<br />
Faster Warming<br />
Regional Increase Regional Increase Widespread Increase<br />
Eastern Hemisphere > Western<br />
Hemisphere<br />
Eastern Hemisphere ><br />
Western Hemisphere<br />
Eastern Hemisphere ><br />
Western Hemisphere<br />
Sou<strong>the</strong>rn Hemisphere > Nor<strong>the</strong>rn<br />
Hemisphere<br />
Uneven Increase Regional Increase Limited Increase<br />
Rainfall > Snowfall<br />
Rainfall > Snowfall Rainfall > Snowfall<br />
Coastal > Interior<br />
Nor<strong>the</strong>rn Hemisphere > Sou<strong>the</strong>rn<br />
Hemisphere<br />
Western Hemisphere > Eastern<br />
Hemisphere<br />
Increasing Increasing Increasing<br />
Both Atlantic and Pacific Oceans Atlantic Ocean > Pacific Pacific Ocean > Atlantic<br />
Ocean<br />
Ocean<br />
Demographics and Human Behaviors in a Global Economy<br />
Besides climatic and ecosystem changes, many o<strong>the</strong>r factors will influence <strong>the</strong> onset <strong>of</strong> emerging<br />
and re-emerging infectious disease outbreaks, including population demographics, <strong>the</strong><br />
globalization <strong>of</strong> trade and travel, <strong>the</strong> globalization and industrialization <strong>of</strong> <strong>the</strong> world’s food<br />
supplies, new vector-pathogen-host relationships, human health behaviors, and human host<br />
susceptibilities.<br />
111
Today’s Population Demographics<br />
The nations that were <strong>the</strong> first to organize around large cities, such as London, Paris, New York,<br />
and Tokyo, are <strong>the</strong> most developed nations today, <strong>of</strong>fering more opportunities and services at<br />
less cost than dispersed rural areas. Today more than 50% <strong>of</strong> <strong>the</strong> world’s populations <strong>of</strong> over 6<br />
billion people are urban dwellers, and more than 90% <strong>of</strong> <strong>the</strong> world’s population lives within less<br />
than 100 miles <strong>of</strong> seacoasts. 4 Soon <strong>the</strong> five largest mega-cities will be Tokyo, Mumbai, Dhaka,<br />
Sao Paolo, Mexico City, and Delhi, each with over 20 million residents. 5 The greatest threats<br />
modern mega-cities face now (and will face into <strong>the</strong> <strong>for</strong>eseeable future) come from global<br />
warming: a finite supply <strong>of</strong> fossil fuels and freshwater, terrorism, infectious disease pandemics,<br />
and natural and man-made disasters. Coastal city dwellers in Galveston and New Orleans, <strong>for</strong><br />
example, may have to relocate to higher ground to avoid hurricane storm and tidal surges and<br />
combine with more inland cities, such as Houston and Baton Rouge, <strong>for</strong> improved protection and<br />
greater economic opportunity. Terrorists will continue to exploit available technologies,<br />
including abandoned nuclear warheads and bio-weaponized microbes, in order to attack persondense<br />
targets <strong>of</strong> opportunity (in hotels as in <strong>the</strong> incident in Mumbai on November 26, 2008, in<br />
high-rise <strong>of</strong>fice buildings as in <strong>the</strong> September 11, 2001, World Trade Center attacks, in airports,<br />
train, and subway stations as in <strong>the</strong> Tokyo and Madrid incidents, as well as in stadiums, water<br />
treatment facilities, chemical and nuclear power plants). Just as <strong>the</strong> Victorians <strong>of</strong> London<br />
acclimatized to epidemic threats from cholera in <strong>the</strong> 1850s, modern city residents must<br />
acclimatize to modern-day threats <strong>of</strong> natural and man-made disasters.<br />
Never<strong>the</strong>less, new or returning infectious disease threats will remain ever present. According to<br />
<strong>the</strong> WHO’s World Malaria Report, 2005, 3.2 billion people live in malaria-endemic regions in<br />
107 countries and territories, and <strong>the</strong>re are between 350 million to 500 million cases worldwide<br />
per year, with 840,000 to 1.2 million deaths from malaria annually. 6 Today, malaria is most <strong>of</strong>ten<br />
imported into <strong>the</strong> industrialized world by an infected migrant worker or air traveler, and<br />
imported malaria cases are now increasing and expected to continue increasing. A ranking <strong>of</strong> <strong>the</strong><br />
most common lethal infectious diseases in <strong>the</strong> world today include malaria, tuberculosis (TB),<br />
human immunodeficiency virus (HIV, <strong>the</strong> AIDS pathogen), and influenza. Malaria is now<br />
hyperendemic in sub-Saharan Africa and Asia, HIV and TB are pandemic worldwide, and<br />
influenza re-assorts its genes with animals and man periodically to threaten recurring pandemics<br />
<strong>of</strong> avian flu (H5NI avian-origin influenza A) and swine flu or novel influenza A (H1N1). 7<br />
The Vulnerability <strong>of</strong> a Globalized Food Supply: The Melamine Tragedy<br />
In early 2007, <strong>the</strong> US Food and Drug Administration (FDA) ordered a national recall <strong>of</strong> most<br />
commercial pet foods following more than a dozen deaths and hundreds <strong>of</strong> cases <strong>of</strong> kidneyrelated<br />
illnesses in domestic cats and dogs. This was <strong>the</strong> largest food recall in US history. A<br />
subsequent trace-back investigation revealed that <strong>the</strong> wheat flour in <strong>the</strong> pet foods was<br />
intentionally contaminated in China with melamine, a protein look-alike used in fertilizers and<br />
plastics, and a related chemical, cyanuric acid, known to cause kidney stones in animals. 8<br />
Despite <strong>the</strong> recall and precise identification <strong>of</strong> <strong>the</strong> nephrotoxins, <strong>the</strong> Chinese continued to add<br />
melamine and cyanuric acid to food products, specifically watered-down infant <strong>for</strong>mulas, and<br />
o<strong>the</strong>r dairy products, to boost <strong>the</strong>ir protein contents and market prices. 9 In September 2008, <strong>the</strong><br />
Chinese reported that over 50,000 infants and children had been hospitalized in China after<br />
consuming melamine-contaminated dairy products, with more than a dozen deaths from kidney<br />
stones and kidney failure. In November 2008, <strong>the</strong> FDA detected melamine and/or cyanuric acid<br />
(<strong>the</strong> combination <strong>of</strong> both is <strong>the</strong> most toxic) in at least four US food products; and <strong>the</strong> Director <strong>of</strong><br />
112
<strong>the</strong> FDA Center <strong>for</strong> Food Safety and Applied Nutrition made <strong>the</strong> following pronouncements:<br />
(1) <strong>the</strong> Chinese dairy products were intentionally adulterated with high levels <strong>of</strong> melamine and<br />
cyanuric acid not ordinarily present in legitimately produced dairy products, (2) melamine could<br />
leach out from <strong>for</strong>mula can liners, (3) cyanuric acid was <strong>of</strong>ten used to sanitize equipment used in<br />
<strong>the</strong> production <strong>of</strong> infant <strong>for</strong>mula, and (4) fur<strong>the</strong>r testing and monitoring <strong>of</strong> infant dairy products<br />
were not planned due to an inability to detect low adverse effect levels. Consumer-watchdog<br />
groups have noted that <strong>the</strong>se lowest adverse effect levels, especially those resulting from <strong>the</strong><br />
combination <strong>of</strong> toxicants, have yet to be determined. Fur<strong>the</strong>r domestic US and in-country testing<br />
and monitoring <strong>of</strong> Chinese production practices would appear to be indicated. 10<br />
The melamine tragedy highlighted <strong>the</strong> serious hazards <strong>of</strong> <strong>the</strong> globalized food chain and<br />
underscored <strong>the</strong> inability <strong>of</strong> <strong>the</strong> FDA to protect <strong>the</strong> US food supply in a global economy. The<br />
FDA record on assuring <strong>the</strong> safety <strong>of</strong> imported drugs is no better given <strong>the</strong> recent deaths and<br />
allergic reactions to contaminated Chinese-manufactured heparin administered to thousands <strong>of</strong><br />
US patients <strong>for</strong> temporary anticoagulation during cardiovascular interventions, open heart<br />
surgery, and intravenous infusions.<br />
The Globalization <strong>of</strong> Trade and Travel: Sea Trade<br />
Infected arthropod vectors, infected animal hosts such as rodents and exotic pets, and even<br />
virulent microbes travel well at sea, especially in hot and humid ship cargo holds and in cargo<br />
containers. Recent outbreaks <strong>of</strong> cholera in Ecuador and Peru have followed increased shipping<br />
trade with Sou<strong>the</strong>ast Asia, where Vibrio cholerae is endemic in coastal estuaries. Traceback<br />
investigations have demonstrated that container vessels pump contaminated saltwater ballast into<br />
<strong>the</strong>ir hulls in <strong>the</strong>ir home ports <strong>for</strong> smoo<strong>the</strong>r transoceanic sailing and <strong>the</strong>n discharge ballast prior<br />
to unloading in distant ports with warming estuaries. 11 Such practices can effectively import<br />
cholera bacteria, marine viruses, and even harmful algae to new, warming marine ecosystems<br />
and fisheries, causing microbial and algal toxin contamination <strong>of</strong> shellfish beds and regional<br />
marine fisheries. 12<br />
Monkeypox Arrives by Sea, and Cowpox Will Too<br />
Recently <strong>the</strong> exotic pet trade imported monkeypox to <strong>the</strong> US in infected pet rodents. In 2003, 53<br />
cases <strong>of</strong> monkeypox were reported among three Midwestern US states—Illinois, Indiana, and<br />
Wisconsin. 13 Fortunately <strong>the</strong>re were no deaths, but 14 patients were hospitalized <strong>for</strong> supportive<br />
treatment, including one child with encephalitis. The monkeypox virus, a smallpox-like<br />
orthomyxovirus, was first isolated in <strong>the</strong> Congo River basin <strong>of</strong> West Africa in 1968. After an<br />
incubation period <strong>of</strong> 1-2 weeks, monkeypox is characterized by an onset <strong>of</strong> headache, fever,<br />
fatigue, and backache, followed by a characteristic rash. The monkeypox rash is similar to<br />
smallpox and cowpox, with evolving macules, vesicles, and pustules that crust over and heal<br />
with 14-21 days. Unlike smallpox, pronounced lymphadenopathy (swollen local lymph nodes) is<br />
usually present, and complications may include pneumonia and encephalitis. Although personto-person<br />
transmission may occur, infection is usually transmitted by contact with contaminated<br />
animals. 14 The case fatality rate (CFR) ranges from 1-10%, with higher CFRs in young<br />
children. 15<br />
The source <strong>of</strong> <strong>the</strong> monkeypox virus introduced into <strong>the</strong> US was later identified as infected giant<br />
Gambian rats imported from Ghana to Texas and sold to an Illinois pet distributor, who housed<br />
<strong>the</strong> animals toge<strong>the</strong>r prior to sale to pet shop owners and o<strong>the</strong>rs. Although <strong>the</strong> monkeypox virus<br />
is endemic in West African river basins, including <strong>the</strong> Gambia and Congo, <strong>the</strong> warming, humid<br />
113
ecosystem <strong>of</strong> <strong>the</strong> massive Mississippi River drainage basin in <strong>the</strong> Midwestern US clearly<br />
supported <strong>the</strong> transmission <strong>of</strong> <strong>the</strong> virus from imported rodents to domestic rodents, especially<br />
prairie dogs and squirrels, and to rabbits. The close contact between pet owners and <strong>the</strong>ir pets<br />
permitted <strong>the</strong> transmission <strong>of</strong> <strong>the</strong> zoonotic infection, <strong>for</strong> which <strong>the</strong>re is no specific treatment, to<br />
humans. If sentinel animal surveillance and disease control initiatives fail, monkeypox, cowpox,<br />
and o<strong>the</strong>r exotic pox viruses will become unwelcomed but firmly established zoonosis in <strong>the</strong> US<br />
as a direct result <strong>of</strong> relaxed free trade regulations, <strong>the</strong> exotic pet trade, domestic animal<br />
importation, and a warming, welcoming ecosystem.<br />
This Vector Came by Sea, but its Pathogens will Come by Air<br />
The worldwide spread <strong>of</strong> <strong>the</strong> Asian tiger mosquito, Aedes albopictus, by imported tire shipments<br />
on container ships from Sou<strong>the</strong>ast Asia and Japan, has introduced a new secondary (to Aedes<br />
aegypti) vector <strong>for</strong> dengue virus in endemic regions. In addition, A. albopictus has genetically<br />
adapted itself to be a competent new vector <strong>for</strong> Chikungunya virus and has caused Chikungunya<br />
virus epidemics in India and <strong>the</strong> Indian Ocean Islands, very popular island destination resorts <strong>for</strong><br />
wealthy Europeans. More recently, co-infections with dengue and Chikungunya viruses have<br />
been reported from Africa and India. Chikungunya-infected air travelers returning to Europe<br />
from Chikungunya-endemic regions have imported a new viral pathogen <strong>for</strong> A. albopictus to<br />
transmit locally. Imported Chikungunya has been reported in France, Italy, and <strong>the</strong> UK; and an<br />
outbreak <strong>of</strong> autochthonous or locally transmitted (by A. albopictus) has been reported in Italy.<br />
Like West Nile virus, which arrived in <strong>the</strong> US by air from Africa or <strong>the</strong> Middle East in 1999, it is<br />
simply a matter <strong>of</strong> time be<strong>for</strong>e Chikungunya virus (which is more likely to cause symptomatic<br />
disease than West Nile virus) arrives in <strong>the</strong> US by air.<br />
Figure 2.4.A-1. The female Aedes albopictus, or Asian tiger mosquito. 16<br />
114
The Globalization <strong>of</strong> Trade and Travel: Air Travel<br />
Many models <strong>of</strong> climate change and vector-pathogen relationships now predict a significant<br />
expansion in potential malaria transmission cycles in <strong>the</strong> next few decades, with some studies<br />
predicting a 16–25% increase in person-months <strong>of</strong> exposure in malaria-endemic areas <strong>of</strong><br />
Africa. 17 Accessible airline connections now permit infected individuals to travel anywhere in<br />
<strong>the</strong> world in less than 24 hours, delivering human reservoirs <strong>of</strong> malaria, dengue, West Nile virus,<br />
and Chikungunya virus to new temperate areas <strong>for</strong> autochthonous or local transmission by new<br />
and adaptable mosquito vectors who are <strong>of</strong>ten recent air- or sea-arrivals <strong>the</strong>mselves.<br />
The most common reasons <strong>for</strong> malaria to occur in <strong>the</strong> industrialized nations <strong>of</strong> North America<br />
and Europe, where malaria was once endemic, are related to international air travel in a warmer<br />
and wetter climate and include airport malaria and, more significantly, imported malaria.<br />
Airport malaria is defined as <strong>the</strong> intercontinental transfer <strong>of</strong> malaria through <strong>the</strong> introduction <strong>of</strong><br />
an infective anopheline mosquito vector into a nonendemic-disease area with a changing<br />
ecosystem that supports <strong>the</strong> vector-pathogen relationship. The malaria-infected mosquito vector<br />
is a new arrival on an international flight from a malaria-endemic region. Airport malaria is<br />
transmitted by <strong>the</strong> bite <strong>of</strong> an infected tropical anopheline mosquito within <strong>the</strong> vicinity <strong>of</strong> an<br />
international airport, usually a few miles or even less. Airport malaria has been reported in <strong>the</strong><br />
US and in Europe (France, UK), but it is much less common than imported malaria, <strong>the</strong> most<br />
common cause <strong>of</strong> malaria in <strong>the</strong> developed world today. 18<br />
Imported malaria is defined as <strong>the</strong> intercontinental transfer <strong>of</strong> malaria by <strong>the</strong> movement <strong>of</strong> an<br />
infected or parasitemic person with malaria to a nonendemic-disease area with locally competent<br />
anopheline vectors in a welcoming ecosystem. 19 Climate change has now expanded <strong>the</strong><br />
geographic distribution <strong>of</strong> malaria-endemic regions worldwide and has extended <strong>the</strong> length <strong>of</strong><br />
seasonal malaria transmission cycles in endemic regions, so more arrivals <strong>of</strong> malaria-carrying<br />
mosquitoes and malaria-infected travelers are anticipated. The greatest public health threats that<br />
imported malaria-infected mosquitoes and patients with malaria pose to non-malarious regions<br />
include (1) <strong>the</strong> re-introduction <strong>of</strong> Plasmodium species (especially Plasmodium vivax, <strong>the</strong><br />
causative agent <strong>of</strong> <strong>of</strong>ten misdiagnosed relapsing malaria, in <strong>the</strong> US and Europe) into regions with<br />
competent anopheline vectors, and (2) <strong>the</strong> re-establishment <strong>of</strong> locally transmitted or<br />
autochthonous malaria by local anopheline vectors.<br />
Prevention and control strategies <strong>for</strong> airport, imported, and autochthonous or locally transmitted<br />
malaria should include (1) early case definition, case confirmation, and treatment,<br />
(2) streng<strong>the</strong>ned vector surveillance to detect <strong>the</strong> potential <strong>for</strong> autochthonous transmission, and<br />
(3) drainage <strong>of</strong> potential mosquito breeding and egg-laying surface water sites. Although <strong>the</strong><br />
relationships among infected vector importation, index case immigration, reclaimed disease<br />
ecosystems, and malaria transmission are complex, future attempts to control and eradicate<br />
airport and imported malaria should be based on an understanding <strong>of</strong> disease transmission<br />
mechanisms and an appreciation that climate and ecosystem changes can support re-emerging<br />
local mosquito-borne infectious diseases in non-endemic areas, especially malaria, dengue,<br />
Chikungunya virus, and West Nile virus. The most capable mosquito vectors <strong>of</strong> malaria and<br />
o<strong>the</strong>r infectious diseases are compared by geographic distribution and infectious disease<br />
transmission in Table 2.4.A-2.<br />
115
Table 2.4.A-2. The Mosquito Vectors <strong>of</strong> Major Medical Importance.<br />
Mosquito Genera<br />
Infectious Diseases<br />
Transmitted<br />
Geographic<br />
Distribution<br />
Ranges<br />
Anopheles spp. Malaria Africa, Asia,<br />
Central America,<br />
South America<br />
Anopheles spp.<br />
Causative Microbial<br />
Agents<br />
Plasmodium<br />
falciparum, P. vivax,<br />
P. ovale, P. malariae<br />
Bancr<strong>of</strong>tian filariasis Sou<strong>the</strong>ast Asia Wuchereria bancr<strong>of</strong>ti<br />
Brugian filariasis Sou<strong>the</strong>ast Asia Brugia malayi<br />
Timorian filariasis Timor, Indonesia Brugia timori<br />
Classification <strong>of</strong><br />
Causative Agents<br />
Protozoan parasites<br />
Filarial worms<br />
causing lymphatic<br />
filariasis<br />
Anopheles spp. O’nyong nyong fever Africa Alphavirus Togaviruses<br />
Aedes spp. Yellow fever Africa, Latin<br />
Flavivirus<br />
Flaviviruses<br />
America<br />
Dengue fever<br />
Chikungunya fever<br />
Eastern equine<br />
encephalitis<br />
Africa, Asia, Latin<br />
America<br />
Africa,<br />
Asia<br />
Eastern & Sou<strong>the</strong>astern<br />
USA<br />
Flaviviruses DEN 1-4<br />
Alphavirus<br />
Alphavirus<br />
Flaviviruses<br />
Togaviruses<br />
Togaviruses<br />
Ross River fever<br />
Australia, Papua<br />
New Guinea<br />
Alphavirus<br />
Togaviruses<br />
Cali<strong>for</strong>nia<br />
encephalitis<br />
LaCrosse<br />
encephalitis<br />
Western USA Bunyavirus Bunyaviruses<br />
Midwestern USA Bunyavirus Bunyaviruses<br />
Rift Valley fever Africa Phlebovirus Bunyaviruses<br />
Culex spp.<br />
Western equine<br />
encephalitis<br />
Western US, South<br />
America<br />
Alphavirus<br />
Togaviridae<br />
Venezuelan equine<br />
encephalitis<br />
Central & South<br />
America<br />
Alphavirus<br />
Togaviruses<br />
Japanese encephalitis<br />
Far East, Sou<strong>the</strong>ast<br />
Asia, Indonesia<br />
Flavivirus<br />
Flaviviruses<br />
St. Louis encephalitis USA Flavivirus Flaviviruses<br />
West Nile virus<br />
Africa, Middle East,<br />
East Europe, North<br />
America<br />
Flavivirus<br />
Flaviviruses<br />
116
Table 2.4.A-2. The Mosquito Vectors <strong>of</strong> Major Medical Importance.<br />
Mosquito Genera<br />
Infectious Diseases<br />
Transmitted<br />
Geographic<br />
Distribution<br />
Ranges<br />
Causative Microbial<br />
Agents<br />
Classification <strong>of</strong><br />
Causative Agents<br />
Mansonia spp. Brugian filariasis Sou<strong>the</strong>ast Asia Brugia malayi Filarial worm causing<br />
lymphatic filariasis<br />
Psorophora spp. Venezuelan equine Central & South Alphavirus<br />
Togaviruses<br />
encephalitis<br />
America<br />
Haemophagus<br />
spp.<br />
Yellow fever Africa, South<br />
America<br />
Flavivirus<br />
Flaviviruses<br />
In addition to malaria and flaviviral infections, sudden acute respiratory failure (SARS) and<br />
tuberculosis (TB) have also been imported into North America by infected air travelers; and<br />
avian-origin influenza A (H5NI) and swine-origin novel influenza A (H1NI) have been imported<br />
into North America by land (swine flu), sea (avian flu), and air (avian flu, swine flu).<br />
The Most Predictable Pathogens and <strong>the</strong>ir Food Water, and Insect Transmission Vectors<br />
The food, water, and vector-borne microbial agents that will cause climate change-induced<br />
infectious disease outbreaks have now independently identified <strong>the</strong>mselves as (1) having low<br />
infective doses and high virulence, (2) being environmentally stable, and (3) and being salt,<br />
chlorine, and iodine-resistant. Water- and food-borne diseases will include gastroenteritis caused<br />
by <strong>the</strong> coccidian protozoans (Cryptosporidium parvum, Cyclospora cayetanensis, Isospora belli),<br />
hepatitis A virus, astroviruses and caliciviruses, Giardia lamblia, <strong>the</strong> non-cholera marine Vibrios<br />
(V. vulnificus, V. parahaemolyticus), Campylobacter jejuni, Shigella species, and <strong>the</strong> typhoidal<br />
and non-typhoidal Salmonella species. 20<br />
Campylobacter jejuni and many Salmonella species are natural commensals that live in <strong>the</strong><br />
gastrointestinal tracts <strong>of</strong> birds, amphibians, and reptiles. Following natural disasters, man may be<br />
exposed to <strong>the</strong>se bacteria following <strong>the</strong> consumption <strong>of</strong> contaminated drinking water or food<br />
exposed to animal or human carriers, or to contaminated fomites such as cutting boards and<br />
carving knives. Rarely, human beings can become chronic asymptomatic carriers and fecal<br />
super-shedders <strong>of</strong> S. typhi. These bacteria are very heat-sensitive and can be killed by boiling<br />
drinking water and thoroughly cooking meat, especially poultry.<br />
Following natural disasters, particularly floods and hurricanes, reptiles are <strong>of</strong>ten displaced from<br />
<strong>the</strong>ir dens and can contaminate food preparation surfaces with non-typhoidal Salmonella species,<br />
particularly outdoor surfaces on which fresh fruits are later sliced <strong>for</strong> eating or squeezed or<br />
tapped <strong>for</strong> juices. On <strong>the</strong> o<strong>the</strong>r hand, <strong>the</strong> Vibrio bacteria, including V. cholera, are natural<br />
seawater dwelling organisms that <strong>of</strong>ten contaminate human drinking water reservoirs following<br />
storm surges, and can also contaminate open wounds. The non-cholera-causing Vibrios (V.<br />
parahaemolyticus, V. vulnificus) are much more ubiquitous and virulent pathogens than are <strong>the</strong><br />
cholera-causing Vibrios, and require treatment with intravenous rehydration and antibiotics. In<br />
addition to dysentery, <strong>the</strong>y can cause systemic septicemia and liver failure with high case fatality<br />
rates, especially in patients with pre-existing liver diseases such as alcoholic cirrhosis, hepatitis,<br />
and hemochromatosis (high iron stores in <strong>the</strong> liver and heart).<br />
Outbreaks <strong>of</strong> plague caused by Yersinia pestis and transmitted from rodents to humans by fleas<br />
will continue to occur in regions where <strong>the</strong> organism is endemic in prairie dogs and o<strong>the</strong>r<br />
117
odents, such as <strong>the</strong> US West and <strong>the</strong> Sou<strong>the</strong>rn Himalayas. Leptospirosis caused by <strong>the</strong><br />
spirochete, Leptospira interrogans, and transmitted to man via rodent urine-contaminated<br />
surface waters will occur in coastal and o<strong>the</strong>r waterside municipalities worldwide. The large<br />
rodent populations in <strong>the</strong>se cities will be frequently displaced by heavy rainfall, flash flooding,<br />
tidal and storm surges. Pulmonary hantavirus syndrome, ano<strong>the</strong>r rodent zoonosis transmitted by<br />
rodent fecal-aerosols, will occur in dry areas such as <strong>the</strong> US Four Corners (shared state<br />
boundaries <strong>of</strong> Arizona, Colorado, New Mexico, and Utah) following heavy rainfalls that <strong>for</strong>ce<br />
domestic deer mice from <strong>the</strong>ir underground burrows and into vacant homes, garages, and crawl<br />
spaces. All <strong>of</strong> <strong>the</strong> tick-transmitted diseases, including spirochetal diseases such as Lyme disease,<br />
babesiosis, ehrlichiosis, anaplasmosis, and <strong>the</strong> tick-borne viral encephalidides, will shift <strong>the</strong>ir<br />
geographic distributions northward by several latitudes and <strong>the</strong>ir altitude distributions higher by<br />
tens <strong>of</strong> meters.<br />
New Vector-pathogen Relationships and Potential Epidemic Disease Threats<br />
Emerging infectious diseases may be defined as those that have recently appeared in human<br />
populations, have expanded <strong>the</strong>ir ranges <strong>of</strong> distribution, or have threaten to increase <strong>the</strong>ir<br />
prevalences and distribution ranges in <strong>the</strong> near future. 21 Today most emerging infectious diseases<br />
arise first in <strong>the</strong> natural environment as zoonoses, such as Hantavirus pulmonary syndrome,<br />
avian-origin influenza A (H5N1), swine-origin novel influenza A (H1N1), and SARS. 22 The<br />
arthropod-borne emerging infectious diseases <strong>of</strong>ten adopt a competent new insect vector such as<br />
Aedes albopictus <strong>for</strong> <strong>the</strong> transmission <strong>of</strong> dengue and Chikungunya viruses. On <strong>the</strong> o<strong>the</strong>r hand, reemerging<br />
infectious diseases may be defined as those whose pathogenesis, clinical<br />
manifestations, and treatment strategies are well know, but <strong>the</strong>y have re-emerged as public health<br />
threats, <strong>of</strong>ten with increased antimicrobial drug resistances (e.g., multi-drug resistant and<br />
extensively drug-resistant TB, nosocomial [or hospital-acquired] and community-acquired<br />
methicillin-resistant Staphylococcus aureus [MRSA], and nosocomical Clostridium difficile and<br />
vancomycin-resistant enterococcal [VRE] infections).<br />
New Vector-pathogen Relationships<br />
Dengue is a serious re-emerging threat <strong>for</strong> several reasons. Although an effective live vaccine is<br />
available <strong>for</strong> yellow fever, <strong>the</strong>re is no vaccine to prevent dengue, a yellow fever-like flavivirus<br />
that is also transmitted by Aedes species mosquitoes. A dengue vaccine has proven to be very<br />
difficult to develop <strong>for</strong> several reasons: (1) <strong>the</strong> 4 dengue serotypes dictate a polyvalent vaccine,<br />
like <strong>the</strong> influenza vaccine, (2) a dengue vaccine must provide immunity against all 4 flaviviral<br />
serotypes (DEN 1-4) at once by stimulating effective neutralizing antibodies, (3) <strong>the</strong>se<br />
neutralizing antibodies must not cross-react and activate T-cells causing <strong>the</strong> cytokine reactions<br />
characteristic <strong>of</strong> frequently fatal dengue hemorrhagic fever (DHF) and dengue shock syndrome<br />
(DSS), and (4) multiple vaccinations every few years will be required in order to achieve longlasting<br />
immunity against all 4 serotypes. Dengue viruses are now endemic along <strong>the</strong> porous US-<br />
Mexico border and have caused DHF outbreaks on both sides <strong>of</strong> <strong>the</strong> border and one<br />
autochthonous case <strong>of</strong> DHF in Brownsville, Texas, in 2005. 23<br />
Although yellow fever and dengue viruses have historically been confined to <strong>the</strong> tropics and<br />
transmitted preferentially by Aedes aegypti, a new secondary Aedes vector <strong>for</strong> dengue, A.<br />
albopictus, <strong>the</strong> Asian tiger mosquito, has now expanded its range globally in a warming<br />
ecosystem and is a competent vector <strong>of</strong> dengue viruses. The WHO considers dengue to be one <strong>of</strong><br />
<strong>the</strong> world’s most important re-emerging infectious diseases, with 50 million to 100 million cases<br />
118
annually, 0.5 million hospitalizations that <strong>of</strong>ten require blood product transfusions, and 22,000<br />
deaths annually, mostly in children. Even though <strong>the</strong> first dengue infection may be mild, <strong>the</strong><br />
second could be lethal from ei<strong>the</strong>r DHF or DSS, even years later. Since <strong>the</strong>re are no vaccines or<br />
specific drug treatments <strong>for</strong> dengue, and since local A. aegypti and A. albopictus mosquitoes are<br />
capable <strong>of</strong> transmitting dengue in <strong>the</strong> US, dengue poses a significant threat to <strong>the</strong> US, and a safe<br />
quadrivalent vaccine and better mosquito vector control along <strong>the</strong> US-Mexico border are needed<br />
now.<br />
Vaccine Preparedness<br />
The US was not prepared <strong>for</strong> <strong>the</strong> avian flu pandemic, which did not occur, much less <strong>the</strong> swine<br />
flu pandemic, which did. The avian-origin influenza (H5N1A) virus, or <strong>the</strong> avian flu virus,<br />
emerged as a new cause <strong>of</strong> human disease in Chinese poultry workers more than a dozen years<br />
ago and has now caused nearly 400 cases worldwide in poultry workers or <strong>the</strong>ir close contacts,<br />
with more than half <strong>of</strong> <strong>the</strong> cases being fatal. This virulent influenza strain has now been found in<br />
birds throughout <strong>the</strong> world except in <strong>the</strong> US. Although avian flu cases occurred in 14 countries<br />
across Asia and Africa, <strong>the</strong> much-feared pandemic spread to <strong>the</strong> US never occurred, and this<br />
finally led <strong>the</strong> US government to halt production <strong>of</strong> an avian flu vaccine.<br />
New influenza vaccines <strong>for</strong> potentially pandemic strains are very time-consuming and expensive<br />
to produce <strong>for</strong> several reasons including: (1) enough virus has to be isolated from human cases<br />
and grown in seasonally available embryonated eggs, (2) <strong>the</strong> virus has to be attenuated or made<br />
less virulent through many passages through eggs just to produce live, whole virus vaccines (like<br />
<strong>the</strong> oral polio vaccine, which is no longer in use in <strong>the</strong> US) which could cause human disease,<br />
(3) live attenuated virions <strong>the</strong>n have to be inactivated and separated into <strong>the</strong>ir component H<br />
(hemagglutinin) and N (neuraminidase) protein antigens to make a safer, immunologically<br />
effective subvirion vaccine, and (4) <strong>the</strong> new vaccines need to be tested in both adults and<br />
children be<strong>for</strong>e approval <strong>for</strong> widespread use. Since vaccines <strong>for</strong> novel influenza A (H1NI) or<br />
swine flu are still undergoing trials in adults and children, <strong>the</strong> most effective immediate<br />
strategies to control a swine flu pandemic in <strong>the</strong> US include identifying and isolating suspected<br />
cases and treating confirmed cases with <strong>the</strong> only effective neuraminidase inhibitor <strong>the</strong> virus is<br />
susceptible to, oseltamivir (Tamiflu ® ). Un<strong>for</strong>tunately, novel influenza A (H1N1) is resistant to<br />
<strong>the</strong> only o<strong>the</strong>r neuraminidase inhibitor currently FDA-approved to treat influenza, zanimivir<br />
(Relenza ® ).<br />
An outbreak <strong>of</strong> H1N1 swine-origin influenza A, now known as novel influenza A (H1N1), began<br />
in sou<strong>the</strong>rn Mexico in March 2009, and by May 2009 it had spread to 22 nations, with more than<br />
1900 cases worldwide and <strong>the</strong> highest case fatality rates in Mexico (29 deaths). 24 The first novel<br />
influenza A (H1N1) cases were confirmed in <strong>the</strong> US in April 2009; and by August 2009, <strong>the</strong><br />
cumulative number <strong>of</strong> US infections had reached 1 million, well in advance <strong>of</strong> <strong>the</strong> traditional<br />
wintertime influenza season. 25 By August 2009, <strong>the</strong> US Centers <strong>for</strong> Disease Control and<br />
Prevention (CDC) deployed 25% <strong>of</strong> <strong>the</strong> Strategic <strong>National</strong> Stockpile (SNS) <strong>of</strong> oseltamivir<br />
(Tamiflu ® ) to all U.S. states in response to <strong>the</strong> pandemic. In addition, <strong>the</strong> time-consuming<br />
process <strong>of</strong> new vaccine development was initiated to develop an effective vaccine against <strong>the</strong><br />
novel influenza A (H1N1) virus. The swine flu pandemic spread more rapidly across <strong>the</strong> world<br />
than <strong>the</strong> avian flu outbreak <strong>of</strong> 1997-2004. Fortunately, <strong>the</strong>re have been lower case fatality rates<br />
as new cases have moved away from <strong>the</strong> epicenter <strong>of</strong> <strong>the</strong> pandemic in Mexico. 26<br />
119
The Globalization and Industrialization <strong>of</strong> <strong>the</strong> World’s Vaccine and Drug Supplies<br />
The US will need to develop new vaccines <strong>for</strong> influenza containing H antigens from potentially<br />
pandemic strains and to restore oseltamivir stockpiles. New vaccine development will require<br />
embryonated eggs during seasonal shortages in <strong>the</strong> US. The manufacture <strong>of</strong> oseltamivir will<br />
require its key ingredient, shikimic acid from <strong>the</strong> Chinese star anise plant. Both embryonated<br />
eggs and shikimic acid would likely be imported from China. China is among <strong>the</strong> world’s<br />
largest exporter <strong>of</strong> embryonated eggs <strong>for</strong> vaccine development and poultry farms, and a major<br />
exporter <strong>of</strong> shikimic acid <strong>for</strong> oseltamivir manufacture.<br />
In December 2008, WHO inspectors detected melamine in eggs from chickens fed melaminecontaminated<br />
feed. 27 The consumption <strong>of</strong> melamine-contaminated chicken and unembryonated<br />
eggs could result in nephrotoxic exposures similar to those that followed <strong>the</strong> consumption <strong>of</strong><br />
adulterated infant <strong>for</strong>mula and dairy products. The use <strong>of</strong> melamine-adulterated embryonated<br />
eggs <strong>for</strong> influenza vaccine production could alter <strong>the</strong> safety and immunological efficacy <strong>of</strong><br />
inactivated subvirion vaccines. Today, many drugs and vaccines, like foods, are imported from<br />
major manufacturers in Bangladesh, China, and India, where <strong>the</strong>re is less regulatory oversight <strong>of</strong><br />
production practices and intentional adulteration occurs to boost pr<strong>of</strong>its. Without greater control<br />
and oversight <strong>of</strong> its food, drug, and vaccine supplies, <strong>the</strong> US will remain vulnerable to food and<br />
drug shortages, to intentional food and drug adulteration, and to agricultural and biological<br />
terrorism. The consequences could be disastrous and include inadequate or contaminated meat<br />
and dairy supplies, and inadequate stockpiles <strong>of</strong> safe drugs and vaccines to fight pandemics or to<br />
contain intentional biological weapon exposures, particularly from smallpox or similar poxviruses<br />
(cowpox, camel pox).<br />
Air Quality, Water Quality, and Drinking Water Rights<br />
Drier and hotter summers following milder winters with less snowmelt will empty reservoirs and<br />
will fuel lightning-ignited and intentionally set brush and <strong>for</strong>est fires, destroying timberlands,<br />
displacing residents, and causing increased smoke-inhalation injuries and deaths. Greater<br />
tropospheric trapping <strong>of</strong> primary pollutants from fossil fuel consumption and secondary<br />
pollutants from photochemical-smog reactions cause <strong>the</strong> continuing deterioration <strong>of</strong> air quality<br />
and visibility. Air pollution leads to increased seasonal allergic asthma and o<strong>the</strong>r chronic<br />
respiratory diseases, results in defoliate alpine <strong>for</strong>ests, and contaminates surface freshwater with<br />
acid rain. Annual US hospital admission rates <strong>for</strong> acute asthma in children increased from 19 per<br />
10,000 children in 1979 to 35 per 10,000 children in 2001.<br />
Droughts typically provoke water-rights disputes between upstream and downstream<br />
populations. Litigation over water rights has started between Cali<strong>for</strong>nia and o<strong>the</strong>r western-slope<br />
US states, among Alabama, Florida and Georgia, and between <strong>the</strong> US and Mexico. Droughts also<br />
cause crops to fail, triggering malnutrition, famine, and refugee relocation in developing nations.<br />
Tidal flooding will increase <strong>the</strong> salinity <strong>of</strong> water tables, coastal marshes, and alluvial deltas,<br />
destroying shellfish beds, contaminating freshwater aquifers, and rendering deltas unfit <strong>for</strong><br />
agriculture.<br />
Water-centered Disasters: Increasing Hurricane Activity<br />
Water-centered disasters such as floods, rainstorm-spawned tornadoes, tropical storms, tropical<br />
cyclones or hurricanes, and earthquake-spawned tidal waves or tsunamis now occur more <strong>of</strong>ten<br />
than geological disasters. They occur more commonly in <strong>the</strong> Americas, Asia, and Africa, and<br />
120
<strong>the</strong>y <strong>of</strong>ten cause more deaths by drowning than o<strong>the</strong>r disasters. Water-centered disasters also<br />
cause more serious injuries than deaths overall, primarily through falls and falling objects, motor<br />
vehicle accidents, carbon monoxide poisoning from home generator misuse, and chain saw<br />
injuries during debris clean-up. Increased endemic infectious disease risks, especially acute<br />
gastrointestinal illnesses and mass population relocations are more common after water-centered<br />
disasters than after geological disasters such as earthquakes and volcanic eruptions.<br />
A storm surge is a massive wall <strong>of</strong> seawater 50 to 100 miles wide that sweeps across <strong>the</strong><br />
coastline near hurricane or tsunami landfall. Storm surge is <strong>the</strong> greatest threat to human life<br />
during hurricanes and tsunamis. A storm tide is <strong>the</strong> combination <strong>of</strong> <strong>the</strong> storm surge and <strong>the</strong><br />
astronomical high tide and is <strong>the</strong> greatest threat to property during hurricanes and tsunamis. The<br />
storm tide sweeps along coastlines at hurricane or tsunami landfall <strong>for</strong> much longer distances<br />
(over 100 miles) and penetrates much deeper inland than <strong>the</strong> storm surge.<br />
During <strong>the</strong> 5 weeks after hurricane Andrew, <strong>the</strong> proportional morbidity from injuries decreased,<br />
proportional morbidity from respiratory illnesses increased, and proportional morbidity from<br />
diarrheal diseases remained stable. No infectious disease outbreaks occurred. Investigators<br />
concluded that injuries and exacerbations <strong>of</strong> chronic diseases were <strong>the</strong> most common causes <strong>of</strong><br />
morbidity immediately after hurricanes, and that infectious diseases were uncommon, presented<br />
weeks after hurricanes, and were not associated with communicable disease outbreaks.<br />
Atmospheric and climate scientists have now been able to measure <strong>the</strong> impact <strong>of</strong> sea surface<br />
temperatures on <strong>the</strong> intensification and direction <strong>of</strong> tropical storms and hurricanes (tropical<br />
cyclones) using a worldwide network <strong>of</strong> ocean temperature buoys. O<strong>the</strong>r continuous<br />
measurements in assessing ENSO activity and tropical cyclone intensification and landfall<br />
prediction have also been identified and include ocean subsurface temperatures, <strong>the</strong>rmocline<br />
depths and thicknesses, and storm steering current barometric pressures. 28 Armed with <strong>the</strong>se new<br />
measurements, <strong>for</strong>ecasters will be better able to make earlier and more accurate predictions <strong>of</strong><br />
hurricane intensity and landfall; permitting local authorities to order timely population<br />
evacuations prior to landfall. 29<br />
Earth-centered Disasters: Increasing Volcanic and Tectonic Activity<br />
Global tectonic and volcanic activities have increased significantly since 1880 due to a<br />
combination <strong>of</strong> coastal tectonic plate undermining by <strong>the</strong> seawater-weighted Nor<strong>the</strong>rn Pacific<br />
plate and wintertime sinking <strong>of</strong> <strong>the</strong> North Pole from ice melt. As winter water and ice weights<br />
increase, <strong>the</strong>se seasonal geophysical changes will be accentuated, exerting greater influences on<br />
tidal surges, tectonic plate movements, and geo<strong>the</strong>rmal activities, especially in <strong>the</strong> Nor<strong>the</strong>rn<br />
Hemisphere and along <strong>the</strong> Pacific Rim. These powerful, combined geophysical <strong>for</strong>ces will<br />
generate more molten magma in <strong>the</strong> earth’s mantle, which expands to uncork dormant volcanoes,<br />
as in Alaska, or to burst through thinning ice packs, as in Iceland. Case fatality rates <strong>for</strong> earthcentered<br />
natural disasters—such as earthquakes, earthquake-spawned tsunamis, and volcanic<br />
eruptions—<strong>of</strong>ten significantly exceed case fatalities from more predictable, water-centered<br />
disasters such as tropical cyclones and floods.<br />
Conclusions and Recommendations<br />
International agencies and climate modelers agree on <strong>the</strong> following conclusions:<br />
1. The world’s climate is changing.<br />
2. Human activities are contributing to <strong>the</strong> change.<br />
121
3. The earth is warming and <strong>the</strong> pace <strong>of</strong> warming is increasing.<br />
4. Wea<strong>the</strong>r patterns have become more extreme.<br />
5. All biological systems are responding to global warming, both on land and in <strong>the</strong> oceans.<br />
Free trade, economic globalization, and <strong>the</strong> ease and speed <strong>of</strong> air and sea travel and commerce<br />
have <strong>of</strong>fered several unique opportunities to genetically adaptable pathogens during this period<br />
<strong>of</strong> climate change, including <strong>the</strong> following:<br />
1. New pathogen distribution systems<br />
2. New animal hosts <strong>for</strong> incubation<br />
3. New vectors <strong>of</strong> disease transmission<br />
4. New warming and welcoming ecosystems <strong>for</strong> pathogen reproduction<br />
5. More disease-susceptible human hosts <strong>for</strong> pathogens to infect<br />
Several components <strong>of</strong> climate change, particularly warming temperatures and more frequent<br />
drought-rainy season cycles, have supported <strong>the</strong> success <strong>of</strong> new vector-pathogen relationships, as<br />
in airport and imported malaria transmission. Some arthropod vectors, particularly mosquitoes<br />
and ticks, have been given selective advantages by climate change, free trade, international air<br />
travel, and increasing outdoor contact with susceptible human hosts during prolonged insect<br />
breeding and feeding seasons. Pathogens such as <strong>the</strong> monkeypox and West Nile viruses that have<br />
been introduced from tropical regions have found new host animal reservoirs in warming<br />
ecosystems in industrialized nations north <strong>of</strong> <strong>the</strong> Equator. 30 In short, more un-welcomed tropical<br />
pathogen imports may be anticipated and transmitted by competent local insect vectors.<br />
The governments <strong>of</strong> both developed and developing nations have several binding responsibilities<br />
to <strong>the</strong>ir citizens including:<br />
1. To inculcate an in<strong>for</strong>med environmental consciousness<br />
2. To protect <strong>the</strong>ir citizens and economies from <strong>for</strong>eign exploitation<br />
3. To recognize and control endemic and pandemic infectious diseases<br />
4. To prevent infectious disease transmission by patient education, vector control, and<br />
vaccination<br />
5. To practice responsible labor and trade practices in order to assure <strong>the</strong> safest workplaces<br />
and to produce <strong>the</strong> safest foods, drugs, and goods <strong>for</strong> export in a one-world economy<br />
Additional Recommended References<br />
1. St. Louis ME, Hess JJ. Climate change. Impacts on and implications <strong>for</strong> global health.<br />
Am J Prev Med 2008; 35: 527-38.<br />
2. Okie S. A new attack on malaria. N Engl J Med 2008; 358: 2425-8.<br />
3. Charrel, R., de Lamballerie, X., Raoult, D. Chikungunya outbreaks—<strong>the</strong> globalization <strong>of</strong><br />
vectorborne diseases. New Engl J Med 2007; 356: 769-71.<br />
4. Anyamba, A., Chretien, J.P., Small, J., Tucker, C.J., Linthicum, K.J. Developing global<br />
climate anomalies suggest potential disease risks <strong>for</strong> 2006-2007. Intl J Health<br />
Geographics 2006; 5: 60-3.<br />
5. deLamballerie X, Leroy E, Charrel RN, et al. Chikungunya virus adapts to tiger mosquito<br />
via evolutionary convergence: a sign <strong>of</strong> things to come? J Virology 2008; 5: 33.<br />
6. Panning M, Grywna K, von Esbroek, Emmerich P, Drosten C. Chikungunya fever in<br />
travelers returning to Europe from <strong>the</strong> Indian Ocean region, 2006. Emerg Infect Dis 2008;<br />
14: 416-22.<br />
122
7. Hochedez P, Canestri A, Guihot A, et al. Management <strong>of</strong> travelers with fever and<br />
exan<strong>the</strong>ma, notably dengue and Chikungunya infections. Am J Trop Med Hyg 2008; 78:<br />
710-3.<br />
8. Morens, D, Fauci, AS. Dengue and hemorrhagic fever: a potential threat to public health<br />
in <strong>the</strong> United States. JAMA 2008; 299: 214-6.<br />
9. Monath TP. Dengue and yellow fever-Challenges <strong>for</strong> <strong>the</strong> development and use <strong>of</strong><br />
vaccines. N Engl J Med 2007; 357: 2222-5.<br />
10. Dengue hemorrhagic fever-US-Mexico border, 2005. MMWR 2007; 56: 785-9.<br />
11. Voelker R. Effects <strong>of</strong> West Nile virus may persist. JAMA 2008; 299: 2135-6.<br />
12. Whitfield D, Curtis CF, White CB, et al. Two cases <strong>of</strong> falciparum malaria acquired in<br />
Britain. Brit Med J 1984; 289: 1607-9.<br />
13. Giacomini T, Mouchet J, Mathieu P, Petithory JC. Study <strong>of</strong> 6 cases <strong>of</strong> malaria acquired<br />
near Roissy-Charles-de-Gaulle in 1994. Bulletin de l’Academie <strong>National</strong>e de Medecine<br />
1995; 179: 335-51.<br />
14. Rodger AJ, Cooke GS, Ord R, Su<strong>the</strong>rand CJ, Pasvol G. Cluster <strong>of</strong> falciparum malaria<br />
cases in UK airport. Emerg Infect Dis 2008; 8: 1284-6.<br />
15. Romi R, Sabatinelli G, Majori G. Malaria epidemiological situation in Italy and<br />
evaluation <strong>of</strong> malaria incidence in Italian travelers. J Travel Med 2001; 8: 6-11.<br />
16. Mascarello M, Allegranzi B, Angheben A, et al. Imported malaria in adults and children:<br />
Epidemiological and clinical characteristics <strong>of</strong> 380 consecutive cases observed in Verona,<br />
Italy. J Travel Med 2008; 15: 226-36.<br />
17. Transmission <strong>of</strong> Plasmodium vivax malaria-San Diego, County, Cali<strong>for</strong>nia, 1988 and<br />
1989. MMWR; 39: 91-4.<br />
18. Thierfelder C, Schill C, Hatz C, Nüesch R. Trends in imported malaria to Basel,<br />
Switzerland. J Travel Med 2008; 15: 432-6.<br />
19. Kruse, H., Kirkemo, A.M., Handeland, K. Wildlife as a source <strong>of</strong> zoonotic infections.<br />
Emerg Infect Dis 2004; 10: 2067-72.<br />
20. Chomel, B., Belotto, A., Meslin, F.X. Wildlife, exotic pets, and emerging zoonoses.<br />
Emerg Infect Dis 2007; 13: 6-11.<br />
21. Marano N, Arguin PM, Pappaioanou M. Impact <strong>of</strong> globalization and animal trade on<br />
infectious disease ecology. Emerg Infect Dis 2007; 13:1807-1809.<br />
22. Süss J, Klaus C, Gerstengarbe FW, et al. What makes ticks tick? Climate change, ticks,<br />
and tickborne diseases. J Travel Med 2008; 15 (1): 39-45.<br />
23. Freedman DO, Weld LH, Kozarsky PE, et al. Spectrum <strong>of</strong> disease and relation to place <strong>of</strong><br />
exposure among ill returned travelers. N Engl J Med 2006; 354: 119-130.<br />
24. Jensenius M, Parola P, Raoult D. Threats to international travelers posed by tickborne<br />
diseases. Travel Med Infect Dis 2006; 4: 4-13.<br />
25. Steere AC. Lyme borreliosis in 2005, 30 years after initial observations in Lyme,<br />
Connecticut. Wein Klin Wochenschr 2006; 118: 21-22.<br />
26. Parola P, Raoult D. Tickborne bacterial diseases emerging in Europe. Clin Microbial<br />
Infect Dis 2001; 7 (2): 80-83.<br />
27. Lyme disease-United States, 1994. MMWR 1995; 44: 459-462.<br />
28. Jensenius M, Fournier P-E, Raoult D. Rickettsioses and <strong>the</strong> international traveler. Clin<br />
Infect Dis 2004; 39: 1493-1499.<br />
29. Parola P. Tickborne rickettsial diseases: Emerging risks in Europe. Comp Immunol<br />
Microbiol Infect Dis 2004; 27 (5): 297-304.<br />
123
30. Raoult D, Fournier P-E, Fenoccar F, et al. Rickettsia africae, a tickborne pathogen in<br />
travelers to sub-Saharan Africa. N Engl J Med 2001; 344: 1504-1510.<br />
↑ Back to <strong>the</strong> top<br />
1 1975 (IPCC, Fourth Assessment Report. Climate Change: Syn<strong>the</strong>sis Report. AR4 SYR-Summary <strong>for</strong><br />
Policymakers, 2007; 2007: pp 1-23)<br />
2 IPCC, Fourth Assessment Report, op. cit.<br />
3 Smith DM, Cusack C, Coleman AW, et al. Improved surface temperature prediction <strong>for</strong> <strong>the</strong> coming<br />
decade from a global climate model. Science 2007; 317: 766-9<br />
4 Patel RB, Burke TF. Urbanization-An emerging humanitarian disaster. N Engl J Med 2009; 361: 141-3<br />
5 Lewis M. Megacities <strong>of</strong> <strong>the</strong> future. Forbes, 2007.<br />
6 World Health Organization-Malaria. In: Malaria. International Travel and Health. WHO, Geneva, 2005:<br />
132-51<br />
7 Morens DM, Taubenberger JK, Fauci AS. The persistent legacy <strong>of</strong> <strong>the</strong> 1918 influenza virus. N Engl J<br />
Med 2009; 361: 225-7<br />
8 Ingelfinger JR. Melamine and <strong>the</strong> global implications <strong>of</strong> food contamination. N Engl J Med 2008; 359:<br />
2745-8<br />
9 Ingelfinger JR, op. cit.<br />
10 Ingelfinger JR, op. cit.<br />
11 Morse SS. Factors in <strong>the</strong> emergence <strong>of</strong> infectious diseases. Emerg Infect Dis 1995; 1: 7-15<br />
12 Morse SS, op.cit.<br />
13 Multistate outbreak <strong>of</strong> monkeypox-Illinois, Indiana, and Wisconsin. MMWR 2003; 52: 537-40)<br />
14 MMWR 2003, op. cit.<br />
15 MMWR 2003, op. cit.<br />
16 CDC Public Health Image Library (PHIL) Image Number 4735. Available at http://www.cdc.gov . No<br />
copyright permission required.<br />
17 WHO, Malaria Report 2005, op. cit.<br />
18 Malaria surveillance-United States, 2007. MMWR 2009; 58: SS-2<br />
19 Malaria surveillance-United States, 2007. MMWR 2009; 58: SS-2<br />
20 Surveillance <strong>for</strong> foodborne disease outbreaks-United States, 2006. MMWR 2009; 58: 609-15<br />
21 Morse SS, op. cit.<br />
22 Morse SS, op. cit.<br />
23 Dengue hemorrhagic fever—US-Mexico Border, 2005. MMWR 2005; 56: 785-9<br />
24 Influenza A activity-United States, April-August 2009. MMWR 2009; 56: 1009-12<br />
25 MMWR 2009, op. cit.<br />
26 MMWR 2009, op. cit.<br />
27 Kuehn BM. Melamine scandals highlight hazards <strong>of</strong> increasingly globalized food chain. J Am Med<br />
Assoc 2009; 301: 473-5<br />
28 IPCC Fourth Assessment Report, op. cit.<br />
29 IPCC Fourth Assessment Report, op. cit.; Smith DM et al, 2007, op.cit.<br />
30 Marano N, Pappaioanou M. Historical links between human and animal health. Emerg Infect Dis 2004;<br />
12: 2065-6<br />
124
2.4.B. The Arctic Region: Prospects <strong>for</strong> a Great Game or International<br />
Cooperation (Kenneth Yalowitz, Ross Virginia)<br />
Authors and Organization: Kenneth S. Yalowitz, Director, Dickey Center <strong>for</strong> International<br />
Understanding, Dartmouth College; Myers; Ross A. Virginia, Family Pr<strong>of</strong>essor and<br />
Director, Dickey Center Institute <strong>of</strong> Arctic Studies, Dartmouth College<br />
Contact In<strong>for</strong>mation: kenneth.s.yalowitz@dartmouth.edu; ross.a.virginia@dartmouth.edu<br />
The pace <strong>of</strong> ecological, political, social, and economic change in <strong>the</strong> Arctic region is accelerating<br />
due to a warming climate. As <strong>the</strong> Arctic Ocean summer sea ice thins and disappears, new<br />
opportunities and uncertainties are emerging over access to energy reserves, shipping routes, and<br />
fisheries. The traditional way <strong>of</strong> life is changing significantly <strong>for</strong> indigenous peoples and many<br />
Arctic residents who strive to be full partners in developing strategies to adapt to climate change.<br />
While science is providing detailed in<strong>for</strong>mation about climate change and <strong>the</strong> responses <strong>of</strong> Arctic<br />
ecosystems to new wea<strong>the</strong>r and oceanographic conditions, models <strong>of</strong> <strong>the</strong> Arctic have consistently<br />
underestimated <strong>the</strong> rate <strong>of</strong> change, leaving policy makers facing important strategic decisions<br />
about <strong>the</strong> future <strong>of</strong> <strong>the</strong> Arctic sooner than expected.<br />
Imbedded in this complexity are concerns that a less harsh Arctic environment will facilitate<br />
exploitation <strong>of</strong> Arctic resources and trigger a new “great game” <strong>of</strong> international power politics<br />
involving <strong>the</strong> principal Arctic coastal states—<strong>the</strong> United States, Russia, and Canada. This paper<br />
evaluates <strong>the</strong> prospects <strong>for</strong> contrasting outcomes in <strong>the</strong> Arctic region: a return to international<br />
power politics as states seek to claim Arctic energy, extend continental shelves, and en<strong>for</strong>ce <strong>the</strong>ir<br />
will through military means versus <strong>the</strong> emergence <strong>of</strong> increased international cooperation around<br />
environmental protection and sustainable development. 1<br />
Science and Policy<br />
Climate science is unambiguous in its assessment—our planet is a set <strong>of</strong> closely linked physical<br />
systems <strong>of</strong> land, water and atmosphere in which <strong>the</strong> Arctic is integral. Global warming is<br />
affecting <strong>the</strong> world’s wea<strong>the</strong>r, and sea ice in <strong>the</strong> Arctic is melting and thinning rapidly, declining<br />
15% every decade over <strong>the</strong> recent past. Moreover, <strong>the</strong> pace <strong>of</strong> change is accelerating. 2<br />
As scientific understanding <strong>of</strong> climate change advances, policy makers are inundated with crisis<br />
management decisions; specific climate change issues related to <strong>the</strong> Arctic must compete <strong>for</strong><br />
<strong>the</strong>ir attention. Exacerbating this problem is <strong>the</strong> communication gap that exists between scientists<br />
and policy makers. Scientists need to communicate more effectively and accurately with policy<br />
makers and develop better qualitative and quantitative models with which to in<strong>for</strong>m <strong>the</strong>m. And<br />
policy makers must provide scientists with <strong>the</strong> necessary resources to develop useful data and<br />
models.<br />
The traditional ecological knowledge <strong>of</strong> indigenous peoples is an underutilized asset <strong>for</strong><br />
evaluating and understanding <strong>the</strong> processes contributing to rapid environmental change.<br />
Indigenous communities are central stakeholders in scientific assessment and policy<br />
development <strong>for</strong> a sustainable Arctic. Western researchers need to engage more with indigenous<br />
communities and organizations to build bonds <strong>of</strong> communication and trust, so toge<strong>the</strong>r <strong>the</strong>y can<br />
develop a body <strong>of</strong> scientific in<strong>for</strong>mation that values indigenous knowledge on climate change<br />
and adaptation, and integrates it into scientific data.<br />
125
Economics, Resources, and Development<br />
The Arctic region has abundant natural resources—gas, oil, diamonds, coal, iron ore, gold, zinc,<br />
nickel, and o<strong>the</strong>rs. Intensive development <strong>of</strong> non-renewable resources has been ongoing <strong>for</strong> four<br />
decades. In <strong>the</strong> short run, in terms <strong>of</strong> shipping, globalization <strong>of</strong> <strong>the</strong> Arctic and <strong>the</strong> condition <strong>of</strong><br />
<strong>the</strong> global economy are <strong>the</strong> biggest issues controlling rates <strong>of</strong> activity, not climate change. Large<br />
numbers <strong>of</strong> ships—more than 6,000 annually—are already in <strong>the</strong> Arctic <strong>for</strong> tourism, fishing, and<br />
transport, mostly in <strong>the</strong> summer.<br />
There has been great public fanfare about <strong>the</strong> opening up <strong>of</strong> nor<strong>the</strong>rn sea routes and <strong>the</strong><br />
Northwest Passage <strong>for</strong> longer time periods due to sea ice melt, <strong>of</strong>fering cheaper transportation<br />
between Asia and Europe. In fact, <strong>the</strong>re is much uncertainty among shipping experts about<br />
whe<strong>the</strong>r or under what conditions <strong>the</strong>se routes will prove economical. Even using accelerated<br />
climate warming projections, sea ice will remain in place <strong>for</strong> 6-8 months a year, and potentially<br />
dangerous floating ice will remain year round, necessitating <strong>the</strong> use <strong>of</strong> ships designed to meet <strong>the</strong><br />
rigors <strong>of</strong> <strong>the</strong> Arctic Ocean environment and ice breakers <strong>for</strong> winter shipping routes.<br />
Never<strong>the</strong>less, <strong>the</strong>re are important safety and environmental issues. Arctic shipping today is<br />
regulated by voluntary guidelines and inconsistent ad hoc governance regulations. There is a<br />
pressing need <strong>for</strong> stable, rule-based regimes based on <strong>the</strong> United Nations Convention on <strong>the</strong> Law<br />
<strong>of</strong> <strong>the</strong> Sea (UNCLOS) and <strong>the</strong> International Maritime Organization (IMO) rules <strong>for</strong> international<br />
marine coordination in <strong>the</strong> Arctic on safety, emissions, and infrastructure issues. The Arctic<br />
Marine Shipping Assessment 2009 Report <strong>of</strong> <strong>the</strong> Arctic Council is an important step <strong>for</strong>ward.<br />
Mining, extraction and energy exploitation in <strong>the</strong> Arctic has been going on <strong>for</strong> some time. The<br />
largest zinc mine in <strong>the</strong> world (Red Dog Mine in northwestern Alaska) and <strong>the</strong> largest nickel<br />
mine in <strong>the</strong> world (Norilsk Mine in nor<strong>the</strong>rn Siberia) are located <strong>the</strong>re, and prospects are good<br />
<strong>for</strong> development <strong>of</strong> gold, diamonds, and concentrated ores in Greenland and elsewhere. Climate<br />
change affects <strong>the</strong> timing <strong>of</strong> mining, extraction and energy exploitation projects in <strong>the</strong> Arctic and<br />
creates uncertainties in <strong>for</strong>ward planning. Melting ice may improve marine transportation<br />
opportunities, but melting permafrost will decrease <strong>the</strong> duration <strong>of</strong> potential overland travel in<br />
many regions. But <strong>the</strong> most important factors affecting short-term economic development are<br />
price and cost—not climate change—and here <strong>the</strong> current severe economic downturn is having a<br />
major effect. Charters <strong>for</strong> large ore carriers dropped to one percent <strong>of</strong> normal rates shortly after<br />
<strong>the</strong> global downturn, 3 and new or expanded Arctic projects are being delayed by <strong>the</strong> paralysis in<br />
global credit markets.<br />
The main economic prizes in <strong>the</strong> Arctic are oil, gas, and mineral resources. The primary reserves<br />
belong to Russia, and <strong>the</strong> major exploration activity also is <strong>the</strong>irs. Recent estimates from <strong>the</strong> U.S.<br />
Geological Survey indicate that about 30% <strong>of</strong> <strong>the</strong> remaining world reserves <strong>of</strong> natural gas and<br />
some 10% <strong>of</strong> <strong>the</strong> oil are in <strong>the</strong> Arctic region. 4 To date, unresolved issues involving demarcation<br />
<strong>of</strong> sea beds under UNCLOS are not a major issue in <strong>the</strong> pace <strong>of</strong> energy development; ra<strong>the</strong>r, <strong>the</strong><br />
key factors are <strong>the</strong> cost <strong>of</strong> development and <strong>the</strong> unpredictable price cycle <strong>of</strong> oil and gas. Offshore<br />
projects are <strong>the</strong> most costly and <strong>the</strong> most environmentally dangerous, and most <strong>of</strong> <strong>the</strong> known<br />
<strong>of</strong>fshore reserves <strong>of</strong> oil and gas are within national Exclusive Economic Zones (EEZs), which<br />
extend 200 nautical miles from <strong>the</strong> coastline. There<strong>for</strong>e, immediate prospects <strong>for</strong> interstate<br />
conflict over oil and gas reserves appear small.<br />
Concerns <strong>for</strong> energy security will ultimately push development <strong>of</strong> Arctic oil and gas, but <strong>the</strong><br />
financial crisis and <strong>the</strong> slowing <strong>of</strong> world economic activity is depressing energy prices and<br />
126
consumption, making it very difficult to predict <strong>the</strong> pace and extent <strong>of</strong> development. As a result,<br />
<strong>the</strong>re likely will not be pell-mell development in <strong>the</strong> North over <strong>the</strong> near term. This pause due to<br />
<strong>the</strong> slowdown in <strong>the</strong> global economy gives <strong>the</strong> international community <strong>the</strong> chance to develop<br />
environmental and development rules <strong>of</strong> <strong>the</strong> game, an opportunity that should not be lost.<br />
Political and Security Issues<br />
During <strong>the</strong> Cold War, when U.S. and Soviet nuclear submarines patrolled under <strong>the</strong> North Pole<br />
and bombers flew over <strong>the</strong> region, <strong>the</strong> Arctic was a security flashpoint. Today, following <strong>the</strong><br />
breakup <strong>of</strong> <strong>the</strong> Soviet Union, <strong>the</strong> Arctic is largely disassociated from great power politics. Will<br />
that remain <strong>the</strong> case? 5<br />
The countries with military/security interests and naval capacity in <strong>the</strong> Arctic are Russia,<br />
Canada, Norway, Denmark, and <strong>the</strong> United States. Russia’s activities could be disruptive to <strong>the</strong><br />
region if its recent focus on politics and territorial claims retain priority over increased attention<br />
to science and international cooperation. The driving factors may be Russian prestige, identity,<br />
and image, all <strong>of</strong> which converge on borders and territorial claims. Russians do agree that<br />
environmental security is an important Arctic issue and that pollution from outside <strong>the</strong> Arctic<br />
must be reduced. They are not interested in a new international fault line over <strong>the</strong> Arctic.<br />
Canada has never had significant military capability in <strong>the</strong> Arctic, but over <strong>the</strong> past two years it<br />
has conducted operations <strong>the</strong>re to build capacity and presence. This reflects an overall increase in<br />
Canadian interest in <strong>the</strong> Arctic manifested also in development <strong>of</strong> Canadian International Polar<br />
Year (IPY) activities, mapping <strong>for</strong> development purposes, construction <strong>of</strong> new icebreakers, and<br />
opening new research stations. Canada is looking beyond <strong>the</strong> current economic downturn, toward<br />
exploitation <strong>of</strong> gas hydrates twenty years in <strong>the</strong> future, <strong>for</strong> example. Canada has made great<br />
progress in settling Nor<strong>the</strong>rn land claims with First Nation groups. The key issue with <strong>the</strong> U.S. is<br />
whe<strong>the</strong>r <strong>the</strong> Northwest Passage sea route is considered to be Canadian internal water or if it is<br />
considered an international strait as claimed by <strong>the</strong> U.S. This dispute is “frozen” <strong>for</strong> now by<br />
mutual agreement.<br />
Release <strong>of</strong> <strong>the</strong> revised U.S. Arctic Regional Policy occurred in January 2009. 6 The previous<br />
policy, written in 1994, listed meeting post-Cold War national security and defense needs as a<br />
U.S. goal in <strong>the</strong> Arctic. The new U.S. statement reiterates this goal. “The United States is an<br />
Arctic nation, with varied and compelling interests in <strong>the</strong> region,” with “broad and fundamental<br />
national security interests . . . and is prepared to operate ei<strong>the</strong>r independently or in conjunction<br />
with o<strong>the</strong>r states to safeguard <strong>the</strong>se interests.” However, <strong>the</strong> declining condition and capacity <strong>of</strong><br />
<strong>the</strong> U.S. ice breaker fleet is a sign <strong>of</strong> disinterest on Washington’s part in military or security<br />
threats emanating in <strong>the</strong> region from current disputed issues. It is also a serious limitation <strong>for</strong><br />
U.S. science in <strong>the</strong> Polar Regions.<br />
Anticipated territorial claims under UNCLOS leave large portions <strong>of</strong> <strong>the</strong> Arctic Ocean<br />
unclaimed, and some smaller zones have <strong>the</strong> potential <strong>for</strong> overlapping claims. For <strong>the</strong> past thirty<br />
years, unresolved claims between Russia and Norway have not prevented cooperation in<br />
managing fish stocks in <strong>the</strong> Barents Sea. States should be able to adjudicate overlapping claims<br />
through UNCLOS. Ano<strong>the</strong>r possible approach is joint management or <strong>the</strong> establishment <strong>of</strong> a<br />
commons over <strong>the</strong> disputed areas. The need <strong>for</strong> large-scale ecosystem-based management<br />
regimes to protect <strong>the</strong> integrity <strong>of</strong> <strong>the</strong> Arctic Ocean is receiving increasing attention, including<br />
proposals <strong>for</strong> an Arctic treaty or park in order to manage and protect <strong>the</strong> Arctic Ocean as an<br />
international commons.<br />
127
Security concerns and issues do not seem to be <strong>the</strong> pressing factor driving Arctic policy. There<br />
are no large geo-political fault lines, and no resource wars are anticipated. The May 28, 2008,<br />
Illulissat Declaration <strong>of</strong> <strong>the</strong> Five Arctic Coastal States 7 commits <strong>the</strong> states to resolving boundary<br />
and extended continental shelf claims issues under UNCLOS.<br />
Governance and Institutions<br />
Until now, international Arctic governance has been led by <strong>the</strong> Arctic Council, an organization<br />
<strong>of</strong> eight Arctic states, six permanent Participating Parties (indigenous peoples’ organizations),<br />
and observers. The Council and its bodies have played an important role in focusing attention on<br />
environmental and climate-related issues; however, <strong>the</strong> Council has no en<strong>for</strong>cement mechanism,<br />
and security and political issues are not within its purview.<br />
Governance within <strong>the</strong> Arctic presents unique challenges. 8 Unlike Antarctica, <strong>the</strong> Arctic is not a<br />
continent, but it has permanent residents, considerable natural resources, and a high degree <strong>of</strong><br />
developed industrial activity. While Antarctica is burdened with territorial disputes, most<br />
territorial claims in <strong>the</strong> Arctic are not overlapping. Unlike Antarctica, <strong>the</strong> Arctic has strategic<br />
importance and was a venue <strong>for</strong> Cold War competition. These are some <strong>of</strong> <strong>the</strong> reasons why it is<br />
unlikely that an Antarctic-like treaty that provides <strong>for</strong> complete demilitarization, freezing <strong>of</strong><br />
territorial claims, and freedom <strong>of</strong> scientific research will be concluded <strong>for</strong> <strong>the</strong> Arctic.<br />
What are <strong>the</strong> views <strong>of</strong> <strong>the</strong> major stakeholders on this multitude <strong>of</strong> issues? Canada wants a stable,<br />
rule-based regime in <strong>the</strong> Arctic within which it can promote economic and social development,<br />
protect <strong>the</strong> environment, improve and develop governance, and exercise its Arctic sovereignty.<br />
Canada’s dispute with <strong>the</strong> U.S. over <strong>the</strong> Northwest Passage, as well as <strong>the</strong> U.S. dispute with<br />
Russia over Nor<strong>the</strong>rn Sea Route (NSR) straits, concerns <strong>the</strong>ir legal status—whe<strong>the</strong>r <strong>the</strong>y are<br />
internal or international passageways—not ownership or sovereignty. The sides now agree to<br />
disagree. For Canada, <strong>the</strong> Ilulissat Declaration and UNCLOS represent <strong>the</strong> core <strong>of</strong> Canadian<br />
policy regarding navigation and access to ocean resources.<br />
Russia’s governance viewpoint seems close to that <strong>of</strong> Canada; that is, <strong>the</strong> Nor<strong>the</strong>rn Sea Route is<br />
internal Russian waters. They also believe that <strong>the</strong> current international regimes are adequate <strong>for</strong><br />
solving problems. Russia’s declared policy is strongly supportive <strong>of</strong> <strong>the</strong> Arctic Council, but its<br />
actions are not always consistent with this policy. Russia does not endorse <strong>the</strong> idea <strong>of</strong> a new<br />
international treaty on <strong>the</strong> Arctic and believes that <strong>the</strong>re is little support <strong>for</strong> it. Russia believes<br />
that UNCLOS is very important and is critical <strong>of</strong> <strong>the</strong> U.S. failure to ratify it.<br />
There is broad support in <strong>the</strong> Obama administration <strong>for</strong> ratifying UNCLOS. They are expending<br />
considerable ef<strong>for</strong>t to deal internationally with climate change issues, especially engaging with<br />
India and China. The U.S. strongly supports <strong>the</strong> Arctic Council, but it is open, in principle, to<br />
consider modifications to <strong>the</strong> Council’s structure and programs.<br />
Conclusions<br />
The Arctic strongly influences world climatic conditions, and in turn it is deeply affected by<br />
climate change and o<strong>the</strong>r outside factors, principally industrial pollution.<br />
The North will be at <strong>the</strong> center <strong>of</strong> debate over international energy and environmental security<br />
issues. Competition <strong>for</strong> mineral resources such as zinc, gold, diamonds, and even fresh water will<br />
become more intense. While climate change influences <strong>the</strong> timing <strong>of</strong> Arctic resource<br />
development, <strong>the</strong> primary factors are price and cost. Regional social and economic instability are<br />
likely to increase if international agreement cannot be reached to reduce greenhouse gas<br />
128
emissions. Economic activity, mainly mining and energy, which has been steadily increasing,<br />
now is affected by <strong>the</strong> overall economic decline, as well as <strong>the</strong> drop in price and demand <strong>for</strong><br />
fuels and commodities. Even with <strong>the</strong> melting <strong>of</strong> sea ice, nor<strong>the</strong>rn waterways will remain risky<br />
due to floating ice and undeveloped infrastructure. The biggest risks are safety at sea and<br />
environmental contamination <strong>of</strong> <strong>the</strong> water. Organizations such as <strong>the</strong> IMO and <strong>the</strong> Arctic<br />
Council must face up to <strong>the</strong>se challenges.<br />
Improved communication on many levels is a necessity, especially between scientists and<br />
policymakers. Scientists declare that climate change is causing major problems in <strong>the</strong> North, but<br />
<strong>the</strong>y do not specify starting points <strong>for</strong> action, priorities, or clear steps to take in response. More<br />
targeted research is needed, as well as basic research regarding where <strong>the</strong> abrupt turning points<br />
may occur and when. On <strong>the</strong> o<strong>the</strong>r hand, policymakers must provide better guidance and<br />
sustained funding to scientists if <strong>the</strong>y expect to obtain useful data and models.<br />
In <strong>the</strong> Arctic, where <strong>the</strong>re are no fundamental security issues, “great game” language should not<br />
be applicable. States are not yet defining <strong>the</strong>ir interests in zero sum terms. No geo-political fault<br />
lines reminiscent <strong>of</strong> <strong>the</strong> Cold War are evident. There are, however, some U.S.-Russian military<br />
tensions that bear watching. The U.S., Canada, and Russia all approach <strong>the</strong> Arctic in a statecentric<br />
fashion, so <strong>the</strong> applicable political model <strong>for</strong> this region is that <strong>of</strong> traditional interstate<br />
negotiations as typified by (1) <strong>the</strong> Ilulissat Declaration <strong>of</strong> <strong>the</strong> five Arctic States, and<br />
(2) management <strong>of</strong> border-resources issues under UNCLOS. Climate change, ra<strong>the</strong>r than security<br />
risks, is producing environmental issues that require new or bolstered institutional responses.<br />
For <strong>the</strong> <strong>for</strong>eseeable future, <strong>the</strong> Arctic Council will be <strong>the</strong> principal body <strong>of</strong> governance in <strong>the</strong><br />
North, and it assumes a key responsibility in helping to ensure regional environmental security.<br />
The Council has had a non-permanent secretariat funded by Norway <strong>for</strong> six years. With no<br />
political/security issues on <strong>the</strong> horizon, <strong>the</strong> Council is best situated to deal with issues resulting<br />
from globalization <strong>of</strong> <strong>the</strong> Arctic such as increased shipping, environmental security, etc. There is<br />
a broadly felt need <strong>for</strong> high-level policy attention to Arctic issues, and a permanent Arctic<br />
Council secretariat could provide that focus and develop recommendations <strong>for</strong> addressing<br />
functional issues.<br />
The environment and <strong>the</strong> management <strong>of</strong> natural resources are <strong>the</strong> most pressing security issues<br />
in <strong>the</strong> North. Large-scale damage to <strong>the</strong> Arctic environment from transportation accidents,<br />
energy development, fishing, tourism, and <strong>the</strong> long-range transport <strong>of</strong> pollutants from <strong>the</strong> South<br />
pose greater immediate threats to <strong>the</strong> ecosystem and national priorities than classic security<br />
issues.<br />
↑ Back to <strong>the</strong> top<br />
1 This paper is generally based on <strong>the</strong> outcome <strong>of</strong> a conference held at Dartmouth College, December 1-<br />
3, 2008. For a summary and conclusions see <strong>the</strong> published report: Yalowitz, K. S., J. F. Collins, and R.<br />
A. Virginia. 2009. The Arctic Climate Change and Security Policy Conference—Final Report and<br />
Findings. Carnegie Endowment <strong>for</strong> International Peace, Washington D.C., 36 pgs.<br />
2 For scientific assessments <strong>of</strong> climate change in <strong>the</strong> Arctic see, Arctic Climate Impact Assessment—<br />
<strong>Scientific</strong> Report, 2005, Cambridge University Press. For <strong>the</strong> most recent U.S. regional climate<br />
assessment that includes in<strong>for</strong>mation on Alaska see, Global Climate Change Impacts in <strong>the</strong> United<br />
States, 2009, a report <strong>of</strong> <strong>the</strong> U.S. Global Change Research Program (USGCRP)<br />
129
3 Yalowitz, p. 13<br />
4 Gautier, G. L. K. J. Bird, R. R. Charpentier et al., 2009. Assessment <strong>of</strong> undiscovered oil in <strong>the</strong> Arctic.<br />
Science 324: 1175-1179, DOI: 10.1126/science.1169467<br />
5 See Borgerson, S. G. 2008. Arctic meltdown: The economic and security implications <strong>of</strong> global<br />
warming. Foreign Affairs, March/April 2008.<br />
6 <strong>National</strong> Security Presidential Directive and Homeland Security Presidential Directive, January 12,<br />
2009, NATIONAL SECURITY PRESIDENTIAL DIRECTIVE/NSPD – 66, HOMELAND<br />
SECURITY PRESIDENTIAL DIRECTIVE/HSPD -- 25<br />
7 Available at www.oceanlaw.org/downloads/arctic/Ilulissat_Declaration.pdf<br />
8 Young, O. R. 2009. Whi<strong>the</strong>r <strong>the</strong> Arctic? Conflict or cooperation in <strong>the</strong> circumpolar North. Polar Record<br />
45:73-82.<br />
130
2.4.C. Changing Climate Impacts to Water Resources: Implications <strong>for</strong> Stability<br />
(Kathleen White, J.Rolf Olsen, Levi Brekke, David Raff, Roger Pulwarty,<br />
Robert Webb)<br />
Authors and Organizations: Kathleen D. White and J. Rolf Olsen, US Army Corps <strong>of</strong> Engineers;<br />
Levi D. Brekke and David A. Raff, U.S. Bureau <strong>of</strong> Reclamation;<br />
Roger S. Pulwarty and Robert Webb, <strong>National</strong> Oceanic and Atmospheric<br />
Administration<br />
Contact In<strong>for</strong>mation: Kathleen.D.White@usace.army.mil J.Rolf.Olsen@usace.army.mil,<br />
LBrekke@usbr.gov; DRAFF@do.usbr.gov; Roger.Pulwarty@noaa.gov,<br />
Robert.S.Webb@noaa.gov<br />
Abstract<br />
Climate encompasses change and variability by definition. The occurrence <strong>of</strong> a changing and<br />
variable climate has been observed in decades <strong>of</strong> environmental monitoring from a multitude <strong>of</strong><br />
federal, state, and local data collection networks throughout <strong>the</strong> world, and it has been<br />
documented in <strong>the</strong> paleoclimate record. Although regional in range, primary indicators <strong>of</strong> recent<br />
global climate change as seen by water resources managers are increases in temperature, as well<br />
as <strong>the</strong> frequency and intensity <strong>of</strong> heavy downpours. Both obvious and subtle impacts are to <strong>the</strong><br />
entire hydrologic cycle and are manifested as changes in <strong>the</strong> supply and demand <strong>for</strong> water.<br />
Impacts include <strong>the</strong> spatial and temporal occurrence and distribution <strong>of</strong> precipitation, rainfall<br />
intensity and duration, <strong>for</strong>m (frozen or not), changes in <strong>the</strong> timing and extent <strong>of</strong> melting and<br />
run<strong>of</strong>f, as well as evapotranspiration and evaporation. Just as changing hydrologic conditions can<br />
have both adverse and positive impacts, so too can <strong>the</strong>y provide both challenges and<br />
opportunities to water resources managers. Since water resources are a fundamental requirement<br />
<strong>for</strong> human health and economic growth, <strong>the</strong>y are also a fundamental driver <strong>of</strong> political stability<br />
or instability in various regions <strong>of</strong> <strong>the</strong> world. This security threat was recognized during an April<br />
2007 United Nations Security Council debate on impacts <strong>of</strong> climate change to peace and<br />
security. This paper discusses climate change in <strong>the</strong> context <strong>of</strong> water resources management,<br />
including potential implications <strong>for</strong> instability. Water resources managers are already<br />
accustomed to dealing with changes in land use, demographics, and social values. These water<br />
management techniques can provide a potential reservoir <strong>of</strong> resilience <strong>for</strong> operations in <strong>the</strong> face<br />
<strong>of</strong> climate change if water managers are prepared to act effectively in a timely fashion.<br />
Embedding a strategy <strong>of</strong> proactive and cooperative water management into planning can enhance<br />
stability by mitigating <strong>the</strong> potential <strong>for</strong> increased conflict over water in a changing climate.<br />
Introduction<br />
To date, <strong>the</strong> Intergovernmental Panel on Climate Change (IPCC) has produced four assessment<br />
reports which explore in detail <strong>the</strong> physical science basis <strong>of</strong> climate change, observed and<br />
projected climate impacts and vulnerabilities, and climate change adaptation and mitigation<br />
strategies, along with special reports on such issues as emissions scenarios. 1<br />
In <strong>the</strong> syn<strong>the</strong>sis report <strong>for</strong> <strong>the</strong> Fourth Assessment, IPCC 2 reports that “Warming <strong>of</strong> <strong>the</strong> climate<br />
system is unequivocal, as is now evident from observations <strong>of</strong> increases in global average air and<br />
ocean temperatures, widespread melting <strong>of</strong> snow and ice and rising global average sea level.”<br />
More recently, a technical paper on climate change and water 3 indicated “that freshwater<br />
resources are vulnerable and have <strong>the</strong> potential to be strongly impacted by climate change.”<br />
131
Stern addresses <strong>the</strong> impacts <strong>of</strong> global climate change, stating that “Climate change threatens <strong>the</strong><br />
basic elements <strong>of</strong> life <strong>for</strong> people around <strong>the</strong> world – access to water, food, health, and use <strong>of</strong> land<br />
and <strong>the</strong> environment.” 4<br />
There is a long history <strong>of</strong> conflict related to water and especially to access to fresh water. 5,6,7 In<br />
1993 Gleick concluded that “Water already contributes to conflicts among nations, and future<br />
conflicts over water are increasingly likely.” 8 Rising sea levels may impact water supplies and<br />
increase lowland flooding, with <strong>the</strong> potential <strong>for</strong> <strong>for</strong>ced migration <strong>of</strong> large numbers <strong>of</strong> people. 9,10<br />
In 2007, <strong>the</strong> United Nations Security Council 2007 11 noted that island nations are facing climate<br />
change impacts that are “… no less threatening than <strong>the</strong> dangers guns and bombs posed to large<br />
nations.” Schwartz and Randall concluded that climate change could result in increased conflict<br />
threatening U.S. national security, 12 and <strong>the</strong> 55 delegations participating in <strong>the</strong> initial United<br />
Nations Security Council (2007) debate on <strong>the</strong> impacts <strong>of</strong> climate change raised issues<br />
potentially impacting global peace and security.<br />
This paper reviews potential climate change impacts to water resources management and<br />
examines vulnerabilities and risks associated with potential conflicts. Considering water<br />
resources decision-making in <strong>the</strong> face <strong>of</strong> climate change as a class <strong>of</strong> “Wicked Problems” 13<br />
provides a framework <strong>for</strong> collaborative solutions based on scenario planning. Scenario planning<br />
in water resources management can enhance preparedness, thus providing a reservoir <strong>of</strong><br />
resilience that can mitigate adverse consequences. The paper next addresses climate change<br />
adaptation and mitigation strategies as <strong>the</strong>y relate to stability. Given <strong>the</strong> critical nature <strong>of</strong> water<br />
resources in conflict and security discussions, <strong>the</strong> paper identifies a pivotal role that water<br />
managers may play in developing and implementing strong early actions that could reduce and<br />
alleviate <strong>the</strong> potential <strong>for</strong> conflict within <strong>the</strong> U.S., with U.S. bordering countries, or international<br />
conflicts between o<strong>the</strong>r countries.<br />
Climate Change Impacts to Water Resources<br />
Climate change poses numerous challenges to water resources managers because it affects<br />
fundamental drivers <strong>of</strong> <strong>the</strong> hydrological cycle as it circulates between <strong>the</strong> atmosphere, <strong>the</strong> earth<br />
surface, and oceans. Important drivers include precipitation, evaporation, condensation, and<br />
wind. Recently, <strong>the</strong> four major Federal agencies in <strong>the</strong> United States that manage water resources<br />
and water resources data and in<strong>for</strong>mation collaborated on a report providing a comprehensive<br />
assessment <strong>of</strong> approaches to climate variability and change in water resources management.<br />
These four agencies, two termed “operating agencies” (<strong>the</strong> US Army Corps <strong>of</strong> Engineers<br />
[USACE] and <strong>the</strong> Bureau <strong>of</strong> Reclamation [Reclamation]) and two termed “science agencies” (<strong>the</strong><br />
US Geological Survey [USGS] and <strong>the</strong> <strong>National</strong> Oceanic and Atmospheric Administration<br />
[NOAA]) published USGS Circular 1331 “Climate Change and Water Resources Management:<br />
A Federal Perspective” in February 2009. 14 The report provides a foundation upon which future<br />
agency policies, methods, and processes will be based. Although geared toward <strong>the</strong> U.S., <strong>the</strong><br />
findings <strong>of</strong> this report are applicable to global considerations <strong>of</strong> climate change as it impacts<br />
water resources. Significant issues not addressed by Brekke et al include increased drought<br />
conditions in arid areas, <strong>the</strong> impacts <strong>of</strong> glacial melt on water supply, and <strong>the</strong> benefits <strong>of</strong><br />
ecosystems in a changing climate. The key findings <strong>of</strong> Brekke et al related to climate change<br />
impacts to water resources are summarized as follows:<br />
132
1. The best available scientific evidence based on observations from long-term<br />
hydrometeorological monitoring networks indicates that climate change is occurring,<br />
although <strong>the</strong> effects differ regionally.<br />
2. Climate change could affect all sectors <strong>of</strong> water resources management [emphasis<br />
added], since it may require changed design and operational assumptions about resource<br />
supplies, system demands or per<strong>for</strong>mance requirements, and operational constraints.<br />
The assumption <strong>of</strong> temporal stationarity (defined by Milly et al [2008] as “<strong>the</strong> idea that<br />
natural systems fluctuate within an unchanging envelope <strong>of</strong> variability” 15 ) in hydro<br />
climatic variables should be evaluated along with all o<strong>the</strong>r assumptions.<br />
3. Climate change is but one <strong>of</strong> many challenges facing water resource managers. A holistic<br />
approach to water resources management includes all significant drivers <strong>of</strong> change, as<br />
shown in Table 2.4.C-1.<br />
USGS Circular 1331 stresses <strong>the</strong> importance <strong>of</strong> long-term monitoring networks (Key Point 4) at<br />
locations that describe <strong>the</strong> climate signal (Key Point 5), and <strong>the</strong> need <strong>for</strong> research and monitoring<br />
to fill knowledge gaps required to improve water resources management (Key Point 12). Water<br />
resources management in many regions <strong>of</strong> <strong>the</strong> world, at a minimum, will likely be affected by <strong>the</strong><br />
changes listed in Table 1 thus <strong>the</strong> emphasis on monitoring and development <strong>of</strong> new knowledge.<br />
In essence, <strong>the</strong>se findings underscore those <strong>of</strong> Stern (2009), who points out that, despite <strong>the</strong><br />
atmospheric drivers <strong>of</strong> climate change, it is <strong>the</strong> resulting changes in water on <strong>the</strong> land surface, in<br />
<strong>the</strong> <strong>for</strong>m <strong>of</strong> “storms, droughts, floods, rising sea levels,” that is <strong>the</strong> primary source <strong>of</strong> climate<br />
change damages and hence drives climate change vulnerabilities. 16<br />
Table 2.4.C-1. Potential Environmental and Socioeconomic Changes Affecting Water<br />
Resources Management Decision-making. 17,18<br />
Climate-induced<br />
Non-climate-induced<br />
Changes in rain-snow partitioning<br />
Vertical land movement<br />
Changes in precipitation intensity, frequency, Population growth<br />
sequencing<br />
Changes in air and water temperature<br />
Changes in land use<br />
Changes in snow melt volume and timing<br />
Changes in social values<br />
Changes in glacier melt<br />
Changes in water use<br />
Accelerated sea level rise<br />
Changes in sediment budgets<br />
Changes in sea-surface temperature<br />
Changes in economic conditions<br />
Changes in wind and wave patterns<br />
Changes in tropical and extra-tropical storm<br />
intensity and frequency<br />
Changes in drought frequency and intensity<br />
Changes in sediment budgets<br />
Altered wild-land fire conditions<br />
Changes resulting from climate adaptation<br />
measures<br />
Changes resulting from mitigation measures<br />
Resources available to maintain and<br />
improve infrastructure<br />
133
Vulnerabilities to Climate Change and Conflict<br />
According to IPCC, vulnerability is defined as “<strong>the</strong> degree to which a system is susceptible to,<br />
and unable to cope with, adverse effects <strong>of</strong> climate change, including climate variability and<br />
extremes. Vulnerability is a function <strong>of</strong> <strong>the</strong> character, magnitude, and rate <strong>of</strong> climate change and<br />
variation to which a system is exposed, its sensitivity, and its adaptive capacity.” 19 Detailed<br />
descriptions <strong>of</strong> global vulnerabilities to climate change are provided in <strong>the</strong> IPCC Fourth<br />
Assessment Working Group II Report 20 and <strong>the</strong> IPCC technical paper on climate and water. 21<br />
Brekke et al (2009) identify <strong>the</strong> following climate changes as being <strong>of</strong> most concern to water<br />
resources managers in <strong>the</strong> U.S.:<br />
Temperature increases that are expected to change <strong>the</strong> mix <strong>of</strong> precipitation toward more<br />
rain and less snow, impact evaporation and transpiration processes, and potentially<br />
change water temperatures and ocean circulation to alter <strong>the</strong> intensity and frequency <strong>of</strong><br />
coastal storms<br />
Precipitation changes, including regional and seasonal changes as well as changes in <strong>the</strong><br />
intensity and frequency and extremes <strong>of</strong> precipitation. 22<br />
These changes, toge<strong>the</strong>r with those identified in Table 2.4.C-1, can impact water availability,<br />
demand, and quality; <strong>the</strong> per<strong>for</strong>mance <strong>of</strong> flood and coastal storm risk reduction, stormwater, and<br />
wastewater infrastructure; wild-land fires; ecosystem functioning; navigation; and energy<br />
production and demand. 23 Fur<strong>the</strong>rmore, <strong>the</strong> impacts <strong>of</strong> <strong>the</strong>se climate changes on water can be<br />
amplified or can be suppressed by natural variability. The changes and <strong>the</strong>ir impacts will be<br />
unevenly distributed across <strong>the</strong> globe. It is well known that <strong>the</strong> relationship between global<br />
average temperature changes and regional climate changes is very uncertain, particularly <strong>for</strong><br />
precipitation. Stern (2006) suggests potential impacts associated with varying levels <strong>of</strong><br />
atmospheric levels <strong>of</strong> GHG (expressed as CO 2e or carbon-equivalents) at stabilization. 24 As<br />
shown in Figure 2.4.C-1, <strong>the</strong>re is clearly a range <strong>of</strong> uncertainty in <strong>the</strong> temperatures projected <strong>for</strong><br />
CO 2e stabilization levels. Never<strong>the</strong>less, it is possible to describe potential impacts expected at<br />
different levels <strong>of</strong> warming. This figure shows potential impacts in different sectors and regions<br />
based on scientific literature available at that time.<br />
134
Figure 2.4.C-1. Potential Climate Change Impacts Resulting from a Range <strong>of</strong> CO 2e Stabilization<br />
Levels. (Confidence limits [5% and 95%] and mean <strong>of</strong> <strong>the</strong> 50 th percentile shown <strong>for</strong> expected average<br />
global temperatures.) 25<br />
135
Considering <strong>the</strong> historical evidence that water and water resources management systems have<br />
been used as both <strong>of</strong>fensive and defensive weapons in conflicts throughout <strong>the</strong> world, 26,27 a<br />
correlative approach would predict increased conflict due to increased social, political, and<br />
economic stress induced by climate change. 28 The Stern Review also suggested that increased<br />
water supply vulnerabilities in a changing climate could increase <strong>the</strong> potential <strong>for</strong> conflict. 29<br />
Critical regions where vulnerabilities could result in increased conflict can be identified by a<br />
variety <strong>of</strong> screening methods. 30,31 For example, Alcamo and Henrichs (2002) identified critical<br />
regions (defined by <strong>the</strong>m as those whose water resources have higher sensitivity to global change<br />
than o<strong>the</strong>r regions) <strong>for</strong> a variety <strong>of</strong> socio-economic scenarios that include climate change (~0.2°C<br />
rise in global air temperature per decade). 32 For all scenarios, <strong>the</strong>y identified central Mexico, <strong>the</strong><br />
Middle East, large parts <strong>of</strong> Indian sub-continent, and stretches <strong>of</strong> <strong>the</strong> North African coast as<br />
being at risk <strong>for</strong> increased water stress. On <strong>the</strong> o<strong>the</strong>r hand, Trondalen (2009) identifies<br />
demographics and land use as factors more critical than climate change in <strong>the</strong> Middle-East, and<br />
supports Key Point 3 above, saying that “<strong>the</strong> impact <strong>of</strong> climate change on water security should<br />
be seen in a broader water development and conflict context.” 33 Within <strong>the</strong> U.S., <strong>the</strong> Department<br />
<strong>of</strong> Interior Water 2025 initiative was implemented to promote innovative approaches to minimize<br />
conflicts between water users through better management and more efficient use. The Western<br />
Governors’ Association advocated <strong>for</strong> <strong>the</strong> creation <strong>of</strong> <strong>the</strong> <strong>National</strong> Integrated Drought<br />
In<strong>for</strong>mation System (NIDIS) to move <strong>the</strong> country toward a proactive approach to avoid conflicts<br />
and minimize <strong>the</strong> damage caused by droughts.<br />
However, future changes in conflict due to climate change are not fully understood and may not<br />
be inevitable. 34,35,36 Wolf et al state that “<strong>the</strong> record <strong>of</strong> acute conflict over international water<br />
resources is overwhelmed by <strong>the</strong> record <strong>of</strong> cooperation,” and <strong>the</strong>y found no pattern <strong>of</strong> impact by<br />
climate on water disputes. 37 More efficient water resources management could also result in<br />
decreased conflict or help to avoid conflict. For example, Hendrix and Glaser conclude that if<br />
agricultural methods in sub-Saharan Africa were to change to methods that are not so rainfalldependent,<br />
predicted conflict could be mitigated. 38 Nordas and Gleditsch also note that “<strong>the</strong><br />
study <strong>of</strong> climate change and conflict needs to balance <strong>the</strong> positive and negative effects <strong>of</strong> climate<br />
change as well as <strong>the</strong> effects <strong>of</strong> various strategies <strong>of</strong> adaptation.” 39 Ravnborg has emphasized<br />
that “water-related conflicts are caused by <strong>the</strong> way in which water and its uses are governed”<br />
ra<strong>the</strong>r than just <strong>the</strong> lack <strong>of</strong> water. 40 Since development, management, and delivery <strong>of</strong> water are<br />
<strong>the</strong> primary tools <strong>for</strong> implementing water governance, 41 an opportunity exists <strong>for</strong> water resource<br />
management practices to decrease <strong>the</strong> potential <strong>for</strong> conflict over water as climate changes<br />
through activities such as enhanced planning <strong>for</strong> sustainability.<br />
Climate Change and Water Resources: Solving “Wicked Problems”<br />
Developing plausible solutions to predict <strong>the</strong> likelihood <strong>of</strong> conflict will require resolving <strong>the</strong><br />
multiple and <strong>of</strong>ten conflicting objectives <strong>of</strong> various stakeholders. These objectives are <strong>of</strong>ten<br />
highly complex and difficult to model, even be<strong>for</strong>e climate change consideration. Solutions to<br />
<strong>the</strong>se problems could enhance or reduce stability in <strong>the</strong> face <strong>of</strong> changing climate on water<br />
resources. The term “wicked problems” was coined by Rittel and Webber to describe problems<br />
that are complex, resistant to solution, and have both numerous and conflicting intervention<br />
points and outcomes. 42 Traditional problem solving methods such as ga<strong>the</strong>ring more data,<br />
attempting to define <strong>the</strong> problem more clearly, and breaking <strong>the</strong> problem into smaller parts are<br />
not sufficient to manage wicked problems. 43 For problems <strong>of</strong> low complexity (which Kahane<br />
describes as those whose causes and effects are close in space and time, involve process that are<br />
136
familiar and predictable, and align with common assumptions, values, rationales and objectives),<br />
<strong>the</strong> traditional problem-solving processes that are piecemeal, backward looking, and<br />
authoritarian, can be successful. Solving highly complex problems (i.e., those whose causes and<br />
effects are far apart in space and time, are unfamiliar and unpredictable, and <strong>for</strong> which <strong>the</strong>re is a<br />
low degree <strong>of</strong> common assumptions, values, rationales, and objectives) requires processes that<br />
are “systemic, emergent and participatory.” 44 These processes will require new methods <strong>of</strong><br />
communicating risks, inclusion <strong>of</strong> social as well as physical science in problem approaches, and<br />
problem-solving processes that include parallel approaches ra<strong>the</strong>r than simple sequential steps.<br />
Water policy, water resources management, and climate change adaptation have been identified<br />
as “wicked problems.” 45,46,47 Freeman cites water policy problems in particular as: “…integrating<br />
[two] very different types <strong>of</strong> knowledge, <strong>of</strong> working across several socio-political units <strong>of</strong><br />
analysis simultaneously, and <strong>of</strong> better organizing water as a common resource.” 48 However,<br />
solutions can occur when <strong>the</strong> problem-solving process explicitly addresses <strong>the</strong> social<br />
components. As noted by Wolf et al, “Overall, shared interests, human creativity and<br />
institutional capacity along a waterway seem to consistently ameliorate water’s conflict-inducing<br />
characteristics. Fur<strong>the</strong>rmore, once cooperative water regimes are established through treaties,<br />
<strong>the</strong>y turn out to be impressively resilient over time, even when between o<strong>the</strong>rwise hostile<br />
riparians.” 49 Climate change may exacerbate existing stressors in a system, increasing<br />
complexity even when a wicked problem has achieved some level <strong>of</strong> stability. In particular,<br />
climate change poses a wicked problem with respect to stationarity, which is a fundamental<br />
assumption underlying past water resources development. 50 This assumption allowing backwardlooking<br />
problem-solving must be replaced with a more dynamic view <strong>of</strong> <strong>the</strong> physical processes<br />
important in water resources development that is compatible with climate change, one that<br />
addresses nonlinear solutions and confounding and synergistic stresses and shocks. 51<br />
The water resources decision-making environment (e.g., social values, knowledge, economic<br />
factors) is changing along with climate. This evolution is an important step in beginning to<br />
characterize wicked problems and develop a range <strong>of</strong> possible solutions. Just as structured<br />
scenarios—combining quantitative and qualitative in<strong>for</strong>mation in developing potential future<br />
conditions—can increase resilience to unpredictable or surprise results in social-ecological<br />
systems, 52,53 <strong>the</strong>y may also be useful in wicked problems related to water resources and climate<br />
change. As pointed out by Shoemaker and Mavaddat, scenarios are especially useful in cases<br />
when important factors cannot be <strong>for</strong>mally modeled (e.g., <strong>the</strong> effects <strong>of</strong> new regulations on<br />
development, <strong>the</strong> potential <strong>for</strong> climate adaptation measures to reduce vulnerability to climate<br />
change). 54 They also describe scenario planning as a useful tool to reveal and organize<br />
uncertainties in <strong>the</strong> type <strong>of</strong> complex and volatile environment that exists <strong>for</strong> water resources<br />
managers now and in <strong>the</strong> future. Development <strong>of</strong> alternative solutions to multiple scenarios<br />
provides an opportunity to evaluate <strong>the</strong> robustness <strong>of</strong> alternatives to a range <strong>of</strong> future conditions.<br />
The use <strong>of</strong> scenarios also allows us to recognize significant changes and rapidly adapt to <strong>the</strong>m, 55<br />
and to support robust water resources decision-making. Finally, scenario planning is useful in<br />
cases where our actions can change <strong>the</strong> future, as in <strong>the</strong> case <strong>of</strong> climate adaptation and<br />
mitigation.<br />
Climate Change Adaptation and Mitigation<br />
Climate change adaptation related to water resources can be defined generally as water resource<br />
management adjustments or changes in water resources management decision-making to<br />
enhance resilience or reduce vulnerability to observed or expected changes in climate. Climate<br />
137
change mitigation can be defined generally as water resources management adjustments or<br />
changes to reduce <strong>the</strong> potential effects <strong>of</strong> global warming, through reduced demand <strong>for</strong><br />
greenhouse gas-intensive goods and services, increased efficiency, implementation <strong>of</strong> more lowcarbon<br />
technologies, and o<strong>the</strong>rwise reducing fossil fuel emissions. The potential role <strong>of</strong> water<br />
resources managers to enhance social, economic, and security stability in <strong>the</strong> face <strong>of</strong> climate<br />
change is fur<strong>the</strong>r supported considering that adaptation and mitigation are both required to<br />
potentially reduce climate change risks. 56<br />
Brekke et al (2009) identified water resources climate change adaptation options in <strong>the</strong><br />
categories <strong>of</strong> operational, demand management, and infrastructure changes, and emphasized <strong>the</strong><br />
value <strong>of</strong> adaptive management based on plausible future scenarios. 57 They suggest that a robust<br />
evaluation <strong>of</strong> planning alternatives is possible through developing climate scenarios with a wide<br />
variety <strong>of</strong> hydroclimatic conditions, which can be based on integrating paleoclimate in<strong>for</strong>mation<br />
and stochastic modeling. 58 (This topic is also discussed in Circular 1331 Key Points 9 and 10):<br />
9. Adopting [climate change adaptation in <strong>the</strong> <strong>for</strong>m <strong>of</strong> operational, management, or<br />
infrastructure] alternatives that per<strong>for</strong>m well over a wide range <strong>of</strong> future scenarios could<br />
improve system flexibility. Water resources planning and management requires an<br />
appreciation <strong>of</strong> existing and potential future uses <strong>of</strong> water resources, particularly when<br />
public health and safety are involved.<br />
10. Adaptive management is a [collaborative] approach where decisions are made<br />
sequentially over time and allows adjustments to be made as more in<strong>for</strong>mation is known.<br />
This approach may be useful [as a climate change adaptation measure] in dealing with <strong>the</strong><br />
additional uncertainty introduced by potential climate change. 59<br />
The conclusion <strong>of</strong> <strong>the</strong> Stern Review regarding climate change mitigation was that “<strong>the</strong> benefits<br />
<strong>of</strong> strong, early action considerably outweigh <strong>the</strong> costs.” 60 In <strong>the</strong> same vein, Trondalen concluded<br />
that when climate change aggravates existing water stressors, early action—especially<br />
cooperative frameworks between countries that include monitoring and appropriate use <strong>of</strong> <strong>the</strong><br />
precautionary principle—is required. 61 (The precautionary principle has many <strong>for</strong>mulations, but<br />
it can generally be described as <strong>the</strong> concept that managers or regulators “should take steps to<br />
protect against potential harms, even if causal chains are unclear and even if we do not know that<br />
those harms will come to fruition.” 62 ) Given <strong>the</strong> estimated 400 water-related treaties, 63 <strong>the</strong>re are<br />
ample existing frameworks to serve as models <strong>for</strong> cooperative frameworks that improve stability.<br />
(See <strong>the</strong> Transboundary Freshwater Dispute Database at<br />
http://www.transboundarywaters.orst.edu/database/ <strong>for</strong> up-to-date in<strong>for</strong>mation). Kundzewicz<br />
reports that water resources managers in <strong>the</strong> Ne<strong>the</strong>rlands, UK and Germany include climate<br />
change impacts explicitly in flood risk management and design. 64 Stern also identified improved<br />
data collection and sharing that reduces inefficient use <strong>of</strong> water as methods to reduce conflict,<br />
fur<strong>the</strong>r indicating roles that water resources managers could play to improve stability. 65<br />
Focusing on <strong>the</strong> southwestern U.S., Rajagopalan et al examined <strong>the</strong> impact <strong>of</strong> a number <strong>of</strong><br />
climate scenarios, management strategies and variety <strong>of</strong> potential demands on Colorado River<br />
water storage over <strong>the</strong> next 50 years. 66 While <strong>the</strong> risks <strong>for</strong> drought-induced reservoir depletions<br />
were projected to increase rapidly after 2026, <strong>the</strong>se risks were shown to be reduced significantly<br />
through preemptive management strategies. Fur<strong>the</strong>rmore, this study suggests that <strong>the</strong> impact <strong>of</strong><br />
<strong>the</strong>se management strategies would be maximized through implementation well be<strong>for</strong>e <strong>the</strong> rapid<br />
rise in risk in 2026.<br />
138
Water resources managers globally have developed resilient technologies and institutional<br />
systems that balance competing needs <strong>for</strong> ecosystem functioning in addition to water availability,<br />
demand, and quality; flood and coastal storm risk reduction; navigation; and energy production<br />
and demand. Water resources monitoring, data collection, and data dissemination systems are<br />
highly automated, involve both in-situ and remote sensors, and are scalable on a global level.<br />
Wolf et al proposed that understanding <strong>of</strong> future water-related conflict could benefit from an<br />
approach focusing on “new technologies <strong>for</strong> negotiation and management; globalization,<br />
privatization and <strong>the</strong> WTO [World Trade Organization]; <strong>the</strong> geopolitics <strong>of</strong> desalination; and <strong>the</strong><br />
changing sources <strong>of</strong> water and <strong>the</strong> changing nature <strong>of</strong> conflict.” 67 All <strong>of</strong> <strong>the</strong>se are within <strong>the</strong><br />
sphere <strong>of</strong> water resources management. The examples presented illustrate <strong>the</strong> increasing<br />
opportunity that water resources managers, if adequately prepared, are uniquely positioned to<br />
provide both adaptive capacity through operational, demand management, and infrastructure<br />
changes 68 and mitigation capacity through innovative power generation and emission control<br />
strategies. Given <strong>the</strong> central role <strong>of</strong> water management in <strong>the</strong> implementation <strong>of</strong> <strong>the</strong> political,<br />
social, economic and administrative systems <strong>for</strong> water governance, <strong>the</strong> water management<br />
community must continue to implement approaches such as enhanced planning <strong>for</strong> sustainability<br />
that minimize <strong>the</strong> conflict associated with climate-induced changes in water availability.<br />
Conclusions<br />
Climate variability and change have and will result in changes to <strong>the</strong> hydrologic cycle that<br />
impact water availability and quality. These changes and <strong>the</strong> resulting climate risk vulnerabilities<br />
have <strong>the</strong> potential to increase conflicts and destabilize already stressed societies. However,<br />
increased water conflicts are not inevitable; water resources managers already have skills to deal<br />
with balancing competing uses that could help to mitigate conflict. Approaching water resources<br />
issues impacted by climate change from a “wicked problems” view can help identify where<br />
adaptation and mitigation measures may result in potential conflicting outcomes. Water<br />
resources managers are well positioned to develop and implement adaptively managed solutions<br />
to achieve positive outcomes in multiple stress environments when managing <strong>for</strong> multiple<br />
objectives. Drawing on <strong>the</strong> experience <strong>of</strong> <strong>the</strong> water resources and <strong>the</strong> watershed management<br />
communities, applying this approach early in <strong>the</strong> intervention process is critical to securing and<br />
maintaining stability. This approach allows <strong>for</strong> managing risks proactively ra<strong>the</strong>r reacting to<br />
prevailing crises and conflicts as climate changes.<br />
↑ Back to <strong>the</strong> top<br />
1 Intergovernmental Panel on Climate Change (2000) “Special report on emissions scenarios.”<br />
Nakicenovic, N., and Swart, R., eds.: Cambridge, United Kingdom, Cambridge University Press. (Also<br />
available online at http://www.grida.no/climate/ipcc/emission/.)<br />
2 Intergovernmental Panel on Climate Change (2007a) “Summary <strong>for</strong> Policymakers, <strong>of</strong> Climate change<br />
2007—The physical science basis.” in Solomon, S., Qin, D., Manning, M., Chen, Z., Marquis, M.,<br />
Averyt, K.B., Tignor, M., and Miller, H.L., eds., Contribution <strong>of</strong> Working Group I to <strong>the</strong> Fourth<br />
Assessment Report <strong>of</strong> <strong>the</strong> Intergovernmental Panel on Climate Change: Cambridge, United Kingdom,<br />
Cambridge University Press. (Also available online at http://www.ipcc.ch/ipccreports/ar4-wg1.htm.)<br />
3 Intergovernmental Panel on Climate Change (2008) Climate Change and Water. Intergovernmental<br />
Panel on Climate Change, 28th Session, April 9–10, 2008, Budapest, Hungary. (Also available online at<br />
http://www.ipcc.ch/meetings/session28/doc13.pdf.)<br />
4 Stern, N. (2006) Stern Review on <strong>the</strong> Economics <strong>of</strong> Climate Change. Cambridge University Press:<br />
Cambridge, UK, p. 56.<br />
139
5 Wolf, A.T., A Kramer, A. Carius, G.D. Dabelko (2005) Chapter 5, “Managing Water Conflict and<br />
Cooperation.” In M. Renner, et al. (Eds.), State <strong>of</strong> <strong>the</strong> World 2005: Redefining global security (pp. 80-<br />
95) Worldwatch Institute: Washington, DC.<br />
6 Gleick, P.H. (1993) “Water and Conflict: Fresh Water Resources and International Security.”<br />
International Security, Vol. 18, No. 1, pp. 79-112.<br />
7 Gleick, P.H. (2008) “Water Conflict Chronology as <strong>of</strong> November, 2008.” Data from <strong>the</strong> Pacific<br />
Institute <strong>for</strong> Studies in Development, Environment, and Security database on Water and Conflict,<br />
available at http://www.worldwater.org/conflictchronology.pdf.<br />
8 Gleick, P.H. (1993) “Water and Conflict: Fresh Water Resources and International Security.”<br />
International Security, Vol. 18, No. 1, pp. 79-112.<br />
9 Stern, N. (2006) Stern Review on <strong>the</strong> Economics <strong>of</strong> Climate Change. Cambridge University Press:<br />
Cambridge, UK, p. 56.<br />
10 Reuveny, R. (2007) “Climate change-induced migration and violent conflict.” Political Geography,<br />
Volume 26, Issue 6, Climate Change and Conflict, pp. 656-673.<br />
11 See http://www.un.org/News/Press/docs/2007/sc9000.doc.htm<br />
12 Schwartz, P. and D. Randall (2003) An Abrupt Climate Change Scenario and Its Implications <strong>for</strong><br />
United States <strong>National</strong> Security. Environmental Media Services: Washington DC (available at<br />
http://www.accc.gv.at/pdf/pentagon_climate_change.pdf).<br />
13 Rittel, H.W.J and M.M Webber (1973) Rittel, Horst, and Melvin Webber; "Dilemmas in a General<br />
Theory <strong>of</strong> Planning," Policy Sciences, Vol. 4, pp. 155-169. Reprinted in N. Cross (ed.), Developments<br />
in Design Methodology, J. Wiley & Sons: Chichester, UK, 1984, pp. 135-144.<br />
14 Brekke, L., J.E. Kiang, J.R. Olsen, D. R. Pulwarty, D. Raff, D.P. Turnipseed, R.S. Webb, and K.D.<br />
White (2009) “Climate change and water resources management: A federal perspective.” USGS<br />
Circular 1331, USGS: Reston, VA (http://pubs.usgs.gov/circ/1331/).<br />
15 Milly, P.C.D, J. Betancourt, M. Falkenmark, R.M. Hirsch, Z.W. Kundzewicz, D.P. Lettenmaier, and<br />
R.J. Stouffer (2008) “Stationarity Is Dead: Whi<strong>the</strong>r Water Management?” Science 319 (5863) p. 573.<br />
16 Stern, N. (2009) “The Global Deal: Climate Change and <strong>the</strong> Creation <strong>of</strong> a New Era <strong>of</strong> Progress and<br />
Prosperity.” Public Affairs: New York.<br />
17 Brekke, L., J.E. Kiang, J.R. Olsen, D. R. Pulwarty, D. Raff, D.P. Turnipseed, R.S. Webb, and K.D.<br />
White (2009) Climate change and water resources management: A federal perspective. USGS Circular<br />
1331, USGS: Reston, VA (http://pubs.usgs.gov/circ/1331/).<br />
18 Nicholls, R.J., P.P. Wong, V. Burkett, C.D. Woodr<strong>of</strong>fe, and J. Hay ( 2008) “Climate change and<br />
coastal vulnerability assessment—Scenarios <strong>for</strong> integrated assessment”: Sustainability Science, v. 3, no.<br />
1, p. 89–102.<br />
19 Intergovernmental Panel on Climate Change (2007b) “Climate change 2007—Impacts, adaptation and<br />
vulnerability.” in Parry, M.L., Canziani, O.F., Palutik<strong>of</strong>, J.P., van der Linden, P.J., and Hanson, C.E.,<br />
eds., Contribution <strong>of</strong> Working Group II to <strong>the</strong> Fourth Assessment Report <strong>of</strong> <strong>the</strong> Intergovernmental<br />
Panel on Climate Change. Cambridge University Press: Cambridge, UK. (Also available online at<br />
http://www.ipcc.ch/ipccreports/ar4-wg2.htm).<br />
20 Intergovernmental Panel on Climate Change (2007b) “Climate change 2007—Impacts, adaptation and<br />
vulnerability.” in Parry, M.L., Canziani, O.F., Palutik<strong>of</strong>, J.P., van der Linden, P.J., and Hanson, C.E.,<br />
eds., Contribution <strong>of</strong> Working Group II to <strong>the</strong> Fourth Assessment Report <strong>of</strong> <strong>the</strong> Intergovernmental<br />
Panel on Climate Change. Cambridge University Press: Cambridge, UK. (Also available online at<br />
http://www.ipcc.ch/ipccreports/ar4-wg2.htm).<br />
21 Intergovernmental Panel on Climate Change (2008) Climate Change and Water. Intergovernmental<br />
Panel on Climate Change, 28th Session, April 9–10, 2008, Budapest, Hungary. (Also available online at<br />
http://www.ipcc.ch/meetings/session28/doc13.pdf.)<br />
140
22 Brekke, L., J.E. Kiang, J.R. Olsen, D. R. Pulwarty, D. Raff, D.P. Turnipseed, R.S. Webb, and K.D.<br />
White (2009) “Climate change and water resources management: A federal perspective.” USGS<br />
Circular 1331, USGS: Reston, VA (http://pubs.usgs.gov/circ/1331/).<br />
23 Brekke, L., J.E. Kiang, J.R. Olsen, D. R. Pulwarty, D. Raff, D.P. Turnipseed, R.S. Webb, and K.D.<br />
White (2009) Climate change and water resources management: A federal perspective. USGS Circular<br />
1331, USGS: Reston, VA (http://pubs.usgs.gov/circ/1331/).<br />
24 Stern, N. (2006) Stern Review on <strong>the</strong> Economics <strong>of</strong> Climate Change. Cambridge University Press:<br />
Cambridge, UK, p. 56.<br />
25 Stern, N. (2006) Stern Review on <strong>the</strong> Economics <strong>of</strong> Climate Change. Cambridge University Press:<br />
Cambridge, UK, p. 56.<br />
26 Gleick, P.H. (1993) “Water and Conflict: Fresh Water Resources and International Security.”<br />
International Security, Vol. 18, No. 1, pp. 79-112.<br />
27 Gleick, P.H. (2008) “Water Conflict Chronology as <strong>of</strong> November, 2008.” Data from <strong>the</strong> Pacific<br />
Institute <strong>for</strong> Studies in Development, Environment, and Security database on Water and Conflict,<br />
available at http://www.worldwater.org/conflictchronology.pdf.<br />
28 Barnett, J. and W.N. Adger (2007) “Climate change, human security and violent conflict.” Political<br />
Geography, Vol. 26, pp. 639-655.<br />
29 Stern, N. (2006) Stern Review on <strong>the</strong> Economics <strong>of</strong> Climate Change. Cambridge University Press:<br />
Cambridge, UK, p. 56.<br />
30 Hendrix, C.S. and S.M. Glaser (2007). “Trends and triggers: Climate, climate change and civil conflict<br />
in Sub-Saharan Africa.” Political Geography, Vol. 26, pp. 696-715.<br />
31 Wolf, A.T. S.B. Y<strong>of</strong>fe, and M. Giordano (2003) “International waters: identifying basins at risk.” Water<br />
Policy, Vol. 5, pp. 29-60.<br />
32 Alcamo, J. and T. Henrichs (2002) “Critical regions: A model-based estimation <strong>of</strong> world water<br />
resources sensitive to global changes.” Aquatic Sciences, Vol. 64, No. 4, pp. 352-362.<br />
33 Trondalen, J.M. (2009) “Climate Changes, Water Security and Possible Remedies <strong>for</strong> <strong>the</strong> Middle East.”<br />
The United Nations World Water Assessment Programme Side Publications Series <strong>Scientific</strong> Paper.<br />
United Nations Educational, <strong>Scientific</strong>, and Cultural Organization: Paris, France.<br />
34 Stern, N. (2009) “The Global Deal: Climate Change and <strong>the</strong> Creation <strong>of</strong> a New Era <strong>of</strong> Progress and<br />
Prosperity.” Public Affairs: New York.<br />
35 Nordas, R. and N.P. Gleditsch (2007) “Climate change and conflict.” Political Geography, Vol. 26, pp.<br />
627-638.<br />
36 Wolf, A.T. S.B. Y<strong>of</strong>fe, and M. Giordano (2003) “International waters: identifying basins at risk.” Water<br />
Policy, Vol. 5, pp. 29-60.<br />
37 Wolf, A.T. S.B. Y<strong>of</strong>fe, and M. Giordano (2003) “International waters: identifying basins at risk.” Water<br />
Policy, Vol. 5, pp. 29-60.<br />
38 Hendrix, C.S. and S.M. Glaser (2007). “Trends and triggers: Climate, climate change and civil conflict<br />
in Sub-Saharan Africa.” Political Geography, Vol. 26, pp. 696-715.<br />
39 Nordas, R. and N.P. Gleditsch (2007) “Climate change and conflict.” Political Geography, Vol. 26, pp.<br />
627-638.<br />
40 Ravnborg, H.M. (2004) Water and Conflict - Conflict prevention and mitigation in water resources<br />
management. DIIS Report 2004:2, 99 p.<br />
41 Rogers, P. and A. Hall. (2003), Effective Water Governance., TEC Background Papers No. 7. Global<br />
Water Partnership/SIDA, Stockholm.<br />
42 Rittel, H.W.J and M.M Webber (1973) Rittel, Horst, and Melvin Webber; "Dilemmas in a General<br />
Theory <strong>of</strong> Planning," Policy Sciences, Vol. 4, pp. 155-169. [Reprinted in N. Cross (ed.), Developments<br />
in Design Methodology, J. Wiley & Sons: Chichester, UK, 1984, pp. 135-144.]<br />
43 Camillus, J.C. (2008) “Strategy as a Wicked Problem.” Harvard Business Review, May: 99-131.<br />
141
Carpenter, S.R., P.L. Pingali, E.M. Bennett, and M.B. Zurek (eds) (2005) “Ecosystems and human wellbeing:<br />
Scenarios, Volume 2.” Findings <strong>of</strong> <strong>the</strong> Scenarios Working Group, Millennium Ecosystem<br />
Assessment. Island Press: Washington, DC. Available at<br />
http://www.millenniumassessment.org/en/Scenarios.aspx.<br />
44 Kahane, A. (2007) Solving Tough Problems. Berry-Koehler Publishers, Inc: San Francisco.<br />
45 Freeman, D.M. (2000) “Wicked water problems: Sociology and local water organizations in addressing<br />
water resources policy.” Journal <strong>of</strong> <strong>the</strong> American Water Resources Association 36 (3): 483–491.<br />
46 Mills, B. (ed.) (2008) “SERA North: Economics <strong>of</strong> Wea<strong>the</strong>r, Climate, and Climate Change.“ Syn<strong>the</strong>sis<br />
<strong>of</strong> a meeting held 21-22 February, Waterloo, Canada. Adaptation and Impacts Research Division,<br />
Environment Canada: Waterloo, Canada.<br />
47 White, K.D., A. Dornstauder, S.Durden, and J. C. Shockley (2009) “Systems Approach to Water<br />
Resources Decision Making in <strong>the</strong> US Army Corps <strong>of</strong> Engineers.” Proceedings, 2009 AWWA Water<br />
Resources Symposium: "Managing in Times <strong>of</strong> Change and Uncertainty" [Portland, Oregon, January<br />
25-27 2009]. Electronic proceedings.<br />
48 Freeman, D.M. (2000) “Wicked water problems: Sociology and local water organizations in addressing<br />
water resources policy.” Journal <strong>of</strong> <strong>the</strong> American Water Resources Association 36 (3): 483–491.<br />
49 Wolf, A.T. S.B. Y<strong>of</strong>fe, and M. Giordano (2003) “International waters: identifying basins at risk.” Water<br />
Policy, Vol. 5, pp. 29-60.<br />
50 Milly, P.C.D, J. Betancourt, M. Falkenmark, R.M. Hirsch, Z.W. Kundzewicz, D.P. Lettenmaier, and<br />
R.J. Stouffer (2008) “Stationarity Is Dead: Whi<strong>the</strong>r Water Management?” Science 319 (5863) p. 573.<br />
51 Folke, C., S. Carpenter, T. Elmqvist, L. Gunderson, C.S. Holling, and B. Walker (2002) “Resilience<br />
and sustainable development: Building adaptive capacity in a world <strong>of</strong> trans<strong>for</strong>mations.” Ambio, 31(15):<br />
437-440.<br />
52 Folke, C., S. Carpenter, T. Elmqvist, L. Gunderson, C.S. Holling, and B. Walker (2002) “Resilience<br />
and sustainable development: Building adaptive capacity in a world <strong>of</strong> trans<strong>for</strong>mations.” Ambio, 31(15):<br />
437-440.<br />
53 Carpenter, S.R., P.L. Pingali, E.M. Bennett, and M.B. Zurek (eds) (2005) “Ecosystems and human<br />
well-being: Scenarios, Volume 2.” Findings <strong>of</strong> <strong>the</strong> Scenarios Working Group, Millennium Ecosystem<br />
Assessment. Island Press: Washington, DC. Available at<br />
http://www.millenniumassessment.org/en/Scenarios.aspx.<br />
54 Shoemaker, P.J. and V.M. Mavaddat (2000) ”Scenario planning <strong>for</strong> disruptive technologies.” in Day,<br />
G.S., P.J. Shoemaker, and R.E. Guen<strong>the</strong>r (eds) Wharton on Managing Emerging Technologies. John<br />
Wiley & Sons, Inc: Hoboken, NJ.<br />
55 Kahane, A. (2007) Solving Tough Problems. Berry-Koehler Publishers, Inc: San Francisco.<br />
Kundzewicz, Z. W. (2008) “Flood risk and vulnerability in <strong>the</strong> changing climate.” Annals <strong>of</strong> Warsaw<br />
University <strong>of</strong> Life Sciences - SGGW. Land Reclamation, Vol. 39, pp. 21-31.<br />
56 IPCC 2007d.<br />
57 Brekke, L., J.E. Kiang, J.R. Olsen, D. R. Pulwarty, D. Raff, D.P. Turnipseed, R.S. Webb, and K.D.<br />
White (2009) Climate change and water resources management: A federal perspective. USGS Circular<br />
1331, USGS: Reston, VA (http://pubs.usgs.gov/circ/1331/).<br />
58 Prairie, J., Nowak, K. Rajagopalan, B., Lall, U. and Fulp, T., (2008) "A stochastic nonparametric<br />
approach <strong>for</strong> streamflow generation combining observational and paleo reconstructed data." Water<br />
Resources Research, 44, W06423, doi:10.1029/2007WR006684.<br />
59 USGS Circular 1331, USGS: Reston, VA (http://pubs.usgs.gov/circ/1331/).<br />
60 Stern, N. (2006) Stern Review on <strong>the</strong> Economics <strong>of</strong> Climate Change. Cambridge University Press:<br />
Cambridge, UK, p. 56.<br />
61 Trondalen, J.M. (2009) “Climate Changes, Water Security and Possible Remedies <strong>for</strong> <strong>the</strong> Middle East.”<br />
The United Nations World Water Assessment Programme Side Publications Series <strong>Scientific</strong> Paper.<br />
United Nations Educational, <strong>Scientific</strong>, and Cultural Organization: Paris, France.<br />
142
62 Sunstein, C.R. (2005) “Laws <strong>of</strong> Fear: Beyond <strong>the</strong> Precautionary Principle.” University Press:<br />
Cambridge, England.<br />
63 Wolf, A.T. S.B. Y<strong>of</strong>fe, and M. Giordano (2003) “International waters: identifying basins at risk.” Water<br />
Policy, Vol. 5, pp. 29-60.<br />
64 Kundzewicz, Z. W. (2008) “Flood risk and vulnerability in <strong>the</strong> changing climate.” Annals <strong>of</strong> Warsaw<br />
University <strong>of</strong> Life Sciences - SGGW. Land Reclamation, Vol. 39, pp. 21-31.<br />
65 Stern, N. (2006) Stern Review on <strong>the</strong> Economics <strong>of</strong> Climate Change. Cambridge University Press:<br />
Cambridge, UK, p. 56.<br />
66 Rajagopalan, B., Nowak, K., Prairie, J., Hoerling, M., Harding, B., Barsugli, J., Ray, A., and B. Udall<br />
(2009). “Water Supply Risk on <strong>the</strong> Colorado River: Can Management Mitigate?” Water Resources<br />
Research 45.<br />
67 Wolf, A.T. S.B. Y<strong>of</strong>fe, and M. Giordano (2003) “International waters: identifying basins at risk.” Water<br />
Policy, Vol. 5, pp. 29-60.<br />
68 Brekke, L., J.E. Kiang, J.R. Olsen, D. R. Pulwarty, D. Raff, D.P. Turnipseed, R.S. Webb, and K.D.<br />
White (2009) “Climate change and water resources management: A federal perspective.” USGS<br />
Circular 1331, USGS: Reston, VA (http://pubs.usgs.gov/circ/1331/).<br />
143
Energy<br />
2.4.D.<br />
Energy, Africa, and Civil Conflict: What Does <strong>the</strong> Future Hold? (Richard<br />
Stoll)<br />
Author and Organization: Richard J. Stoll, Department <strong>of</strong> Political Science, Rice University<br />
Contact In<strong>for</strong>mation: stoll@rice.edu<br />
Introduction<br />
Traditionally United States <strong>for</strong>eign policy has not focused on Africa (particularly Sub-Saharan<br />
Africa). However, this is likely to change in <strong>the</strong> future. While <strong>the</strong>re are several reasons <strong>for</strong> this,<br />
one is that Africa will become increasingly important as a source <strong>of</strong> resources—including oil—<br />
<strong>for</strong> <strong>the</strong> U.S. At <strong>the</strong> same time, Africa is rife with civil conflict. Such conflicts create significant<br />
humanitarian problems and cause <strong>the</strong> deaths <strong>of</strong> millions. It can also be difficult <strong>for</strong> states<br />
undergoing civil conflict to export resources. For both humanitarian and economic reasons, <strong>the</strong><br />
United States and o<strong>the</strong>r countries will have to pay more attention to Africa particularly in <strong>the</strong><br />
following areas: (1) how to prevent <strong>the</strong> outbreak <strong>of</strong> civil conflict, (2) if a decision is made to<br />
intervene in a civil conflict, how to do so successfully, and (3) how to prevent <strong>the</strong>se conflicts<br />
from recurring.<br />
This paper notes a few select characteristics <strong>of</strong> Africa, including a brief assessment <strong>of</strong> <strong>the</strong><br />
minimal attention from <strong>the</strong> U.S. to <strong>the</strong> region and <strong>the</strong> increasing importance <strong>of</strong> Africa to <strong>the</strong> U.S.<br />
and o<strong>the</strong>r countries. The paper also addresses <strong>the</strong> prevalence <strong>of</strong> civil conflict in <strong>the</strong> region,<br />
including a consideration <strong>of</strong> whe<strong>the</strong>r civil conflicts in Africa have different causes or<br />
characteristics from civil conflicts in o<strong>the</strong>r regions. Finally, <strong>the</strong> paper considers what we know<br />
about civil wars that could be used to reduce <strong>the</strong>ir occurrence, duration, and recurrence in Africa.<br />
This paper makes use <strong>of</strong> findings and conclusions from systematic research into civil conflict.<br />
Some <strong>of</strong> this research is specifically about conflict in Africa, but most <strong>of</strong> it comes from studies <strong>of</strong><br />
civil conflict throughout <strong>the</strong> world. Below is a discussion <strong>of</strong> why <strong>the</strong> non-Africa findings<br />
presented here are relevant.<br />
The United States and Oil<br />
It is no surprise to learn that <strong>the</strong> United States is heavily dependent on oil. According to <strong>the</strong><br />
Department <strong>of</strong> Energy, oil currently supplies about 40 percent <strong>of</strong> our total energy demand. Oil is<br />
particularly important in transportation, supplying over 99 percent <strong>of</strong> <strong>the</strong> fuel <strong>the</strong> U.S. uses in<br />
cars and trucks. 1 While <strong>the</strong>re has been much talk about “energy independence,” 2 <strong>the</strong> truth <strong>of</strong> <strong>the</strong><br />
matter is that it is highly unlikely that <strong>the</strong> drastic changes will be undertaken that would be<br />
necessary to make this happen. If <strong>the</strong>re is no drastic change in U.S. energy usage, <strong>the</strong>n from 2010<br />
to 2030, U.S. oil consumption is projected to rise from 22.2 million barrels <strong>of</strong> oil per day to 27.6<br />
million barrels per day, an increase <strong>of</strong> about 24 percent. At <strong>the</strong> global level, <strong>the</strong> projected<br />
increase in oil consumption is almost 29 percent. This growth will be led by China, with an<br />
anticipated increase in its oil consumption <strong>of</strong> 72 percent. 3<br />
If <strong>the</strong> demand <strong>for</strong> oil is <strong>for</strong>ecast to rise by 29 percent, what are <strong>the</strong> prospects on <strong>the</strong> supply side?<br />
Un<strong>for</strong>tunately, over <strong>the</strong> same time period, oil production is only expected to rise by about 23.5<br />
percent. 4 While all projections are subject to error, it is prudent to assume that <strong>the</strong>re <strong>the</strong> demand<br />
144
<strong>for</strong> oil will increase and accommodating this increase will be difficult. Even though Africa’s oil<br />
production (excluding North Africa) will be a little less than 9 percent <strong>of</strong> total global production,<br />
this is not a trivial amount because <strong>the</strong> world will need every possible source <strong>of</strong> supply to meet<br />
its demands.<br />
The United States and Africa<br />
Africa has never been a high priority region <strong>for</strong> <strong>the</strong> United States. In <strong>the</strong> wake <strong>of</strong> <strong>the</strong> Cold War<br />
(with <strong>the</strong> end <strong>of</strong> <strong>the</strong> superpower rivalry <strong>for</strong> influence), attention declined even more. For<br />
example, in 1998 Africa received only 13.3 percent <strong>of</strong> U.S. <strong>for</strong>eign aid. 5 While this proportion is<br />
about <strong>the</strong> same as Africa’s proportion <strong>of</strong> <strong>the</strong> world population, it does not take into account <strong>the</strong><br />
vast development gap between Africa and <strong>the</strong> rest <strong>of</strong> <strong>the</strong> world. Taking <strong>the</strong> world as a whole,<br />
gross domestic product (GDP) per capita in 1998 (current dollars) was $5025. In Sub-Saharan<br />
Africa, <strong>the</strong> figure was $717, 6 or about 14 percent <strong>of</strong> <strong>the</strong> global value. This comparison<br />
demonstrates that Africa (particularly Sub-Saharan Africa) is desperately poor.<br />
However, Africa has begun to receive more attention from <strong>the</strong> United States. In 2008, due<br />
primarily to President Bush’s AIDS initiative, Africa’s share <strong>of</strong> U.S. <strong>for</strong>eign aid has risen to<br />
almost 29 percent. 7 Fur<strong>the</strong>rmore, <strong>the</strong> U.S. military has established a new unified combatant<br />
command <strong>for</strong> Africa (AFRICOM). Both <strong>of</strong> <strong>the</strong>se ef<strong>for</strong>ts came about in response to serious<br />
problems in Africa: <strong>the</strong> first because <strong>of</strong> <strong>the</strong> dramatic spread <strong>of</strong> AIDS throughout Africa, and <strong>the</strong><br />
second due to <strong>the</strong> increased concern that failed (and failing) states in Africa would provide safe<br />
haven <strong>for</strong> terrorist groups such as Al-Qaeda.<br />
Humanitarian concerns and counter terrorism operations are two important reasons <strong>for</strong> <strong>the</strong><br />
United States to devote more attention to Africa. But <strong>the</strong>re are o<strong>the</strong>rs. The <strong>National</strong> Intelligence<br />
Council believes that by 2015, about one-quarter <strong>of</strong> <strong>the</strong> oil in <strong>the</strong> U.S. market will come from<br />
Africa: Angola, Nigeria, Congo-Brazzaville, Gabon, Cameroon, and Equatorial Guinea. 8<br />
Civil Conflict in Africa<br />
Africa has a significant problem with civil (internal) conflict. The University <strong>of</strong> Uppsala and <strong>the</strong><br />
International Peace Research Institute in Oslo, Norway, maintain one <strong>of</strong> <strong>the</strong> most widely used<br />
datasets on internal conflict. 9 They code an internal conflict if at least 25 people are killed in a<br />
year. If we tally each year in each country in Africa that meets this standard, between 1946 and<br />
2006 <strong>the</strong>re were 397 country-years <strong>of</strong> internal conflict in Africa. This is a large number. Civil<br />
conflict has a number <strong>of</strong> negative effects. First and <strong>for</strong>emost is that civil conflict kills, wounds,<br />
and displaces people. And many <strong>of</strong> <strong>the</strong>se people are not combatants but are simply in <strong>the</strong> wrong<br />
place at <strong>the</strong> wrong time. Second, infrastructure is damaged. Third, <strong>the</strong> economy is damaged.<br />
Some parts <strong>of</strong> it are destroyed, while o<strong>the</strong>rs are distorted. Since oil is so valuable, during a civil<br />
conflict <strong>the</strong> oil industry <strong>of</strong> <strong>the</strong> country is a prime target. The government wants to protect,<br />
insurgents want to control it, and o<strong>the</strong>rs simply want to hijack it. Consider what has happened in<br />
Iraq during <strong>the</strong> insurgency. It is estimated that in 2007, $2 billion <strong>of</strong> <strong>the</strong> oil production <strong>of</strong> <strong>the</strong><br />
Baiji refinery (located 110 miles north <strong>of</strong> Baghdad) was siphoned <strong>of</strong>f by <strong>the</strong> black market. 10<br />
Between 1960 and 2000, nearly 20 African countries (40 percent <strong>of</strong> Sub-Saharan Africa)<br />
experienced at least one year <strong>of</strong> civil conflict. 11 Does this prevalence indicate that civil conflicts<br />
in Africa are fundamentally different from civil conflicts in o<strong>the</strong>r regions? This is an important<br />
question because, if Africa is different, <strong>the</strong>n we cannot apply what we know from general studies<br />
<strong>of</strong> civil conflict.<br />
145
Researchers who have systematically examined this question have concluded that <strong>the</strong> causes <strong>of</strong><br />
civil conflict Africa are no different than <strong>the</strong> causes <strong>of</strong> civil conflict elsewhere. 12 The most<br />
important factors associated with <strong>the</strong> outbreak <strong>of</strong> civil conflict are as follows:<br />
1. Low levels <strong>of</strong> economic development<br />
2. Low rates <strong>of</strong> economic growth<br />
3. Dependence on primary commodity exports (note this relationship is curvilinear; <strong>the</strong><br />
chances <strong>of</strong> civil conflict increase with dependence, but beyond a point, <strong>the</strong> chances <strong>of</strong><br />
civil conflict decrease)<br />
4. Failed political institutions<br />
The reason that Africa has such a high incidence <strong>of</strong> civil conflict is not because it is unique but<br />
because it has a number <strong>of</strong> countries with <strong>the</strong> conditions that are associated with <strong>the</strong> outbreak <strong>of</strong><br />
civil conflict. From this we can conclude that (1) we can use <strong>the</strong> knowledge we have gain from<br />
<strong>the</strong> study <strong>of</strong> civil conflict in general to predict and understand civil conflict in Africa, and (2)<br />
(more importantly) as countries in Africa develop economically, this should change <strong>the</strong><br />
conditions listed above and reduce <strong>the</strong> frequency <strong>of</strong> civil conflict in that continent.<br />
What Should <strong>the</strong> U.S. Do? Strategy Choices<br />
The U.S. cannot (and should not) take on <strong>the</strong> task <strong>of</strong> intervening in every potential or ongoing<br />
civil conflict in Africa. Interventions can be costly and take significant amounts <strong>of</strong> time; <strong>the</strong>y<br />
should not be undertaken lightly. However, if a decision is made to intervene, what should <strong>the</strong><br />
United States do to prevent <strong>the</strong> outbreak <strong>of</strong> civil conflict, to stop it once it begins, or to prevent it<br />
from reoccurring?<br />
Preventing <strong>the</strong> Outbreak <strong>of</strong> Civil Conflict<br />
The most effective long-term strategy to prevent <strong>the</strong> outbreak <strong>of</strong> civil conflict is to promote<br />
economic development. This will have a direct impact on <strong>the</strong> first three factors associated with<br />
<strong>the</strong> outbreak <strong>of</strong> civil conflict listed above. It may also have an indirect impact on <strong>the</strong> fourth<br />
factor. Economic development and democracy are tightly intertwined; a more developed<br />
economy may facilitate <strong>the</strong> development <strong>of</strong> stronger political institutions.<br />
It is beyond <strong>the</strong> scope <strong>of</strong> this paper to <strong>of</strong>fer an extensive set <strong>of</strong> suggestions. (This is best left up<br />
to those who specialize in <strong>the</strong> study <strong>of</strong> economic development). The work <strong>of</strong> Hernando De Soto 13<br />
demonstrates that if <strong>the</strong> system <strong>of</strong> laws and regulation in a country make property rights insecure,<br />
people will in effect withdraw from <strong>the</strong> economy and live and work “<strong>of</strong>f <strong>the</strong> grid.” The result is<br />
that significant amounts <strong>of</strong> capital become unavailable to <strong>the</strong> regular economy. That is, it is not<br />
enough to have rule <strong>of</strong> law, it must be reasonable rule <strong>of</strong> law to provide secure property rights<br />
<strong>for</strong> all individuals. This will increase <strong>the</strong> amount <strong>of</strong> capital available in <strong>the</strong> country. Second,<br />
development ef<strong>for</strong>ts such as those being implemented in Iraq and Afghanistan are <strong>of</strong>ten<br />
hampered by corruption. The same can be said in Africa, and ef<strong>for</strong>ts to reduce corruption can<br />
help speed development. Finally, <strong>the</strong> Bush-initiated ef<strong>for</strong>t to combat AIDS in Africa should be<br />
seen not only as a humanitarian and health initiative, but also a key element <strong>of</strong> <strong>the</strong> ef<strong>for</strong>t to speed<br />
development by saving <strong>the</strong> lives <strong>of</strong> people who are critical to moving <strong>the</strong>se countries <strong>for</strong>ward.<br />
Intervention in Civil Conflict<br />
Once a civil conflict starts, should <strong>the</strong> United States intervene? If it is in our interest to intervene,<br />
what should be done? That depends critically on <strong>the</strong> goals <strong>of</strong> <strong>the</strong> United States. Is <strong>the</strong> goal to see<br />
one side win <strong>the</strong> war, or is <strong>the</strong> goal to stop <strong>the</strong> conflict? This is a critical matter because <strong>the</strong><br />
146
systematic research on intervention in civil conflicts makes it very clear that <strong>the</strong> factors that are<br />
associated with success in winning a war are not <strong>the</strong> same as those associated with stopping a<br />
war.<br />
Winning <strong>the</strong> Conflict. An external military intervention <strong>for</strong> ei<strong>the</strong>r side in a civil conflict<br />
increases its chances <strong>of</strong> victory. Military intervention <strong>for</strong> ei<strong>the</strong>r side also increases <strong>the</strong> chance <strong>of</strong><br />
a negotiated settlement. The effects are stronger when intervening <strong>for</strong> <strong>the</strong> rebels than <strong>for</strong> <strong>the</strong><br />
government. 14 However, military intervention by outsiders also leng<strong>the</strong>ns <strong>the</strong> duration <strong>of</strong> <strong>the</strong><br />
civil conflict, 15 and <strong>of</strong> course <strong>the</strong> longer <strong>the</strong> conflict goes on, <strong>the</strong> greater <strong>the</strong> costs. If <strong>the</strong> United<br />
States wishes to have one side prevail in a civil conflict, intervention can help its choice to<br />
prevail but it is a costly option.<br />
Stopping <strong>the</strong> Conflict. There are o<strong>the</strong>r circumstances in which <strong>the</strong> goal is to bring <strong>the</strong> conflict<br />
to an end as quickly as possible. If <strong>the</strong> goal is to get <strong>the</strong> fighting stopped, <strong>the</strong>n non-military<br />
means can be used (and in some circumstances are preferred). Diplomacy can be an effective<br />
tool to bring <strong>the</strong> conflict to an end, but timing is important. The relationship between success <strong>of</strong><br />
diplomacy and duration is curvilinear. Diplomacy is not likely to be successful at <strong>the</strong> beginning<br />
<strong>of</strong> <strong>the</strong> conflict, but as time goes on, it is more likely to be successful. However at some point, <strong>the</strong><br />
efficacy <strong>of</strong> diplomacy starts to decline once again. 16<br />
Keeping <strong>the</strong> Peace<br />
One <strong>of</strong> <strong>the</strong> most tragic aspects <strong>of</strong> civil conflicts is that <strong>the</strong>y are likely to reoccur. If one examines<br />
civil wars between 1944 and 1997, more than half <strong>of</strong> <strong>the</strong>m broke out more than once. 17 So what<br />
can be done to reduce <strong>the</strong> chances <strong>of</strong> a civil conflict resuming? First <strong>of</strong> all, <strong>the</strong> same factors that<br />
are associated with <strong>the</strong> outbreak <strong>of</strong> civil conflict (see above) are associated with <strong>the</strong> recurrence <strong>of</strong><br />
civil conflict. Ef<strong>for</strong>ts to facilitate economic development in Africa will also serve to reduce <strong>the</strong><br />
recurrence <strong>of</strong> civil conflict. While this may not bear fruit in <strong>the</strong> short run, it is never<strong>the</strong>less an<br />
important element in <strong>the</strong> ef<strong>for</strong>t to reduce <strong>the</strong> chances <strong>of</strong> civil conflict occurring or recurring.<br />
What else can be done? One answer is peacebuilding. Peacebuilding “is an attempt, after a peace<br />
has been negotiated or imposed, to address <strong>the</strong> sources <strong>of</strong> current hostility and build local<br />
capacities <strong>for</strong> conflict resolution.” 18 While <strong>the</strong>re are no guarantees <strong>of</strong> success, peacebuilding is<br />
more successful if it is a large-scale operation conducted by <strong>the</strong> United Nations and involve high<br />
levels <strong>of</strong> financial assistance, ra<strong>the</strong>r than a unilateral ef<strong>for</strong>t by a single country. Thus, in most<br />
cases, <strong>the</strong> United States should not consider undertaking peacebuilding ef<strong>for</strong>ts alone.<br />
Conclusions<br />
Historically, <strong>the</strong> United States has devoted little attention to Africa, but <strong>the</strong> situation is changing.<br />
The Bush administration dramatically increased funding to combat AIDS globally, and this<br />
significantly increased <strong>the</strong> amount <strong>of</strong> U.S. aid to Africa. The U.S. concern that failed or weak<br />
states in Africa could become willing or unwilling hosts to terrorists or o<strong>the</strong>r groups that<br />
threaten U.S. interests (e.g., pirates) has increased <strong>the</strong> amount <strong>of</strong> military attention to <strong>the</strong><br />
continent. And as time goes on, <strong>the</strong>re will be at least one additional reason from <strong>the</strong> United<br />
States to devote attention to Africa: we will become more dependent on that continent <strong>for</strong> energy<br />
supplies.<br />
Since African states became independent, many have experienced serious civil conflict. These<br />
conflicts create many serious problems, including a decline in oil exports. Of course oil is not <strong>the</strong><br />
only reason <strong>the</strong> U.S. should be concerned about civil conflict in Africa. No one wants to see<br />
147
ano<strong>the</strong>r Rwanda happen. However, whe<strong>the</strong>r one believes that <strong>the</strong> U.S. should care about Africa<br />
<strong>for</strong> humanitarian reasons or <strong>for</strong> <strong>the</strong> energy security <strong>of</strong> <strong>the</strong> United States (or both), we must face<br />
<strong>the</strong> fact that Africa is very susceptible to civil conflict.<br />
While it should not be <strong>the</strong> policy <strong>of</strong> <strong>the</strong> United States to intervene in all civil conflicts in Africa,<br />
it is important that we take advantage <strong>of</strong> what scholars have learned about civil conflict and<br />
apply it (as well as o<strong>the</strong>r <strong>for</strong>ms <strong>of</strong> knowledge, insights, and experience) to help in<strong>for</strong>m our policy<br />
choices. Based on <strong>the</strong> systematic study <strong>of</strong> civil conflicts, we would do well to keep <strong>the</strong> following<br />
in mind:<br />
1. Despite <strong>the</strong> high frequency <strong>of</strong> civil conflicts in Africa, <strong>the</strong>re is no reason to believe that <strong>the</strong><br />
causes <strong>of</strong> African civil conflicts are fundamentally different that <strong>the</strong> causes <strong>of</strong> civil conflict in<br />
o<strong>the</strong>r regions. Research demonstrates that <strong>the</strong> fundamental causes <strong>of</strong> civil conflict in Africa<br />
are <strong>the</strong> same as <strong>the</strong> causes <strong>of</strong> civil conflict elsewhere.<br />
2. The fundamental factors that drive <strong>the</strong> outbreak <strong>of</strong> civil conflict in Africa stem from low<br />
levels <strong>of</strong> development. An important strategy to prevent civil conflict (as well as to improve<br />
<strong>the</strong> lives <strong>of</strong> those living in Africa) is to facilitate <strong>the</strong> process <strong>of</strong> development. Note that<br />
programs to reduce <strong>the</strong> ravages <strong>of</strong> AIDS are an integral part <strong>of</strong> this ef<strong>for</strong>t. Also, <strong>the</strong> U.S.<br />
should promote <strong>the</strong> reasonable rule <strong>of</strong> law to keep capital from disappearing from <strong>the</strong><br />
economies <strong>of</strong> African states.<br />
3. If <strong>the</strong> United States favors one side over <strong>the</strong> o<strong>the</strong>r in a civil conflict, direct (military)<br />
intervention can help that side win. Military intervention is typically more helpful <strong>for</strong> <strong>the</strong><br />
insurgent side than <strong>for</strong> <strong>the</strong> government side. But military intervention on ei<strong>the</strong>r side in a civil<br />
conflict is likely to make it last longer and drive up <strong>the</strong> costs <strong>of</strong> <strong>the</strong> war.<br />
4. If <strong>the</strong> goal <strong>of</strong> <strong>the</strong> United States is to end <strong>the</strong> conflict, <strong>the</strong>n diplomacy can play an important<br />
role. However, timing is important. Success is less likely if diplomacy takes place too early<br />
or too late in <strong>the</strong> conflict.<br />
5. It is difficult to keep a civil conflict from reigniting. The same factors that are associated with<br />
civil conflict (low levels <strong>of</strong> development) also help to restart it. There<strong>for</strong>e, ef<strong>for</strong>ts to aid<br />
economic development <strong>of</strong> a country will also reduce <strong>the</strong> chances <strong>of</strong> civil conflict restarting.<br />
6. Robust multilateral peacebuilding ef<strong>for</strong>ts run by <strong>the</strong> United Nations can also reduce <strong>the</strong><br />
chances <strong>of</strong> a civil conflict restarting.<br />
The next few decades will provide a number <strong>of</strong> challenges <strong>for</strong> American <strong>for</strong>eign policy. Energy<br />
security is one <strong>of</strong> <strong>the</strong> most important <strong>of</strong> <strong>the</strong>se. As we move <strong>for</strong>ward, our energy security will<br />
become more closely tied to events in Africa. Given <strong>the</strong> high frequency <strong>of</strong> civil conflict in<br />
Africa, <strong>the</strong> United States has to consider its options to prevent, stop, and reduce <strong>the</strong> recurrence <strong>of</strong><br />
civil conflict in that continent.<br />
↑ Back to <strong>the</strong> top<br />
1 Department <strong>of</strong> Energy. 2009. Energy Sources: Oil. http://www.energy.gov/energysources/oil.htm.<br />
2 Woolley, John and Gerhard Peters. 2009. Radio Address About <strong>the</strong> <strong>National</strong> Energy Crisis. The American<br />
Presidency Project. http://www.presidency.ucsb.edu/ws/index.php?pid=4208&st=energy&st1=independence<br />
148
3 Energy In<strong>for</strong>mation Administration. 2009. Oil (Petroleum) Consumption. Forecasts & Analyses.<br />
http://www.eia.doe.gov/oiaf/ieo/pdf/ieoreftab_4.pdf.<br />
4 Energy In<strong>for</strong>mation Administration. 2009a. International Energy Outlook 2009. Report #:DOE/EIA-<br />
0484(2009). Table G1 World Total Liquids Production by Region and Country, Reference Case.<br />
http://www.eia.doe.gov/oiaf/ieo/index.html<br />
5 Tarn<strong>of</strong>f, Curt and Marian Lawson. 2009. Foreign Aid: An Introduction to U.S. Programs and Policy.<br />
Congressional Research Service. R40213, p. 15.<br />
6 United Nations Statistics Division – <strong>National</strong> Accounts. Available at:<br />
http://unstats.un.org/unsd/snaama/dnllist.asp<br />
7 Tarn<strong>of</strong>f, Curt and Marian Lawson. 2009. Foreign Aid: An Introduction to U.S. Programs and Policy.<br />
Congressional Research Service. R40213, p. 15.<br />
8 Garrett, Laurie. 2005. HIV and <strong>National</strong> Security: Where Are <strong>the</strong> Links? Council on Foreign Relations.<br />
Available at: http://www.cfr.org/publication/8256/hiv_and_national_security.html.<br />
9 Harbom, Lotta. 2008. UCDP/PRIO Armed Conflict Dataset Codebook. Version 4-2008. Uppsala<br />
Conflict Data Program/ International Peace Research Institute, Oslo.<br />
10 Oppel, Richard A. 2008. Five Years In; Iraq Insurgency Runs on Stolen Oil Pr<strong>of</strong>its. New York Times<br />
March 16, 2008, Section A, Page 1<br />
11 Elbadawi, Ibrahim, and Nicholas Sambanis. 2000. “Why Are There So Many Civil Wars in Africa?<br />
Understanding and Preventing Violent Conflict.” Journal <strong>of</strong> African Economies 9(3), p. 244<br />
12 See Collier, Paul, and Anke Hoeffler. 2002. “On <strong>the</strong> Incidence <strong>of</strong> Civil War in Africa.” Journal <strong>of</strong><br />
Conflict Resolution 46(1): 13-28, and Elbadawi, Ibrahim, and Nicholas Sambanis. 2000. “Why Are<br />
There So Many Civil Wars in Africa? Understanding and Preventing Violent Conflict.” Journal <strong>of</strong><br />
African Economies 9(3): 244-269.<br />
13 Soto, Hernando De. 2003. The Mystery <strong>of</strong> Capital: Why Capitalism Triumphs in <strong>the</strong> West and Fails<br />
Everywhere Else. Hew York. Basic Books.<br />
14 Balch-Lindsay, Dylan, Andrew J. Enterline, and Kyle A. Joyce. 2008. “Third-Party Intervention and<br />
<strong>the</strong> Civil War Process.” Journal <strong>of</strong> Peace Research 45(3):345-363.<br />
15 Elbadawi, Ibrahim, and Nicholas Sambanis. 2000. “External Interventions and <strong>the</strong> Duration <strong>of</strong> Civil<br />
Wars.” Policy Research Working Paper 2433. The World Bank Development Research Group Public<br />
Economics.<br />
16 Regan, Patrick M., and Aysegul Aydin. 2006. “Diplomacy and O<strong>the</strong>r Forms <strong>of</strong> Intervention in Civil<br />
Wars.” Journal <strong>of</strong> Conflict Resolution 50(5):736-756.<br />
17 Quinn, J. Michael, T. David Mason, and Mehmet Gurses. 2007. “Sustaining <strong>the</strong> Peace: Determinants <strong>of</strong><br />
Civil War Recurrence.” International Interactions 33(2). p. 167.<br />
18 Doyle, Michael W., and Nicholas Sambanis. 2000. “International Peacebuilding: A Theoretical and<br />
Quantitative Analysis.” The American Political Science Review 94(4), p. 779.<br />
149
2.4.E.<br />
Energy: A <strong>National</strong> and Global Issue (Douglas Arent)<br />
Author and Organization: Douglas J. Arent, <strong>National</strong> Renewable Energy Laboratory<br />
Contact In<strong>for</strong>mation: Douglas.Arent@nrel.gov<br />
Executive Summary<br />
Global energy use has grown more than 20-fold over <strong>the</strong> past two centuries. The primary<br />
determinants <strong>of</strong> energy use are population, economic activity per capita, and energy use per<br />
dollar <strong>of</strong> economic activity or “energy intensity.” In <strong>the</strong> 20 th century, <strong>the</strong> world has experienced a<br />
four-fold growth in population, an explosion in economic development, and a gradually<br />
decreasing trend in energy intensity. Energy use in individual countries has evolved in phases<br />
related to economic development, starting from a take-<strong>of</strong>f in industrialization and personal<br />
mobility, to slowing industrialization, and <strong>the</strong>n to a transition to services.<br />
Projected trends <strong>for</strong> <strong>the</strong> 21 st century in a business-as-usual scenario are (1) an average annual<br />
population growth <strong>of</strong> 0.9 percent, (2) growth in economic activity per capita <strong>of</strong> 1.4 percent,<br />
and (3) decrease in energy intensity <strong>of</strong> 0.8 percent. These trends imply an average annual<br />
increase in energy use <strong>of</strong> 1.5 percent, or a doubling by mid-century from current levels <strong>of</strong> about<br />
400 quadrillion British <strong>the</strong>rmal units (BTUs) and a tripling from current levels by <strong>the</strong> end <strong>of</strong> <strong>the</strong><br />
21 st century. A large fraction <strong>of</strong> <strong>the</strong> global growth in energy use by mid-century is expected to be<br />
in industrializing economies, particularly China and India. 1<br />
While <strong>the</strong> world’s endowment <strong>of</strong> energy resources is sufficient to meet anticipated demand<br />
through <strong>the</strong> century, existing fossil energy supplies will become increasingly strained, with<br />
anticipated economic and geopolitical consequences, as well as continued undesirable<br />
consequences <strong>for</strong> <strong>the</strong> environment. New energy pathways are needed. These pathways must<br />
balance increasingly complex policy goals <strong>of</strong> accessibility, environmental concerns, and<br />
geopolitical issues, and <strong>the</strong>y must consider af<strong>for</strong>dability in <strong>the</strong> U.S. and throughout <strong>the</strong> world.<br />
Forces are driving fundamental changes in both <strong>the</strong> transportation and electric power sectors,<br />
where technologies that have allowed tremendous economic and industrial development over <strong>the</strong><br />
past century are increasingly less desirable when viewed in light <strong>of</strong> <strong>the</strong> evolving geopolitical and<br />
environmental framework. Continued reliance on geographically concentrated oil and natural gas<br />
will threaten international energy security. The continued growth in energy demand and<br />
continued use <strong>of</strong> fossil fuel energy to meet that demand will pose various issues: <strong>the</strong> steady<br />
depletion <strong>of</strong> fossil fuels and <strong>the</strong> consequent increase in fossil fuel prices and price volatility,<br />
reliance on oil and natural gas from a few unstable regions, and increased concentrations <strong>of</strong><br />
carbon dioxide in <strong>the</strong> atmosphere. Alternative energy pathways, including those that significantly<br />
reduce geopolitical concentrations <strong>of</strong> risk, utilize indigenous resources <strong>of</strong> each country in<br />
environmentally benign ways, and promote both energy and economic diversity, are<br />
experiencing rapid global market growth, with more than $150B in transactions in 2007 and<br />
2008. The global energy sector is enormous, representing many trillions <strong>of</strong> investment, and<br />
processing more than 40,000 gallons <strong>of</strong> liquid fuels per second, with capital intensive<br />
requirements and long-lived infrastructure. Transitions should be expected to take multiple<br />
decades and will require careful navigation <strong>of</strong> an increasingly complex set <strong>of</strong> global<br />
interdependencies.<br />
150
World Energy History<br />
Global energy use has grown by a factor <strong>of</strong> more than 20 over <strong>the</strong> past 200 years. This 20-fold<br />
increase has far exceeded <strong>the</strong> 6-fold growth in world population. Figure 2.5.B-1 shows <strong>the</strong><br />
increase in primary energy use and in population, <strong>for</strong> <strong>the</strong> developing world and <strong>the</strong> (now)<br />
industrialized world.<br />
Growth in World Population<br />
Industrialized<br />
Developing<br />
World Primary Energy Use<br />
Industrialized<br />
Developing<br />
Figure 2.5.B-1, Increase in Primary Energy Use and Population <strong>for</strong> Developing and<br />
Industrialized World. 2<br />
EJ: exajoules or 10 18 joules (1.055 exajoules equal 1 quadrillion BTUs)<br />
Growth by Energy Type and Drivers <strong>of</strong> Major Transitions. There have been several drivers<br />
<strong>of</strong> this significant increase in primary energy use per capita. In <strong>the</strong> early 19 th century, <strong>the</strong> world’s<br />
population was still overwhelmingly rural. Dominant energy converters were human labor and<br />
draft animals. With industrial changes starting in mid-century, steam engines and turbines began<br />
to replace people and draft animals as <strong>the</strong> dominant energy converters. The expanding trade in<br />
fossil fuels, first coal and later oil and natural gas, overcame energy supply limitations imposed<br />
by locally available renewable energy. Populations shifted to cities, and manufacturing activities<br />
displaced agriculture as <strong>the</strong> primary source <strong>of</strong> economic output. Changes in economic activity<br />
resulted in increased transportation <strong>of</strong> both goods and people by steamboats and railways.<br />
In <strong>the</strong> 20 th century, an explosion in economic development led to rapid growth in energy usage.<br />
Diffusion <strong>of</strong> automobiles greatly expanded oil use in transportation. Consumer preferences <strong>for</strong><br />
cleaner and more convenient energy services led to a transition from direct use <strong>of</strong> coal to direct<br />
use <strong>of</strong> oil and gas and <strong>the</strong>n to <strong>the</strong> use <strong>of</strong> electricity. Figure 2.5.B-2 shows <strong>the</strong> growth in world<br />
primary energy consumption by source from 1970 to 2004.<br />
151
500<br />
450<br />
400<br />
350<br />
300<br />
250<br />
200<br />
150<br />
100<br />
50<br />
0<br />
1970<br />
1973<br />
1976<br />
1979<br />
1982<br />
1985<br />
1988<br />
1991<br />
1994<br />
1997<br />
2000<br />
2003<br />
Energy, Quadrillion BTU<br />
Coal<br />
Natural Gas<br />
Nuclear Electric Power<br />
Hydroelectric Power<br />
Geo<strong>the</strong>rmal and O<strong>the</strong>r<br />
Petroleum<br />
Total<br />
Year<br />
Figure 2.5.B-2. World Energy Consumption by Source, 1970-2004. 3<br />
Scale <strong>of</strong> <strong>the</strong> World Energy Challenge. The scale <strong>of</strong> <strong>the</strong> global energy system today is<br />
enormous. As detailed above, annual consumption <strong>of</strong> around 400 Quads <strong>of</strong> energy includes<br />
worldwide consumption <strong>of</strong> nearly 80mbpd (million barrels per day) <strong>of</strong> petroleum products<br />
(approximately 40,000 gallons per second!), an installed electric generation capacity <strong>of</strong> around<br />
4300 TW, and continued reliance on traditional biomass <strong>for</strong> a significant (e.g., 1–2 billion)<br />
population. Estimates <strong>of</strong> <strong>the</strong> installed capital (while very approximate) range from $20–100<br />
trillion. Over <strong>the</strong> next 20 years, <strong>the</strong> International Energy Agency (IEA) estimates that $20–50<br />
trillion will be required to meet growing demand and to decarbonize <strong>the</strong> world energy sector to<br />
address climate change.<br />
There are three principle driving factors <strong>for</strong> energy consumption: population, economic growth,<br />
and energy intensity <strong>of</strong> <strong>the</strong> economy. Algebraically,<br />
Energy consumption = Population × GDP/pop × Energy/GDP.<br />
A concise articulation was put <strong>for</strong>th by H<strong>of</strong>fert et al, including implications <strong>for</strong> atmospheric<br />
CO 2 . 4 H<strong>of</strong>fert outlines historic and projected world population growth, GDP growth (globally)<br />
and energy consumption as a function <strong>of</strong> GDP. His key findings are shown in Figure 2.5.B-3<br />
below. The world population was ~ 6.1 billion in 2001 and is projected to increase by 0.9%/yr to<br />
~ 9.4 billion by 2050. World per capita GDP was ~$7,500 per capita in 2001 and is projected to<br />
increase at <strong>the</strong> historical average rate <strong>of</strong> 1.4%/yr to ~$15,000 per capita by 2050. Including an<br />
estimated continued decrease in global energy intensity <strong>of</strong> 0.8%/yr, <strong>the</strong> world energy<br />
consumption rate would grow at a rate <strong>of</strong> 1.5%/yr, from a level <strong>of</strong> 400 Quads today to around<br />
800 Quads in 2050, and to triple to 1,200 Quads by 2100.<br />
152
Figure 2.5.B-3: Historical and Projected World Population, Economic<br />
Growth and Energy Intensity <strong>for</strong> Scenario IS92a. 5<br />
World Energy Future. Multiple agencies and institutions publish scenarios <strong>of</strong> possible world<br />
energy futures. Scenarios from <strong>the</strong> Energy In<strong>for</strong>mation Agency (EIA) and IEA are most<br />
frequently referenced. Utilizing similar techniques and models, o<strong>the</strong>r institutions publish<br />
alternative scenarios based on “materially different” assumptions. One is outlined here <strong>for</strong><br />
comparison, recognizing that many o<strong>the</strong>rs are also available <strong>for</strong> fur<strong>the</strong>r comparison. 6 An<br />
alternative to <strong>the</strong> future energy scenarios developed by <strong>the</strong> EIA and IEA was recently published<br />
by Greenpeace in a report titled “Energy Revolution: A Sustainable World Energy Outlook.” 7<br />
The report compares <strong>the</strong> authors’ “energy [r]evolution scenario” to a reference scenario based on<br />
<strong>the</strong> IEA World Energy Outlook 2004. These scenarios are not intended to predict <strong>the</strong> future, but<br />
ra<strong>the</strong>r to simply describe two potential development paths out <strong>of</strong> a broad range <strong>of</strong> possible<br />
futures.<br />
The reference scenario is based on a business-as-usual approach, taking into account only<br />
existing policies. “The assumptions include, <strong>for</strong> example, continuing progress in electricity and<br />
gas market re<strong>for</strong>ms, <strong>the</strong> liberalization <strong>of</strong> cross border energy trade and recent policies designed<br />
153
to combat environmental pollution. The reference scenario does not include additional policies to<br />
reduce greenhouse gas emissions.” 8 As <strong>the</strong> IEA’s scenario ends in 2030, it has been extrapolated<br />
to provide a baseline <strong>for</strong> comparison with <strong>the</strong> energy [r]evolution scenario.<br />
The energy [r]evolution scenario illustrates <strong>the</strong> ef<strong>for</strong>ts and actions required to achieve <strong>the</strong><br />
ambitious objectives <strong>of</strong> limiting <strong>the</strong> increase in global temperature to under 2° Celsius by 2050<br />
and to phase out nuclear energy. “To achieve <strong>the</strong>se targets, <strong>the</strong> scenario is characterized by<br />
significant ef<strong>for</strong>ts to fully exploit <strong>the</strong> large potential <strong>for</strong> energy efficiency. At <strong>the</strong> same time,<br />
cost-effective renewable energy sources are accessed <strong>for</strong> heat and electricity generation, as well<br />
as, <strong>the</strong> production <strong>of</strong> bi<strong>of</strong>uels.” 9 The energy [r]evolution scenario uses <strong>the</strong> same parameters <strong>for</strong><br />
population and GDP growth as <strong>the</strong> reference scenario.<br />
Figures 2.5.B-4 and 2.5.B-5 provide a summary <strong>of</strong> global primary energy consumption under <strong>the</strong><br />
two scenarios. Compared to <strong>the</strong> reference scenario, in <strong>the</strong> energy [r]evolution scenario, overall<br />
energy demand will be reduced by almost 50 percent in 2050. Around half <strong>of</strong> <strong>the</strong> remaining<br />
demand will be covered by renewable energy sources. In <strong>the</strong> figures below, efficiency represents<br />
reduction compared to <strong>the</strong> reference scenario. *Note that because <strong>of</strong> <strong>the</strong> “efficiency method”<br />
used <strong>for</strong> <strong>the</strong> calculation <strong>of</strong> primary energy consumption (which postulates that <strong>the</strong> amount <strong>of</strong><br />
electricity generation from hydro, wind, solar and geo<strong>the</strong>rmal energy equals <strong>the</strong> primary energy<br />
consumption), <strong>the</strong> share <strong>of</strong> renewables seems to be lower than <strong>the</strong>ir actual importance as energy<br />
suppliers.<br />
Figure 2.5.B-4 Development <strong>of</strong> Global<br />
Primary Energy Consumption under <strong>the</strong><br />
Reference Scenario.<br />
Figure 2.5.B-5. Development <strong>of</strong> Global<br />
Primary Energy Consumption under <strong>the</strong><br />
Energy Revolution Scenario.<br />
PJ = petajoules or 10 15 joules (1055 petajoules equal 1 quadrillion BTUs) 10<br />
U.S. Energy History. The sources <strong>of</strong> energy in <strong>the</strong> United States have gone through two major<br />
transitions, from primarily wood to coal between 1850 and 1920, and from coal to oil and natural<br />
gas between 1920 and 1970. Non-fossil energy sources—nuclear and renewables—have<br />
contributed less than 20 percent <strong>of</strong> annual energy use since 1920. Renewable sources o<strong>the</strong>r than<br />
hydro-electric power, such as biomass, geo<strong>the</strong>rmal, wind, and solar, account <strong>for</strong> less than 2.5<br />
percent <strong>of</strong> current annual energy use. According to <strong>the</strong> EIA, petroleum use in <strong>the</strong> U.S. is split<br />
154
among different sectors: 65% transport, 25% “industrial/petrochemical” 4% residential, 1.5%<br />
commercial, and 1.5% electric generation. 1<br />
Energy intensity in <strong>the</strong> United States economy has continued to decrease, driven by energy<br />
policy, technology development and diffusion, and economic trends such as shifting <strong>of</strong> energy<br />
intensive activities to o<strong>the</strong>r nations. Between 1980 and 1985, <strong>the</strong> energy intensity <strong>of</strong> <strong>the</strong> economy<br />
decreased by almost 20 percent due to energy policies and technological developments spurred<br />
by <strong>the</strong> oil embargo <strong>of</strong> <strong>the</strong> 1970s. It declined yet ano<strong>the</strong>r 20 percent by 2005.<br />
Energy as a Part <strong>of</strong> <strong>the</strong> U.S. Economy. The primary determinants <strong>of</strong> energy use are population,<br />
economic activity per capita, and energy use per dollar <strong>of</strong> economic activity, or “energy<br />
intensity.” The product <strong>of</strong> economic activity per capita and energy intensity is energy use per<br />
capita. The drivers <strong>of</strong> trends in energy intensity are energy policies, technological development<br />
and diffusion, and economic trends such as shifting <strong>of</strong> energy intensive activities to o<strong>the</strong>r<br />
nations. Energy intensity is expected to continue decreasing from 2005 to 2030 at a rate similar<br />
to that from 1985 onwards.<br />
Figure 2.5.B-6: Economic Development and<br />
Carbon Intensity is Tightly Correlated with<br />
Energy Consumption.<br />
U.S. energy use per capita has<br />
remained roughly constant <strong>for</strong> <strong>the</strong> last<br />
20 years, with increases in economic<br />
activity per capita <strong>of</strong>fsetting decreases<br />
in energy intensity. In <strong>the</strong>ir “businessas-usual”<br />
scenario, <strong>the</strong> EIA projects a<br />
slight increase in U.S. energy use per<br />
capita <strong>for</strong> <strong>the</strong> years 2005 to 2030<br />
driven by demographic and geographic<br />
changes. These changes include an<br />
aging population, a predicted<br />
migration <strong>of</strong> <strong>the</strong> population from <strong>the</strong><br />
North to <strong>the</strong> South, and projected<br />
increases in income.<br />
While energy use per capita in <strong>the</strong> U.S.<br />
and o<strong>the</strong>r industrialized countries has<br />
been growing slowly in recent years, it<br />
has been growing more quickly in<br />
many o<strong>the</strong>r countries. The U.S.<br />
remains <strong>the</strong> world’s leading energy<br />
consumer on a per capita basis and in<br />
aggregate. Figure 2.5.B-6 shows <strong>the</strong><br />
relationship over time between energy<br />
use per capita and economic<br />
development. 11<br />
Transitions in <strong>the</strong> economic and social development <strong>of</strong> countries and societies are marked by<br />
changes in <strong>the</strong> energy system as <strong>the</strong>y climb <strong>the</strong> “energy ladder.”<br />
1 EIA Annual Energy Outlook. Available at www.eia.doe.gov<br />
155
The first and most important step is substituting commercial <strong>for</strong> traditional fuels.<br />
Perhaps one billion people worldwide still rely mainly on biomass fuels and animal<br />
wastes. After that <strong>the</strong>re is a strong—but constantly changing—relationship between<br />
income and energy demand. When per capita GDP (on a purchasing power parity basis)<br />
reaches some:<br />
$3,000 – demand explodes as industrialization and personal mobility take <strong>of</strong>f<br />
$10,000 – demand slows as <strong>the</strong> main spurt <strong>of</strong> industrialization is completed<br />
$15,000 – demand grows more slowly than income as services dominate<br />
economic growth and basic household energy needs are met<br />
$25,000 – economic growth requires little additional energy 12<br />
While this is <strong>the</strong> typical model <strong>for</strong> economic development, <strong>the</strong>re are o<strong>the</strong>r examples. For<br />
example, India has a developed, relatively energy efficient services sector which might provide a<br />
model <strong>for</strong> bypassing <strong>the</strong> development <strong>of</strong> energy intensive industries to achieve economic growth.<br />
Threats to <strong>National</strong> Security and Economic Stability<br />
While <strong>the</strong> world’s endowment <strong>of</strong> energy resources is sufficient to meet anticipated demand<br />
through <strong>the</strong> century, lagging production and distribution infrastructure have strained global<br />
energy supplies. In addition, 75 percent <strong>of</strong> <strong>the</strong> world’s proven oil reserves, and currently half and<br />
growing share <strong>of</strong> oil production, are currently from OPEC nations. The increasing geographic<br />
concentration <strong>of</strong> oil and natural gas supplies, particularly from politically unstable or<br />
antagonistic nations, places international energy supplies at risk from regional conflict and from<br />
deliberate strategic decisions.<br />
As <strong>the</strong> world’s largest oil consumer, <strong>the</strong> United States is vulnerable to supply disruptions and<br />
price spikes. In <strong>the</strong> last 10 years, <strong>the</strong> price <strong>of</strong> oil has increased 6-fold, to more than $100 a barrel<br />
in January <strong>of</strong> 2008. Increased energy prices have impacts across <strong>the</strong> economy, particularly<br />
affecting households with low discretionary income. Price volatility is also increasing in<br />
frequency and scale, impacting <strong>the</strong> business and investment climate. While 2009 prices have<br />
reduced from <strong>the</strong> peaks <strong>of</strong> 2008, long-term <strong>for</strong>ecasts, based upon increased global demand,<br />
project increasing supply/demand pressures that will inflate prices over <strong>the</strong> long term.<br />
Dependence on fossil fuels and imported oil poses a growing risk to <strong>the</strong> national economy, <strong>the</strong><br />
environment, and national security:<br />
75% <strong>of</strong> <strong>the</strong> world’s proven oil reserves and 50% <strong>of</strong> <strong>the</strong> oil production are from OPEC<br />
nations, many <strong>of</strong> whom are controlled by unstable, if not antagonistic, regimes. Six <strong>of</strong> <strong>the</strong><br />
seven largest holders <strong>of</strong> proven reserves are OPEC members, and five <strong>of</strong> <strong>the</strong>m are in <strong>the</strong><br />
Middle East.<br />
Of <strong>the</strong> 2006 U.S. fossil fuel use <strong>of</strong> 84.8 quadrillion BTUs, 35.3% was imported 13 (0% <strong>of</strong><br />
<strong>the</strong> 26.7% from coal, 4.5% <strong>of</strong> <strong>the</strong> 26.4% from NG, and 72.6% <strong>of</strong> <strong>the</strong> 46.9% from oil). By<br />
comparison, <strong>of</strong> <strong>the</strong> 1996 U.S. fossil fuel use <strong>of</strong> 79.9 quadrillion BTUs, 29.2% was<br />
imported.<br />
The U.S. is <strong>the</strong> world’s largest oil consumer, using a little over 20 million barrels per day<br />
in total petroleum products. The five nations currently exporting <strong>the</strong> most crude oil to <strong>the</strong><br />
U.S. are Canada, Saudi Arabia, Mexico, Nigeria, and Venezuela. Of <strong>the</strong>se nations, Saudi<br />
Arabia, Nigeria, and Venezuela are members <strong>of</strong> OPEC. In total, OPEC countries supply<br />
almost half <strong>of</strong> U.S. imports. 14<br />
156
Supply disruptions and price spikes have direct costs to U.S. consumers and social costs to <strong>the</strong><br />
U.S. economy. In addition, some fraction <strong>of</strong> U.S. military expenditures might be attributed to<br />
maintaining a stable global energy supply. Finally, global competition <strong>for</strong> oil has geopolitical<br />
and security implications.<br />
Figure 2.5.B-7 shows net regional oil exports and imports from each region <strong>of</strong> <strong>the</strong> world in 2005<br />
and projected <strong>for</strong> 2030. 15<br />
Figure 2.5.B-7. Net Regional Oil Exports and Imports.<br />
Overall, under <strong>the</strong> business-as-usual scenario <strong>for</strong> Figure 2.5.B-7, <strong>the</strong> U.S., EU, China and India<br />
will increase <strong>the</strong>ir net imports over <strong>the</strong> next 25 years, with <strong>the</strong> majority <strong>of</strong> new supply coming<br />
from <strong>the</strong> Middle East. Since <strong>the</strong> U.S. is <strong>the</strong> world’s largest oil consumer, using four times more<br />
oil in absolute terms than any o<strong>the</strong>r nation, 16 an increase in U.S. demand can raise world oil<br />
prices, although it is unclear if a reduction in U.S. demand will have an elastic effect on world oil<br />
prices, particularly with global demand growing strongly. Additionally, increasing U.S. demand<br />
<strong>for</strong> oil can effectively increase <strong>the</strong> U.S. trade deficit as a result <strong>of</strong> <strong>the</strong> higher price paid to <strong>for</strong>eign<br />
suppliers. Moreover, <strong>the</strong>re are environmental costs <strong>of</strong> oil and o<strong>the</strong>r fossil fuel usage that are not<br />
priced to <strong>the</strong> consumer.<br />
The U.S. uses various instruments and organizations to maintain a stable global supply <strong>of</strong><br />
energy. The United States has incurred substantial military costs in <strong>the</strong> Persian Gulf and in o<strong>the</strong>r<br />
oil exporting regions. As a strategic commodity with no viable substitutes in <strong>the</strong> near future, oil<br />
and gas are increasingly being used <strong>for</strong> geopolitical leverage resulting in global tensions. 17<br />
Sustainable Energy Technologies and Transition Issues<br />
Reduction in our dependence on fossil fuels, domestically and globally, <strong>of</strong>fers multiple benefits,<br />
including energy diversity, increased domestic energy production with concomitant economic<br />
157
impacts, and reduced environmental impacts. Sustainable energy resources, such as (sustainably<br />
harvested) biomass, geo<strong>the</strong>rmal, wind, solar, ocean and kinetic energy, hydropower, will require<br />
significant increase in scale over <strong>the</strong> next decades to contribute in a meaningful way to <strong>the</strong><br />
domestic and global energy economy. 2 Note that no singular definition <strong>of</strong> “sustainable” is in use<br />
globally. For example, large scale hydropower is <strong>of</strong>ten not considered “sustainable” given <strong>the</strong><br />
major environmental impacts associated with damning. Some constituents argue that nuclear<br />
power should be reconsidered as sustainable, as it has no carbon emissions; however, it has a<br />
separate set <strong>of</strong> environmental and national security issues.<br />
Adoption rates <strong>of</strong> <strong>the</strong>se new energy technologies, however, are restrained by <strong>the</strong> stock <strong>of</strong> current<br />
energy technologies and by energy policy. Capital-intensive energy infrastructure technologies<br />
have long lifetimes, ranging from 20 to 100 years. They are also subject to both technological<br />
and institutional “lock-in,” (i.e., a number <strong>of</strong> positive feedback loops that favor existing<br />
technologies).<br />
Several studies have assessed <strong>the</strong> potential contribution from various technological options. A<br />
number <strong>of</strong> distinct measures <strong>of</strong> potential, not necessarily comparable, are <strong>of</strong>ten reported. Such<br />
measures might reflect <strong>the</strong> following:<br />
Theoretical potential (up to <strong>the</strong> maximum permitted by <strong>the</strong> laws <strong>of</strong> physics)<br />
Technological potential<br />
Economic potential based on social value<br />
<br />
<br />
Economic potential based on private internal value<br />
Economic potential accounting <strong>for</strong> market failures, existing infrastructure, and a realistic<br />
policy future<br />
The last <strong>of</strong> <strong>the</strong>se measures is <strong>the</strong> most applicable and likely <strong>the</strong> most important in making policy<br />
decisions. In addition, it is likely that <strong>the</strong>re is no single technological silver bullet <strong>for</strong> producing<br />
changes at <strong>the</strong> scale and speed desired. Portfolios <strong>of</strong> complementary options will need to be<br />
evaluated that also take into account <strong>the</strong> complexities <strong>of</strong> energy security, <strong>the</strong> environment, and<br />
economic prosperity.<br />
Technology advancements are <strong>of</strong>ten thought <strong>of</strong> in relation to consumer goods and services, such<br />
as cell phones and <strong>the</strong> internet. However, <strong>the</strong>re is a long and deep literature on technology<br />
advancement that clearly indicates very large differences in <strong>the</strong> rate <strong>of</strong> technology advancement<br />
and adoption as a function <strong>of</strong> <strong>the</strong> market characteristics, size <strong>of</strong> individual purchase or<br />
investment, and a number <strong>of</strong> o<strong>the</strong>r factors. 18<br />
Essential findings are as follows:<br />
Social contagion, social learning, and network effects all influence market penetration <strong>of</strong> new<br />
technology. Exogenous factors such as government mandates and “directional leadership”<br />
may play a significant role in shaping those factors. 19<br />
Historically, academic R&D precedes product introduction by 4–10 years. 20<br />
The average time from invention to “sales take<strong>of</strong>f” (accelerating market penetration) is more<br />
than 42 years 21<br />
Market penetration <strong>of</strong> consumer technologies (e.g., cell phones, liquid crystal displays<br />
2 Details on <strong>the</strong> current status <strong>of</strong> <strong>the</strong>se technologies is available in <strong>the</strong> Renewable Energy Data Book,<br />
avalailable at http://www1.eere.energy.gov/maps_data/<br />
158
[LCDs], etc.) is accelerating to less than 10 years<br />
Consumer-oriented energy technologies show unusually slow adoption rates (e.g., 10 years to<br />
more than 50 years <strong>for</strong> “consumer energy goods” such as low E windows, compact<br />
fluorescent light bulbs). 22<br />
Capital-intensive, long-lived infrastructure technologies have adoption rates on <strong>the</strong> order <strong>of</strong><br />
decades to a century.<br />
Fur<strong>the</strong>r details are provided in Appendix A.<br />
Many publications address <strong>the</strong> challenges posed by our current energy economy. Esteemed<br />
organizations such as <strong>the</strong> Council on Foreign Relations and many o<strong>the</strong>rs have argued that energy<br />
(and energy-related climate emissions) threats are now more acute than ever and call <strong>for</strong> strong<br />
leadership. 23 Moreover, <strong>the</strong> policy environment has evolved to address three principal goals: <strong>the</strong><br />
environment, economic prosperity, and security. 24<br />
No one technology approach is envisaged to be capable <strong>of</strong> addressing <strong>the</strong> complexities <strong>of</strong> <strong>the</strong><br />
energy economy challenges, particularly in <strong>the</strong> 20–50 year timeframe, with such a large installed<br />
capital base. The suite <strong>of</strong> technologies ranges from conservation to <strong>for</strong>est management to nonemitting<br />
power technologies, to carbon capture and storage (CCS) to bi<strong>of</strong>uels, as discussed<br />
fur<strong>the</strong>r below.<br />
Having benefited from significant long-term expansion <strong>of</strong> U.S., European and some Asian<br />
economies, <strong>the</strong> developed nations <strong>of</strong> <strong>the</strong> world, and particularly <strong>the</strong> U.S. and Europe continue to<br />
create and adapt to help sustain economic development. Moreover, some leaders have been<br />
extremely cautious <strong>of</strong> crafting policies or rules that would inhibit economic development <strong>for</strong> <strong>the</strong><br />
benefit <strong>of</strong> ei<strong>the</strong>r <strong>the</strong> environment or security. O<strong>the</strong>rs, however, are fully committed to <strong>the</strong><br />
environmental aspects <strong>of</strong> energy while crafting policies and strategies to address <strong>the</strong> economics<br />
and security aspects. Going <strong>for</strong>ward, <strong>the</strong> increasingly strong growth <strong>of</strong> two new economic<br />
powerhouses, China and India, is reshaping <strong>the</strong> debate. 25 Both with billion-level populations and<br />
economies growing 8-10% /yr., <strong>the</strong>ir economic power, combined with <strong>the</strong>ir <strong>for</strong>eign investment<br />
management, have increasing implications <strong>for</strong> significant growth in energy requirements. If not<br />
approached mindfully, increasing competition among nations <strong>for</strong> energy supply, conversion<br />
technology, and work<strong>for</strong>ce may be anticipated to drive nationalistic interests and decisions.<br />
Rapid expansion <strong>of</strong> <strong>the</strong> Indian and Chinese energy economies, <strong>of</strong>ten with least cost technologies<br />
that are not adaptable <strong>for</strong> tighter environmental requirements, is anticipated to lead to a large<br />
installed base where energy lock-in may persist, with significant implications <strong>for</strong> environment.<br />
There is a growing recognition <strong>of</strong> <strong>the</strong> critical role energy plays in <strong>the</strong> U.S. and global economy<br />
and world order. While <strong>the</strong> U.S. economy has proved (perhaps surprisingly to some) resilient to<br />
<strong>the</strong> recent rise in oil prices, supply disruptions such as <strong>the</strong> Nor<strong>the</strong>ast electricity blackout <strong>of</strong> 2003<br />
and production and refinery outages due to Hurricane Katrina indicate <strong>the</strong> relative fragility <strong>of</strong> <strong>the</strong><br />
energy system. Similarly, <strong>the</strong>re is a growing recognition <strong>of</strong> <strong>the</strong> increasingly complex world<br />
energy interdependence and challenges associated with national and global security concerns<br />
ranging from supply disruption to geopolitical interventions, from nationalization <strong>of</strong> assets to<br />
price manipulation. 26 A wide range <strong>of</strong> countries (U.S., China, Japan, India, Brazil and many<br />
o<strong>the</strong>rs) have recently moved to secure long-term supply and to increase development and use <strong>of</strong><br />
domestic resources in order to lessen <strong>the</strong>ir dependencies on imported energy from unstable<br />
regions.<br />
159
Recognizing <strong>the</strong> characteristics <strong>of</strong> today’s energy economy (including scale, strong lock-in, and<br />
<strong>the</strong> duration <strong>of</strong> energy infrastructure) indicates that today’s decisions have lasting impacts <strong>for</strong><br />
many decades. For example, <strong>the</strong> age distribution <strong>of</strong> <strong>the</strong> U.S. fleet <strong>of</strong> coal power plants, as shown<br />
in Figure 2.5B-8 below, indicates that such capital-intensive infrastructure may be kept “alive”<br />
well past its economic life. 27<br />
Figure 2.5.B-8. Age Distribution <strong>of</strong> U.S. Coal Power Generation Fleet. 28<br />
Given <strong>the</strong> recent IEA estimate that ~$1-–2 trillion/year <strong>for</strong> <strong>the</strong> next 20 years will be spent on<br />
energy infrastructure, without significant exogenous input, today’s decisions will not only be<br />
with us <strong>for</strong> many decades, but <strong>the</strong>y may have implications lasting well into <strong>the</strong> next century.<br />
Within <strong>the</strong> context addressing <strong>the</strong> complexities <strong>of</strong> environment, economic prosperity and<br />
security, it is increasingly clear that a portfolio approach toward our energy future is required.<br />
No single technology can be deployed at scale with sufficient speed to address <strong>the</strong> urgency <strong>of</strong> <strong>the</strong><br />
challenge. Moreover, it is increasingly clear that pursuing a low carbon energy economy is<br />
pivotal to reducing global greenhouse gas (GHG) emissions and eventually stabilizing world<br />
CO 2 concentrations. What is less clear, however, are <strong>the</strong> trade<strong>of</strong>fs required to “decarbonize” <strong>the</strong><br />
energy economy. Typically, <strong>the</strong>se trade<strong>of</strong>fs are expressed as increased costs <strong>for</strong> new or lowcarbon<br />
energy technologies. However, more recent analyses have pointed out additional benefits<br />
that include reduced price fluctuation exposure, reduced negative health impacts, increased<br />
work<strong>for</strong>ce/job development, and national and global security benefits. O<strong>the</strong>r reports also<br />
evaluate <strong>the</strong> potential damages related to climate change and evaluate <strong>the</strong> economic cost/benefit<br />
trade<strong>of</strong>fs. Globally, <strong>the</strong> Stern Report, conducted <strong>for</strong> <strong>the</strong> UK Government, and lead by Nicholas<br />
Stern, conducted <strong>the</strong> most comprehensive cost/benefit analysis. Using a consensus set <strong>of</strong><br />
financial assumptions such as discount rate, Stern found that immediate action at scale and speed<br />
160
significant enough to impact <strong>the</strong> global concentrations would have materially reduced economic<br />
impacts when viewed over <strong>the</strong> next few centuries. 29<br />
In <strong>the</strong> U.S., many reports have been completed on <strong>the</strong> possible impacts <strong>of</strong> various <strong>for</strong>ms <strong>of</strong> clean<br />
energy legislation, including state-level renewable portfolio standards (RPSs), national RPSs,<br />
and o<strong>the</strong>r variants. 30,31,32 In all cases, increased use <strong>of</strong> renewable energy technologies induced<br />
positive economic and environmental outcomes. Consumer impacts varied from slightly negative<br />
to slightly positive on an annual expenditure basis.<br />
The following are considered to be <strong>the</strong> essential characteristics <strong>of</strong> a feasible long-term approach<br />
to energy sustainability:<br />
1. A future global sustainable energy infrastructure and economy must<br />
simultaneously have <strong>the</strong> following characteristics:<br />
Economically af<strong>for</strong>dable and stable<br />
Secure, accessible, and reliable<br />
Environmentally sustainable<br />
2. There is a time urgency that demands a serious departure from business as usual.<br />
3. The new approach will surely require a blend <strong>of</strong> technology innovation, market<br />
restructuring, new government policies, and education <strong>of</strong> our citizens.<br />
4. This long-term solution will likely require investments in technological<br />
innovation, development <strong>of</strong> human talent needed <strong>for</strong> such innovation, and policy<br />
development orders <strong>of</strong> magnitude larger than have been made to date.<br />
Climate Change and Energy Security Trade<strong>of</strong>fs. Finally, in order to highlight <strong>the</strong> trade<strong>of</strong>fs<br />
between energy security and climate change, <strong>the</strong> World Resources Institute produced <strong>the</strong><br />
following assessment <strong>of</strong> energy options.<br />
161
Figure 2.5.B-9. A Snapshot <strong>of</strong> Selected U.S. Energy Options Today: Climate and Energy<br />
Security Impacts and Trade<strong>of</strong>fs in 2025.<br />
Figure 2.5.B-9 compares <strong>the</strong> energy security and climate characteristics <strong>of</strong> different energy<br />
options. The bubble size corresponds to incremental energy provided or avoided in 2025. The<br />
reference point is <strong>the</strong> “business as usual” mix in 2025. The horizontal axis includes<br />
sustainability, as well as traditional aspects <strong>of</strong> sufficiency, reliability, and af<strong>for</strong>dability. The<br />
vertical axis illustrates lifecycle greenhouse gas intensity. Bubble placements are based on<br />
quantitative analysis and WRI expert judgment. 33<br />
The Challenge<br />
Many technology options exist that can contribute to an energy sustainable future, including<br />
energy efficient techniques, non-emitting power generation, bi<strong>of</strong>uels, <strong>for</strong>est and land<br />
management, and carbon dioxide capture and storage. A challenge <strong>of</strong> this scale needs to be<br />
addressed at <strong>the</strong> global level, but here in <strong>the</strong> U.S., an appropriate strategy will also be required<br />
across Federal, state, and local governments, as well as across businesses, non-pr<strong>of</strong>it<br />
organizations, and o<strong>the</strong>r stakeholders.<br />
162
Summary and Conclusions<br />
This paper has attempted to syn<strong>the</strong>size <strong>the</strong> very broad and deep literature on energy issues<br />
related to security, prosperity and sustainability. The key issues that have been raised in <strong>the</strong><br />
literature include:<br />
1. Global energy demand is anticipated to grow 2×–-3× over <strong>the</strong> next century as<br />
population and global GDP continue to expand.<br />
2. The world’s energy endowment is sufficient to meet <strong>the</strong> anticipated demand through<br />
2100, but it will become increasingly strained unless o<strong>the</strong>r energy pathways are<br />
developed. Additionally, continued extraction and use <strong>of</strong> fossil fuels has material<br />
implications <strong>for</strong> environmental and security goals.<br />
3. U.S. energy use has developed in accordance with <strong>the</strong> availability and use <strong>of</strong> coal,<br />
petroleum, natural gas and nuclear energy. Recent advances in renewable energy<br />
make up approximately 2.5% <strong>of</strong> <strong>the</strong> U.S. energy supply.<br />
4. U.S. energy policy has historically dealt relatively independently with petroleum<br />
resources and use vs. electricity generation, transmission, and distribution. Policy<br />
and regulations have been <strong>the</strong> primary drivers <strong>of</strong> changes in <strong>the</strong> electricity<br />
generation portfolio, automobile fuel economy, <strong>the</strong> built environment, and are<br />
increasingly complicated by ties to agricultural policy via bi<strong>of</strong>uels and international<br />
policy via energy and national security and trade.<br />
5. Capital-intensive energy infrastructure technologies change slowly, with lifetimes<br />
from 20–100 years, and are subject to strong lock-in.<br />
6. Anthropogenic emissions <strong>of</strong> greenhouse gases, predominantly from our energy<br />
economy, are <strong>the</strong> major contributors to increased concentrations <strong>of</strong> GHGs.<br />
7. Many technologies exist today that can contribute to energy <strong>for</strong> a sustainable future,<br />
including energy efficiency approaches, non-emitting power generation, bi<strong>of</strong>uels,<br />
<strong>for</strong>est and land management, and CO 2 capture and storage.<br />
Taken as a whole, <strong>the</strong> assessments summarized indicate that a trans<strong>for</strong>mational change is<br />
required <strong>for</strong> <strong>the</strong> global energy economy. The need <strong>for</strong> this change is urgent, and <strong>the</strong> scale <strong>of</strong> <strong>the</strong><br />
change is enormous.<br />
Appendix A: Details <strong>of</strong> Technology Change and Adoption<br />
A. Technology Introduction and Gestation Time<br />
Studies have approached <strong>the</strong> question <strong>of</strong> how long it takes a technology to be introduced into <strong>the</strong><br />
market from a number <strong>of</strong> perspectives. First, research by Mansfield 34 on <strong>the</strong> impact <strong>of</strong> academic<br />
research on technology introduction found that average lag time between <strong>the</strong> most recent<br />
published academic research finding and its first commercial introduction over seven industries<br />
was 7 years. Mansfield’s findings are consistent with those <strong>of</strong> Gellman, who studied innovations<br />
from 1953 to 1973, finding an average lag time <strong>of</strong> 7.2 years. 35 Moreover, Mansfield reported a<br />
range <strong>of</strong> lag time from 4.2 years (instrument sector) to 9.8 years (metals) and found that industry<br />
believed substantial delays <strong>of</strong> 9 years (or more) would have occurred in technology introduction<br />
without academic research in which such research played a significant role in technology<br />
development.<br />
In addition to <strong>the</strong> work <strong>of</strong> Mansfield and Gellman, analysis <strong>of</strong> 30 product-development and<br />
market sales cycles over 150 years was per<strong>for</strong>med by Agarwal and Bayus 36 in which <strong>the</strong>y<br />
conclude that average time from invention to “sales take<strong>of</strong>f” (accelerating market penetration) is<br />
163
more than 42 years. That is, <strong>the</strong> length <strong>of</strong> time from invention to measurable market<br />
penetration—without accounting <strong>for</strong> any fundamental R&D that preceded <strong>the</strong> specific product<br />
invention—is 42 years across a broad range <strong>of</strong> consumer products. They based <strong>the</strong>ir estimate <strong>of</strong><br />
<strong>the</strong> year <strong>of</strong> invention on several published sources 37 and analyses 38 which, in general, defined<br />
invention as <strong>the</strong> year <strong>of</strong> <strong>the</strong> most recent patent, not <strong>the</strong> first patent or publication <strong>of</strong> fundamental<br />
technology. Their analysis is summarized in Figure 2.5.B.A-1.<br />
Figure 2.5.B.A-1. Descriptive Statistics <strong>for</strong> Market Evolution <strong>of</strong> Product Innovations<br />
Derived from Analysis <strong>of</strong> 20 Products by Agarwal and Bayus. 39<br />
The fur<strong>the</strong>r measure <strong>of</strong> <strong>the</strong> gestation time <strong>for</strong> fundamental R&D is also significant relative to any<br />
measure <strong>of</strong> advancement <strong>of</strong> technology into <strong>the</strong> market by public R&D <strong>of</strong> fundamental<br />
technology. Several metrics exist to measure <strong>the</strong> effectiveness <strong>of</strong> R&D as a function <strong>of</strong> timefrom-research,<br />
including citation trees and patent citation temporal studies, but <strong>the</strong>y do not<br />
quantify impact on temporal change <strong>of</strong> product introduction. In <strong>the</strong> energy field, previous studies<br />
indicate that <strong>the</strong> research-market pipeline may be particularly long compared to o<strong>the</strong>r sectors. 40,<br />
41<br />
The research <strong>of</strong> Agarwal and Bayus also suggests that <strong>the</strong> number <strong>of</strong> firms commercializing a<br />
technology impacts <strong>the</strong> time to sales take<strong>of</strong>f. They postulate that sales take<strong>of</strong>f is caused by<br />
outward shifting supply and demand curves, and firm entry not only affects supply, but also<br />
affects demand <strong>for</strong> <strong>the</strong> product. This is because product improvements, expanded distribution,<br />
and increased customer awareness result from increased marketing activities.<br />
B. Energy Sector Infrastructure Adoption Rates<br />
Long-lived, and highly capital intensive infrastructure displays markedly different technology<br />
adoption characteristics than consumer products. As shown in Figure 2.5.B.A-2, <strong>the</strong> shares <strong>of</strong><br />
total primary energy in <strong>the</strong> United States supplied by different fuels (top panel) and estimates <strong>for</strong><br />
<strong>the</strong> consumption <strong>of</strong> major primary fuels worldwide (bottom panel) change on a much slower rate<br />
than consumer goods. Here, major changes in energy fuel supply occur on <strong>the</strong> order <strong>of</strong> a century.<br />
164
As with <strong>the</strong> evolution <strong>of</strong> particular technologies and infrastructures, <strong>the</strong> diffusion <strong>of</strong><br />
energy sources follows a similar pattern. The market share <strong>of</strong> a fuel expands initially<br />
slowly as gradually expanding niche markets are filled; a more lengthy process <strong>of</strong><br />
pervasive diffusion follows, eventually saturating and declining as a superior competitor<br />
enters and diffuses. Despite <strong>the</strong> simultaneous competition and interaction among many<br />
different sources <strong>of</strong> energy, each historical period is characterized by a clear dominance<br />
<strong>of</strong> a single energy source, which corresponds with <strong>the</strong> main technological clusters:<br />
fuelwood (and feed), followed by coal, and later by oil and natural gas. The rates <strong>for</strong><br />
diffusion are also similar <strong>for</strong> all <strong>of</strong> <strong>the</strong> major fuels (wood, coal, oil, gas), which required<br />
a century to achieve <strong>the</strong>ir ultimate saturation. The diffusion rate <strong>for</strong> nuclear is not yet<br />
evident because <strong>of</strong> its relatively low market share. 42<br />
Figure 2.5.B.A-2. Selection <strong>of</strong> Energy Source Supply in <strong>the</strong> United States from 1800<br />
to 2000. 43<br />
165
Using average values from <strong>the</strong> literature—excluding preceding academic R&D—<strong>the</strong> time from<br />
invention to market penetration <strong>of</strong> 90% is about 80 years, with a range as low as 20 years and as<br />
high as two centuries <strong>for</strong> long-lived infrastructure technologies.<br />
C. Energy “Technology Lock-in” and Learning<br />
Technology Lock-in. Particularly <strong>for</strong> capital-intensive, long-lived infrastructure, it has been<br />
argued that <strong>the</strong> development <strong>of</strong> technologies both influences and is influenced by <strong>the</strong> social,<br />
economic and cultural setting in which <strong>the</strong>y develop. 44 Technology pathways have been shown<br />
to depend on <strong>the</strong> particular characteristics <strong>of</strong> initial markets, <strong>the</strong> institutional and regulatory<br />
factors governing its introduction and <strong>the</strong> expectations <strong>of</strong> consumers. This “technology lock-in”<br />
has been shown to depend on four major classes <strong>of</strong> technology and social influences: scale<br />
economies, learning effects, adaptive expectations and network economies, which contribute to<br />
this positive feedback in favor <strong>of</strong> existing technologies. 45 For capital intensive energy<br />
technologies, each factor is particularly relevant: (1) <strong>the</strong> economic scale is on <strong>the</strong> order <strong>of</strong><br />
trillions <strong>of</strong> dollars per annum, (2) learning drives competitive costs (see below), (3) consumer<br />
expectations have been <strong>for</strong>med over multiple generations, and (4) economics <strong>of</strong> networks such as<br />
electricity transmission and distribution or oil/gas<br />
collection/transportation/processing/distribution constitute a significant investment and influence<br />
on possible alternatives.<br />
Additionally, as modern technological systems are deeply embedded in institutional structures,<br />
institutional lock-in can interact with and rein<strong>for</strong>ce <strong>the</strong> drivers <strong>of</strong> technological lock-in (e.g.,<br />
slow technology change). Here, examples such as <strong>the</strong> regulatory and oversight institutions, as<br />
well as <strong>the</strong> corporate and political institutions, cover a broad range <strong>of</strong> interests in <strong>the</strong> energy<br />
sector. It has been suggested that modern technological systems, such as <strong>the</strong> carbon-based energy<br />
system, have been strongly influenced by both technological and institutional factors, resulting in<br />
exceptionally strong lock-in.<br />
Technology Learning. Technology learning is classically described as <strong>the</strong> decrease in costs as a<br />
function <strong>of</strong> cumulative production. (Initially, learning was intended to capture both economies <strong>of</strong> scale<br />
and R&D advancement in a single descriptor. More recent advances in <strong>the</strong> <strong>the</strong>ory have shown that<br />
multiple factors can influence overall learning rates and one can separate <strong>the</strong> various influences on overall<br />
technology cost & per<strong>for</strong>mance. 46 ) Numerous researchers have investigated <strong>the</strong> nature <strong>of</strong> learning<br />
curves <strong>for</strong> energy technologies. 47 The International Energy Agency has also published data and<br />
trends, as shown in Figure 2.5.B.A-3. From <strong>the</strong> IEA data <strong>for</strong> electric generation technologies,<br />
photovoltaics have <strong>the</strong> fastest learning (drop in price with cumulative production), followed by<br />
wind power and <strong>the</strong>n biomass power. Coal and natural gas combined cycle technologies have<br />
shown limited cost reductions after <strong>the</strong> initial TW <strong>of</strong> installations.<br />
↑ Back to <strong>the</strong> top<br />
1 International Energy Agency, World Energy Outlook, 2008.<br />
2 Grubler, Arnulf, "Energy transitions," Encyclopedia <strong>of</strong> Earth, (2007), Cutler J. Cleveland (ed.).<br />
Available online at: http://www.eoearth.org/article/Energy_transitions.<br />
3 “Table 11.1 World Primary Energy by Source, 1970-2004,” Energy In<strong>for</strong>mation Administration,<br />
International Energy Database. Available online at: http://www.eia.doe.gov/emeu/aer/txt/stb1101.xls.<br />
166
4 M. I. H<strong>of</strong>fert et. al., “Energy Implications <strong>of</strong> Future Atmospheric Stabilization <strong>of</strong> CO2 Content,” Nature<br />
395 (1998): 881-884. Available online at:<br />
www.nature.com/nature/journal/v395/n6705/pdf/395881a0.pdf<br />
5 M. I. H<strong>of</strong>fert et. al., “Energy Implications <strong>of</strong> Future Atmospheric Stabilization <strong>of</strong> CO2 Content,” Nature<br />
395 (1998): 881-884. Available online at:<br />
www.nature.com/nature/journal/v395/n6705/pdf/395881a0.pdf<br />
6 See <strong>for</strong> example scenarios at <strong>the</strong> Pew Center <strong>for</strong> Climate Change, Union <strong>of</strong> Concerned Scientists,<br />
Electric Power Group, and <strong>the</strong> Electric Power Research Institute <strong>for</strong> additional scenarios.<br />
7 Greenpeace International and European Renewable Energy Council, Energy Revolution: A Sustainable<br />
Energy Outlook (January 2007), p 25.<br />
8 Ibid.<br />
9 Ibid.<br />
10 Greenpeace International and European Renewable Energy Council, Energy Revolution: A Sustainable<br />
Energy Outlook (January 2007), p 44.<br />
11 M. I. H<strong>of</strong>fert et. al., “Energy Implications <strong>of</strong> Future Atmospheric Stabilization <strong>of</strong> CO2 Content,”<br />
Nature 395 (1998): 881-884. Available online at:<br />
www.nature.com/nature/journal/v395/n6705/pdf/395881a0.pdf<br />
12 Ibid.<br />
13 “Table 1.2 Energy Production by Primary Energy Source, 1949-2006,” U.S. Department <strong>of</strong> Energy.<br />
Available online at: www.eia.doe.gov/emeu/aer/pdf/pages/sec1_7.pdf.<br />
14 Energy In<strong>for</strong>mation Administration (EIA). International Energy Outlook 2007. Available online at:<br />
http://www.eia.doe.gov/oiaf/ieo/index.html<br />
15 International Energy Agency (IEA). World Energy Outlook 2007: China and India Insights.<br />
16 Parry, Ian and Joel Dramstadter, “The Cost <strong>of</strong> US Oil Dependency,” <strong>National</strong> Commission on Energy<br />
Policy: Washington, DC (November 17, 2004).<br />
17 Recent examples include China’s relationship with oil rich countries like Sudan and Iran and Russia’s<br />
leverage <strong>of</strong> its natural gas supply to Europe.<br />
18 For example, see a summary publication, H. Peyton Young, “Innovation Diffusion in Heterogeneous<br />
Populations: Contagion, Social Influence, and Social Learning,” (working paper, Santa Fe Institute,<br />
2007). Available online at: http://www.santafe.edu/research/publications/workingpapers/07-09-038.pdf<br />
19 See, Paul A. David , “Zvi Griliches on Diffusion, Lags and Productivity Growth …Connecting <strong>the</strong><br />
Dots,” (working paper, Stan<strong>for</strong>d University, 2003). Available online at http://wwwecon.stan<strong>for</strong>d.edu/faculty/workp/swp04002.pdf.<br />
20 Mansfield, E., “Academic research and industrial innovation,” Research Policy 20 (1991): 1-12; and E.<br />
Mansfield, “Academic research and industrial innovation: An update <strong>of</strong> Empirical Findings,” Research<br />
Policy 26 (1998): 773-776.<br />
21 Agarwal, Rajshree and Barry L. Bayus, Management Science, 48:8 (August 2002): 1024-1041.<br />
22 See <strong>for</strong> example, D.B. Elliott, et al, “Methodological Framework <strong>for</strong> Analysis <strong>of</strong> Buildings-Related<br />
Programs: The GPRA Metrics Ef<strong>for</strong>t,” PNNL -14697, Pacific Northwest <strong>National</strong> Laboratory,<br />
Richland, WA (2004).<br />
23 Bennet, C., “Risk and Opportunity in <strong>the</strong> Ga<strong>the</strong>ring Climate Change Storm”, The Conference Board<br />
(2007); and J. Busby, “Climate Change and <strong>National</strong> Security” Council on Foreign Relations<br />
(November 2007).<br />
24 See <strong>for</strong> example, <strong>the</strong> “The Hard Truths”; <strong>National</strong> Petroleum Council, 2007.<br />
25 The IEA 2007 <strong>for</strong>ecast highlights <strong>the</strong> growth <strong>of</strong> India and China economically and in relation to <strong>the</strong><br />
energy economy. See http://www.worldenergyoutlook.org/2007.asp.<br />
26 Verrastro F., (Center <strong>for</strong> Strategic and International Studies), Testimony be<strong>for</strong>e <strong>the</strong> Committee on<br />
Energy and Natural Resources, United States Senate, “Comments and Observations on <strong>the</strong> Topic <strong>of</strong><br />
U.S. Energy Independence” (March 7, 2006).<br />
167
27 Coal Power database, U.S. Department <strong>of</strong> Energy, <strong>National</strong> Energy Technology Laboratory. Available<br />
online at: http://www.netl.doe.gov/energy-analyses/technology.html.<br />
28 Coal Power database, U.S. Department <strong>of</strong> Energy, <strong>National</strong> Energy Technology Laboratory. Available<br />
online at: http://www.netl.doe.gov/energy-analyses/technology.html.<br />
29 The Stern Review reports that effective global mitigation, focused on strong actions in <strong>the</strong> next 10-20<br />
years will cost 5x-20x less in terms <strong>of</strong> global GDP impacts than latter actions <strong>of</strong> mitigation and<br />
adaptation. See, Nicholas Stern, Stern Review: The economics <strong>of</strong> climate change, HM Treasury,<br />
Cambridge University Press: Cambridge. Available online at: http://www.hmtreasury.gov.uk/independent_reviews/stern_review_economics_climate_change/stern_review_report.cf<br />
m.<br />
30 Cory, K.S. and B.G. Swezey, “Renewable Portfolio Standards in <strong>the</strong> States: Balancing Goals and<br />
Rules,” Electricity Journal 40:4 (May 2007): 21-32.<br />
31 Union <strong>of</strong> Concerned Scientists, “Analysis <strong>of</strong> a 20% <strong>National</strong> Renewable Portfolio Standard,” (2004).<br />
Updated October 2007 <strong>for</strong> a 15% <strong>National</strong> Standard.<br />
32 EIA has also analyzed proposed national RPS legislation. See<br />
http://www.eia.doe.gov/oiaf/servicerpt/rps2/methodology.html.<br />
33 Logan, Jeffrey and John Venezia, “Weighing U.S. Energy Options: The WRI Bubble Chart,” World<br />
Resources Institute, WRI Policy Note (July 2007), pg. 3. Available online at:<br />
http://pdf.wri.org/weighing_energy_options.pdf.<br />
34 Mansfield, E., “Academic research and industrial innovation,” Research Policy 20 (1991): 1-12; and E.<br />
Mansfield, “Academic research and industrial innovation: An update <strong>of</strong> Empirical Findings,” Research<br />
Policy 26 (1998) 773-776.<br />
35 Gellman Associates “Indicators <strong>of</strong> International Trends in Technology Innovation” report to <strong>the</strong><br />
<strong>National</strong> Science Foundation, 1976.<br />
36 Agarwal R. and B. Bayus, “The Market Evolution and Sales Take-Off <strong>of</strong> Product Innovations,”<br />
(working paper, University <strong>of</strong> Illinois at Urbana, 2002).<br />
37 Giscard d’Estaing, V., The Second World Almanac Book <strong>of</strong> Inventions, Pharos Books: New York<br />
(1986).<br />
38 Kohli, R., D. Lehmann, and J. Pae, “Extend and Impact <strong>of</strong> Incubation Time in New Product Diffusion,”<br />
J. Product Innovation Mgmt, 16:2 (1999): 123-144; and references <strong>the</strong>rein.<br />
39 Agarwal R. and B. Bayus, “The Market Evolution and Sales Take-Off <strong>of</strong> Product Innovations,”<br />
(working paper, University <strong>of</strong> Illinois at Urbana, 2002).<br />
40 Margolis, R. and D.M. Kammen, “Energy R&D and Innovation: Challenges and Opportunities” in<br />
Schneider, S.A Rosencranz, and J. Nices, (ed.), A Reader in Climate Change Policy, Island Press:<br />
Washington D.C. (2001).<br />
41 Margolis R. and D.M. Kammen, “Underinvestment: <strong>the</strong> energy technology and R&D policy challenge,”<br />
Science 285 (1999): 690-692.<br />
42 Grubler, A., N. Nakicenovic, and D. Victor, “Dynamics <strong>of</strong> energy technologies and global change,”<br />
Energy Policy 27 (1999) 247-280; and Grubler, A., “Time <strong>for</strong> a Change: On <strong>the</strong> Patterns <strong>of</strong> Diffusion<br />
and Innovation,” in Technological Trajectories and The Human Environment, <strong>National</strong> Academies<br />
Press, (1997).<br />
43 Grubler, A., N. Nakicenovic, and D. Victor, “Dynamics <strong>of</strong> energy technologies and global change,”<br />
Energy Policy 27 (1999) 247-280; and Grubler, A., “Time <strong>for</strong> a Change: On <strong>the</strong> Patterns <strong>of</strong> Diffusion<br />
and Innovation,” in Technological Trajectories and The Human Environment, <strong>National</strong> Academies<br />
Press, (1997).<br />
44 See, Timothy J. Foxon, “Technological lock-in and <strong>the</strong> role <strong>of</strong> innovation,” Imperial College, London,<br />
(2005). Avaialable online at: http://www.hm-treasury.gov.uk/media/C/0/climatechange_imp_3.pdf.<br />
45 Arthur, W. Brian, “Competing Technologies, Increasing Returns, and Lock-In By Historical Events,”<br />
The Economic Journal 99 (1989): 116-131.<br />
168
46 Jamasb, Tooraj, “Technical Change Theory and Learning Curves: Patterns <strong>of</strong> Progress in Energy<br />
Technologies,” University <strong>of</strong> Cambridge (March 2006). Available online at:<br />
http://www.dspace.cam.ac.uk/bitstream/1810/131682/1/eprg0608.pdf.<br />
47 See, <strong>for</strong> example, G.F. Nemet, “Policy and innovation in low-carbon energy technologies,” in Energy<br />
and Resources Group, University <strong>of</strong> Cali<strong>for</strong>nia: Berkeley, CA (2007).<br />
169
2.5. Food<br />
2.5.A.<br />
World Food Availability and <strong>the</strong> Natural Land Resources Base<br />
(Jeffrey Steiner, Timothy Griffin)<br />
Authors and Organizations: Jeffrey Steiner, Organization: Agricultural Research Service, United<br />
States Department <strong>of</strong> Agriculture; Timothy Griffin, Tufts University<br />
Contact In<strong>for</strong>mation: jeffrey.steiner@osec.usda.gov<br />
As long as people have lived, utilized <strong>the</strong> Earth’s natural resources, and created industry, social,<br />
economic and cultural systems have evolved and will continue to change as <strong>the</strong> world becomes<br />
more populated, urban, and interconnected and as people continue to derive <strong>the</strong>ir livelihood from<br />
<strong>the</strong> planet’s resources. There<strong>for</strong>e, as we discuss how future world population projections are<br />
related to food needs, we need also need to consider how changing population and changing<br />
wealth patterns will not only impact food availability and consumption patterns, but also our<br />
inter-related needs <strong>for</strong> energy and water. We also must recognize that <strong>the</strong> Earth’s land area is<br />
finite, so increasing population and migration to cities will result in (1) more rural land area to be<br />
taken out <strong>of</strong> agricultural production around population centers and (2) <strong>the</strong> continued loss <strong>of</strong> vital<br />
ecosystem services that include <strong>the</strong> provision <strong>of</strong> clean water, air, wildlife habitat, aes<strong>the</strong>tic<br />
landscapes, and maintenance <strong>of</strong> biodiversity.<br />
The dependable availability food and natural resources will most certainly be affected by <strong>the</strong><br />
uncertainties <strong>of</strong> climate change. Decreased agricultural output resulting from shifts in<br />
precipitation and increased temperatures has <strong>the</strong> potential to negatively impact not only food<br />
availability in developing countries whose populations already live close to subsistence levels<br />
and depend on a greater portion <strong>of</strong> <strong>the</strong>ir national income from agriculture and whose citizens, 1<br />
but also industrialized countries who are planning on replacing non-renewable energy and o<strong>the</strong>r<br />
consumer products with bio-based analogs produced from <strong>the</strong> land.<br />
In addition to meeting nutritive needs, food is also a significant trade good <strong>for</strong> most nations, so<br />
<strong>the</strong> pr<strong>of</strong>itable production, processing, and marketing <strong>of</strong> food will depend on <strong>the</strong> ready<br />
availability and quality <strong>of</strong> natural resources at all scales, from farm to global. The significance <strong>of</strong><br />
this is that agriculture is not only <strong>the</strong> basis <strong>of</strong> income to producers and rural communities, but<br />
from <strong>the</strong> farm through <strong>the</strong> rest <strong>of</strong> <strong>the</strong> food chain, 17% <strong>of</strong> <strong>the</strong> jobs in <strong>the</strong> U.S. work<strong>for</strong>ce are<br />
provided by industries supported by agricultural production.<br />
It is estimated that 83% <strong>of</strong> <strong>the</strong> present earth’s surface already has marks <strong>of</strong> human influence, 2<br />
and we can expect a continual shrinking <strong>of</strong> <strong>the</strong> land resources base.<br />
This paper discusses (1) <strong>the</strong> likely trends in food consumption, food accessibility, and food<br />
prices, (2) <strong>the</strong> potential destabilizing effects <strong>of</strong> <strong>the</strong>se trends on people in developed and<br />
developing economies, and (3) a discussion <strong>of</strong> how <strong>the</strong> present and future capacity <strong>of</strong> <strong>the</strong> land<br />
and <strong>the</strong> natural resources base can be used to meet <strong>the</strong> needs <strong>of</strong> people around <strong>the</strong> world <strong>for</strong><br />
abundant, af<strong>for</strong>dable, and safe foods.<br />
Projected Consumption Trends<br />
The predicted trends <strong>for</strong> food consumption are based on <strong>the</strong> compounded effects <strong>of</strong> continued<br />
increasing population and changes in dietary patterns due to economic growth, particularly in <strong>the</strong><br />
170
developing world. 3 The United Nations projections indicate that <strong>the</strong> population <strong>of</strong> <strong>the</strong> developed<br />
world will likely remain about constant at 1.25 billion through 2050. 4 This is in stark contrast to<br />
<strong>the</strong> predicted developing and transitioning world population, which is expected to grow from 5.6<br />
to 7.9 billion people. Much <strong>of</strong> this growth will take place in already populous and food insecure<br />
areas, especially in Asia and Africa, which toge<strong>the</strong>r could contain 75–80% <strong>of</strong> world population.<br />
Food insecurity is defined as <strong>the</strong> gap in distribution <strong>of</strong> food so that <strong>the</strong> average consumption by<br />
people <strong>of</strong> a population is less than 2,100 calories per person per day. It is estimated that in 2009<br />
<strong>the</strong>re are 833-million food-insecure people worldwide. 5<br />
There will also be a significant shift in demographics during <strong>the</strong> 2010-2050 period due to<br />
projected declines in birth rate in <strong>the</strong> developing world, with <strong>the</strong> most rapidly growing age cohort<br />
being those over 60 years. There will be a continued movement <strong>of</strong> people from rural to urban<br />
areas, with emigration from <strong>the</strong> developing to <strong>the</strong> developed world that contribute to a significant<br />
global population flux.<br />
Income growth and <strong>the</strong> resulting changes in food consumption patterns are significant elements<br />
<strong>of</strong> shifts in global food demand and agricultural trade. Real average per capita income grew by<br />
nearly 100 percent <strong>for</strong> most countries from 1960 to 2000. For low-income countries, per capita<br />
income in 1998 was just over US$500, compared to US$28,000 <strong>for</strong> high-income nations. Income<br />
growth from 1961 to 1998 <strong>for</strong> developing countries was 221%, and it surpassed 173% growth <strong>for</strong><br />
income in developed countries. Such great gains <strong>for</strong> developing countries have resulted in<br />
significant changes in <strong>the</strong> kinds <strong>of</strong> foods consumed, particularly <strong>for</strong> higher income developing<br />
countries. 6 Substantial economic growth in developing countries has translated into a more rapid<br />
increase in <strong>the</strong> rate <strong>of</strong> global energy use than relative population growth. 7 Be<strong>for</strong>e consumers gain<br />
<strong>the</strong> ability to purchase cars and transportation fuels, <strong>the</strong>y achieve <strong>the</strong> ability to af<strong>for</strong>d more food<br />
and also different kinds <strong>of</strong> food. There<strong>for</strong>e, increased world demand <strong>for</strong> cereals is projected to be<br />
40% by 2020, and meat demand is projected to double by 2050.As populations become<br />
increasingly urbanized and as per capita income grows, particularly in countries like China and<br />
India, dietary patterns are expected to change markedly in <strong>the</strong> coming decades, with concomitant<br />
changes not only in <strong>the</strong> types <strong>of</strong> food consumed, but also in <strong>the</strong> supply chain infrastructure<br />
needed to meet demand. The implications <strong>for</strong> <strong>the</strong>se changes in Asia are that diets will continue to<br />
become more similar to Western diets, meaning <strong>the</strong> use <strong>of</strong> more processed food products that<br />
have greater energy density. 8 Of particular note is <strong>the</strong> projected increase in <strong>the</strong> consumption <strong>of</strong><br />
meat and dairy products, and fish, 9 as this will represent both a diversion <strong>of</strong> grains from human<br />
consumption to <strong>the</strong>ir use as animal feeds, and <strong>the</strong> associated changes in land use patterns in<br />
many regions to accommodate that change in kind <strong>of</strong> agricultural products produced. The<br />
globalization <strong>of</strong> <strong>the</strong> food production and distribution system will result in increasing similarity,<br />
or convergence, <strong>of</strong> developed and developing countries’ food system characteristics. 10 As a<br />
result, <strong>the</strong> food marketing system will need to adjust to greater concentrations <strong>of</strong> people in urban<br />
areas, along transportation routes, and to coastal regions, 11 and <strong>the</strong>re will be need to develop<br />
strategies that adjust to <strong>the</strong> variability in <strong>the</strong> size and growth rate <strong>of</strong> different populations. 12<br />
In <strong>the</strong> United States, 50% <strong>of</strong> <strong>the</strong> population lives in coastal areas, and <strong>for</strong> every person added to<br />
<strong>the</strong> population, 1.7 acres <strong>of</strong> rural land are developed. As pointed out earlier, with continued<br />
population growth, demands from land and natural resources are expected to increase. Such<br />
demand will grow increasingly greater as <strong>the</strong>re is a shift away from <strong>the</strong> use <strong>of</strong> non-renewable<br />
resources <strong>for</strong> <strong>the</strong> production <strong>of</strong> fuels and o<strong>the</strong>r consumer products, as well as o<strong>the</strong>r bio-based<br />
consumer products that originate from agricultural production. Just as significant, our rural lands<br />
171
also are <strong>the</strong> source <strong>of</strong> clean air, water, and o<strong>the</strong>r ecosystem services upon which all <strong>of</strong> our society<br />
depends. Because <strong>of</strong> rising production costs, some sectors <strong>of</strong> <strong>the</strong> agricultural economy have<br />
experienced significant demographic shifts. Production <strong>of</strong> many crops that require human labor<br />
<strong>for</strong> cultivation and harvest has moved to developing countries where less expensive labor is<br />
abundant and where transportation fuel costs are low so that distant markets can be accessed<br />
af<strong>for</strong>dably.<br />
Hunger and Food Access<br />
The first Millennium Development Goal is to “eradicate extreme hunger and poverty” by 2015. 13<br />
However, food security is projected to deteriorate over <strong>the</strong> next decade. 14 There has been<br />
significant progress in a number <strong>of</strong> regions, but advances have been slower than anticipated, and<br />
<strong>the</strong> current economic crisis has in some cases reversed previous gains. As discussed by FAO,<br />
gains have been made in Asia, <strong>the</strong> Pacific, and Latin America, while hunger has increased in<br />
Sub-Saharan Africa. 15 In many areas, particularly in rural ones, hunger and poverty coincide. In<br />
<strong>the</strong>se situations, agricultural productivity is a key driver <strong>for</strong> poverty alleviation, and rural and<br />
agricultural developments are critical <strong>for</strong> long-term stability. However, solutions to enhance<br />
agricultural productivity must be combined concurrently with solutions to address broader public<br />
health, education, and infrastructure development challenges. 16<br />
Rapid increase in food prices from 2006-2008 were larger in magnitude, but not unlike major<br />
increases in 1971 to 1974 and 1994 to 1996. These price surges were <strong>the</strong> results <strong>of</strong> a combination<br />
<strong>of</strong> factors that include <strong>the</strong> depreciation <strong>of</strong> <strong>the</strong> U.S. dollar, strong worldwide demand <strong>for</strong><br />
agricultural products (including most recently <strong>for</strong> bi<strong>of</strong>uels), supply shocks, and policy responses<br />
by major trading partners. 17 Such “price shocks” not only reduced <strong>the</strong> ability <strong>of</strong> food-insecure<br />
people to buy food, but <strong>the</strong>y also made international provision <strong>of</strong> food aid more expensive. 18 The<br />
recent rapid escalation in food prices led to protests, some <strong>of</strong> which were not limited to lowincome<br />
countries. A decrease in export earnings and capital receipts could increase <strong>the</strong> number<br />
<strong>of</strong> food-insecure people worldwide by 100 million. 19<br />
Biophysical Limitations to Increased Food Availability<br />
There is general agreement that by 2050, <strong>the</strong> world will have nine billion people. The Earth’s<br />
arable land area is finite, so as we move away from using non-renewable resources, more will be<br />
expected from our working lands not only to produce food, feed, and fiber, but also to provide<br />
<strong>the</strong> raw materials needed <strong>for</strong> <strong>the</strong> production <strong>of</strong> a wide array <strong>of</strong> biobased consumer products,<br />
including fuels and energy.<br />
Eleven percent <strong>of</strong> <strong>the</strong> globe's land surface (1.5 billion hectares [ha]) is used in crop production.<br />
This area represents 36 percent <strong>of</strong> <strong>the</strong> land estimated to be to some degree suitable <strong>for</strong> crop<br />
production. The fact that <strong>the</strong>re remains some 2.7 billion ha with crop production potential<br />
suggests that <strong>the</strong>re is still land available <strong>for</strong> fur<strong>the</strong>r expansion <strong>of</strong> agriculture. 20 In <strong>the</strong> developed<br />
world, <strong>the</strong>re are few constraints to agricultural production on existing land areas, but large<br />
expansion <strong>of</strong> currently cultivated areas is unlikely due to environmental concerns and limitations<br />
to extending use <strong>of</strong> water resources <strong>for</strong> irrigation to supplement natural net primary productivity.<br />
In developing countries, <strong>the</strong> United Nations estimates that enough food could be produced if 79<br />
percent <strong>of</strong> <strong>the</strong> need were met through increased yields by use <strong>of</strong> intensified cropping practices,<br />
with <strong>the</strong> remaining 21 percent <strong>of</strong> need met through expansion <strong>of</strong> <strong>the</strong> land area under cultivation.<br />
This would represent a net increase from 848 million ha in 2000 to 1076 million ha in 2030, not<br />
accounting <strong>for</strong> land losses due to soil degradation, urbanization, and land conversion to industrial<br />
172
use. 21<br />
In developed countries, overall agricultural production has increased, but <strong>for</strong> commodity crops<br />
like maize and soybean, intensified production over <strong>the</strong> last 60 years has only resulted in<br />
essentially linear crop yield increases. For example, U.S. maize yields increased 3.3% per year,<br />
and soybean yields increased 1.8% per year 22 . The trends <strong>for</strong> agricultural productivity in<br />
developing countries have not been as encouraging as developed countries. Global cereal<br />
production per capita has slowed since 1984 due to long-term productivity declines in sub-<br />
Saharan Africa, as well as more recent declines in North America, Europe, Oceania, and <strong>the</strong><br />
<strong>for</strong>mer Soviet Union, even with <strong>the</strong> steady increase in yields that have been achieved in Asia. 23<br />
In parts <strong>of</strong> <strong>the</strong> developing world, <strong>the</strong> greatest increases in crop productivity took place 25 to 40<br />
years ago as <strong>the</strong> Green Revolution was implemented. 24 Since that time, yield increases have<br />
stagnated due to (1) reduced use <strong>of</strong> inputs and o<strong>the</strong>r technologies that could boost yields, (2) low<br />
cereal prices, (3) market and infrastructure constraints, and (4) low levels <strong>of</strong> investment in<br />
agricultural research and technology. 25<br />
The capacity <strong>of</strong> land to produce food, fiber, and fuels varies by place due to natural biophysical<br />
limitations to <strong>the</strong> amounts <strong>of</strong> natural carbon that can be converted into plant material by<br />
photosyn<strong>the</strong>sis. 26 Production can be intensified through practices that boost productivity, but at<br />
<strong>the</strong> cost <strong>of</strong> import <strong>of</strong> resources from outside <strong>the</strong> natural production system, and also at <strong>the</strong><br />
expense <strong>of</strong> additional cost and energy. Production potential can also be decreased by poor soil<br />
resource management such as cultivation that leads to erosion, improper irrigation that leads to<br />
salt accumulation, or removal <strong>of</strong> harvested material without replacement <strong>of</strong> nutrients. Such lost<br />
potential is typically localized. For example, average soil degradation does not threaten food<br />
security at <strong>the</strong> global level, 27 but it is a serious limiter <strong>of</strong> productivity in regions such as sub-<br />
Saharan Africa.<br />
Global food production has grown faster than population in recent decades. 28 Per capita global<br />
availability <strong>of</strong> meat, fruits, and vegetables increased by more than 60% between 1961 and 1998,<br />
while <strong>the</strong> supply <strong>of</strong> roots and tubers decreased by 21%. World cereal supply also increased by<br />
almost 17% during <strong>the</strong> same period. 29 For example, <strong>the</strong> FAO aggregate crop production index<br />
grew at an annual rate <strong>of</strong> 2.3% from 1961 to 1999, and crop production per capita has increased<br />
0.6% per year in all regions but Africa.<br />
All facets <strong>of</strong> food production will be impacted by climate change. Although climate change<br />
represents a significant source <strong>of</strong> uncertainty in this regard, <strong>the</strong>re is general consensus that <strong>the</strong><br />
negative impacts will be borne disproportionally in those regions where food insecurity and<br />
hunger are most problematic. This can be attributed not only to <strong>the</strong> geographic distribution <strong>of</strong><br />
direct climate change impacts brought about by changes in temperature and precipitation, but<br />
also on <strong>the</strong> lack <strong>of</strong> resources that farmers in <strong>the</strong>se areas can use to adapt to climate change. 30 The<br />
increased variability in climate and <strong>the</strong> increased incidence and severity <strong>of</strong> extreme wea<strong>the</strong>r<br />
events impacts not only production <strong>of</strong> food, but also food availability, food safety, and overall<br />
food security. 31<br />
Given that <strong>the</strong>re is a finite land base to work with to increase total world food output to meet<br />
global foods demands by <strong>the</strong> middle <strong>of</strong> this century, total dependence on bringing large tracks <strong>of</strong><br />
<strong>the</strong> natural land base into agricultural production, as well as urban development, is not an<br />
entirely viable option. Adequate provision <strong>of</strong> ecosystem services, including sourcing <strong>of</strong> clean<br />
water and air, <strong>the</strong> sequestration <strong>of</strong> soil carbon, and <strong>the</strong> maintenance <strong>of</strong> natural habitats to<br />
173
preserve critical wildlife habitats and biodiversity are critical and must be managed along with<br />
agricultural production. There<strong>for</strong>e, <strong>the</strong> preferred strategy is to intensify <strong>the</strong> amounts <strong>of</strong><br />
agricultural products produced per unit <strong>of</strong> area.<br />
Viable strategies <strong>for</strong> intensifying production efficiency include <strong>the</strong> use <strong>of</strong> improved management<br />
practices such as <strong>the</strong> incorporation <strong>of</strong> new technologies, <strong>the</strong> use <strong>of</strong> soil amendments to increase<br />
soil water and nutrient availability <strong>for</strong> crop growth, and utilization <strong>of</strong> improved or adapted<br />
varieties. There is significant interest in using agro-ecological methods to meet <strong>the</strong>se needs 32 and<br />
to reduce <strong>the</strong> need <strong>for</strong> purchased inputs. However, any technologies that help producers and<br />
nations adjust to increased risks due to extreme wea<strong>the</strong>r associated with <strong>the</strong> effects <strong>of</strong> climate<br />
will be needed. A systems approach will be required because <strong>the</strong> reliance <strong>of</strong> any one technology<br />
to overcome limitations to productivity will likely not produce resilient results and analyses <strong>of</strong><br />
past successes do not demonstrate a single responsible factor.<br />
Analyses <strong>of</strong> <strong>the</strong> sources <strong>of</strong> corn yield gains in one American state over <strong>the</strong> past 50 years showed<br />
that about half <strong>of</strong> <strong>the</strong> increase was due to <strong>the</strong> use <strong>of</strong> improved genetic materials, particularly<br />
hybrid varieties, while <strong>the</strong> o<strong>the</strong>r half were due to <strong>the</strong> use <strong>of</strong> intensified cultural practices,<br />
including <strong>the</strong> use <strong>of</strong> fertilizers, pesticides, and irrigation. 33 With more recent advances in <strong>the</strong><br />
introduction <strong>of</strong> biotechnology varieties (specifically corn, soybean, and cotton), <strong>the</strong> greatest<br />
gains have been in terms <strong>of</strong> increased production efficiency as a result <strong>of</strong> reduced energy use,<br />
where conservation tillage methods have been employed, along with lowered annual soil erosion<br />
rates. To date, some genetically improved crop varieties that utilize biotechnology have been<br />
developed in conjunction with <strong>the</strong> need <strong>for</strong> <strong>the</strong> use <strong>of</strong> ano<strong>the</strong>r purchased input such as herbicides.<br />
Also, new challenges have emerged due to over-reliance on single technologies such as crop<br />
herbicide resistance, with <strong>the</strong> development <strong>of</strong> herbicide tolerant weed populations that require<br />
additional management inputs or greater management skill to control.<br />
The utilization <strong>of</strong> biotechnology can positively impact both productivity 34 and economic return, 35<br />
but <strong>the</strong>ir adoption continues to face significant cultural and trade policy obstacles in many<br />
countries. Results demonstrating <strong>the</strong> potential <strong>for</strong> biotechnology to moderate plant response to<br />
abiotic stresses like drought 36 and salinity 37 are promising in concept, but <strong>the</strong>y may be more<br />
easily achieved through conventional breeding methods. As indicated above, crop improvement<br />
and <strong>the</strong> response to a variety <strong>of</strong> inputs have contributed to past yield increases. Farmers who do<br />
not have access to <strong>the</strong>se inputs are unlikely to experience potential significant increases in<br />
productivity by <strong>the</strong> use <strong>of</strong> advanced genetic materials unless soil productivity is improved and<br />
agricultural inputs are available. Biotechnologies implemented in agriculture have primarily been<br />
to incorporate herbicide and insect resistance into corn, soybean, and cotton. Many believe that<br />
<strong>the</strong> potential yields <strong>of</strong> crops have not been increased, but ra<strong>the</strong>r a greater portion <strong>of</strong> <strong>the</strong> existing<br />
potential yield has been exploited. 38 There<strong>for</strong>e, <strong>the</strong> use <strong>of</strong> a multiple input management approach<br />
has been cited as a strategy that could achieve significant improvement in food production. 39<br />
Presently, <strong>the</strong> greatest net primary productivity potential <strong>for</strong> agriculture is in <strong>the</strong> tropics, where<br />
agricultural development has been <strong>the</strong> least effective. The adoption <strong>of</strong> improved crop varieties in<br />
sub-Saharan Africa has resulted in far less yield increases than o<strong>the</strong>r developing regions. 40<br />
However, when agricultural development across this region expands, <strong>the</strong>re will be significantly<br />
greater demand <strong>for</strong> inputs such as improved varieties and soil amendments such as fertilizers.<br />
Greater such demand <strong>for</strong> fertilizers could present a significant challenge to agricultural<br />
production in developed countries that presently utilize great amounts <strong>of</strong> imported fertilizers. For<br />
example, more than 52% <strong>of</strong> nitrogen and 85% <strong>of</strong> potassium used in <strong>the</strong> U.S. was imported in<br />
174
2007. U.S. domestic production capacity <strong>of</strong> fertilizers is limited, so any increases in demand will<br />
need to be met by greater imports. 41 From 2000-2006, U.S. ammonia production declined 44%,<br />
while imports increased 115%. U.S.-produced ammonia dropped in <strong>the</strong> domestic aggregate<br />
supply from 80 to 55%, with imports increasing from 15 to 42%. Natural gas is used as <strong>the</strong><br />
energy input to turn atmospheric dinitrogen gas (N 2 ) gas into ammonia, so as a result <strong>of</strong><br />
increased natural gas costs between 2000 and 2006, <strong>the</strong> price farmers paid <strong>for</strong> ammonia<br />
increased from $227 to $521 per ton, a 130% increase. 42<br />
Strategic Considerations<br />
<br />
<br />
<br />
<br />
<br />
Agricultural productivity must be a central component <strong>of</strong> strategies to relieve food<br />
insecurity. Continual progress is needed in identifying regions and populations that<br />
experience chronic food insecurity, and implementation strategies and practices that<br />
ameliorate insecurity that impacts regional populations as described in <strong>the</strong> Millenium<br />
Development Goals and o<strong>the</strong>r initiatives,<br />
Foresight is needed to prepare <strong>for</strong> and make adjustments to <strong>the</strong> shifting demographic<br />
structure that is expected in many regions, and that are complicated by concomitant shifts<br />
in food consumption patterns and demands brought on by population growth and<br />
migration.<br />
Degradation <strong>of</strong> natural resources, most significantly soils (loss as impacted by water and<br />
wind erosion and loss <strong>of</strong> soil carbon that reduces productivity) and water (quality,<br />
quantity, and access) limits <strong>the</strong> capacity <strong>for</strong> agricultural productivity improvement<br />
responses to natural biophysical conditions that are o<strong>the</strong>rwise favorable and to improved<br />
management and use <strong>of</strong> inputs. In resource-poor and food insecure regions, this can<br />
contribute to cultural and political instability.<br />
Investment in research focused on practices and systems that increase output while<br />
mitigating negative environmental impacts is needed in both industrialized and developed<br />
countries. This should include an assessment <strong>of</strong> <strong>the</strong> appropriateness <strong>of</strong> emerging<br />
technologies, along with application <strong>of</strong> agro ecological principles <strong>for</strong> all systems. A<br />
whole-systems approach is needed that not only focuses on <strong>the</strong> short-term productivity <strong>of</strong><br />
systems, but how all aspects <strong>of</strong> commerce are affected throughout <strong>the</strong> entire supply chain,<br />
now and in <strong>the</strong> future.<br />
The potential impacts <strong>of</strong> global climate change on regional food systems threatens to be a<br />
tremendous destabilizing <strong>for</strong>ce globally, particularly because <strong>of</strong> <strong>the</strong> disproportionate<br />
impact on populations that are ill-equipped to adapt to <strong>the</strong>se changes.<br />
↑ Back to <strong>the</strong> top<br />
1 <strong>National</strong> Intelligence Council (2008). Global Trends 2025: “A trans<strong>for</strong>med world.” Superintendent <strong>of</strong><br />
Documents, US Government Printing Office. November.<br />
2 Sanderson, E.W., M.J. Jaiteh, M.A. Levy, K.H. Red<strong>for</strong>d, A.V. Wannebo, and G. Woolmer (2002). “The<br />
human footprint and <strong>the</strong> last <strong>of</strong> <strong>the</strong> wild.” BioScience 52:891-904.<br />
175
3 von Braun, J. (2007). “The world food situation: new driving <strong>for</strong>ces and required actions.” International<br />
Food Policy Research Institute. DOI: 10.2499/0896295303<br />
4 “World Population Prospects: The 2008 Revision, Highlights.” United Nations, Department <strong>of</strong><br />
Economic and Social Affairs, Population Division (2009). Working Paper No. ESA/P/WP.210.<br />
5 Shapouri, S., S. Rosen, B. Meade, F. Gale (2009). “Food security assessment, 2008-09.” GFA-20.<br />
Economic Research Service, USDA.<br />
6 Regmi, A., and M. Gehlhar. 2001. “Forces shaping global food demand and agricultural trade.”<br />
Agricultural Outlook, May. Economic Research Service, USDA.<br />
7 “World energy and economic outlook” (2007) Energy In<strong>for</strong>mation Administration. DOE/EIA-0480.<br />
Office <strong>of</strong> Integrated Analysis and Forecasting, U.S. Department <strong>of</strong> Energy, Washington, DC.<br />
8 Pingali, P. (2006). “Westernization <strong>of</strong> Asian diets and <strong>the</strong> trans<strong>for</strong>mation <strong>of</strong> food systems: Implications<br />
<strong>for</strong> research and policy.” Food Policy 32:281-298.<br />
9 “The state <strong>of</strong> food and agriculture in Asia and <strong>the</strong> Pacific Region” (2008). RAP Publication 2008/03.<br />
United Nations, Food and Agriculture Organization (FAO).<br />
10 Regmi, A., H. Takeshima, and L. Unnevahr. (2008). “Convergence in global food demand and<br />
delivery,” USDA-ERS , Economic Research Report #56.<br />
11 <strong>National</strong> Intelligence Council (2008). “Global Trends 2025: A trans<strong>for</strong>med world.” Superintendent <strong>of</strong><br />
Documents, U.S. Government Printing Office. November.<br />
12 Coyle, W., B. Gilmour, and W.J. Armbruster. 2004. “Where will demographics take <strong>the</strong> Asia-Pacific<br />
food system?” Amber Waves, June. Economic Research Service, USDA.<br />
13 For a summary <strong>of</strong> <strong>the</strong> MDGs and associated targets related to hunger, see<br />
http://www.un.org/millenniumgoals/poverty.shtml verified: 12 August 2009.<br />
14 Shapouri, S., S. Rosen, B. Meade, F. Gale (2009). “Food security assessment, 2008-09.” GFA-20.<br />
Economic Research Service, USDA.<br />
15 United Nations, Food and Agriculture Organization. (2007). The state <strong>of</strong> food insecurity in <strong>the</strong> world<br />
2006: Eradicating world hunger - taking stock ten years after <strong>the</strong> World Food Summit. Sub-Saharan<br />
Africa contains 13% <strong>of</strong> <strong>the</strong> global population, but 25% <strong>of</strong> <strong>the</strong> undernourished and 33% <strong>of</strong> <strong>the</strong><br />
chronically hungry. The situation is particularly recalcitrant in areas were per capita food consumption<br />
is less than 2200 kCal/day.<br />
16 Sanchez, P., C. Palm, J. Sachs, G. Denning, R. Flor, R. Harawa, B. Jama, T. Kifflemariam, B.<br />
Konecky, R. Kozar, E. Leleral, A. Malik, V. Modl, P. Mutuo, Am Nlang, H. Okoth, F. Place, S.E.<br />
Sachs, A. Said, D. Siriri, A. Teklehalmanot, K. Wand, J. Wangila, and C. Zamba (2007). “The African<br />
Millennium villages.” Proceeding <strong>National</strong> Academy <strong>of</strong> Sciences 104:16775-16780.<br />
17 Peters, M., S. Langley, P. Westcott (2009). “Agricultural commodity price spikes in <strong>the</strong> 1970s and<br />
1990s, Valuable lessons <strong>for</strong> today.” Amber Waves 7: 16-23. Economic Research Service, USDA.<br />
18 Shapouri, S., and S. Rosen. (2007). “Energy price implications <strong>for</strong> food security in developing<br />
countries.” USDA-Economic Research Service Report GFA-18.<br />
19 Shapouri, S., S. Rosen, B. Meade, F. Gale (2009). “Food security assessment, 2008-09.” GFA-20.<br />
Economic Research Service, USDA.<br />
20 FAO (2003). “World agriculture; Towards 2015/2030, an FAO perspective.”<br />
21 Agriculture and environmental challenges <strong>of</strong> <strong>the</strong> Twenty-First Century: A strategic approach <strong>for</strong> FAO.<br />
(2009). Committee on Agriculture COAG/2009/3. Rome, 22-25 April.<br />
22 Egli, D.B. (2008). “Comparison <strong>of</strong> corn and soybean yields in <strong>the</strong> United States: historical trends and<br />
future prospects.” Agronomy Journal. 100:S79-88.<br />
23 Wiebe, K (2006). “Global resources and productivity.” In K. Wiebe and N. Gollehon (ed.), Agricultural<br />
resources environmental indicators, 2006 edition. Economic In<strong>for</strong>mation Bulletin 16. Economic<br />
Research Service, USDA.<br />
24 See <strong>for</strong> example: Conway, G., and G. Toenniessen. (1999). “Feeding <strong>the</strong> world in <strong>the</strong> 21 st century.”<br />
Nature. 402:C55-C58.<br />
176
25 “World agriculture: towards 2030/2050 interim report – prospects <strong>for</strong> food, nutrition, agriculture, and<br />
major commodity groups.” United Nations Food and Agriculture Organization (FAO). (2006). (See<br />
Figure 3.4 <strong>for</strong> example.)<br />
26 Grieser, J., R. Gommes, S. C<strong>of</strong>ield, and M. Bernardi (2006). “World maps <strong>of</strong> climatological net<br />
primary production <strong>of</strong> biomass, NPP.” Food and Agriculture Organization <strong>of</strong> <strong>the</strong> United Nations,<br />
Climpag. http://www.fao.org/nr/climpag/globgrids/NPP_en.asp verified: 31 August 2009.<br />
27 Wiebe, K (2006). “Global resources and productivity.” In K. Wiebe and N. Gollehon (ed.), Agricultural<br />
resources environmental indicators, 2006 edition. Economic In<strong>for</strong>mation Bulletin 16. Economic<br />
Research Service, USDA.<br />
28 Wiebe, K. (2006). “Global resources and productivity.” In K. Wiebe and N. Gollehon (eds.),<br />
Agricultural Resources and Environmental Indicators, 2006 Edition. Economic In<strong>for</strong>mation Bulletin<br />
16, Economic Research Service, USDA.<br />
29 Regmi, A., and M. Gehlhar. 2001. “Forces shaping global food demand & agricultural trade.”<br />
Agricultural Outlook, May. Economic Research Service, USDA.<br />
30 Parry, M., C. Rosenzweig, and M. Livermore. (2005). “Climate change, global food supply and risk <strong>of</strong><br />
hunger.” Philosophical Transactions <strong>of</strong> <strong>the</strong> Royal Society, B. 360:2125-2138. Projections <strong>for</strong> increased<br />
yield potential in developed countries, but yield reductions <strong>of</strong> 10% are possible in developing countries.<br />
31 Schmidhuber, J., and F.N. Tubiello. (2007). “Global food security under climate change.” Proceedings<br />
<strong>of</strong> <strong>the</strong> <strong>National</strong> Academies <strong>of</strong> Science. 104:19103-19108.<br />
32 The United Nations Food and Agriculture Organization (FAO) convened a conference in 2007 that<br />
addressed organic agriculture and its ability to increase food availability and security. For example, see:<br />
Scialabba, N. (2007). “Organic agriculture and food security.” UN-FAO OFS/2007/05. See also:<br />
http://www.fao.org/organicag.<br />
33 An analysis <strong>of</strong> Minnesota, USA corn yield increases between 1930 and 1979 estimated that genetic<br />
improvements contributed to 58% <strong>of</strong> <strong>the</strong> half-century yield increase, while <strong>the</strong> combined effects <strong>of</strong><br />
improved management from commercial nitrogen fertilizer and herbicide use was 70%. From:<br />
Cardwell, V.B. (1982). “Fifty years <strong>of</strong> Minnesota corn production: sources <strong>of</strong> yield increase,”<br />
Agronomy Journal 74: 984-990.<br />
34 Qaim, M., and D. Zilberman. (2003). “Yield effects <strong>of</strong> genetically modified crops in developing<br />
countries.” Science. 299:900-902.<br />
35 Raney, T. (2006). “Economic impact <strong>of</strong> transgenic crops in developing countries.” Current Opinion in<br />
Biotechnology. 17:174–178.<br />
36 Umezawa, T., M. Fujita , Y. Fujita, K. Yamaguchi-Shinozaki and K. Shinozaki. (2006). “Engineering<br />
drought tolerance in plants: discovering and tailoring genes to unlock <strong>the</strong> future.” Current Opinion in<br />
Biotechnology. 17:113–122.<br />
37 Yamaguchi, T., and E. Blumwald. (2005). “Developing salt-tolerant crop plants: challenges and<br />
opportunities.” Trends in Plant Science. 10: 615-620.<br />
38 Tannura, M., S. Irwin, and D. Good (2008). “Are corn trend yields increasing at a faster rate?”<br />
Marketing and Outlook Brief 08-02, Department <strong>of</strong> Agricultural and Consumer Economics, University<br />
<strong>of</strong> Illinois at Urbana-Champaign, Feb. 20.<br />
39 Shapouri, S., S. Rosen, B. Meade, F. Gale (2009). “Food security assessment,” 2008-09. GFA-20.<br />
Economic Research Service, USDA.<br />
40 Special Panel on Impact Assessment, Contribution Made by <strong>the</strong> CGIAR and Its Partners to Agricultural<br />
Development in sub-Saharan Africa (Consultative Group on International Agricultural Research,<br />
Washington, DC, 2001.<br />
41 Huang, W. 2009. “U.S. fertilizer imports/exports: Summary <strong>of</strong> <strong>the</strong> data findings.” Economic Research<br />
Service, USDA. http://www.ers.usda.gov/Data/FertilizerTrade/Summary.htm verified: 12 August 2009.<br />
42 Huang, W. 2007. “Impact <strong>of</strong> rising natural gas prices on U.S. ammonia supply.” USDA, WRS_0702,<br />
August.<br />
177
2.5.B.<br />
Food Production in Arid Regions as Related to Salinity (Donald Suarez)<br />
Author and Organizatin: Donald Suarez, Salinity Laboratory, Agricultural Research Service, US<br />
Department <strong>of</strong> Agriculture<br />
Contact In<strong>for</strong>mation: Donald.Suarez@ars.usda.gov<br />
Abstract<br />
Arid and semiarid regions <strong>of</strong> <strong>the</strong> world are generally associated with high population density and<br />
lower–than-average per capita incomes and living standards. These regions are vulnerable to<br />
food shortages due to current, unsustainable use <strong>of</strong> fresh water <strong>for</strong> irrigation and increasing soil<br />
salinization. In many countries, current crop production cannot be sustained without adoption <strong>of</strong><br />
new management practices and alternative water supplies. This paper discusses <strong>the</strong> issue <strong>of</strong> water<br />
supply, <strong>the</strong> impact <strong>of</strong> salinity, <strong>the</strong> potential <strong>for</strong> water reuse (both <strong>of</strong> irrigation drainage water and<br />
municipal waste water), <strong>the</strong> utilization <strong>of</strong> saline waters <strong>for</strong> crop production and <strong>the</strong> potential<br />
problems associated with <strong>the</strong> use <strong>of</strong> <strong>the</strong>se alternative waters <strong>for</strong> irrigation.<br />
Introduction<br />
There has been a dramatic increase in total global food production, as well as an increase in food<br />
production on a per-acre basis, over <strong>the</strong> last 50 years. This increase is generally attributed to<br />
improved crop varieties and management practices (green revolution), however at least part <strong>of</strong><br />
this increase is related to an increase in <strong>the</strong> amount <strong>of</strong> irrigated acreage. Irrigated lands have<br />
much higher productivity and economic return per acre as compared to non-irrigated lands. It is<br />
estimated that globally, irrigated lands represent 15% <strong>of</strong> <strong>the</strong> cultivated land, yet <strong>the</strong>y produce<br />
over 30% 1 to 40% 2 <strong>of</strong> <strong>the</strong> world’s food. The 35% increase in irrigated land from 1970 to <strong>the</strong> late<br />
1980s thus provided a significant part <strong>of</strong> <strong>the</strong> increase in world food production, and was a major<br />
factor in avoiding large scale famine.<br />
Since <strong>the</strong> 1980s, <strong>the</strong>re has been a significant decline in <strong>the</strong> rate <strong>of</strong> growth in <strong>the</strong> world’s irrigated<br />
land, with a leveling <strong>of</strong>f <strong>of</strong> <strong>the</strong> total irrigated acreage in <strong>the</strong> first decade <strong>of</strong> this century. The<br />
reason <strong>for</strong> <strong>the</strong> leveling is due partially to <strong>the</strong> limitations <strong>of</strong> suitable land, but more importantly it<br />
is due to <strong>the</strong> lack <strong>of</strong> new developable water supplies in most <strong>of</strong> <strong>the</strong> arid and semiarid regions that<br />
can most benefit from irrigation. Globally, irrigated agriculture uses approximately ⅔ <strong>of</strong> <strong>the</strong> total<br />
water used, with industrial and municipal use making up <strong>the</strong> balance. Supplemental irrigation in<br />
more humid regions has increased, masking <strong>the</strong> decline in irrigation in arid regions. Cali<strong>for</strong>nia,<br />
as an example, has experienced significant declines in irrigated acreage, some <strong>of</strong> which are<br />
considered temporary as a result <strong>of</strong> drought, while o<strong>the</strong>rs are more permanent due to declining<br />
ground water supplies as well as increasing urban and environmental water demands.<br />
Un<strong>for</strong>tunately, most arid regions do not have new developable surface waters and <strong>the</strong> large fresh<br />
water extractions <strong>of</strong> ground water required <strong>for</strong> irrigated agriculture cannot be increased. Of<br />
greater concern is <strong>the</strong> consideration that irrigation is not sustainable at current fresh water<br />
utilization rates. This over utilization <strong>of</strong> fresh water is particularly severe in drier regions <strong>of</strong> <strong>the</strong><br />
world, where population density, poverty, and food demands are greatest. Over drafting <strong>of</strong><br />
groundwater has resulted in declining water tables, loss <strong>of</strong> shallow fresh water <strong>for</strong> municipal use,<br />
and sea water intrusion in coastal regions. In early 1990s, approximately one fifth <strong>of</strong> <strong>the</strong> U.S.’s<br />
178
irrigated lands were extracting groundwater water in excess <strong>of</strong> <strong>the</strong> natural recharge. 3 The data are<br />
not completely known, but <strong>the</strong> situation appears more severe in many less developed nations.<br />
Increasing population results in increasing total demand <strong>for</strong> fresh water <strong>for</strong> municipal and<br />
industrial use as well as <strong>for</strong> increased food production. Increased fresh water needs are also<br />
related to increased per capita water usage associated with improved economic conditions in a<br />
region. Increases in living standards are not only related to increased domestic per capita water<br />
consumption, but <strong>the</strong>y also result in increased in water consumption related to food production<br />
on a per capita basis. This increased demand with improved living standards is related to <strong>the</strong><br />
increased water requirement <strong>for</strong> meat production versus grain production (expressed as gallons<br />
<strong>of</strong> water per kcal). It will be a major challenge just to maintain <strong>the</strong> existing level <strong>of</strong> irrigation and<br />
associated food production in <strong>the</strong> arid and semiarid regions <strong>of</strong> <strong>the</strong> world. An increase in living<br />
standards will require yet more water.<br />
Salinity<br />
In addition to <strong>the</strong> unsustainable extraction <strong>of</strong> fresh water, <strong>the</strong>re is a related decline in water<br />
quality <strong>of</strong> existing supplies. A substantial part <strong>of</strong> <strong>the</strong> increasing salinity <strong>of</strong> water supplies in arid<br />
regions is unavoidable when irrigating, unless <strong>the</strong> drainage water from irrigation is isolated from<br />
fresh water supplies. Salinity increases in drainage water relative to irrigation water are<br />
inevitable due to <strong>the</strong> fact that plants extract water and leave most <strong>of</strong> <strong>the</strong> salts behind,<br />
concentrating <strong>the</strong>se salts in <strong>the</strong> remaining water. Typically, plants extract only 5–10% <strong>of</strong> <strong>the</strong> salt<br />
associated with <strong>the</strong> water that <strong>the</strong>y extract. Hence, more efficient irrigation (generally resulting<br />
in less water applied more uni<strong>for</strong>mly), while desirable, results in smaller volumes <strong>of</strong> drainage<br />
water, but <strong>of</strong> greater salinity. The salinity increase is approximately inversely proportional to <strong>the</strong><br />
change in volume (inverse to volume <strong>of</strong> irrigation water/volume <strong>of</strong> drainage water).<br />
It is estimated that over 20% <strong>of</strong> irrigated land in <strong>the</strong> U.S. is salt-affected. 4 Globally, it is<br />
estimated that ⅓ <strong>of</strong> all irrigated land (76 million hectares [Mha]) is salt affected as a result <strong>of</strong><br />
human activity, 5 meaning that crop yields are reduced. Salinity is a major threat to current<br />
irrigation projects and to <strong>the</strong> remaining near-surface fresh water supplies in arid regions. The<br />
extent <strong>of</strong> <strong>the</strong> salinity problem has not stabilized; instead, it is estimated that as much as 2 Mha <strong>of</strong><br />
irrigated land, representing 1% <strong>of</strong> <strong>the</strong> total, is lost from production due to salinity each year. 6<br />
Most <strong>of</strong> <strong>the</strong> salt affected lands are in Asia and Africa. In contrast to salinization <strong>of</strong> water<br />
supplies, soil salinization is more readily controlled. Most soil salinization has occurred as a<br />
result <strong>of</strong> over irrigation, resulting in drainage volumes to <strong>the</strong> subsurface in excess <strong>of</strong> natural<br />
drainage capabilities and subsequent water logging, evaporation <strong>of</strong> water, and deposition <strong>of</strong> salts<br />
at or near <strong>the</strong> soil surface. Ensuring that soils are not over irrigated and maximizing food<br />
production per unit <strong>of</strong> water applied requires changes in irrigation systems. For example,<br />
conversion <strong>of</strong> surface flooding or furrow to drip irrigation allows <strong>for</strong> more uni<strong>for</strong>m application <strong>of</strong><br />
water, reduced need <strong>for</strong> irrigation water and reduced drainage volumes. These system changes<br />
and associated changes in management practices require capital investments and education<br />
programs <strong>for</strong> irrigators.<br />
Increased salinization in arid and semiarid regions is also caused by leaching <strong>of</strong> existing salts<br />
from <strong>the</strong> soil during irrigation in regions with high salt containing strata, as well as by<br />
application <strong>of</strong> waters <strong>of</strong> low quality without proper management. In <strong>the</strong> instance <strong>of</strong> soils high in<br />
native salts, regional salinization <strong>of</strong> ground and surface waters is aggravated by excessive water<br />
applications. This impact is particularly important when implementing a new irrigation project,<br />
179
ut <strong>the</strong> impacts <strong>of</strong> leaching salts present be<strong>for</strong>e irrigation may be observed <strong>for</strong> in excess <strong>of</strong> 120<br />
years after initiation <strong>of</strong> <strong>the</strong> irrigation project (Grand Valley, Colorado), depending on <strong>the</strong><br />
hydrology <strong>of</strong> <strong>the</strong> system and <strong>the</strong> type <strong>of</strong> salts present. In this instance, improved water<br />
management is essential <strong>for</strong> salinity control and <strong>for</strong> maintenance <strong>of</strong> existing fresh water supplies.<br />
Improvements in irrigation system infrastructure and management in Grand valley Colorado,<br />
including concrete lining <strong>of</strong> canals and laterals, installation <strong>of</strong> closed pipe delivery systems, and<br />
irrigation scheduling has reduced <strong>the</strong> salt load to <strong>the</strong> Colorado River by approximately 500,000<br />
tons per year.<br />
Since saline water is not generally usable by agriculture with present technology, salinization <strong>of</strong><br />
water resources represents a loss <strong>of</strong> useable water and can be a source <strong>of</strong> conflict among nations.<br />
Development <strong>of</strong> new irrigation projects upstream in a river basin inevitably results in adverse<br />
consequences to downstream users, ei<strong>the</strong>r with reduced waters flows, increased salinity, or a<br />
combination <strong>of</strong> both.<br />
Water Reuse<br />
Municipal water demands throughout <strong>the</strong> world are high and increasing over time. These<br />
increases are greatest in <strong>the</strong> arid and semiarid regions, where <strong>the</strong> population growth is also<br />
greatest. However, municipal use cannot be considered a completely competitive use <strong>for</strong> fresh<br />
water. Only a fraction (typically 25%) <strong>of</strong> <strong>the</strong> water diverted <strong>for</strong> municipal use is actually<br />
consumed (by evaporation or plant transpiration). The majority <strong>of</strong> <strong>the</strong> municipal water is ei<strong>the</strong>r<br />
degraded or lost due to leakage in <strong>the</strong> delivery system. Water currently lost via leakage is<br />
generally not available, as it may mix with saline or contaminated ground waters and thus be<br />
unusable, depending on local hydrologic conditions. Improvements in <strong>the</strong> municipal water<br />
delivery system can reduce <strong>the</strong> current all too common leakage <strong>of</strong> up to 50% <strong>of</strong> extracted water.<br />
These improvements, coupled with collection <strong>of</strong> wastewaters in a sewage system (with minimal<br />
losses in <strong>the</strong> system) can result in recovery <strong>of</strong> up to 70% <strong>of</strong> <strong>the</strong> allocated municipal water. It can<br />
thus be considered that municipal users primarily degrade ra<strong>the</strong>r than consume water. Increasing<br />
municipal demands <strong>for</strong> fresh water will result in corresponding increases in municipal<br />
wastewater.<br />
In order to sustain agricultural productivity and irrigated acreage, especially in <strong>the</strong> arid and<br />
semiarid regions <strong>of</strong> <strong>the</strong> world, <strong>the</strong>re will need to be a dramatic shift from fresh water to ei<strong>the</strong>r<br />
treated wastewaters or alternative saline waters. Use <strong>of</strong> desalination <strong>for</strong> irrigation water does not<br />
yet appear economically viable, despite continuing advances in <strong>the</strong> technology and current<br />
increases in its use <strong>for</strong> drinking water. At present, costs are typically in <strong>the</strong> $1,000-per-acre-foot<br />
range when subsidies are fully considered, 7 and a large portion <strong>of</strong> <strong>the</strong> cost is associated with<br />
energy consumption. These high capital and production costs may be viable <strong>for</strong> a few very high<br />
value specialty crops in developed nations if <strong>the</strong>re is no o<strong>the</strong>r water source, but it is not an option<br />
<strong>for</strong> production <strong>of</strong> basic food needs in less developed nations. None<strong>the</strong>less, desalination is<br />
increasingly being used <strong>for</strong> municipal drinking supplies as it becomes cost effective with<br />
alternative supplies in arid coastal regions (such as in sou<strong>the</strong>rn Cali<strong>for</strong>nia and in Gulf states in<br />
<strong>the</strong> Middle East).<br />
Marginal waters <strong>for</strong> irrigation contain (1) elevated concentrations <strong>of</strong> salts, typically above 2<br />
dS/m in electrical conductivity, (2) elevated values <strong>of</strong> sodium adsorption ratio (SAR), which is<br />
defined as Na/(Ca + Mg) 0.5 , where concentrations are expressed in terms <strong>of</strong> mmol/L<br />
(3) sometimes elevated pH, and (4) boron (B) concentrations that are potentially toxic to plants.<br />
180
The adverse effects <strong>of</strong> SAR and elevated pH on hydraulic conductivity (soil property related to<br />
infiltration) when combined with low salinity are well documented. 8,9 Increased sodium levels<br />
relative to calcium (Ca) and magnesium (Mg) are associated with a loss <strong>of</strong> soil structure, clay<br />
migration, and reduction in water infiltration rates. These losses can be sufficient to cause severe<br />
and at times even total loss <strong>of</strong> soil productivity. Once <strong>the</strong> lands are degraded in this manner<br />
restoration <strong>of</strong> productivity is difficult and expensive, hence it is important to avoid degradation.<br />
Current guidelines <strong>for</strong> irrigation 10 based on laboratory studies and field observation indicate that<br />
waters <strong>of</strong> SAR 10 or below can be used with no reduction in rate <strong>of</strong> infiltration when <strong>the</strong> salinity<br />
<strong>of</strong> <strong>the</strong> irrigation water is at or above 2 dS/m. On this basis, it has been assumed that most treated<br />
waste waters can be used without loss in infiltration. However, more recent research 11,12<br />
indicates that over an irrigation season, losses in infiltration are significant even at lower SAR<br />
(SAR 4-6) and that <strong>for</strong> systems using both rainfall and irrigation (<strong>the</strong> general situation <strong>for</strong><br />
irrigated regions), any increase in SAR reduces <strong>the</strong> infiltration rate.<br />
A reduction in <strong>the</strong> soil infiltration rate is undesirable <strong>for</strong> several reasons. Reduced infiltration<br />
rates result in greater time to infiltrate irrigation water, causing water ponding on <strong>the</strong> surface and<br />
possibly insufficient water infiltration to meet crop water needs. It may also result in generation<br />
<strong>of</strong> oxygen deficient soil conditions, all with adverse crop effect on crop production. Perhaps most<br />
importantly, a reduction in infiltration rate will result in decreased infiltration <strong>of</strong> rainfall,<br />
increased run<strong>of</strong>f, and increased soil erosion. In many irrigated regions rainfall is limited but<br />
especially winter rains are an important component <strong>of</strong> <strong>the</strong> irrigation system, enabling leaching <strong>of</strong><br />
salts from <strong>the</strong> soil during and enabling a non saline environment <strong>for</strong> seedling development in <strong>the</strong><br />
spring.<br />
In addition to a decrease in <strong>the</strong> water infiltration rate, loss <strong>of</strong> infiltration will result in a loss in<br />
recharge from rain events. This is very adverse in irrigated regions that are using low quality<br />
waters since <strong>the</strong> rain is <strong>of</strong>ten a major component <strong>of</strong> leaching. A good example is <strong>the</strong> leaching <strong>of</strong><br />
salts from <strong>the</strong> soil pr<strong>of</strong>ile in <strong>the</strong> Mediterranean region due to winter rains. Rains during <strong>the</strong> preplant<br />
time are especially valuable since <strong>for</strong> most crops <strong>the</strong> growth stage most sensitive to salts is<br />
during <strong>the</strong> early seedling stages. Winter rain provides a less saline environment at this critical<br />
stage, enabling irrigation with more saline water during <strong>the</strong> later stages <strong>of</strong> plant growth. It is this<br />
factor that minimizes yield loss in <strong>the</strong> Mediterranean basin when irrigating with moderately<br />
saline waters. Loss <strong>of</strong> this winter rain would adversely affect crop production. Regions lacking<br />
winter rain may not be as successful when using saline waters <strong>for</strong> irrigation.<br />
Most regions that are critically short <strong>of</strong> water are already starting to utilize waste waters <strong>for</strong><br />
irrigation out <strong>of</strong> necessity. In many instances, <strong>the</strong>se waters are not properly treated, and health<br />
risks due to food contamination with pathogens are <strong>of</strong> concern. Additional problems with reuse<br />
<strong>of</strong> all waste waters, even those that are tertiary treated, are associated with <strong>the</strong> elevated salinity<br />
SAR, pH and <strong>of</strong>ten boron present at concentrations adverse to plant growth (species dependent).<br />
Municipal and industrial users <strong>of</strong> water discharge added salts in <strong>the</strong>ir wastewater. Current waste<br />
water treatment processes utilize chlorine products to reduce or eliminate harmful<br />
microorganisms; this process inevitably results in additional increase in salinity <strong>of</strong> <strong>the</strong> treated<br />
water. Municipal treated wastewaters are always more saline than <strong>the</strong> water delivered to <strong>the</strong><br />
municipal users. Perhaps more important than elevated salinity levels <strong>of</strong> treated wastewater is <strong>the</strong><br />
increased SAR and pH levels relative to fresh water.<br />
181
Sustainable use <strong>of</strong> treated waste water requires that we consider <strong>the</strong> impact <strong>of</strong> <strong>the</strong>se waters on<br />
soil properties. The detrimental effects <strong>of</strong> elevated SAR and pH are cumulative and may take<br />
years to become evident. Use <strong>of</strong> amendments such as gypsum may be required <strong>for</strong> sustainable<br />
use <strong>of</strong> <strong>the</strong>se waters, depending on site-specific conditions such as water composition, soil<br />
properties, and <strong>the</strong> extent and timing <strong>of</strong> rain events. In <strong>the</strong> absence <strong>of</strong> proper management, use <strong>of</strong><br />
<strong>the</strong>se waters may aversely affect crop production and future soil productivity. This threat is<br />
greatest in less developed nations where agricultural extension services are minimal and where<br />
<strong>the</strong> farmers are least able to af<strong>for</strong>d <strong>the</strong> needed amendments to maintain productivity. This is a<br />
concern because municipal wastewater supplies are increasing with increasing municipal water<br />
demands, and <strong>the</strong> utilization <strong>of</strong> <strong>the</strong> wastewater is increasing even more rapidly. The one positive<br />
factor is that wastewater is a more reliable irrigation water supply than many current surface or<br />
groundwater sources.<br />
Saline waters are generally abundant in arid regions. Un<strong>for</strong>tunately, most currently utilized crops<br />
<strong>of</strong> high value are salt sensitive, and most salt tolerant crops are <strong>of</strong> lower economic value. Plants<br />
also <strong>of</strong>ten adapt to elevated salinity by reduced transpiration and reduced growth. Current<br />
recommendations 13 are to select increasingly salt tolerant crops with increasing irrigation water<br />
salinity, <strong>the</strong>reby avoiding yield loss. These recommendations need to be re<strong>for</strong>mulated in terms <strong>of</strong><br />
absolute production (not relative) and economic return. Salt-tolerant <strong>for</strong>ages such as wheat grass<br />
are available; however, optimal biomass production is lower than with some salt-sensitive<br />
<strong>for</strong>ages. There<strong>for</strong>e, total biomass production <strong>of</strong> wheatgrass under moderate salinity with no yield<br />
loss may still result in lower biomass production than would alfalfa, with its less-than-optimal<br />
yield under this salinity level. 14<br />
Waters currently deemed too saline <strong>for</strong> irrigation, may none<strong>the</strong>less be utilized in less developed<br />
nations in arid regions. Reduced yields due to salinity, while not economic in developed nations<br />
in humid regions may still be economically acceptable in more arid regions if <strong>the</strong>re are no<br />
alternative water supplies. Use <strong>of</strong> saline waters will require changes in irrigation systems, crops,<br />
and management practices. For example, sprinkler systems are not recommended <strong>for</strong> application<br />
<strong>of</strong> saline waters as foliar salt damage occurs. Saline waters might be best utilized in a cyclic<br />
cropping pattern, applying saline water <strong>for</strong> more salt-tolerant species and less saline water <strong>for</strong><br />
more salt sensitive species. Thus use <strong>of</strong> saline waters <strong>for</strong> irrigation may require significant<br />
changes in management systems and extensive farmer education to implement <strong>the</strong>m.<br />
Reuse <strong>of</strong> irrigation drainage water is ano<strong>the</strong>r component <strong>of</strong> improved water utilization. In this<br />
instance, <strong>the</strong>re is collection <strong>of</strong> <strong>the</strong> drainage water and irrigation with a more salt-tolerant crop.<br />
This can be repeated with several cycles <strong>of</strong> reuse, ending in an evaporation pond <strong>for</strong> collection <strong>of</strong><br />
<strong>the</strong> remaining salts. A major benefit <strong>of</strong> this system is that it can avoid degradation <strong>of</strong> <strong>the</strong> existing<br />
fresh water. Such a system would enable full utilization <strong>of</strong> a water source. The feasibility <strong>of</strong> this<br />
has been demonstrated in various field studies, 15 but it is currently not widely adopted and will<br />
require infrastructure development. By implementing <strong>the</strong>se reuse practices on a large scale and<br />
by keeping <strong>the</strong> drainage water separate from o<strong>the</strong>r water supplies, may be <strong>the</strong> only ways to avoid<br />
degradation <strong>of</strong> large supplies <strong>of</strong> moderately saline water underlying irrigated lands. These<br />
marginal waters are critical, as <strong>the</strong>y will need to be utilized to sustain agriculture in arid regions.<br />
The potential to develop salt-tolerant varieties <strong>of</strong> major food crops has not yet been realized, but<br />
increased understanding <strong>of</strong> <strong>the</strong> genetic traits <strong>of</strong> salt-tolerant plants holds <strong>the</strong> promise <strong>for</strong> breeding<br />
new suitable varieties, ei<strong>the</strong>r via genetic engineering or by conventional breeding methods.<br />
182
Conclusions<br />
Current agricultural production in arid regions is dependent on irrigation. These arid regions are<br />
generally characterized by small irrigated parcels, which are critical to providing food to <strong>the</strong><br />
farming family. Extraction <strong>of</strong> water in excess <strong>of</strong> what is replenished will result in reductions in<br />
available fresh water in arid regions. This reduction, along with continuing salinization <strong>of</strong> water<br />
and soils, threatens <strong>the</strong> ability <strong>of</strong> <strong>the</strong>se regions to even maintain <strong>the</strong>ir current levels <strong>of</strong> food<br />
production and make it unlikely that <strong>the</strong>y can grow sufficient food to feed <strong>the</strong>ir populations<br />
without technological advancements, infrastructure investment and an extensive extension<br />
system to transfer existing technology to <strong>the</strong> farmers. In <strong>the</strong> short and intermediate time frame,<br />
brackish and moderately saline ground waters are relatively abundant and can be potentially<br />
utilized to grow many, but not all crops. These practices can extend current high utilization <strong>of</strong><br />
irrigation <strong>for</strong> decades in many countries, but will require improved and <strong>of</strong>ten costly management<br />
practices. The major hazard to using <strong>the</strong>se waters is <strong>the</strong>ir elevated SAR and potential <strong>for</strong> loss <strong>of</strong><br />
soil productivity, especially if <strong>the</strong>re is significant rain. Improvements in irrigation practices,<br />
investment in new technologies, and development <strong>of</strong> salt-tolerant plant varieties may enable<br />
<strong>the</strong>se regions to utilize more abundant saline waters <strong>for</strong> irrigation and slow <strong>the</strong> rate <strong>of</strong><br />
degradation <strong>of</strong> fresh water supplies and thus extend <strong>the</strong>ir critical use <strong>for</strong> drinking supplies.<br />
↑ Back to <strong>the</strong> top<br />
1 Ghassemi, I., A.J. Jakeman, and H.A.Nix. 1995. Salinisation <strong>of</strong> Land and Water Resources. University<br />
<strong>of</strong> New South Wales Press LLTD. Sydney. 526pp.<br />
2 Postel, S. 1999. Pilar <strong>of</strong> Sand: Can <strong>the</strong> Irrigation Miracle Last? W.W. Norton & Co. London.<br />
3 Postel, S. 1997. Last Oasis: Facing Water Scarcity. W.W. Norton & Co. New York.<br />
4 Postel, S. 1999. Pilar <strong>of</strong> Sand: Can <strong>the</strong> Irrigation Miracle Last? W.W. Norton & Co. London.<br />
5 Ghassemi, I., A.J. Jakeman, and H.A.Nix. 1995. Salinisation <strong>of</strong> Land and Water Resources. University<br />
<strong>of</strong> New South Wales Press LLTD. Sydney. 526pp.<br />
6 Postel, S. 1997. Last Oasis: Facing Water Scarcity. W.W. Norton & Co. New York.<br />
7 <strong>National</strong> Research Council. 2008. Desalination: A Nation Perspective. Washington D.C.<br />
8 McNeal, B.L., and N.T. Coleman. 1966. Effect <strong>of</strong> solution composition on soil hydraulic conductivity.<br />
Soil Sci. Soc. Am. Proc. 30:308-312.<br />
9 Suarez, D.L., J.D. Rhoades, R. Lavado, and C.M. Grieve. 1984. Effect <strong>of</strong> pH on saturated hydraulic<br />
conductivity and soil dispersion. Soil Sci. Soc. Am. J. 48:50-55.<br />
10 Ayers, R.S., and D.W. Westcot. 1985. Water quality <strong>for</strong> agriculture. FAO Irrigation and Drainage Paper<br />
29 Rev.1. FAO, Rome.<br />
11 Suarez, D.L., J.D. Wood, and S.M. Lesch. 2006. Effect <strong>of</strong> SAR on water infiltration under a sequential<br />
rain-irrigation management system. Agric. Water Mgmt. 86:150-164.<br />
12 Suarez, D.L., J.D. Wood, and S.M. Lesch. 2008. Impact <strong>of</strong> sequential applications <strong>of</strong> rain and irrigation<br />
water on infiltration into a cropped soil. J. Environ. Qual. 37:S169-S179.<br />
13 Ayers, R.S., and D.W. Westcot. 1985. Water quality <strong>for</strong> agriculture. FAO Irrigation and Drainage Paper<br />
29 Rev.1. FAO, Rome.<br />
14 Grattan, S.R., C.M. Grieve, J.A. Poss, P.H. Robinson, D.L. Suarez, and S.E. Benes. Evaluation <strong>of</strong> salt<br />
tolerant <strong>for</strong>ages <strong>for</strong> sequential water reuse systems: I Biomass production. Agric. Water Mgmt. 70:109-<br />
120.<br />
15 Rhoades, J.D, F.T. Bingham, J. Letey, G.J. H<strong>of</strong>fman, A.R. Dedrick, P.J. Pinter, and J.A. Replogle. Use<br />
<strong>of</strong> saline drainage water <strong>for</strong> irrigation: Imperial Valley study. Agric. Water Mgmt. 16:25-36.<br />
183
2.6. Epidemics<br />
2.6.A.<br />
Epidemics: A Thumbnail Sketch <strong>of</strong> <strong>the</strong> Past, Present and Future<br />
(Debarati Guha-Sapir)<br />
Author and Organization: Debarati Guha-Sapir, Pr<strong>of</strong>essor, Department <strong>of</strong> Epidemiology and<br />
Public Health; Director, WHO Collaborating Centre <strong>for</strong> Research on Epidemiology<br />
<strong>of</strong> Disasters and Conflicts (CRED), and University <strong>of</strong> Louvain School <strong>of</strong> Medicine,<br />
Brussels<br />
Contact In<strong>for</strong>mation: Debarati.Guha@uclouvain.be<br />
Introduction<br />
Epidemics are generally defined as <strong>the</strong> occurrence <strong>of</strong> more cases <strong>of</strong> a disease than would be<br />
expected in a community and that spreads sustainably during a given time period. The<br />
definition as such includes chronic diseases, but it commonly refers only to infectious or<br />
communicable diseases.<br />
A related concept is a pandemic which spreads over many countries and sometimes <strong>the</strong> world<br />
and frequently involves <strong>the</strong> emergence <strong>of</strong> a new disease. It is not a pandemic not only because<br />
it is widespread or kills many people; it must also be infectious. 1<br />
In 2008, WHO reported 26 outbreaks <strong>of</strong> which, one was a new virus from <strong>the</strong> arenaviridae<br />
family and one was <strong>the</strong> avian flu pandemic 2 . O<strong>the</strong>r outbreaks may go unreported, as<br />
surveillance systems are weak or dysfunctional in many part <strong>of</strong> <strong>the</strong> world where infectious<br />
diseases mostly occur. Recent pandemics include Sudden Acute Respiratory Syndrome<br />
(SARS) in 2003, West Nile Fever, and <strong>the</strong> ongoing H1N1 (swine) flu. O<strong>the</strong>r pandemics which<br />
mobilized <strong>the</strong> global community were bovine spongi<strong>for</strong>m encephalopathy (BSE, or mad cow<br />
disease), and <strong>the</strong> more sustainably active epidemics such as drug-resistant tuberculosis and<br />
HIV/AIDS. Outbreaks <strong>of</strong> disease such as cholera in Zimbabwe in 2008–2009, <strong>the</strong> plague in<br />
India in 1994, Ebola and hepatitis outbreaks in conflict affected regions <strong>of</strong> <strong>the</strong> Democratic<br />
Republic <strong>of</strong> Congo (DRC), Angola and Uganda are nationally contained, but none<strong>the</strong>less <strong>the</strong>y<br />
have wide regional and sociopolitical relevance.<br />
Epidemics generate global fear that is essentially linked to people’s uncertainty <strong>of</strong> <strong>the</strong> size,<br />
spread, and individual outcomes. The basic questions underlying <strong>the</strong>se fears are “How bad is it<br />
going to get?” Or “am I likely to get sick with this disease?” The next section briefly describes<br />
<strong>the</strong> techniques epidemiology has to <strong>of</strong>fer that provide some answers to <strong>the</strong>se questions. The<br />
following section discusses current issues under debate and <strong>the</strong>ir global impact. Section 3.7.A-<br />
3 presents selected global initiatives <strong>of</strong> interest, and Section 3.7.A-4 sets out priority areas <strong>for</strong><br />
policy and programmes.<br />
This paper is not intended to be complete or unequivocal. Not only are many interesting and<br />
promising items excluded here, <strong>the</strong> positions taken are eminently debatable.<br />
Epidemics and Pandemics –Measuring Spread and Impact<br />
184
Epidemics are fast-moving disease events which are usually limited in time. Exceptions to this<br />
are <strong>the</strong> rise and spread <strong>of</strong> HIV/AIDS, or <strong>the</strong> re-emergence <strong>of</strong> tuberculosis on <strong>the</strong> global level.<br />
Highly virulent pathogens tend to limit <strong>the</strong> spread and duration <strong>of</strong> an epidemic simply because<br />
<strong>the</strong> infected person dies shortly after contracting <strong>the</strong> disease and has little time to actually<br />
infect many o<strong>the</strong>rs. The pathogen <strong>the</strong>re<strong>for</strong>e needs to mutate to less virulent <strong>for</strong>ms over time to<br />
survive in nature.<br />
This characteristic is only one example <strong>of</strong> <strong>the</strong> immense biological and sociopolitical<br />
complexities <strong>of</strong> an epidemic. At very fundamental levels, <strong>the</strong> dynamics <strong>of</strong> any epidemic are<br />
dependent on <strong>the</strong> rate <strong>of</strong> transmission from infectious to susceptible hosts. In many disease<br />
models, this rate is captured in a compound probability <strong>of</strong> transmission. This parameter can be<br />
broken down into a number <strong>of</strong> variables, including <strong>the</strong> rate at which <strong>the</strong> infected person comes<br />
in contact with o<strong>the</strong>rs, whe<strong>the</strong>r those contacts actually result in disease transmission, and<br />
variations in severity <strong>of</strong> illness or periods <strong>of</strong> infectivity. 3 Understanding <strong>of</strong> each <strong>of</strong> <strong>the</strong>se subparameters<br />
allows health pr<strong>of</strong>essionals to decide what action to take to address one <strong>of</strong> <strong>the</strong>se<br />
sub-parameters, and it allows policy makers to establish <strong>the</strong> most effective containment policy.<br />
Each <strong>of</strong> <strong>the</strong>se sub-parameters is more or less actionable according to <strong>the</strong> context and available<br />
resources. Finally, an indisputable advantage <strong>for</strong> effective epidemic control is early detection –<br />
<strong>the</strong> recognition <strong>of</strong> an epidemic soon after it has started. Like many population-based<br />
phenomena, early detection provides <strong>the</strong> best chance <strong>of</strong> success in containment.<br />
Today <strong>the</strong>re are many infectious disease models. Most are based on <strong>the</strong> basic Susceptible –<br />
Infectives – Recovery - SIR approach. In its more complex <strong>for</strong>ms, this approach provides<br />
practical insights into how fast an epidemic will progress, who are those at high risk, and what<br />
actions can be taken at what stage to contain it. They involve complex ma<strong>the</strong>matical algorithms<br />
that were first introduced by David Bernoulli in 1760s following a small pox epidemic. 4 His<br />
approach is still considered one <strong>of</strong> <strong>the</strong> soundest approaches to modeling disease spread.<br />
Modern approaches <strong>of</strong>ten underestimate herd immunity (<strong>the</strong> proportion <strong>of</strong> individuals who are<br />
not susceptible to <strong>the</strong> disease), which determines <strong>the</strong> vaccination threshold that has to be<br />
exceeded to eliminate an infection and <strong>the</strong> basic reproduction number (<strong>the</strong> inverse <strong>of</strong> <strong>the</strong><br />
proportion <strong>of</strong> susceptible individuals). 5 Today’s wide-ranging disease models are exceptionally<br />
intricate, but <strong>the</strong>y are all variants <strong>of</strong> <strong>the</strong> original.<br />
Ano<strong>the</strong>r important concept is <strong>the</strong> “Basic Reproduction Number” (R0), which represents <strong>the</strong><br />
number <strong>of</strong> new infected persons that can be generated by a single infected individual in a<br />
susceptible population. This depends on <strong>the</strong> level <strong>of</strong> <strong>the</strong> disease’s infectiousness, <strong>the</strong> time <strong>of</strong><br />
infection, <strong>the</strong> clinical onset <strong>of</strong> <strong>the</strong> disease (latency period), and <strong>of</strong> course, <strong>the</strong> density <strong>of</strong><br />
susceptibles near outbreak. 6<br />
This above framework illustrates that epidemics are both a social process (determinants include<br />
contact or mobility) and a biological process (transmission and virulence). The fear <strong>of</strong> an<br />
epidemic and its response is also a perception process.<br />
With regard to public health, security and stability, <strong>the</strong>se factors have been closely associated<br />
over centuries. Disease control has its roots in military medicine, which was and is uniquely<br />
mass medicine <strong>of</strong> a certain type. In <strong>the</strong> 17 th and 18 th centuries, only <strong>the</strong> military had <strong>the</strong> logistic<br />
and <strong>the</strong> operational structure <strong>for</strong> dealing with large health threats such as epidemics. Public<br />
health was an issue <strong>of</strong> public security, and <strong>the</strong> main public health measures concerned control<br />
<strong>of</strong> people movements and mandatory health check <strong>for</strong> special categories (e.g., mobile<br />
185
populations, migrants, prostitutes). The cholera pandemics <strong>of</strong> 1830 which invaded Europe from<br />
Asia, served as a watershed <strong>for</strong> military medicine applied to civil society and <strong>the</strong> origin <strong>of</strong><br />
public medicine. 7 The “cordon sanitaire” 8 so effectively imposed by <strong>the</strong> military in Naples<br />
against bubonic plague in <strong>the</strong> early 1700s proved to be totally ineffective against pandemic<br />
cholera transmission. 9 Military intervention <strong>for</strong> epidemic disease control was called “folly” by<br />
<strong>the</strong> British medical establishment and fell out <strong>of</strong> favor as <strong>the</strong> limitations <strong>of</strong> population-based<br />
isolation <strong>for</strong> different diseases were better understood.<br />
Current Issues<br />
In <strong>the</strong> last decades, epidemic disease combined with bioterrorism is again a matter <strong>for</strong> security<br />
and military. Preparedness <strong>for</strong> bioterrorism or germ warfare touches upon issues such as <strong>the</strong><br />
politisation <strong>of</strong> microbial spread, concepts <strong>of</strong> civil liberties, or <strong>the</strong> role <strong>of</strong> biomedical and<br />
surveillance technologies in public health. These are delicate areas <strong>of</strong> public policy and require<br />
wide discussion and open debate.<br />
But <strong>the</strong> need <strong>for</strong> better epidemic control should not only be a priority <strong>for</strong> bioterrorism or germ<br />
warfare preparedness. It is also (and maybe more concretely) linked to legitimate global<br />
transactions such as trade and tourism. Massive increases in world tourism and increasingly<br />
dynamic world trade are highly desirable developments <strong>for</strong> all citizens, but <strong>the</strong>y are<br />
accompanied by risks and hazards, including transmission <strong>of</strong> disease.<br />
The global perceptions <strong>of</strong> cholera outbreaks lead to restricting travel to and from countries<br />
where a cholera outbreak is occurring, or imposing import restrictions on certain foods. For<br />
example, <strong>the</strong> cholera outbreak in Peru in 1991 cost <strong>the</strong> country US$770 million due to food<br />
trade embargoes and adverse effects on tourism. 10 Announcement <strong>of</strong> cholera epidemics in<br />
Bangladesh has a negative effect on its export market <strong>for</strong> its seafood, plunging many <strong>of</strong> its<br />
small-scale fishermen into rapid destitution.<br />
Transparency becomes a victim to <strong>the</strong> legitimate needs <strong>of</strong> a poor nation to maintain <strong>the</strong><br />
economic viability <strong>of</strong> its people. The current cholera outbreak in Ethiopia is referred to as<br />
“acute watery diarrhoea,” although cholera is likely. 11 The safety <strong>of</strong> <strong>the</strong> global community and<br />
<strong>the</strong> survival <strong>of</strong> <strong>the</strong> local community are in play, and policies to protect both must be devised.<br />
Whe<strong>the</strong>r from a global security plat<strong>for</strong>m or from <strong>the</strong> standpoint <strong>of</strong> disease or trade and tourism,<br />
<strong>the</strong> military continues to have <strong>the</strong> best human and material resources, as well as <strong>the</strong> best<br />
technology, <strong>for</strong> effective, rapid action against epidemics and pandemics. Laboratory facilities,<br />
medical personnel, and engineers are more readily available in certain countries over and<br />
above what almost any health ministry could <strong>of</strong>fer in a crisis. However, use <strong>of</strong> military<br />
resources <strong>for</strong> civil action, even in democracies, is deeply controversial. None<strong>the</strong>less, <strong>the</strong> use <strong>of</strong><br />
military resources merits sound examination, especially <strong>for</strong> volatile, high-stake events such as<br />
epidemics.<br />
Given <strong>the</strong> available evidence and scientific studies, it is difficult to argue convincingly that<br />
disease outbreaks, however massive, have directly led to sociopolitical upheaval. However,<br />
<strong>the</strong>ir impacts on factors that are critical <strong>for</strong> national and international stability are significant.<br />
The HIV/AIDS epidemic in many countries in sub-Saharan Africa illustrates how infectious<br />
disease can destroy <strong>the</strong> viability or <strong>the</strong> ability <strong>of</strong> a State to function. The 1996 Ebola outbreak<br />
in Kikwit and some <strong>of</strong> <strong>the</strong> subsequent outbreaks in Angola, Uganda, and Sudan, killed a large<br />
186
proportion <strong>of</strong> desperately scarce health personnel, fur<strong>the</strong>r sinking <strong>the</strong> country/region into<br />
under-development status.<br />
From sociopolitical perspectives, <strong>the</strong>re are at least two potentially problematic issues. First,<br />
pandemics or perceptions <strong>of</strong> pandemics can fuel <strong>the</strong> growth <strong>of</strong> insularity and suspicion <strong>of</strong><br />
<strong>for</strong>eign goods or people as potential transmitters <strong>of</strong> diseases, in itself a driver <strong>of</strong> social<br />
instability. Second, <strong>the</strong> introduction <strong>of</strong> <strong>the</strong> notion <strong>of</strong> a group at risk (encountered <strong>for</strong> example,<br />
in <strong>the</strong> control <strong>of</strong> HIV/AIDS), is a key concept in epidemiology, but it is a delicate notion in<br />
public policy arenas.<br />
Balancing all <strong>of</strong> <strong>the</strong> above—military and civilian policy <strong>for</strong> global disease control, trade,<br />
tourism, trade, epidemic disease and survival, discrimination <strong>of</strong> high risk groups—will be key<br />
challenges <strong>for</strong> global disease control.<br />
Selected Global Initiatives<br />
The importance <strong>of</strong> global monitoring <strong>of</strong> epidemic disease has not gone unrecognized in <strong>the</strong><br />
recent past. Lead public health institutions such as <strong>the</strong> World Health Organization (WHO), <strong>the</strong><br />
US Centers <strong>for</strong> Disease Control and Prevention (CDC), and now <strong>the</strong> more recently created<br />
European Centre <strong>for</strong> Disease Prevention and Control (ECDC) have launched successful<br />
initiatives <strong>for</strong> global disease surveillance and monitoring, as have <strong>the</strong> non-organized health and<br />
medical community.<br />
Among <strong>the</strong> global ef<strong>for</strong>t, one notable initiative is <strong>the</strong> Global Public Health Intelligence<br />
Network (GPHIN), an Internet-based multilingual early-warning tool that continuously<br />
searches global media sources <strong>for</strong> events <strong>of</strong> potential international public health concern. These<br />
events include disease outbreaks, infectious diseases, contaminated food and water, bioterrorism,<br />
exposure to chemical and radio-nuclear agents, and natural disasters. Ano<strong>the</strong>r highly<br />
successful and useful field-based monitoring system is ProMed-mail, <strong>the</strong> Program <strong>for</strong><br />
Monitoring Emerging Diseases, which is also an Internet-based reporting system dedicated to<br />
rapid global dissemination <strong>of</strong> in<strong>for</strong>mation on outbreaks <strong>of</strong> infectious diseases and acute<br />
exposures to toxins that affect human health. In contrast to GPHIN, it is commonly used by<br />
practitioners, including those in remote and insecure areas <strong>of</strong> <strong>the</strong> world, and it has about 20,000<br />
members worldwide. The WHO has also started up Global Outbreak Alert and Response<br />
Network (GOARN), which networks initiatives such those described above.<br />
Some Directions <strong>for</strong> <strong>the</strong> Future<br />
How significant is <strong>the</strong> threat <strong>of</strong> epidemics <strong>for</strong> global sociopolitical stability? In a period <strong>of</strong><br />
competing demands <strong>for</strong> scarce resources, is this a defensible basis <strong>for</strong> resource reallocations?<br />
Fortunately, actions that address <strong>the</strong> global control <strong>of</strong> epidemics as drivers <strong>of</strong> social instability<br />
and <strong>the</strong> disease control goals <strong>of</strong> <strong>the</strong> international public health community are not very<br />
different, a serendipitous coincidence that kills two birds with one stone. First, systems <strong>for</strong><br />
controlling diseases with epidemic and pandemic potential require more creative thinking.<br />
These systems must also account <strong>for</strong> <strong>the</strong> priorities and perceptions <strong>of</strong> <strong>the</strong> local population.<br />
Incentives to think outside <strong>the</strong> classical disease surveillance and monitoring systems paradigms<br />
are needed to increase innovation in this area.<br />
The current surveillance models are designed <strong>for</strong> wealthy, stable countries with reasonable<br />
sized health budgets and educated population bases. Evidence over <strong>the</strong> last decades has<br />
illustrated that <strong>the</strong>se models cannot be reliably operational in poor countries or in insecure<br />
187
egions. Initiatives that are purely based on private voluntary organizations (PVOs) are not<br />
sustainable, institutional solutions. While <strong>the</strong>y are admittedly <strong>of</strong>ten <strong>of</strong> high quality, <strong>the</strong>y are<br />
none<strong>the</strong>less ad hoc and transient. New paradigms <strong>for</strong> disease surveillance that account <strong>for</strong><br />
weak infrastructure and limited human resources need to be developed. One such example is<br />
<strong>the</strong> monitoring <strong>of</strong> infectious disease outbreaks using “syndromic surveillance” <strong>of</strong> prediagnostic<br />
data. These data include medication sales, patients’ symptoms, and absenteeism<br />
from work. 12<br />
Cooperation <strong>for</strong> laboratory facilities and technology exchange between Europe, North<br />
America, and o<strong>the</strong>r economically comparable countries (e.g., Japan, Korea, Mexico, and<br />
Singapore) is essential. The recent experiences with SARS, Avian flu, and H1N1 flu provide<br />
an excellent scare opportunity to push a cooperation agenda <strong>for</strong>ward, as most countries are<br />
open to such initiatives and aware <strong>of</strong> <strong>the</strong> potential political costs at home. Some <strong>of</strong> this is being<br />
addressed and should be supported. At a fur<strong>the</strong>r stage, <strong>the</strong> cooperation should also include<br />
medium-development countries such as Turkey, Algeria or Thailand. China and India should<br />
be encouraged to take on more effective national and regional responsibilities <strong>for</strong> epidemic and<br />
pandemic monitoring. Effective cooperation in laboratory networking and technology transfers<br />
will vastly improve monitoring <strong>of</strong> trends in drug resistance and <strong>the</strong> appearance <strong>of</strong> new disease<br />
strains, aspects that are central to effective disease control and epidemic response and in <strong>the</strong><br />
interests <strong>of</strong> all.<br />
International aid programmers <strong>for</strong> populations affected by conflicts, including preventive<br />
diplomacy ef<strong>for</strong>ts, should give higher priority to <strong>the</strong> public health components <strong>of</strong> disease<br />
control. Today nearly 600 million people are included in populations affected by conflicts, and<br />
most <strong>of</strong> <strong>the</strong>m are in areas where epidemics are most likely to break out and remain undetected<br />
<strong>for</strong> some time. 13<br />
Global epidemic control is commonly perceived to be an emerging disease issue. This involves<br />
early childhood diseases such as measles, diarrhea and acute respiratory infection (ARI), still<br />
<strong>the</strong> top three killers <strong>of</strong> children worldwide. Weakened and unvaccinated children are<br />
susceptible hosts to new and virulent strains. Ef<strong>for</strong>ts to stamp out or substantially reduce <strong>the</strong><br />
incidence <strong>of</strong> <strong>the</strong>se diseases must absolutely remain a priority, as <strong>the</strong>se contribute indisputably<br />
to <strong>the</strong> bulk <strong>of</strong> infectious disease deaths.<br />
↑ Back to <strong>the</strong> top<br />
1 For instance, cancer is responsible <strong>for</strong> many deaths but is not considered a pandemic because <strong>the</strong><br />
disease is not infectious or contagious.<br />
2<br />
WHO Global Alert and Response Disease Outbreak News http://www.who.int/csr/don/<br />
archive/year/2008/en/index.html<br />
3 L. A. Real and R. Biek., Infectious disease modeling and <strong>the</strong> dynamics <strong>of</strong> transmission Current Topics<br />
in Microbiology and Immunology; 315:33-49, Feb. 2007<br />
4 Daniel Bernoulli introduced this by his analysis <strong>of</strong> smallpox epidemic in 1760s. He expressed <strong>the</strong><br />
proportion <strong>of</strong> susceptible individuals <strong>of</strong> an endemic infection in terms <strong>of</strong> <strong>the</strong> <strong>for</strong>ce <strong>of</strong> infection<br />
(virulence) and life expectancy (survival).<br />
5 Klaus Dietz 1 & J. A. P. Heesterbeek , Bernoulli was ahead <strong>of</strong> modern epidemiology Correspondence,<br />
Nature 408, 513-514 (30 November 2000) | doi:10.1038/35046270<br />
188
6 Preventing an epidemic thus becomes equivalent to keeping R0
2.6.B.<br />
Infectious Disease and Social Instability: Prevent, Respond, Repair<br />
(Daniel Strickman)<br />
Author and Organization: Daniel Strickman, Agricultural Research Service, USDA<br />
Contact In<strong>for</strong>mation: Daniel.strickman@ars.usda.gov<br />
Introduction<br />
The range <strong>of</strong> effects <strong>of</strong> infectious diseases on human populations is nothing short <strong>of</strong><br />
astounding. Historically we read <strong>of</strong> <strong>the</strong> great plagues <strong>of</strong> history and how <strong>the</strong>y appeared to be as<br />
important to <strong>the</strong> outcome <strong>of</strong> nations as military preparedness, government stability, and<br />
sophistication <strong>of</strong> populations. One only needs to mention black plague (Yersinia pestis), yellow<br />
fever (a flavivirus), and epidemic typhus (Rickettsia prowazekii) to conjure images <strong>of</strong> societal<br />
chaos and devastation. Although <strong>the</strong>se diseases still occur in <strong>the</strong> modern world, <strong>the</strong> current<br />
immediate threats are different: human immunodeficiency virus (HIV), tuberculosis<br />
(Mycobacterium tuberculosis), and malaria (Plasmodium falciparum, vivax, ovale, and<br />
malariae) among <strong>the</strong>m. Of course, we could add many pathogens that are feared but which<br />
have not yet impacted populations in a way that alters demographics.<br />
Infectious Disease Threat Classification<br />
The kinds <strong>of</strong> infectious disease threats can be classified in a number <strong>of</strong> different ways.<br />
Academically, <strong>the</strong>y are usually divided taxonomically into viruses, bacteria, protists,<br />
nematodes, etc., with a great deal <strong>of</strong> ef<strong>for</strong>t expended on classification according to accurate<br />
phylogenetic criteria. These ef<strong>for</strong>ts <strong>of</strong>ten seem pedantic to laymen, though phylogenetically<br />
accurate classification can lead to many practical results and enables focused, more effective<br />
research. However, in considering <strong>the</strong> range <strong>of</strong> pathogens’ effects on social instability, such<br />
taxonomic classification is not going to be very useful.<br />
Diseases and Social Stability<br />
The aspects <strong>of</strong> diseases that are likely to be important to those equally concerned with social<br />
stability include severity to <strong>the</strong> individual, available medical interventions <strong>for</strong> prevention and<br />
treatment, and <strong>the</strong> means <strong>of</strong> transmission. Some diseases have a very high fatality rate once <strong>the</strong><br />
infection occurs, such as HIV and pulmonary anthrax. O<strong>the</strong>rs cause <strong>the</strong>ir share <strong>of</strong> deaths in<br />
adults but are mainly characterized by <strong>the</strong>ir debilitating effects (e.g., dengue, malaria).<br />
Sometimes <strong>the</strong> same infection is much more dangerous in children than adults (e.g., dengue,<br />
malaria) or vice versa (e.g., polio). Preventive measures vary from large-scale infrastructure<br />
(e.g., sewers, safe food handling) to promotion <strong>of</strong> good habits (e.g., hand washing following<br />
defecation) to vaccines. Treatment ranges from very effective antibiotics to supportive <strong>the</strong>rapy<br />
that allows <strong>the</strong> patient’s own immune system to overcome <strong>the</strong> infection. Transmission is a<br />
complicated subject because it represents <strong>the</strong> ecology <strong>of</strong> <strong>the</strong> disease from <strong>the</strong> standpoint <strong>of</strong> <strong>the</strong><br />
pathogen itself. Thankfully, few pathogens are carried in aerosolized droplets or picked up<br />
directly from surfaces (e.g., influenza), but close physical contact <strong>of</strong>fers a wider range <strong>of</strong><br />
pathogens a chance to infect a person. The range <strong>of</strong> species infected also varies a great deal so<br />
that some pathogens only circulate between people (e.g., polio virus) while many o<strong>the</strong>rs have a<br />
range <strong>of</strong> hosts (e.g., influenza virus) or even live in <strong>the</strong> environment (e.g., cholera [Vibrio<br />
cholerae] and tetanus [Clostridium tetani]). Although it sounds specialized, one particular <strong>for</strong>m<br />
190
<strong>of</strong> transmission has been very problematic <strong>for</strong> humans. This is transmission by arthropods,<br />
especially when <strong>the</strong> pathogen is specifically adapted to a cycle that involves biological<br />
amplification in <strong>the</strong> arthropod.<br />
Table 2.7.B-1. Examples <strong>of</strong> Diseases that Could Affect Social Stability.<br />
Disease Pathogen Severity Prevention Treatment Transmission<br />
Influenza virus low mortality,<br />
short illness<br />
Toxigenic E.<br />
coli<br />
Escherischia<br />
coli O17H57<br />
low mortality,<br />
short illness<br />
Plague Yersinia pestis high<br />
mortality,<br />
short illness<br />
Malaria<br />
Epidemic<br />
typhus<br />
Plasmodium<br />
spp.<br />
Rickettsia<br />
prowazekii<br />
low mortality,<br />
long illness<br />
high<br />
mortality,<br />
short illness<br />
AIDS virus high<br />
mortality,<br />
long illness<br />
tuberculosis<br />
Mycobacterium<br />
tuberculosis<br />
moderate<br />
mortality,<br />
long illness<br />
vaccine,<br />
sanitation<br />
antivirals<br />
aerosol, contact<br />
sanitation antibiotics fecal-oral,<br />
contamination<br />
oral<br />
avoidance,<br />
vector control,<br />
rodent control<br />
drugs, vector<br />
control<br />
antibiotics<br />
drugs<br />
aerosol, fleas<br />
from rodents<br />
mosquitoes<br />
from o<strong>the</strong>r<br />
people<br />
vector control drugs body lice from<br />
o<strong>the</strong>r people<br />
sexual<br />
discipline<br />
sanitation,<br />
detection and<br />
treatment,<br />
vaccine (not in<br />
US)<br />
antivirals<br />
antibiotics<br />
sexual contact<br />
aerosol<br />
The examples <strong>of</strong> diseases in Table 2.7.B-1 represent some familiar examples that would seem<br />
to have societal implications. Influenza has a relatively low rate <strong>of</strong> mortality and is accepted as<br />
an inconvenience by many, but it is so easily transmitted that it sweeps through <strong>the</strong> world<br />
population and affects normal activities. The fear <strong>of</strong> a <strong>for</strong>m <strong>of</strong> <strong>the</strong> virus that causes more<br />
mortality is well justified by <strong>the</strong> experience with <strong>the</strong> 1918 epidemic. 1 Toxigenic E. coli,<br />
especially <strong>the</strong> O157:H7 serotype, has affected thousands <strong>of</strong> people in individual outbreaks<br />
caused by food contamination. 2 It is rarely fatal, but its sudden appearance among those who<br />
shared <strong>the</strong> same source <strong>of</strong> food causes disruptions. Plague is largely tamed at <strong>the</strong> present time<br />
thanks to efficient methods to deal with incipient outbreaks; however, reservoirs <strong>of</strong> plague<br />
occur worldwide, and historically, it caused <strong>the</strong> death <strong>of</strong> large percentages <strong>of</strong> some<br />
populations. Malaria has insidious effects on a population because it contributes to shocking<br />
childhood death rates and tends to lower <strong>the</strong> vigor <strong>of</strong> <strong>the</strong> adult population in a very persistent<br />
manner (World Health Organization 2008). 3 Malaria has been difficult to control in large areas,<br />
though it has been brought under control in most temperate climates. Epidemic typhus was a<br />
great killer through WWII, 4 usually favored by economic disruptions and subsequent increases<br />
in body lice. With <strong>the</strong> advent <strong>of</strong> tetracycline antibiotics and efficient insecticides in <strong>the</strong> 1940s<br />
and 1950s, epidemics <strong>of</strong> this disease can be brought under control 5 . The sudden appearance <strong>of</strong><br />
191
HIV in <strong>the</strong> early 1980s is likely <strong>the</strong> most recent salient example <strong>of</strong> an emerging disease, having<br />
apparently originated from a non-human retrovirus within modern times. Fortunately,<br />
transmission <strong>of</strong> HIV is not robust and generally requires venereal contact, which provides<br />
important strategies <strong>for</strong> prevention. Finally, tuberculosis was at one time responsible <strong>for</strong> about<br />
25% <strong>of</strong> deaths in some regions. Vigorous sanitation measures and development <strong>of</strong> effective<br />
drugs made tuberculosis a persistent but manageable problem. The appearance <strong>of</strong> antibioticresistant<br />
<strong>for</strong>ms <strong>of</strong> <strong>the</strong> pathogen raises <strong>the</strong> specter <strong>of</strong> <strong>the</strong> return <strong>of</strong> epidemics <strong>of</strong> this terrible<br />
disease. There are, <strong>of</strong> course, o<strong>the</strong>r current and historical examples <strong>of</strong> pathogens with societal<br />
impacts, but this short list illustrates <strong>the</strong> variety <strong>of</strong> issues involved in evaluating and managing<br />
<strong>the</strong>m.<br />
Emerging Infectious Diseases<br />
Be<strong>for</strong>e moving on to some general strategies <strong>for</strong> preventing societal impacts <strong>of</strong> infectious<br />
diseases, it is important to discuss <strong>the</strong> concept <strong>of</strong> emerging infectious diseases. The appearance<br />
<strong>of</strong> HIV was a startling development at <strong>the</strong> time: an apparently new pathogen that was 100%<br />
fatal and unaffected by any medical intervention. Since <strong>the</strong>n, drug <strong>the</strong>rapy has reduced <strong>the</strong><br />
impact <strong>of</strong> HIV infection <strong>for</strong> <strong>the</strong> individual, but at a great societal cost. More important has been<br />
<strong>the</strong> tedious task <strong>of</strong> educating <strong>the</strong> public about a problem that involves moral taboos, subjects<br />
little discussed, and unwelcome alterations <strong>of</strong> behavior. Once convinced that <strong>the</strong> problem is<br />
preventable and deadly serious, many populations have complied with <strong>the</strong> necessity to exercise<br />
sexual discipline. The problem is not over, but society in general deals with it at a cost that is<br />
largely accepted.<br />
The experience with HIV raises <strong>the</strong> question as to whe<strong>the</strong>r studying <strong>the</strong> past really is <strong>the</strong> key to<br />
preparing <strong>for</strong> <strong>the</strong> future. While extensive study is conducted <strong>of</strong> <strong>the</strong> historical diseases that<br />
changed national histories—plague, epidemic typhus, tuberculosis—will nature provide a new<br />
or modified pathogen that surprises us? The haunting possibility that what seems like a small<br />
problem now (e.g., rodent-borne hantavirus) could become a large-scale epidemic if conditions<br />
changed stimulates interest in studying what appear to be obscure infections. A recent example<br />
is chikungunya disease. Caused by a virus that has appeared in severe epidemics in <strong>the</strong> Indian<br />
Ocean basin and Africa, <strong>the</strong> disease is seldom fatal, but it causes painful symptoms <strong>for</strong> about<br />
30 days. Historically it has appeared in large outbreaks and <strong>the</strong>n disappeared <strong>for</strong> many years at<br />
a time. It was principally transmitted by a single mosquito species, <strong>the</strong> yellow fever mosquito<br />
(Aedes aegypti), which itself has been transported by humans throughout <strong>the</strong> tropical world. 6 In<br />
2007, during a very large epidemic, <strong>the</strong> virus underwent a single mutation that suddenly made<br />
it susceptible to transmission by <strong>the</strong> Asian tiger mosquito (Aedes albopictus), a native <strong>of</strong><br />
sou<strong>the</strong>astern Asia. 7 The addition <strong>of</strong> a <strong>for</strong>m <strong>of</strong> <strong>the</strong> virus transmissable by <strong>the</strong> Asian tiger<br />
mosquito was particularly bad because this mosquito had only recently (since 1986) been<br />
transported to many more locations in <strong>the</strong> used tire trade. 8,9 Unlike <strong>the</strong> yellow fever mosquito,<br />
<strong>the</strong> Asian tiger mosquito can live through cold winters, so that its expanding distribution<br />
includes Europe and <strong>the</strong> US, as well as a wide distribution in <strong>the</strong> tropics. As a direct result <strong>of</strong><br />
<strong>the</strong> human-induced expansion <strong>of</strong> <strong>the</strong> distribution <strong>of</strong> Asian tiger mosquito and <strong>the</strong> natural<br />
mutation <strong>of</strong> <strong>the</strong> chikungunya virus, <strong>the</strong> disease broke out <strong>for</strong> <strong>the</strong> first time outside <strong>of</strong> its normal<br />
range in 2007 in Italy. 10 Fortunately, this occurred in an area with a vigorous mosquito<br />
abatement function, and vector control limited <strong>the</strong> number <strong>of</strong> Italian cases to about 300. At this<br />
point, it seems like just a matter <strong>of</strong> time be<strong>for</strong>e many more people are affected in o<strong>the</strong>r parts <strong>of</strong><br />
Europe and <strong>the</strong> United States.<br />
192
How can society prepare itself <strong>for</strong> potential epidemics? We have elaborate and largely effective<br />
systems in many parts <strong>of</strong> <strong>the</strong> world that protect populations from epidemics. These systems<br />
depend on reasonable access by individuals to medical treatment, public health infrastructure<br />
that ga<strong>the</strong>rs statistics and responds to outbreaks, and a population that is aware <strong>of</strong> <strong>the</strong><br />
importance <strong>of</strong> infectious disease and <strong>the</strong>re<strong>for</strong>e willing to support public health measures. In a<br />
current context, <strong>the</strong>re is much frustration with <strong>the</strong> cost <strong>of</strong> this system and <strong>the</strong> gradual erosion <strong>of</strong><br />
public health services in countries like <strong>the</strong> U.S. To <strong>the</strong> extent that infectious disease control<br />
needs to be streng<strong>the</strong>ned, <strong>the</strong> key improvement is probably <strong>the</strong> same as <strong>for</strong> so many o<strong>the</strong>r<br />
systems that support modern human life: integration. Integrated Disease Management (IDM)<br />
would fur<strong>the</strong>r organize preparedness and response by per<strong>for</strong>ming two important functions.<br />
First, it would educate responsible parties at all levels, including <strong>the</strong> public, on <strong>the</strong> functions <strong>of</strong><br />
IDM. Those functions are risk assessment, surveillance, prevention and control, and<br />
sustainable support.<br />
Functions <strong>of</strong> Integrated Disease Management (IDM)<br />
Risk assessment is <strong>the</strong> research and data ga<strong>the</strong>ring required to know which problems are likely<br />
to be important and which can be safely downplayed. Academic research, especially which is<br />
innovative and motivated by curiosity, is an important layer <strong>of</strong> risk assessment that is most<br />
likely to identify those problems that <strong>the</strong> medical community at large does not even suspect.<br />
Data ga<strong>the</strong>ring agencies like <strong>the</strong> Centers <strong>for</strong> Disease Control and Prevention also per<strong>for</strong>m an<br />
important function in risk assessment when <strong>the</strong>y ga<strong>the</strong>r disease data and provide analysis.<br />
Improvements in <strong>the</strong> efficiency and effectiveness <strong>of</strong> <strong>the</strong>se processes will go a long way toward<br />
protecting society. They depend heavily on small-scale attention to health by individual<br />
physicians and county public health departments. Above that level, <strong>the</strong> contribution is largely<br />
collation <strong>of</strong> results, though excellent work is <strong>of</strong>ten accomplished by specialized data ga<strong>the</strong>ring<br />
teams at a state or national level in response to particular outbreaks.<br />
Surveillance can contribute to risk assessment, as discussed above, but it should also in<strong>for</strong>m<br />
those who must take action to prevent or limit an outbreak. One example that worked well<br />
recently was <strong>the</strong> evaluation <strong>of</strong> dead crows <strong>for</strong> West Nile virus in <strong>the</strong> U.S. Using a newly<br />
invented dipstick diagnostic device that cost about $2.50 per test, technicians in <strong>the</strong> field were<br />
able to determine infection in dead birds (particularly crows that have very high viremia)<br />
within 15 minutes. As a result, <strong>the</strong>y could call <strong>for</strong> concentration <strong>of</strong> mosquito abatement<br />
resources in those locations where <strong>the</strong> virus was most active. Had <strong>the</strong>re been a delay <strong>of</strong> even a<br />
few days between <strong>the</strong> test and <strong>the</strong> result, <strong>the</strong> consequences would be much less relevant to<br />
those responsible <strong>for</strong> controlling <strong>the</strong> vector mosquitoes.<br />
Prevention and control <strong>of</strong> disease includes <strong>the</strong> myriad activities in education, sanitation,<br />
vaccination, and treatment that stop infection <strong>of</strong> individuals and groups. Some diseases are<br />
easily controlled once detected, and o<strong>the</strong>rs are not. Vaccines are only available <strong>for</strong> a handful <strong>of</strong><br />
pathogens. Some sanitary measures have become entrenched in society, which is a good<br />
development, but <strong>the</strong> public at large has <strong>for</strong>gotten why those measures were started in <strong>the</strong> first<br />
place, which weakens economic support. Treatment is <strong>the</strong> last resort to spare <strong>the</strong> individual and<br />
is a very expensive activity <strong>for</strong> society.<br />
Sustainable support <strong>for</strong> <strong>the</strong> application <strong>of</strong> IDM requires constant input <strong>of</strong> data to <strong>the</strong> medical<br />
system. In <strong>the</strong> best scenarios, <strong>the</strong> medical system continues to pay attention to and be prepared<br />
<strong>for</strong> <strong>the</strong> particular infection. In <strong>the</strong> worst scenarios, <strong>the</strong> skills and materials <strong>for</strong> prevention and<br />
193
treatment are lost until an outbreak motivates to rebuild <strong>the</strong> capability. The current U.S. system<br />
<strong>for</strong> sustainability depends on pr<strong>of</strong>essional advocates like CDC and county public health<br />
<strong>of</strong>ficers.<br />
Integration <strong>of</strong> Contributors<br />
The second function <strong>of</strong> successful IDM would stress integration <strong>of</strong> all <strong>the</strong> contributors to<br />
effective programs. In many situations, <strong>the</strong>re is a large divide between those activities usually<br />
considered clinical (vaccination, treatment, case detection, and recording) and those usually<br />
considered environmental (pollution control, mosquito abatement, wholesale food safety). In<br />
actual practice, a large number <strong>of</strong> people, all with very different backgrounds, are involved in<br />
keeping <strong>the</strong> public healthy, and it is difficult to bring <strong>the</strong>se parties toge<strong>the</strong>r in meaningful ways.<br />
Consider a county-level meeting that includes <strong>the</strong> county’s parks department, public health,<br />
agriculture commissioner, mosquito abatement manager, water district manager, urban<br />
planners, public works manager, and educators. These individuals do not typically share <strong>the</strong><br />
same pr<strong>of</strong>essional languages and may not even recognize <strong>the</strong>ir common purpose in protecting<br />
health. There are many outstanding examples <strong>of</strong> <strong>the</strong>se various groups coordinating <strong>the</strong>ir ef<strong>for</strong>ts;<br />
however, it seems clear that we have a long way to go in this area.<br />
Epidemics Affecting Societal Functions<br />
How likely are we to have epidemics that affect societal functions? In many parts <strong>of</strong> <strong>the</strong> world<br />
affecting <strong>the</strong> majority <strong>of</strong> <strong>the</strong> human population, those epidemics take place already. Malaria<br />
and tuberculosis in Africa, dengue in Sou<strong>the</strong>ast Asia, and diarrheal disease in South Asia cause<br />
great costs to <strong>the</strong> societies involved. Sometimes those costs are accepted with <strong>the</strong> tragic<br />
consequence <strong>of</strong> bad population level health and <strong>the</strong> consequent decrease in economic<br />
development and quality <strong>of</strong> life. On <strong>the</strong> hopeful side, science continues to provide new insights<br />
into disease management, most recently fueled by dramatic advances in genomics. Less<br />
hopefully, populations continue to strain resources available, and <strong>the</strong>re are clear signs that<br />
agriculture and industry are approaching firm limits. In a particularly cruel example <strong>of</strong> a<br />
positive feedback loop, human use <strong>of</strong> fossil fuels has increased uncertainty by initiating a chain<br />
<strong>of</strong> physical effects on climate. One <strong>of</strong> <strong>the</strong> consequences <strong>of</strong> those strains can be greater<br />
susceptibility to epidemics from old and new diseases as <strong>the</strong> science, medical, and<br />
environmental health infrastructure suffers along with <strong>the</strong> rest <strong>of</strong> <strong>the</strong> economy. The possibility<br />
<strong>of</strong> an actual decrease in those infrastructures would make epidemics all <strong>the</strong> more likely as <strong>the</strong><br />
effective means <strong>for</strong> controlling epidemics are lost.<br />
The steps necessary to maintain and improve <strong>the</strong> ability to prevent, manage, and recover from<br />
epidemics are clear enough. First, continued support <strong>of</strong> institutions that have effectively<br />
protected much <strong>of</strong> <strong>the</strong> world population from epidemics is needed. Second, continued support<br />
<strong>of</strong> scientific ef<strong>for</strong>ts driven by curiosity about infectious disease is needed. Third, resources<br />
must be concentrated on public and environmental health, possibly at <strong>the</strong> cost <strong>of</strong> funding <strong>for</strong><br />
advancements in individual medical treatment. Finally, creativity must be focused on solving<br />
<strong>the</strong> problems <strong>of</strong> accomplishing <strong>the</strong> best IDM that is humanly possible.<br />
↑ Back to <strong>the</strong> top<br />
194
1 Reid, A.H., J.K. Taubenberger, and T.G. Fanning. 2004. “Evidence <strong>of</strong> an absence: <strong>the</strong> genetic origins<br />
<strong>of</strong> <strong>the</strong> 1918 pandemic influenza virus.” Nature Reviews Microbiology 2: 909-914.<br />
2 Duffy, G., E. Cummins, P. Nally, S. O’Brien, and F. Butler. 2006. “A review <strong>of</strong> quantitative<br />
microbial risk assessment in <strong>the</strong> management <strong>of</strong> Escherichia coli O157:H7 on beef.” Meat Science<br />
74: 76-88.<br />
3 World Health Organization. 2008. World Malaria Report 2008. WHO/HTM/GMP/2008.1, xvii+190<br />
pp.<br />
4 Moe, J.B., and C.E. Pedersen, Jr. 1980. “The impact <strong>of</strong> rickettsial diseases on military operations.”<br />
Military Medicine 145: 780-785.<br />
5 Hechemy, K.E., and A.F. Azad. 2001. Epidemic typhus. In: Service, M.W. (ed.), Encyclopedia <strong>of</strong><br />
Arthropod-transmitted Infections <strong>of</strong> Man and Domestic Animals. CABI Publishing, NY. Pp. 170-174.<br />
6 Woodall, J. 2001. Chikungunya virus. In: Service, M.W. (ed.), Encyclopedia <strong>of</strong> Arthropodtransmitted<br />
Infections <strong>of</strong> Man and Domestic Animals. CABI Publishing, NY. Pp. 15-19.<br />
7 Pagès F, Peyrefitte CN, Mve MT, Jarjaval F, Brisse S, et al. 2009. “Aedes albopictus Mosquito: The<br />
Main Vector <strong>of</strong> <strong>the</strong> 2007 Chikungunya Outbreak in Gabon.” PLoS ONE 4(3): e4691.<br />
doi:10.1371/journal.pone.0004691.<br />
8 Hawley, W.A. 1988. “The biology <strong>of</strong> Aedes albopictus.” J. Am. Mosquito Control Assoc.<br />
(Supplement) 4: 1-40.<br />
9 Schaffner, F., B. Bouletreau, B. Guillet, J. Guilloteau, and S. Karch. 2001. Aedes albopictus (Skuse,<br />
1894) established in metropolitan France. The European Mosquito Bulletin Issue 9, pp. 1-3.<br />
10 Rezza, G., L. Nicoletti, R. Angelini, R. Romi, A.C. Finarelli, M. Panning, P.Cordioli, C. Fortuna, S.<br />
Boros, F. Magurano, G. Silvi, P. Angelini, M. Dotton, M.G. Ciufolini, G.C. Majon, A. Cassone, <strong>for</strong><br />
<strong>the</strong> CHIKV study group. 2007. “Infection with chikungunya virus in Italy: an outbreak in a temperate<br />
region.” The Lancet 370: 1840-1846.<br />
195
3. Social Science Modeling and Analysis Approaches<br />
3.1. Analyzing Political and Social Regional Stability with Statistics:<br />
Challenges and Opportunities (Victor Asal, Stephen Shellman)<br />
Authors and Organizations: Victor Asal, University at Albany; NYSU; Stephen Shellman,<br />
College <strong>of</strong> William and Mary<br />
Contact In<strong>for</strong>mation: vasal@email.albany.edu; steveshellman@gmail.com<br />
The use <strong>of</strong> statistics in <strong>the</strong> understanding and <strong>for</strong>ecasting <strong>of</strong> political and social regional<br />
stability <strong>of</strong>fers some important advantages and shows important promise as a policy aid in<br />
evaluating possible interventions, but it faces important challenges that need to be overcome in<br />
terms <strong>of</strong> (1) <strong>the</strong> data that are necessary to per<strong>for</strong>m accurate assessments, and (2) <strong>the</strong> best means<br />
to choose <strong>the</strong> most effective methods <strong>for</strong> per<strong>for</strong>ming assessments. 1 (By statistics, we mean <strong>the</strong><br />
use <strong>of</strong> ma<strong>the</strong>matical analysis to identify, quantify, and summarize relations between numerical<br />
values that represent real world observations.) Most importantly, statistical analysis allows <strong>the</strong><br />
application <strong>of</strong> a well-used approach to <strong>the</strong> analysis <strong>of</strong> stability. This permits <strong>the</strong> analyst to put<br />
confidence intervals around <strong>the</strong> possible relationships between <strong>the</strong> possible causes analyzed<br />
and <strong>the</strong> outcome <strong>of</strong> instability, as well as <strong>the</strong> impact <strong>of</strong> possible interventions. This also allows<br />
<strong>the</strong> analyst to appropriately caveat <strong>the</strong> resulting analysis. On <strong>the</strong> o<strong>the</strong>r hand, a statistical<br />
approach requires that <strong>the</strong> in<strong>for</strong>mation to be studied be entered into a spreadsheet <strong>for</strong>mat, as<br />
well as a numerical <strong>for</strong>mat. This may be relatively easy with certain phenomena such as inches<br />
<strong>of</strong> rain a year or <strong>the</strong> gross domestic product <strong>of</strong> a country, but it is much more challenging to<br />
translate such phenomena as discrimination or violence into numbers. Fur<strong>the</strong>rmore, certain<br />
kinds <strong>of</strong> phenomena <strong>of</strong> interest are difficult to study because <strong>of</strong> <strong>the</strong>ir rare occurrence or an<br />
almost complete lack <strong>of</strong> relevant data.<br />
If we understand <strong>the</strong> task <strong>of</strong> analysis to be one <strong>of</strong> explaining <strong>the</strong> phenomena and <strong>of</strong> <strong>for</strong>ecasting<br />
<strong>the</strong> phenomena, statistical work on political and social instability has progressed far in terms <strong>of</strong><br />
explaining what factors are related to instability. However, despite years <strong>of</strong> pioneering work by<br />
a few researchers, <strong>the</strong>re has been very little accomplished in <strong>the</strong> area <strong>of</strong> <strong>for</strong>ecasting related to<br />
political and social instability. This paper provides a brief overview <strong>of</strong> some <strong>of</strong> <strong>the</strong> research on<br />
<strong>the</strong> causes <strong>of</strong> stability and instability conducted using statistical analysis. The paper <strong>the</strong>n<br />
discusses ef<strong>for</strong>ts that have been made in <strong>the</strong> area <strong>of</strong> <strong>for</strong>ecasting. Finally, <strong>the</strong> paper examines <strong>the</strong><br />
challenges related to statistical analysis when it comes to issues <strong>of</strong> data and method.<br />
Explaining<br />
As mentioned above, unlike narratives or comparative case studies or <strong>for</strong>mal models, statistical<br />
analyses <strong>of</strong>fer <strong>the</strong> advantage <strong>of</strong> being able to more <strong>for</strong>mally control a variety <strong>of</strong> competing<br />
factors. 2 Statistical analysis provides a check on opinion by <strong>of</strong>fering a transparent methodology<br />
<strong>for</strong> identifying causal links and by providing confidence intervals around <strong>the</strong> assessments<br />
given. This is true because, while subject matter experts bring a deep reservoir <strong>of</strong> knowledge<br />
about <strong>the</strong>ir subject matter, <strong>the</strong>y “… are not mere objective experts. They develop belief<br />
systems, operational codes, <strong>the</strong>ories, and agendas; <strong>the</strong>y are subject to <strong>the</strong> same cognitive and<br />
social psychological and group dynamics that affect decision makers.” In addition, “Evidence<br />
from surveys suggests that <strong>for</strong>ecasts <strong>of</strong> decisions in conflicts are typically based on experts’<br />
196
unaided judgments.” 3 Studies have found that expert predictions are not better than those made<br />
by non-experts and that <strong>the</strong>y <strong>of</strong>ten ignore data that disagree with <strong>the</strong>ir views. 4,5 Analysts use<br />
statistical methods belief systems about <strong>the</strong>ir subjects as well, but (1) <strong>the</strong> statistical analysis can<br />
act to reject relations that are assumed to be true, (2) <strong>the</strong> transparency <strong>of</strong> <strong>the</strong> approach allows<br />
<strong>for</strong> o<strong>the</strong>rs to check <strong>the</strong>ir analysis and to incorporate o<strong>the</strong>r measures to identify different<br />
dynamics at work in a clear fashion.<br />
The growing sources <strong>of</strong> cross-national data have led to a greater use <strong>of</strong> statistics, <strong>for</strong> if <strong>the</strong>re are<br />
no numbers, relevant data need to be collected, or statistical analysis cannot be used. Not only<br />
has <strong>the</strong>re been enormous growth in <strong>the</strong> area <strong>of</strong> hand-coded data sets, but developments in<br />
automated coding have allowed <strong>for</strong> a much more intense focus on event analysis. 6,7,8 In<br />
addition to <strong>the</strong> greater availability <strong>of</strong> data, <strong>the</strong>re has been a growing sophistication in <strong>the</strong><br />
methods used that have been facilitated by technological developments, especially in <strong>the</strong> area<br />
<strong>of</strong> dealing with <strong>the</strong> challenges created by time-series cross-sectional data. 9<br />
Recent research has found important correlations between political violence and o<strong>the</strong>r <strong>for</strong>ms <strong>of</strong><br />
instability. For example, <strong>the</strong>re is evidence that certain kinds <strong>of</strong> geographic attributes<br />
(mountainous terrain) make violence more likely, 10 that institutional arrangements crucial <strong>for</strong><br />
economic development are more likely (or less likely), 11 and that whe<strong>the</strong>r civilians become<br />
displaced in <strong>the</strong> first place and whe<strong>the</strong>r <strong>the</strong>y end up as internally displaced or become<br />
international refugees (a key source <strong>of</strong> instability) is impacted by <strong>the</strong> kind <strong>of</strong> violence and <strong>the</strong><br />
actor (state or non-state violence) perpetrating <strong>the</strong> violence. 12,13 Indeed <strong>the</strong>re is an enormous<br />
literature using statistics to analyze different aspects <strong>of</strong> political and social instability,<br />
particularly in <strong>the</strong> area <strong>of</strong> <strong>the</strong> likelihood <strong>of</strong> political violence. For example, in addition to<br />
mountainous terrain, 14 natural disasters, 15 economic conditions 16 (especially low income<br />
levels 17 ), regional conditions <strong>of</strong> conflict or stability, 18 types <strong>of</strong> natural resources, 19 and<br />
discrimination 20 have all been found to have an impact on <strong>the</strong> likelihood <strong>of</strong> political violence.<br />
As <strong>the</strong> list above suggests, a great deal <strong>of</strong> work has been done identifying country-level factors<br />
that lead to political and social instability. It is important to note that much <strong>of</strong> this analysis<br />
focuses on <strong>the</strong> state level <strong>of</strong> analysis. This primary focus on <strong>the</strong> state level constrains <strong>the</strong><br />
analysis <strong>for</strong> two reasons. First, as Gleditsch argues, instability is <strong>of</strong>ten a regional affair and can<br />
spread from one country to ano<strong>the</strong>r. 21 For example, <strong>the</strong> risk <strong>of</strong> civil war is a result not only <strong>of</strong><br />
<strong>the</strong> character <strong>of</strong> <strong>the</strong> country but <strong>the</strong> nature <strong>of</strong> <strong>the</strong> links that country has with o<strong>the</strong>r countries. 22<br />
Salehyan, <strong>of</strong>fering support <strong>for</strong> <strong>the</strong> importance <strong>of</strong> <strong>the</strong> regional context, identifies a series <strong>of</strong><br />
international factors, and in particular <strong>the</strong> presence <strong>of</strong> refugees, impacts domestic conflict.<br />
Amongst o<strong>the</strong>r transnational factors, Salehyan finds that refugee diasporas increase <strong>the</strong><br />
likelihood <strong>of</strong> a rebellion. 23 Second, instability is <strong>of</strong>ten does not “happen” at <strong>the</strong> state level but<br />
is tied to a particular geographic area or population within a country and thus <strong>the</strong> country level<br />
<strong>of</strong> analysis may obscure what is going on. 24 (The data section <strong>of</strong> this paper expands upon this<br />
point.)<br />
Forecasting<br />
Almost all <strong>of</strong> <strong>the</strong> analysis discussed up until now has focused on identifying potential causal<br />
relations between different factors and different types <strong>of</strong> instability. This kind <strong>of</strong> analysis<br />
allows <strong>for</strong> <strong>the</strong> identification <strong>of</strong> “danger signs” and provides a better understanding <strong>of</strong> <strong>the</strong><br />
regional and state-level playing field if conditions should change. What is missing in much <strong>of</strong><br />
<strong>the</strong> literature that is important particularly from a policy perspective is an ef<strong>for</strong>t to go beyond<br />
197
what in-sample analysis will allow. To attempt to <strong>for</strong>ecast likely outcomes <strong>the</strong>re is a need to go<br />
beyond in-sample analysis and do out-<strong>of</strong>-sample analysis by partitioning <strong>the</strong> data. 25 What this<br />
means is that most people who have studied political and social instability have used all <strong>the</strong><br />
data <strong>the</strong>y have in one analysis, producing a model that fits all <strong>the</strong>ir data. In-sample and out-<strong>of</strong>sample<br />
analysis means that <strong>the</strong> analyst partitions <strong>the</strong> data and builds a model with one part <strong>of</strong><br />
<strong>the</strong> data and <strong>the</strong>n uses <strong>the</strong> o<strong>the</strong>r part <strong>of</strong> <strong>the</strong> data to see how well <strong>the</strong> model constructed on<br />
different data fits different data. If <strong>the</strong> model works “well” on data that were not used to<br />
construct it, <strong>the</strong>n <strong>the</strong>re is a strong possibility that it will work well on o<strong>the</strong>r data, and most<br />
importantly, it may be able to <strong>for</strong>ecast into <strong>the</strong> future with some degree <strong>of</strong> accuracy.<br />
We should note that advances in this kind <strong>of</strong> <strong>for</strong>ecasting research have <strong>of</strong>ten been hampered by<br />
a lack <strong>of</strong> collaboration across disciplines, with computational and social scientists rarely<br />
working toge<strong>the</strong>r. 26 This kind <strong>of</strong> collaboration between social scientists, who are experts in <strong>the</strong><br />
phenomena and <strong>the</strong> <strong>the</strong>ories related to political and social instability, with computational social<br />
scientists, who focus on advancing sophisticated analysis methods, is beginning to happen<br />
more frequently and hopefully will result in advances <strong>of</strong> this kind <strong>of</strong> analysis in <strong>the</strong> near future.<br />
Despite <strong>the</strong> lack <strong>of</strong> focus on this kind <strong>of</strong> research amongst most social scientists, <strong>the</strong> ef<strong>for</strong>ts <strong>of</strong><br />
researchers that have attempted to go beyond in-sample analysis have produced very<br />
interesting and substantive results. 27,28,29,30 For example, O'Brien examines which factors lead<br />
to conflict and instability. O'Brien focuses on structural factors using a pattern classification<br />
approach, as well as an in-sample out-<strong>of</strong>-sample-approach to identify how well his model can<br />
<strong>for</strong>ecast <strong>the</strong> likelihood <strong>of</strong> instability. Using factors like GDP per capita, infant mortality,<br />
democracy, political and civil rights, and <strong>the</strong> presence <strong>of</strong> a youth bulge, his model is about 80%<br />
accurate in its predictions. 31 Bennett and Stam’s analysis <strong>of</strong> <strong>the</strong> likely time <strong>for</strong> <strong>the</strong> conventional<br />
war in Iraq in 2003 illustrates some <strong>of</strong> <strong>the</strong> advantages and challenges <strong>of</strong> this kind <strong>of</strong> work. The<br />
invasion <strong>of</strong> Iraq is a classic example <strong>of</strong> both an important intervention in an unstable region, as<br />
well as a key example <strong>of</strong> how interventions can have unintended consequences. Using a model<br />
created <strong>for</strong> explaining war duration, in March 2003, Bennett and Stam took “…<strong>the</strong> coefficient<br />
estimates from it and make a prediction about <strong>the</strong> duration <strong>of</strong> <strong>the</strong> ongoing war with Iraq.” 32<br />
Presenting a variety <strong>of</strong> scenarios based on different statistical analyses, <strong>the</strong> Bennett and Stam<br />
prediction was between 27 days and 2.5 months. As <strong>the</strong> authors recognize, <strong>the</strong> analysis is<br />
dependent on making contingent estimates about <strong>the</strong> likely terrain where key battles will be<br />
fought and <strong>the</strong> strategies used by <strong>the</strong> opponents. None<strong>the</strong>less, <strong>the</strong> per<strong>for</strong>mance <strong>of</strong> <strong>the</strong> model,<br />
when focused on one particular case projecting into <strong>the</strong> future, is not bad, especially since <strong>the</strong><br />
original model was not designed <strong>for</strong> <strong>for</strong>ecasting. The more difficult challenge though, as <strong>the</strong><br />
authors recognize, is to do <strong>the</strong> same kind <strong>of</strong> analysis <strong>for</strong> <strong>the</strong> insurgency phase <strong>of</strong> <strong>the</strong> conflict. In<br />
this circumstance, Bennett and Stam predicted in 2005 that this phase <strong>of</strong> <strong>the</strong> conflict would last<br />
seven years (83 months). (Bennett and Stam also go on to predict <strong>the</strong> likely length <strong>of</strong> possible wars<br />
between <strong>the</strong> United States Syria or between <strong>the</strong> United States and North Korea.) 33 Like all such<br />
predictions (and this is one <strong>of</strong> <strong>the</strong> reasons that <strong>for</strong>ecasting is a daunting task within <strong>the</strong><br />
academic context with certain types <strong>of</strong> rewards and punishments), this can only be validated in<br />
hindsight.<br />
Data<br />
Whe<strong>the</strong>r explaining or trying to <strong>for</strong>ecast political or social instability, all statistical approaches<br />
face particular challenges. One challenge is that existing data are not <strong>of</strong>ten shared. For<br />
example, it is only within <strong>the</strong> last several years that data on domestic terrorist behavior have<br />
198
ecome publically available (see http://www.start.umd.edu/gtd/ and http://wits.nctc.gov/ ) such<br />
that researchers can use and report on <strong>the</strong>ir results, including methodologies <strong>for</strong> how <strong>the</strong>y<br />
coded and trans<strong>for</strong>med <strong>the</strong> data. 34 Key advantages <strong>of</strong> statistics are that (1) <strong>the</strong> results are<br />
transparent and easily replicable, and (2) results are open to a modification <strong>of</strong> assumptions.<br />
There<strong>for</strong>e, <strong>the</strong> free availability <strong>of</strong> data is crucial to maximize <strong>the</strong> utility <strong>of</strong> this kind <strong>of</strong> analysis.<br />
When data are used that cannot be shared, a secondary check on <strong>the</strong> analysis is not possible.<br />
The increasing public availability <strong>of</strong> all kinds <strong>of</strong> data, as well as <strong>the</strong> increasing aggregation <strong>of</strong><br />
useful data, is greatly benefitting <strong>the</strong> study <strong>of</strong> instability.<br />
As mentioned above, ano<strong>the</strong>r key challenge has been a lack <strong>of</strong> numerical data, particularly at<br />
<strong>the</strong> sub-state level regarding non-state actors. In order <strong>for</strong> statistical analysis to be used at <strong>the</strong><br />
sub-state level, <strong>the</strong>re is a need <strong>for</strong> a great deal more geographic data, as well as coding at <strong>the</strong><br />
non-state actor level. While <strong>the</strong> collection <strong>of</strong> event data involving violence has enhanced our<br />
knowledge <strong>of</strong> this violence, we cannot get traction on understanding <strong>the</strong> data without more data<br />
about <strong>the</strong> groups <strong>the</strong>mselves, in addition to data only on <strong>the</strong>ir behaviors.<br />
For example, when it comes to <strong>the</strong> destabilizing phenomena <strong>of</strong> terrorism, most <strong>of</strong> <strong>the</strong> statistical<br />
literature examines what factors account <strong>for</strong> <strong>the</strong> amount <strong>of</strong> terrorism in a country or how much<br />
terrorism a country “exports.” 35 While this kind <strong>of</strong> analysis is useful <strong>for</strong> some policy issues, it<br />
obscures <strong>the</strong> important issue <strong>of</strong> how or why <strong>the</strong> organizations or groups who are actually<br />
carrying out <strong>the</strong> destabilizing behavior act in certain ways. 36 To draw an analogy, we know that<br />
<strong>the</strong> structure <strong>of</strong> a state impacts how it uses violence. Democracies, <strong>for</strong> example, are much less<br />
likely to target o<strong>the</strong>r democracies <strong>for</strong> violence. 37 When it comes to understanding violent nonstate<br />
actors and how <strong>the</strong>ir attributes impact <strong>the</strong>ir behavior <strong>the</strong> data that does exist is very<br />
sparse. Using this data Asal and Re<strong>the</strong>meyer have found that organizations that are large, very<br />
networked and religious are more likely to be very lethal.(The data outlining terrorist<br />
organizational attributes is available upon request by emailing vasal@email.albany.edu.) 38,39<br />
Un<strong>for</strong>tunately, this analysis must be caveated because <strong>the</strong> data that do exist are only <strong>for</strong> one<br />
observation per group and are limited to <strong>the</strong> time frame <strong>of</strong> 1998–2005. With this kind <strong>of</strong><br />
limited data, <strong>for</strong>ecasting is simply impossible. More robust data over a longer time period<br />
would allow <strong>for</strong> a much broader analysis and would also allow <strong>for</strong> attempts at <strong>for</strong>ecasting. In<br />
order <strong>for</strong> statistics to contribute more fruitfully to an analysis <strong>of</strong> social and political instability,<br />
<strong>the</strong> lack <strong>of</strong> sub-state data needs to be addressed.<br />
Ano<strong>the</strong>r issue with data is how a concept is operationalized (i.e., how is a concept like<br />
discrimination is turned into a number that can <strong>the</strong>n be analyzed). There is a preponderance <strong>of</strong><br />
literature indicating that when groups are <strong>the</strong> subject <strong>of</strong> discrimination from governments, <strong>the</strong>y<br />
are more likely to use violence in <strong>the</strong> pursuit <strong>of</strong> <strong>the</strong>ir political goals. 40 The problem is how <strong>the</strong><br />
statistician operationalizes discrimination. Several researchers have created proxies <strong>for</strong><br />
discrimination using ethnic fractionalization as a measure, and <strong>the</strong>y have found that it does not<br />
lead to more violence in a country. 41,42 The finding is suspect because, while ethnic<br />
fractionalization may lead to a group being more likely to suffer discrimination, it is not <strong>the</strong><br />
same as discrimination. Regan and Norton’s analysis at <strong>the</strong> group level found that indeed<br />
discrimination is a significant contributor to ethnic violence 43 as has Wimmer and Min at <strong>the</strong><br />
state level. 44 On <strong>the</strong> o<strong>the</strong>r hand, <strong>the</strong> data that both <strong>of</strong> <strong>the</strong>se papers used are limited in that <strong>the</strong>y<br />
only consider discrimination <strong>of</strong> certain kinds <strong>of</strong> groups, which may create issues <strong>of</strong> selection<br />
bias. This finding <strong>of</strong> selection bias has led to a large ef<strong>for</strong>t to code a broader set <strong>of</strong> ethnic<br />
199
groups. 45 This examination <strong>of</strong> operationalization underlines both <strong>the</strong> utility and <strong>the</strong> importance<br />
<strong>of</strong> <strong>the</strong> transparency that is possible using a statistical approach.<br />
Method<br />
As mentioned above, advances in time series analysis, advances in controlling <strong>for</strong> different<br />
kinds <strong>of</strong> data, and automated coding have allowed analysis to move from aggregate countrylevel<br />
analysis to weekly <strong>for</strong>ecasting models that can focus on one particular country. 46 These<br />
multi-equation modeling approaches using time series data open <strong>the</strong> possibility <strong>for</strong> <strong>the</strong><br />
construction <strong>of</strong> early warning models that can draw on <strong>the</strong> broad literature and new sources <strong>of</strong><br />
data and new methods to construct useful policy tools.<br />
In <strong>the</strong> same way that real benefits are likely to arise from <strong>the</strong> collaboration <strong>of</strong> computational<br />
scientists and social scientists, it is clear that multi-methodological approaches that marry<br />
statistical analysis to o<strong>the</strong>r kinds <strong>of</strong> analysis make it possible to create hybrid analyses that<br />
allow <strong>for</strong> <strong>for</strong>mal <strong>the</strong>ory, narrative evidence, and quantitative analysis to identify <strong>the</strong> complex<br />
causes <strong>of</strong> instability. One area that was addressed briefly above but should be highlighted here<br />
is <strong>the</strong> need to integrate <strong>the</strong> geospatial component much more strongly in into statistical<br />
analysis. Drawing on this kind <strong>of</strong> analysis, <strong>for</strong> example, Sambanis finds that inter-regional<br />
inequality is a much better predictor <strong>of</strong> civil war than national measures <strong>of</strong> inequality. 47 In<br />
addition, <strong>the</strong>re is a need to integrate social network analysis much more fully into <strong>the</strong> study <strong>of</strong><br />
instability. While networks have <strong>of</strong>ten been used as a <strong>the</strong>oretical construct in studying issues<br />
related to instability, 48 <strong>the</strong> actual method has not been integrated as much, although that has<br />
started to change. 49,50,51 52,53 Maoz was able to identify network alliance polarization as a key<br />
factor in <strong>the</strong> increase <strong>of</strong> international conflict. 54<br />
Conclusion<br />
This short overview cannot fully address many <strong>of</strong> <strong>the</strong> ef<strong>for</strong>ts underway and <strong>the</strong> complexity <strong>of</strong><br />
some <strong>of</strong> <strong>the</strong> methodological challenges faced in trying to analyze and <strong>for</strong>ecast. Statistical<br />
analysis may benefit from increasing <strong>the</strong> focus on <strong>the</strong> need <strong>for</strong> more and better open source and<br />
shared sub-national disaggregated data collection across space and time. The current paucity is<br />
beginning to be filled by more aggressive hand coding and more sophisticated automated<br />
coding technology. These ef<strong>for</strong>ts are enabling disaggregation to <strong>the</strong> daily and city levels. If<br />
<strong>the</strong>se data are publicly shared and <strong>the</strong>re is increased collaboration across <strong>the</strong> sciences, <strong>the</strong>re is<br />
much that statistical analysis will have to <strong>of</strong>fer to policymakers at <strong>the</strong> national and<br />
multinational levels.<br />
↑ Back to <strong>the</strong> top<br />
1 Mazarr, Michael J. 2007. “The Iraq War and Agenda Setting.” Foreign Policy Analysis 3(1): 1-23.<br />
2 Hechter, M., and D. Okamoto. 2001. “Political Consequences <strong>of</strong> Minority Group Formation.” Annual<br />
Review <strong>of</strong> Political Science 4 (1):189‐215.<br />
3 Green, K. C. and J. S. Armstrong (2007). “The Ombudsman: Value <strong>of</strong> Expertise <strong>for</strong> Forecasting<br />
Decisions in Conflicts.” Interfaces 37(3): 287.<br />
4 Tetlock, P. E. (1999). “Theory-Driven Reasoning About Plausible Pasts and Probable Futures in<br />
World Politics: Are We Prisoners <strong>of</strong> Our Preconceptions?” American Journal <strong>of</strong> Political Science<br />
43(2): 335-366.<br />
200
5 Green, K. C. and J. S. Armstrong (2007). “The Ombudsman: Value <strong>of</strong> Expertise <strong>for</strong> Forecasting<br />
Decisions in Conflicts.” Interfaces 37(3): 287.<br />
6 Gerner, D. J., P. A. Schrodt, et al. (1994). “The analysis <strong>of</strong> political events using machine coded data.”<br />
International Studies Quarterly 38(1): 91-119.<br />
7 Schrodt, P. A. and D. J. Gerner (1994). “Validity Assessment <strong>of</strong> a Machine-Coded Event Data Set <strong>for</strong><br />
<strong>the</strong> Middle East, 1982-92.” American Journal <strong>of</strong> Political Science 38(3): 825-854.<br />
8 Schrodt, P. A. and D. J. Gerner (2004). “An Event Data Analysis <strong>of</strong> Third-Party Mediation in <strong>the</strong><br />
Middle East and Balkans.” Journal <strong>of</strong> Conflict Resolution 48(3): 310.<br />
9 Beck, N. and J. N. Katz (1995). “What to do (and not to do) with time-series cross-section data.”<br />
American Political Science Review 89(3): 634-647.<br />
10 Fearon, J. and D. Laitin. (2003). “Ethnicity, Insurgency, and Civil War Replication data.” Retrieved<br />
April 3 2004, 2004, from http://www.stan<strong>for</strong>d.edu/~jfearon/.<br />
11 Rodrik, D., A. Subramanian, et al. (2004). “Institutions rule: <strong>the</strong> primacy <strong>of</strong> institutions over<br />
geography and integration in economic development.” Journal <strong>of</strong> Economic Growth 9(2): 131-165.<br />
12 Moore, W. H. and S. M. Shellman (2004). “Fear <strong>of</strong> Persecution: Forced Migration, 1952-1995.”<br />
Journal <strong>of</strong> Conflict Resolution 48(5): 723-745.<br />
13 Moore, W. and S. Shellman (2006). “Refugee or Internally Displaced Person?: To Where Should One<br />
Flee?” Comparative Political Studies 39(5): 599.<br />
14 Fearon, J. and D. Laitin. (2003). “Ethnicity, Insurgency, and Civil War Replication Data.” Retrieved<br />
April 3 2004, 2004, from http://www.stan<strong>for</strong>d.edu/~jfearon/.<br />
15 Nel, P. and M. Righarts (2008). “Natural Disasters and <strong>the</strong> Risk <strong>of</strong> Violent Civil Conflict.”<br />
International Studies Quarterly 52(1): 159-185.<br />
16 Blomberg, S. B., G. D. Hess, et al. (2004). “Economic conditions and terrorism.” European Journal<br />
<strong>of</strong> Political Economy 20(2): 463-478.<br />
17 Hegre, H. and N. Sambanis (2006). “Sensitivity analysis <strong>of</strong> empirical results on civil war onset.”<br />
Journal <strong>of</strong> Conflict Resolution 50(4): 508.<br />
18 Gleditsch, K. S. (2002). All International Politics Is Local: The Diffusion <strong>of</strong> Conflict, Integration, and<br />
Democratization. Ann Arbor: University <strong>of</strong> Michigan Press.<br />
19 Humphreys, M. (2005). “Natural resources, conflict, and conflict resolution: Uncovering <strong>the</strong><br />
mechanisms.” Journal <strong>of</strong> Conflict Resolution 49(4): 508.<br />
20 Regan, P. M. and D. Norton (2005). “Greed, Grievance, and Mobilization in Civil Wars.” Journal <strong>of</strong><br />
Conflict Resolution 49(3): 319-336.<br />
21 Gleditsch, K. S. (2002). All International Politics Is Local: The Diffusion <strong>of</strong> Conflict, Integration, and<br />
Democratization. Ann Arbor: University <strong>of</strong> Michigan Press.<br />
22 Gleditsch, K. and M. Ward (2006). "Diffusion and <strong>the</strong> international context <strong>of</strong> democratization."<br />
International Organization 60(04): 911-933.<br />
23 Salehyan, I. (2007). "Transnational Rebels: Neighboring States as Sanctuary <strong>for</strong> Rebel Groups."<br />
World Politics 59(2): 217-242.<br />
24 Weidmann, N. (2007). Group Concentration and Ethnic Conflict: An Empirical Study.<br />
25 King, G. and L. Zeng (2001). "Improving Forecasts <strong>of</strong> State Failure." World Politics 53(4): 623-658.<br />
26 Bankes, S., R. Lempert, et al. (2002). "Making Computational Social Science Effective:<br />
Epistemology, Methodology, and Technology." Social Science Computer Review 20(4): 377.<br />
27 Schrodt, P. A. (2000). Pattern Recognition <strong>of</strong> International Crises Using Hidden Markov Models.<br />
Political Complexity: Nonlinear Models <strong>of</strong> Politics.<br />
28 King, G. and L. Zeng (2001). "Improving Forecasts <strong>of</strong> State Failure." World Politics 53(4): 623-658.<br />
29 O'Brien, S. P. (2002). "Anticipating <strong>the</strong> Good, <strong>the</strong> Bad, and <strong>the</strong> Ugly: An Early Warning Approach to<br />
Conflict and Instability Analysis." Journal <strong>of</strong> Conflict Resolution 46(6): 791-811.<br />
30 Bennett, D. S. and A. C. Stam (2006). "Predicting <strong>the</strong> Length <strong>of</strong> <strong>the</strong> 2003 US–Iraq War." Foreign<br />
Policy Analysis 2(2): 101-116.<br />
201
31 O'Brien, S. P. (2002). "Anticipating <strong>the</strong> Good, <strong>the</strong> Bad, and <strong>the</strong> Ugly: An Early Warning Approach to<br />
Conflict and Instability Analysis." Journal <strong>of</strong> Conflict Resolution 46(6): 791-811.<br />
32 Bennett, D. S. and A. C. Stam (2006). "Predicting <strong>the</strong> Length <strong>of</strong> <strong>the</strong> 2003 US–Iraq War." Foreign<br />
Policy Analysis 2(2): 101-116. (The original analysis can be found at<br />
http://www.personal.psu.edu/dsb10/warduration/Report-Iraq_War_Duration_2003.pdf.)<br />
33 Bennett, D. S. and A. C. Stam (2006). "Predicting <strong>the</strong> Length <strong>of</strong> <strong>the</strong> 2003 US–Iraq War." Foreign<br />
Policy Analysis 2(2): 101-116. (The original analysis can be found at<br />
http://www.personal.psu.edu/dsb10/warduration/Report-Iraq_War_Duration_2003.pdf.)<br />
34 LaFree, G. and L. Dugan (2007). “Introducing <strong>the</strong> Global Terrorism Database.” Terrorism and<br />
Political Violence 19(2): 181 - 204.<br />
35 Enders, W. and T. Sandler (2006). The Political Economy <strong>of</strong> Terrorism, Cambridge University Press.<br />
36 Asal, V. and R. K. Re<strong>the</strong>meyer (2008). "Dilettantes, Ideologues, and <strong>the</strong> Weak: Terrorists Who Don't<br />
Kill." Conflict Management and Peace Science 25(3): 244-263.<br />
37 Huth, P. K. and T. L. Allee (2003). The Democratic Peace and Territorial Conflict in <strong>the</strong> Twentieth<br />
Century. Cambridge, Cambridge University Press.<br />
38 Asal, V. and R. K. Re<strong>the</strong>meyer (2008). "Dilettantes, Ideologues, and <strong>the</strong> Weak: Terrorists Who Don't<br />
Kill." Conflict Management and Peace Science 25(3): 244-263.<br />
39 Asal, V. and R. K. Re<strong>the</strong>meyer (2008). "The Nature <strong>of</strong> <strong>the</strong> Beast: Terrorist Organizational<br />
Characteristics and Organizational Lethality." Journal <strong>of</strong> Politics 70(2): 437-449.<br />
40 Gurr, T. R. (2000). People vs. States. Washington D.C, United States Institute <strong>of</strong> Peace.<br />
41 Collier, P. (2002). Greed and Grievance in Civil Wars. Working Paper Series In 2002-01. Ox<strong>for</strong>d,<br />
Centre <strong>for</strong> <strong>the</strong> Study <strong>of</strong> African Economies.<br />
42 Fearon, J. and D. Laitin. (2003). "Ethnicity, Insurgency, and Civil War Replication data." Retrieved<br />
April 3 2004, 2004, from http://www.stan<strong>for</strong>d.edu/~jfearon/.<br />
43 Regan, P. M. and D. Norton (2005). "Greed, Grievance, and Mobilization in Civil Wars." Journal <strong>of</strong><br />
Conflict Resolution 49(3): 319-336.<br />
44 Wimmer, A. and B. Min (2006). "From Empire to Nation-State: Explaining Wars in <strong>the</strong> Modern<br />
World, 1816–2001." American Sociological Review 71(6): 867-897.<br />
45 Birnir, J. and J. Wilkenfeld (2007). Minorities at Risk: Addressing Selection Bias Issues and Group<br />
Inclusion Criteria <strong>for</strong> Ethnopolitical Research. University <strong>of</strong> Maryland, <strong>National</strong> Science Foundation.<br />
46 Shellman, S. and B. Stewart (2007). "Predicting Risk Factors Associated with Forced Migration: An<br />
Early Warning Model <strong>of</strong> Haitian Flight." Civil Wars 9(2): 174-199.<br />
47 Sambanis, N. (2004). "Poverty and <strong>the</strong> Organization <strong>of</strong> Political Violence." Brookings Trade Forum<br />
2004: 165-211.<br />
48 Keck, M. E. and K. Sikkink (1999). Transnational advocacy networks in international and regional<br />
politics. International Social Science Journal, Blackwell Publishing Limited. 51: 89.<br />
49 Maoz, Z. (2001). "Democratic Networks: Connecting <strong>National</strong>, Dyadic, and Systemic Levels <strong>of</strong><br />
Analysis in <strong>the</strong> Study <strong>of</strong> Democracy and War." War in a Changing World: 143–182.<br />
50 Maoz, Z., R. D. Kuperman, et al. (2006). "Structural Equivalence and International Conflict: A Social<br />
Networks Analysis." Journal <strong>of</strong> Conflict Resolution 50(5): 664.<br />
51 Maoz, Z. (2006). "Network Polarization, Network Interdependence, and International Conflict, 1816-<br />
2002." Journal <strong>of</strong> Peace Research 43(4): 391.<br />
52 Asal, V. and R. K. Re<strong>the</strong>meyer (2008). "Dilettantes, Ideologues, and <strong>the</strong> Weak: Terrorists Who Don't<br />
Kill." Conflict Management and Peace Science 25(3): 244-263.<br />
53 Asal, V. and R. K. Re<strong>the</strong>meyer (2008). "The Nature <strong>of</strong> <strong>the</strong> Beast: Terrorist Organizational<br />
Characteristics and Organizational Lethality." Journal <strong>of</strong> Politics 70(2): 437-449.<br />
54 Maoz, Z. (2006). "Network Polarization, Network Interdependence, and International Conflict, 1816-<br />
2002." Journal <strong>of</strong> Peace Research 43(4): 391.<br />
202
3.2. The Social Stability <strong>of</strong> Societies: An Anthropological View (Lawrence<br />
Kuznar)<br />
Author and Organization: Lawrence A. Kuznar, <strong>National</strong> Security Innovations, Inc.<br />
Contact In<strong>for</strong>mation: lkuznar@nsiteam.com<br />
The features <strong>of</strong> a society that promote its stability become apparent when <strong>the</strong>y fail and lead to<br />
instability and collapse. Evidence <strong>of</strong> social collapse, on large or small scales, is commonplace in<br />
<strong>the</strong> news today. Somalia is <strong>the</strong> world's most failed state. 1 Indigenous Peruvians riot and attack<br />
police over oil drilling leases. 2 The global economy is in a tailspin. Certainly, insight into <strong>the</strong><br />
drivers <strong>of</strong> social stability or instability can be gleaned from <strong>the</strong>se contemporary examples.<br />
However, instability does not emerge overnight, and longer term historical perspectives are<br />
necessary to understand <strong>the</strong> latent factors that <strong>of</strong>ten slowly accumulate and <strong>the</strong>n result in<br />
dramatic social collapse. Anthropology is a field that provides this deep, historical perspective<br />
on social collapse and instability, and this chapter reviews insights that anthropologists have<br />
gained concerning why some societies fail and o<strong>the</strong>rs prosper.<br />
The most essential findings <strong>of</strong> anthropological analyses implicate (1) a combination <strong>of</strong> changes<br />
in <strong>the</strong> material support <strong>for</strong> a society (especially environmental support), and (2) <strong>the</strong> ways that<br />
natural patterns <strong>of</strong> human decision making subvert effective social responses to change.<br />
This chapter begins with a review <strong>of</strong> basic anthropological <strong>the</strong>ory concerning <strong>the</strong> support <strong>of</strong><br />
social systems and a consideration <strong>of</strong> <strong>the</strong> role environment and natural resources <strong>of</strong>ten play in<br />
sustaining <strong>the</strong>m. Then, a brief overview <strong>of</strong> <strong>the</strong>ories <strong>of</strong> social collapse is presented, outlining <strong>the</strong><br />
key factors that are involved in social collapse. The role <strong>of</strong> human decision making is reviewed<br />
to highlight how even obvious and solvable social problems <strong>of</strong>ten go unresolved. The factors<br />
identified by anthropologists are also compared to social stability factors identified elsewhere in<br />
this volume (see Hewitt, Rieger). Finally, <strong>the</strong>se factors are illustrated with a brief example <strong>of</strong><br />
social unrest in Iran in June and July 2009.<br />
A Social Ontology<br />
What constitutes a society or culture and what supports it? There is no clear consensus in <strong>the</strong><br />
anthropological community, although repeated analyses consistently identify similar factors.<br />
The clearest and most consistent frameworks have elements <strong>of</strong> a cultural materialist paradigm,<br />
in which <strong>the</strong> most basic factors undergirding a society are material, upon which people construct<br />
social structures and systems <strong>of</strong> values. 3,4,5 From this point <strong>of</strong> view, societies come into being as<br />
people employ technologies and social organizations to harvest food and shelter from <strong>the</strong><br />
environment, and to provide access to mates and security <strong>for</strong> <strong>the</strong>ir families (Figure 3.2.A-1).<br />
People in turn construct rituals and ideological systems that rein<strong>for</strong>ce <strong>the</strong> social relationships<br />
and values that provide <strong>for</strong> <strong>the</strong>ir material, biological and security needs. Within this framework,<br />
<strong>the</strong>re is room <strong>for</strong> feedback from <strong>the</strong> ideological and ritual levels back upon <strong>the</strong> social and<br />
technological, although <strong>the</strong> primary causal influence is from material factors to social to<br />
ideological factors. Despite <strong>the</strong> fact that many anthropologists prefer to begin <strong>the</strong>ir analyses <strong>of</strong><br />
culture at an ideological level, <strong>the</strong> cultural materialist paradigm has proven to be an extremely<br />
robust analytical framework <strong>for</strong> which <strong>the</strong>re are no major contradictory analyses. 6<br />
203
Figure 3.2.A-1. Simplified Cultural Materialist Ontology.<br />
A key component <strong>of</strong> a cultural materialist paradigm is recognition that environmental factors<br />
<strong>of</strong>ten play a pivotal role in social stability; stable and productive environmental resources are a<br />
necessary component <strong>for</strong> a sustainably stable social system. A social system can experience<br />
instability in a permissive environment if social relations that promote trade and/or political<br />
stability are undermined (see Hewitt, Rieger, this volume). However, whenever <strong>the</strong>re are major<br />
environmental changes that undermine <strong>the</strong> flow <strong>of</strong> goods and wealth in a society, social<br />
instability is guaranteed.<br />
The cultural materialist paradigm is useful not only as a scientifically defensible view <strong>of</strong> society,<br />
but also because this paradigm explicitly identifies <strong>the</strong> factors that support a society; implicitly,<br />
<strong>the</strong> absence or failure <strong>of</strong> <strong>the</strong>se factors are what <strong>the</strong>oretically cause social instability and collapse.<br />
Theories <strong>of</strong> Social Collapse<br />
Anthropological <strong>the</strong>ories <strong>of</strong> social collapse can be found in <strong>the</strong> ancient writings <strong>of</strong> <strong>the</strong> Greek<br />
historian Herodotus, <strong>the</strong> medieval writings <strong>of</strong> <strong>the</strong> Arab scholar Ibn Khaldun, and in Edward<br />
Gibbon’s 18 th century Rise and Fall <strong>of</strong> <strong>the</strong> Roman Empire. Anthropologists have long held a<br />
fascination with studies on <strong>the</strong> rise and fall <strong>of</strong> civilization studies, and one landmark analysis is<br />
Tainter’s comparative analysis <strong>of</strong> <strong>the</strong> collapse <strong>of</strong> Roman civilization, <strong>the</strong> Anasazi <strong>of</strong> <strong>the</strong><br />
American southwest, and <strong>the</strong> ancient Maya. 7 Tainter's <strong>the</strong>sis is that as societies confront<br />
problems, such as diminishing agricultural yields, people invent higher levels <strong>of</strong> social<br />
complexity to solve <strong>the</strong> problems. These higher <strong>for</strong>ms <strong>of</strong> complexity include social and<br />
economic differentiation, development <strong>of</strong> increasingly complex <strong>for</strong>ms <strong>of</strong> symbolic<br />
communication, and <strong>the</strong> invention <strong>of</strong> non-productive bureaucrats to address problems. While<br />
<strong>the</strong>se measures may help to solve social problems in <strong>the</strong> short run, <strong>the</strong>ir marginal costs become<br />
too great <strong>for</strong> a society to bear, resulting in <strong>the</strong> collapse <strong>of</strong> <strong>the</strong> social system as it existed.<br />
204
The most recent comprehensive analysis <strong>of</strong> social collapse is Jared Diamond’s Collapse: How<br />
Societies Choose to Fail or Succeed. 8 Diamond departs from Tainter's focus on marginal returns<br />
and focuses instead on environmental factors and failures in human decision making. Their<br />
<strong>the</strong>ories are not necessarily mutually exclusive. Diamond’s analysis is also comparative and<br />
focuses on <strong>the</strong> collapse <strong>of</strong> agricultural systems in Montana, <strong>the</strong> collapse <strong>of</strong> Easter Island society,<br />
<strong>the</strong> collapse <strong>of</strong> Mayan civilization, <strong>the</strong> failure <strong>of</strong> <strong>the</strong> Viking settlement <strong>of</strong> Greenland, and<br />
modern examples such as genocide in Rwanda and social instability in Haiti. Diamond proposes<br />
a five-point framework <strong>of</strong> factors that contribute to social collapse. These include <strong>the</strong> following:<br />
1. Environmental damage<br />
2. Climate change<br />
3. Hostile neighbors who may attack a social system or sap its resources<br />
4. Friendly trade partners who may turn hostile or indifferent, denying a social system <strong>the</strong><br />
inputs required <strong>for</strong> its functioning (e.g., OPEC Oil crisis in <strong>the</strong> 1970s)<br />
5. Failures in a society’s response to <strong>the</strong>se challenges<br />
These factors are similar to those identified elsewhere in this volume. For instance, Hewitt’s<br />
Political Instability Task Force (PITF) identifies high infant mortality (as a barometer <strong>of</strong><br />
material well-being) and lack <strong>of</strong> integration in <strong>the</strong> world economy as key factors leading to<br />
social instability. Hewitt also finds that instability <strong>of</strong> neighboring states is a key factor leading to<br />
instability in a state. Similarly, in Gallup's model <strong>of</strong> instability (Rieger, this volume), basic<br />
material needs, living conditions, safety and security, and perception <strong>of</strong> economic conditions are<br />
key measures <strong>of</strong> social stability.<br />
Each <strong>of</strong> Diamond's factors delineates key variables in a cultural materialist paradigm. The fifth<br />
factor, “failures in a society’s response to <strong>the</strong>se challenges,” is always present in social collapse<br />
and is <strong>the</strong>re<strong>for</strong>e a necessary condition. Typical reasons why people fail to respond to systemthreatening<br />
challenges include <strong>the</strong> following:<br />
1. Failure to anticipate a problem<br />
2. Failure to perceive a problem<br />
3. Failure to try to solve <strong>the</strong> problem<br />
4. Failure <strong>of</strong> solutions when tried<br />
Problems can be unanticipated simply due to <strong>the</strong>ir novelty. One hope <strong>for</strong> modern computational<br />
modeling methods is that <strong>the</strong>y may help analysts anticipate <strong>the</strong> range <strong>of</strong> possible futures a<br />
society may face. 9,10,11 Absent <strong>the</strong>se methods, it can be very difficult if not impossible <strong>for</strong><br />
decision makers in a society to anticipate what problems <strong>the</strong>y may face.<br />
Problems may not be perceived. Many changes are gradual, creating noticeable changes only<br />
once one can compare conditions across many years. For instance, such “landscape amnesia” is<br />
apparent when people fail to notice receding snowlines due to global warming trends. 12<br />
If a problem is perceived, decision makers in a society can fail to solve <strong>the</strong> problem <strong>for</strong> a wide<br />
range <strong>of</strong> reasons. One common reason is a clash <strong>of</strong> interests among decision makers. Decision<br />
makers’ goals may conflict, and each decision maker may very well make well-in<strong>for</strong>med,<br />
rational decisions to attain <strong>the</strong>ir own selfish goals while at <strong>the</strong> same time pursuing courses <strong>of</strong><br />
action that harm <strong>the</strong> social system upon which <strong>the</strong>y depend. Well-known examples include <strong>the</strong><br />
ancient Mayan elite’s reservation <strong>of</strong> prime agricultural land <strong>for</strong> prestige crops instead <strong>of</strong> foodproducing<br />
crops, 13 and <strong>the</strong> common practice <strong>of</strong> producing large families to support individual<br />
farms, creating a population boom that threatens <strong>the</strong> entire agrarian basis <strong>of</strong> an economy. 14 The<br />
205
“Tragedy <strong>of</strong> <strong>the</strong> Commons,” in which individual users overexploit open common resources, is a<br />
classic example. 15,16 Ano<strong>the</strong>r common problem in decision making includes conflicts between<br />
short-term gains and long-term discounted pr<strong>of</strong>its; if <strong>the</strong> expected value <strong>of</strong> exploiting a resource<br />
today is greater than its long-term expected value, <strong>the</strong>n it is <strong>of</strong>ten overexploited. This tendency<br />
is not only seen in modern industries such as logging, as Diamond details, but is a pervasive<br />
feature <strong>of</strong> non-Western people in non-monetary economies, such as hunter-ga<strong>the</strong>rers in<br />
Madagascar. 17<br />
Hewitt’s (this volume) stability variable, political institution consistency, may tap into both<br />
Tainter and Diamond’s focus on failed organizational decision making. A country with a mix <strong>of</strong><br />
authoritarian and democratic institutions may very well experience difficulties coordinating<br />
decision making to address problems, or <strong>the</strong> country may even experience difficulties with<br />
perceiving <strong>the</strong> same problems across its political spectrum.<br />
Ano<strong>the</strong>r factor <strong>of</strong> importance in social stability is competition <strong>for</strong> prestige goods, which <strong>of</strong>ten<br />
creates highly unsustainable economic practices. 18 The distribution <strong>of</strong> status-conferring goods<br />
(income, house size, herd size, exotic items) is always uneven and is characterized by sharp<br />
differences between social classes. 19,20 These sharp differences create greed and envy as<br />
individuals struggle and take chances to attain higher social status. 21 This risk-taking behavior<br />
predicts political risk taking and social unrest, 22 including contemporary terrorism. 23 Ironically,<br />
it is <strong>of</strong>ten more affluent, upwardly mobile sectors <strong>of</strong> a society, like educated middle and upper<br />
middle classes), that more strongly feel <strong>the</strong>se wealth differences.<br />
In addition to <strong>the</strong>se classic rational <strong>for</strong>ms <strong>of</strong> decision failure, <strong>the</strong>re are also <strong>for</strong>ms <strong>of</strong> decision<br />
failure based on more irrational tendencies in human decision making (see also Rieger, this<br />
volume). For instance, people typically ignore “sunk costs”; people tend to stay with a failing<br />
investment because <strong>the</strong>y have already sunk resources into it. This not only applies to investment<br />
behavior on Wall Street, but was also a contributing factor to <strong>the</strong> collapse <strong>of</strong> Anasazi civilization<br />
as populations remained near large religious structures long after <strong>the</strong> surrounding environment<br />
could no longer support <strong>the</strong>ir populations. 24<br />
These features <strong>of</strong> social collapse and faulty decision-making are not exhaustive. However, <strong>the</strong>y<br />
exemplify key elements researchers have identified in <strong>the</strong> failure <strong>of</strong> social systems. Examination<br />
<strong>of</strong> <strong>the</strong> current social unrest in Iran serves as an example <strong>of</strong> how <strong>the</strong>se features may manifest in<br />
social instability, and possibly collapse.<br />
Iran 2009: A Case Study <strong>of</strong> Social Instability<br />
Iran appears to be currently in a state <strong>of</strong> political flux, with dissention among <strong>the</strong> ranks <strong>of</strong> <strong>the</strong><br />
influential Shi’ite clergy, apparent tension between <strong>the</strong> supreme leader Ayatollah Khamenei and<br />
<strong>the</strong> president Mahmood Ahmadinejad, 25 and a vocal opposition, led by Mir-Houssein Mousavi<br />
that is currently protesting <strong>the</strong> June 13, 2009 election results. It would be premature to declare<br />
Iran collapsed, but <strong>the</strong>re is clearly social instability that threatens state power holders at this<br />
time. (As <strong>of</strong> this writing, 9 July 2009, <strong>the</strong> situation is extremely fluid, alternating between<br />
government crackdowns and repeated public protests. If Iran possesses <strong>the</strong> state capacity to<br />
suppress dissent, <strong>the</strong>n it can wea<strong>the</strong>r <strong>the</strong> current crisis. What is clear is that Iran is currently<br />
unstable.) Headlines highlight power struggles between clergy and secular leaders, between<br />
incumbents and challengers, and between street demonstrations that are occasionally met with<br />
violent repression. However, closer examination <strong>of</strong> <strong>the</strong> underpinnings <strong>of</strong> this crisis provides a<br />
test <strong>of</strong> Tainter's and Diamond’s propositions, and it exposes instabilities in Iran's social<br />
206
infrastructure. Not only does this analysis provide a deeper understanding <strong>of</strong> <strong>the</strong> Iranian crisis,<br />
but it also suggests leading indicators <strong>of</strong> social stability that can help <strong>for</strong>ecast similar social<br />
breakdowns elsewhere.<br />
Iran’s Environmental Infrastructure<br />
Iran possesses an abundance <strong>of</strong> natural resources in fossil fuels, and oil and gas revenues<br />
constitute 80% <strong>of</strong> export earnings and 50–70% <strong>of</strong> government revenues. 26 This provides <strong>the</strong><br />
Iranian government with a major source <strong>of</strong> material support, although that support is<br />
concentrated and <strong>the</strong>re<strong>for</strong>e vulnerable to world market fluctuations. Environmental changes in<br />
Iran have a small effect on <strong>the</strong> overall economic picture, but <strong>the</strong>y have a dramatic effect on<br />
small but key segments <strong>of</strong> <strong>the</strong> Iranian population. In particular, overgrazing and climate change<br />
are causing water and pasture scarcity that has been undermining <strong>the</strong> traditional economy <strong>of</strong><br />
many <strong>of</strong> Iran’s traditional people, including minorities that are <strong>of</strong>ten hostile to <strong>the</strong> central state<br />
government. These environmental changes have led to migration to urban centers and <strong>the</strong><br />
growth <strong>of</strong> impoverished segments in Iranian society. 27 There<strong>for</strong>e, Iran’s environmental and<br />
resource base, while in some ways strong, has clear vulnerabilities.<br />
Iran’s Political Economy<br />
The Iranian economy and its political system are inextricably linked. In order to maintain Iran's<br />
social services and energy subsidies to <strong>the</strong> Iranian populace, <strong>the</strong> government controls much <strong>of</strong><br />
<strong>the</strong> Iranian economy. Approximately 60% <strong>of</strong> <strong>the</strong> economy is controlled by a complex central<br />
state bureaucracy, with perhaps as much as ano<strong>the</strong>r 20% <strong>of</strong> <strong>the</strong> economy controlled by Bonyads,<br />
religious foundations connected to <strong>the</strong> politically powerful Shi’ite religious hierarchy. 28 Both<br />
Iran’s political system and its Shi’ite religious hierarchy are characterized by extremely<br />
complex, interlocking associations <strong>of</strong> politicians, elected <strong>of</strong>ficials, appointees, and clerics with<br />
<strong>of</strong>ten conflicting goals. The mix <strong>of</strong> authoritarian and democratic institutions, along with <strong>the</strong><br />
overall complexity <strong>of</strong> <strong>the</strong> Iranian political system, may represent <strong>the</strong> sort <strong>of</strong> inconsistency<br />
Hewitt associates with instability (this volume). (Note that Hewitt codes Iran’s political<br />
consistency as high; <strong>the</strong> suggestion is that this coding may be reconsidered.) Despite <strong>the</strong><br />
government’s domination <strong>of</strong> <strong>the</strong> economy and recent historically high fuel prices on <strong>the</strong> world<br />
market, it still lacks <strong>the</strong> resources necessary to provide services and maintain its military<br />
spending. Recently new taxes have been levied on <strong>the</strong> population in order to boost revenues.<br />
These new taxes have even met with public resistance and rioting. 29<br />
Iranian Demography: A Ticking Time Bomb<br />
Iran has a very young population, with two thirds under <strong>the</strong> age <strong>of</strong> 30. The population is, overall<br />
and especially in urban areas, well educated; <strong>the</strong> literacy rate is 77%. 30 University attendance is<br />
relatively high, and women now represent more than half <strong>of</strong> all university students. A large,<br />
urbanized young sector is a source <strong>of</strong> potential disruption in any society. 31 When that age<br />
imbalance is matched with lack <strong>of</strong> opportunity, <strong>the</strong> combination can be explosive. Iran’s <strong>of</strong>ficial<br />
unemployment rate is currently 12.5%, 32 although Iran typically ignores both young and old<br />
(above age 55) and women who are seeking employment in its unemployment figures. Reestimates<br />
<strong>of</strong> unemployment from <strong>the</strong> early 2000s indicate that <strong>the</strong> unemployment rate was 34%<br />
among 15–24 year olds and projected to reach over 50%. 33<br />
207
Anthropological Theories <strong>of</strong> Collapse and Iranian Social Instability<br />
As Diamond notes, some <strong>for</strong>m <strong>of</strong> environmental hazard <strong>of</strong>ten lies at <strong>the</strong> root <strong>of</strong> social instability.<br />
In <strong>the</strong> case <strong>of</strong> Iran, it is a deceptively strong economic base in fossil fuels that is actually highly<br />
vulnerable and that provides little employment to <strong>the</strong> population. On a smaller scale,<br />
environmental desiccation is displacing potentially disruptive minority populations, creating a<br />
potential pool <strong>of</strong> dissent in Iranian society. Demographically, Iran has a very young, welleducated<br />
middle class population whose members have high aspirations <strong>for</strong> social advancement,<br />
but those aspirations are thwarted by unemployment and lack <strong>of</strong> opportunity. Despite rhetoric<br />
concerning clerical divisions and secular power-grabs, <strong>the</strong> demography <strong>of</strong> Iranian dissent<br />
suggests more material and mundane sources <strong>of</strong> support <strong>for</strong> challenging <strong>the</strong> current government.<br />
Mousavi and his clerical supporters are known as re<strong>for</strong>mist candidates and are popular with <strong>the</strong><br />
large segment <strong>of</strong> Iran’s youth, especially students. This is precisely <strong>the</strong> segment <strong>of</strong> Iranian<br />
society most failed by <strong>the</strong> current administration and <strong>the</strong> Supreme leader’s religious following.<br />
In addition, preliminary indicators suggest that middle class supporters <strong>of</strong> Mousavi were a major<br />
source <strong>of</strong> protest, 12 once again rein<strong>for</strong>cing <strong>the</strong> fact that those whose aspirations have been most<br />
thwarted are <strong>the</strong> ones taking to <strong>the</strong> streets. This is consistent with <strong>the</strong> type <strong>of</strong> relative deprivation<br />
that emerges from wealth differentials and thwarted aspirations. Many Iranians clearly have lost<br />
confidence in <strong>the</strong> current regime, satisfying one <strong>of</strong> Gallup's key indicators <strong>of</strong> instability.<br />
Fur<strong>the</strong>rmore, this instability is manifest in violence in <strong>the</strong> aftermath <strong>of</strong> a clear “matchstick<br />
event,” an election (see Rieger, this volume). It is also apparent that Mousavi’s political support<br />
in this crisis comes from groups advocating democratic re<strong>for</strong>m, whereas Ahmadinejad’s<br />
political support comes more from <strong>the</strong> autocratic elements, rein<strong>for</strong>cing Hewitt’s research on<br />
regime consistency.<br />
The Iranian government’s response to <strong>the</strong>ir vulnerable economy has been to develop an<br />
extremely complex and invasive system <strong>of</strong> government control. This is entirely consistent with<br />
Tainter’s proposition that societies use social complexity to solve problems. Fur<strong>the</strong>rmore, <strong>the</strong><br />
failure <strong>of</strong> <strong>the</strong>se government ef<strong>for</strong>ts to sustain <strong>the</strong>mselves perfectly fits Tainter’s prediction that<br />
such ef<strong>for</strong>ts provide diminishing marginal returns, fur<strong>the</strong>r sapping <strong>the</strong> material basis <strong>for</strong> that<br />
society.<br />
As Diamond stresses, underlying factors <strong>of</strong> instability alone do not destabilize a society. It is<br />
failures in <strong>the</strong> social response to <strong>the</strong>se challenges that create instability, and in extreme cases,<br />
collapse. Previous crackdowns and censorship <strong>of</strong> social networking sites and <strong>the</strong> Internet<br />
indicate that <strong>the</strong> Iranian government at least perceived, and perhaps anticipated <strong>the</strong> growing<br />
dissent in <strong>the</strong>ir society. They also clearly attempted to solve <strong>the</strong> growing problem <strong>of</strong> dissent<br />
through censorship and <strong>the</strong> maintenance <strong>of</strong> low domestic fuel prices as a palliative to <strong>the</strong><br />
masses. However, <strong>the</strong> Iranian government’s solutions have clearly failed to address <strong>the</strong> material<br />
underpinnings <strong>of</strong> instability; <strong>the</strong>y have not only continued <strong>the</strong>ir inefficient control <strong>of</strong> <strong>the</strong><br />
economy, but <strong>the</strong>y have exacerbated <strong>the</strong> problem by levying more taxes on <strong>the</strong> population. This<br />
fifth failure <strong>of</strong> decision making is <strong>the</strong> key ingredient in any social collapse.<br />
How <strong>the</strong> current protest and instability in Iran will play out is difficult to predict. So far, <strong>the</strong><br />
underlying factors and subsequent failures in decision making follow <strong>the</strong> hallmarks <strong>of</strong> social<br />
instability noted in anthropological <strong>the</strong>ories <strong>of</strong> social collapse. However, collapse can only come<br />
about if dissenting elements can martial <strong>the</strong> power necessary to trans<strong>for</strong>m or destroy <strong>the</strong> system.<br />
The supreme leader and president’s control <strong>of</strong> <strong>the</strong> Revolutionary Guard, al Quds <strong>for</strong>ces, and <strong>the</strong><br />
208
Basij militias, will make any overthrow <strong>of</strong> <strong>the</strong> Iranian government difficult unless <strong>the</strong>se centers<br />
<strong>of</strong> <strong>for</strong>ce defect to <strong>the</strong> dissenting parties. However, should <strong>the</strong> Iranian government continue its<br />
singular dependence on one volatile commodity and its ineffective control <strong>of</strong> <strong>the</strong> overall<br />
economy, <strong>the</strong> underlying conditions that lead to dissent and instability will only grow.<br />
Summary Analysis: Indicators <strong>of</strong> Social Instability<br />
The Iranian crisis is a test-case in process, but it illustrates several key points drawn from<br />
anthropological <strong>the</strong>ories <strong>of</strong> social collapse. These key variables also serve as indicators <strong>of</strong> a<br />
society that is moving toward greater instability and <strong>the</strong>re<strong>for</strong>e may aid in analysis and planning<br />
ef<strong>for</strong>ts designed to anticipate where U.S. resources may need to be applied. These key factors are<br />
detailed below.<br />
Weakening economy<br />
Economies can become weakened due to environmental changes, especially in Third World<br />
countries where <strong>the</strong> agrarian economy is important. Recent attention to social unrest in Sudan<br />
and global climate change, 34 and Department <strong>of</strong> Defense projections <strong>of</strong> <strong>the</strong> impact <strong>of</strong> global<br />
climate change on U.S. <strong>for</strong>ces 35 are good examples <strong>of</strong> <strong>the</strong>se concerns. Economies can also be<br />
threatened by a lack <strong>of</strong> diversification and a focus on primary export commodities, such as oil. 36<br />
Finally, social investments in bureaucracy and social control designed to address problems, but<br />
which are inefficient and provide diminishing marginal returns, sap <strong>the</strong> material support <strong>of</strong> a<br />
society and hasten its demise. Iran exhibits <strong>the</strong>se challenges.<br />
High unemployment among young and middle class<br />
Young people require new resources to sustain <strong>the</strong>mselves, attract mates and get married, and<br />
subsequently support <strong>the</strong>ir families. Whenever a society has a large proportion <strong>of</strong> young people<br />
with such demands, <strong>the</strong> social system is pressed to acquire <strong>the</strong> new resources necessary to keep<br />
<strong>the</strong> young satisfied. When <strong>the</strong> young sector <strong>of</strong> society has been provided with good education,<br />
training and skills development, but without <strong>the</strong> possibility <strong>of</strong> realizing <strong>the</strong>ir aspirations to use<br />
<strong>the</strong>se skills, <strong>the</strong>n a large, passionate, and vocal pool <strong>of</strong> dissent is created in <strong>the</strong> society. The<br />
casebook example <strong>of</strong> this is <strong>the</strong> growth <strong>of</strong> <strong>the</strong> Italian red Brigades in <strong>the</strong> 1970s as increased<br />
educational opportunities plus economic stagnation combined to create a large pool <strong>of</strong><br />
disaffected and eventually radicalized young people in Italy. 37 The demographic <strong>of</strong> Iranian<br />
dissent today indicates that similar challenges exist <strong>for</strong> <strong>the</strong> Iranian system.<br />
Unprecedented taxes needed to support system<br />
Both Tainter’s proposition about diminishing returns and Diamond’s focus on faulty decision<br />
making are manifest when states levy taxes on dissenters in order to try to support a failing<br />
system. A classic example <strong>of</strong> such folly would be <strong>the</strong> British stamp acts in Colonial America<br />
that, while not burdensome, fueled revolutionary fervor. The fact that increased taxes were met<br />
with riots in Iran indicates that <strong>the</strong>se measures to increase state revenues to address social<br />
problems will likely fail.<br />
Poor decision making<br />
The advantage <strong>of</strong> Diamond’s framework is that it identifies <strong>the</strong> specific ways that decision<br />
making can fail. Many <strong>of</strong> <strong>the</strong>se are evident in this brief analysis <strong>of</strong> Iranian social instability.<br />
Whenever decision makers appear ignorant <strong>of</strong> obvious problems, when <strong>the</strong>y persist in failed<br />
policies that drain resources from <strong>the</strong> state and <strong>the</strong> population, and when <strong>the</strong>ir policies<br />
209
exacerbate ra<strong>the</strong>r than resolve problems, <strong>the</strong> social system as a whole is clearly at risk. At <strong>the</strong><br />
current time, <strong>the</strong> hard-line taken by <strong>the</strong> Iranian supreme leader and president, along with <strong>the</strong><br />
continued inefficiencies <strong>of</strong> <strong>the</strong> state-controlled economy, indicate that <strong>the</strong>ir solutions are failing.<br />
Policy Implications <strong>of</strong> Anthropological Theories <strong>of</strong> Collapse<br />
Anthropological <strong>the</strong>ories <strong>of</strong> social collapse can help analysts to understand social change and to<br />
anticipate it by monitoring leading indicators. The practical policy implications <strong>of</strong> this research<br />
concern which indicators analysts should monitor, on which time scales, and which can be<br />
effectively impacted.<br />
The first class <strong>of</strong> indicators includes environmental variables. These are <strong>of</strong>ten overlooked in<br />
policy analysis, but <strong>the</strong>y can fundamentally alter <strong>the</strong> physical and consequent political<br />
environment. Political factions that can be blamed <strong>for</strong> failing to respond to disruptive<br />
environmental changes will be weakened to <strong>the</strong> benefit <strong>of</strong> <strong>the</strong>ir rivals. Key environmental<br />
variables impact economic resources, and include desertification, salinization <strong>of</strong> soils, flooding,<br />
major storm activity, and any o<strong>the</strong>r factor that impacts a society's economy. The time scale on<br />
which <strong>the</strong>se variables operate is over years if not decades, and <strong>the</strong>re<strong>for</strong>e requires a long-term<br />
commitment to data ga<strong>the</strong>ring and analysis. The best use <strong>of</strong> <strong>the</strong>se data is <strong>for</strong>ecasting <strong>of</strong><br />
environmental trends and <strong>the</strong>ir impacts; <strong>the</strong>re is little to nothing that can be done about<br />
environmental change or <strong>the</strong> occurrence <strong>of</strong> a devastating hurricane.<br />
The second class <strong>of</strong> indicators includes economic variables. Simple changes in aggregate<br />
measures like GDP and poverty rates are <strong>of</strong> limited use. More detailed in<strong>for</strong>mation on shifts in<br />
<strong>the</strong> distribution <strong>of</strong> wealth and productivity in a society, however, can reveal eventual political<br />
rifts in a society, be<strong>for</strong>e <strong>the</strong>se rifts become politicized. Key economic variables would include<br />
income, land ownership, investment, employment, occupational specialties and primary exports<br />
(<strong>for</strong> example, oil). Economic variables operate over years, and <strong>the</strong> effects <strong>of</strong> dramatic changes<br />
can have political impacts in months. One policy implication is that economic variables need to<br />
be monitored at <strong>the</strong> nation level, province level, and faction level (who controls what resources,<br />
what relative wealth differences exist between factions), on a long-term basis. Impacting<br />
economic trends is difficult and unpredictable, but at least <strong>the</strong>se human-created factors have <strong>the</strong><br />
potential <strong>of</strong> being altered, and analysts must stay current on human social cultural and<br />
behavioral <strong>the</strong>ories that indicate what effects could be anticipated from altering economic<br />
variables. Training on current social <strong>the</strong>ory must be better incorporated into government<br />
business practices.<br />
A third class <strong>of</strong> indicators includes how decisions are made in a society. Data relevant to<br />
decision making includes structural data on social organization and decision flow (how<br />
governments, businesses and o<strong>the</strong>r organizations are organized, ga<strong>the</strong>r in<strong>for</strong>mation and act upon<br />
it). These kinds <strong>of</strong> data are best ga<strong>the</strong>red through ethnographic field research, although email<br />
records and o<strong>the</strong>r communications can reveal social structure through social network analytic<br />
methods. It is important to recognize that, although electronic communication has become<br />
widespread in industrialized societies, face-to-face and word-<strong>of</strong>-mouth communication<br />
continues to be fundamentally important in most corners <strong>of</strong> <strong>the</strong> world. Ethnographic methods<br />
require months <strong>of</strong> personal observation. One policy implication is that more support must be<br />
made <strong>for</strong> ethnographic research in key contexts that may impact national security. This can be<br />
done in an open manner, consistent with American Anthropological Association ethics codes,<br />
provided that subjects <strong>of</strong> <strong>the</strong> research understand that <strong>the</strong>ir participation in a study is designed to<br />
210
eveal how <strong>the</strong>ir organizations operate, and research findings can be made to <strong>the</strong> subjects <strong>for</strong><br />
<strong>the</strong>ir own use. Social organizations tend to change slowly, however, crises in decision making<br />
can precipitate rapid change in organizations; consider <strong>the</strong> rapid failure <strong>of</strong> large corporations due<br />
to scandals such as ENRON. There<strong>for</strong>e, studies <strong>of</strong> social organization and decision making must<br />
be periodically updated, and also conducted on an ongoing basis. Behavioral economics and<br />
evolutionary psychology provides powerful <strong>the</strong>oretical tools <strong>for</strong> understanding how decision<br />
making will change in different social contexts. Training in <strong>the</strong>se fields should be made<br />
available to analysts in order to bring <strong>the</strong>se insights to bear on real situations.<br />
Conclusions<br />
Anthropologists’ long-term view <strong>of</strong> social processes and unique databases (sometimes spanning<br />
thousands <strong>of</strong> years <strong>of</strong> social evolution), provide <strong>the</strong>m with a unique viewpoint from which to<br />
understand social collapse. Societies collapse (<strong>the</strong>ir fundamental institutions cease to function to<br />
hold <strong>the</strong> social fabric toge<strong>the</strong>r, basic human needs are not met, violence erupts) due to long-term<br />
erosions <strong>of</strong>, or effective challenges to, <strong>the</strong>ir economic base (<strong>of</strong>ten due to environmental change).<br />
When change comes, it is <strong>of</strong>ten rapid and dramatic. The key to anticipating <strong>the</strong>se rapid changes,<br />
and possibly <strong>for</strong> mitigating <strong>the</strong>m, is to identify <strong>the</strong> indicators <strong>of</strong> social erosion long be<strong>for</strong>e rapid<br />
changes erupt. These indicators include environmental, economic, and decision making<br />
variables. Much <strong>of</strong> this data is openly accessible, and powerful <strong>the</strong>ories are under constant<br />
development to explain <strong>the</strong> drivers <strong>of</strong> collapse. However, adequately monitoring <strong>the</strong>se variables<br />
requires a commitment to long-term research by governments, NGOs, and <strong>the</strong> academic<br />
community, backed by training in relevant areas <strong>of</strong> research.<br />
↑ Back to <strong>the</strong> top<br />
1 Rice, Susan E. and Stewart Patrick, 2008. Index <strong>of</strong> State Weakness in <strong>the</strong> Developing World. Brookings<br />
Institute, Washington D.C. http://www.globalpolicy.org/images/pdfs/02weakness.pdf<br />
2 “Many Missing” after Peru Riots. http://news.bbc.co.uk/2/hi/americas/8088350.stm June 8, 2009.<br />
3 Harris, M. (1979). Cultural Materialism: The Struggle <strong>for</strong> a Science <strong>of</strong> Culture. New York: Vintage<br />
Books.<br />
4 Steward, J. (1955). Theory <strong>of</strong> Culture Change: The Methodology <strong>of</strong> Multilinear Evolution. Urbana,<br />
Illinois: University <strong>of</strong> Illinois Press.<br />
5 Wilson, D. J. (1999). Indigenous South Americans <strong>of</strong> <strong>the</strong> Past and Present: An Ecological Perspective.<br />
Boulder, Colorado: Westview Press.<br />
6 Kuznar, L. A., & Sanderson, S. K. (Eds.). (2006). Studying Societies and Cultures: Marvin Harris's<br />
Cultural Materialism and Its Legacy. Boulder, Colorado: Pergamon Press.<br />
7 Tainter, J. (1988). The Collapse <strong>of</strong> Complex Societies. Cambridge: Cambridge University Press.<br />
8 Diamond, J. (2005). Collapse: How Societies Choose to Fail or Succeed. New Yok: Penguin Books.<br />
9 Bankes, S. (1993). “Exploratory Modeling <strong>for</strong> Policy Analysis.” Operations Research, 41(3), 435-449.<br />
10 Kuznar, L. A. (2006). “Exploratory Modeling <strong>of</strong> Ensembles <strong>for</strong> Testing Decision Theory Paradigms.”<br />
In D. L. Sallach, C. M. Macal & M. J. North (Eds.), Proceedings <strong>of</strong> <strong>the</strong> AGENT 2006 Conference:<br />
Social Agents: Results and Prospects (pp. 157-166). Chicago, Illinois: Argonne <strong>National</strong> Laboratory.<br />
11 Zacharias, G. L., MacMillan, J., & Hemel, S. B. V. (Eds.). (2008). Behavioral Modeling and<br />
Simulation: From Individuals to Societies. Washington, D.C.: <strong>National</strong> Academies Press.<br />
12 Diamond, J. (2005). Collapse: How Societies Choose to Fail or Succeed. New York: Penguin Books.<br />
13 Webster, D., Freter, A., & Golin, N. (2000). Copán: The Rise and Fall <strong>of</strong> an Ancient Maya Kingdom.<br />
Fort Worth, Texas: Harcourt Brace.<br />
211
14 Handwerker, W. P. (1986). “The Modern Demographic Transition: An Analysis <strong>of</strong> Subsistence Choices<br />
and Reproductive Consequences.” American Anthropologist, 88, 400-417.<br />
15 Alvard, M. S. (1998). “Evolutionary Ecology and Resource Conservation.” Evolutionary Anthropology,<br />
7, 62-74.<br />
16 Hardin, G. (1993). Living within Limits: Ecology, Economics, and Population Taboos. Ox<strong>for</strong>d: Ox<strong>for</strong>d<br />
University Press.<br />
17 Tucker, B. (2006). “A Future Discounting Explanation <strong>for</strong> <strong>the</strong> Persistence <strong>of</strong> a Mixed Foraging-<br />
Horticulture Strategy among <strong>the</strong> Mikea <strong>of</strong> Madagascar.” In D. J. Kennett & B. Winterhalder (Eds.),<br />
Behavioral Ecology and <strong>the</strong> Transition to Agriculture (pp. 22-40). Berkeley: University <strong>of</strong> Cali<strong>for</strong>nia<br />
Press.<br />
18 Diamond, J. (2005). Collapse: How Societies Choose to Fail or Succeed. New York: Penguin Books.<br />
19 Kuznar, L. A. (2001). “Risk Sensitivity and Value among Andean Pastoralists: Measures, Models and<br />
Empirical Tests.” Current Anthropology, 42(3), 432-440.<br />
20 Kuznar, L. A. (2002). “Evolutionary Applications <strong>of</strong> Risk Sensitivity Models to Socially Stratified<br />
Species: Comparison <strong>of</strong> Sigmoid, Concave and Linear Functions.” Evolution and Human Behavior,<br />
23(4), 265-280.<br />
21 Friedman, M., & Savage, L. J. (1948). “The Utility Analysis <strong>of</strong> Choices Involving Risk.” Journal <strong>of</strong><br />
Political Economy, 4, 279-304.<br />
22 Kuznar, L. A., & Frederick, W. G. (2003). “Environmental Constraints and Sigmoid Utility:<br />
Implications <strong>for</strong> Value, Risk Sensitivity, and Social Status.” Ecological Economics, 46, 293-306.<br />
23 Kuznar, L. A. (2007). “Rationality Wars and <strong>the</strong> War on Terror: Explaining Terrorism and Social<br />
Unrest.” American Anthropologist, 109(2), 318-329.<br />
24 Janssen, M. A., Kohler, T. A., & Scheffer, M. (2003). “Sunk-Cost Effects and Vulnerability to Collapse<br />
in Ancient Societies.” Current Anthropology, 44(5), 722-728.<br />
25 Fathi, Nazila (2008). “Ahmadinejad Loses Favor with Khamenei, Iran's Top Leader.” NY Times Online,<br />
January 7, 2009 http://www.nytimes.com/2008/01/07/world/africa/07iht-tehran.4.9063096.html<br />
26 CIA World Factbook, Iran https://www.cia.gov/library/publications/<strong>the</strong>-world-factbook/geos/IR.html<br />
27 Beck, L. (1998). “Use <strong>of</strong> Land by Nomadic Pastoralists in Iran, 1970-1998.” Bulletin <strong>of</strong> <strong>the</strong> Yale School<br />
<strong>of</strong> Forestry and Environmental Science, 103, 58-80.<br />
28 http://en.wikipedia.org/wiki/Iran_economy<br />
29 CIA World Factbook, Iran https://www.cia.gov/library/publications/<strong>the</strong>-world-factbook/geos/IR.html<br />
30 CIA World Factbook, Iran https://www.cia.gov/library/publications/<strong>the</strong>-world-factbook/geos/IR.html<br />
31 Hudson, V. M., & Den Boer, A. (2002). “A Surplus <strong>of</strong> Men, a Deficit <strong>of</strong> Peace.” International Security,<br />
26(4), 5-38.<br />
32 CIA World Factbook, Iran https://www.cia.gov/library/publications/<strong>the</strong>-world-factbook/geos/IR.html<br />
33 Amuzegar, Jahangir (2004). “Iran's Unemployment Crisis.” Middle East Economic Survey 47(41)<br />
http://www.mees.com/postedarticles/oped/a47n41d01.htm<br />
34 United Nations Environment Programme, 2007<br />
35 Goodman, S. (2007). “<strong>National</strong> Security and <strong>the</strong> Threat <strong>of</strong> Climate Change.” Unpublished manuscript,<br />
Center <strong>for</strong> Naval Analyses (CNA) Corporation.<br />
36 Collier, P., & Hoeffler, A. (2004). “Greed and Grievance in Civil War.” Ox<strong>for</strong>d Economic Papers, 56,<br />
563-595.<br />
37 Gurr, T. R. (1990). “Terrorism in Democracies: Its Social and Political Bases.” In W. Reich (Ed.),<br />
Origins <strong>of</strong> Terrorism: Psychologies, Ideologies, Theologies, States <strong>of</strong> Mind (pp. 86-102). Baltimore:<br />
Johns Hopkins University Press.<br />
212
3.3. Quantitative Content Analysis (Laura Leets)<br />
Author and Organization: Laura Leets, NSI and Georgetown University<br />
Contact In<strong>for</strong>mation: leets@nsiteam.com<br />
Abstract<br />
This white paper provides a readable overview <strong>of</strong> content analysis, an analytical technique that<br />
examines message content. Specifically, it focuses on <strong>the</strong> central concepts underlying content<br />
analysis and how to conduct effective content analysis research.<br />
Introduction<br />
Content analysis is one <strong>of</strong> a variety <strong>of</strong> social science methods employed by researchers to find<br />
answers to questions. Simply, it is a technique <strong>for</strong> ga<strong>the</strong>ring and analyzing <strong>the</strong> content <strong>of</strong> text.<br />
The content refers to anything written, visual, or spoken that serves as a medium <strong>for</strong><br />
communication (e.g., words, pictures, symbols). It is a technique with a long history and one that<br />
is used in many fields. In particular, <strong>the</strong>re are two general <strong>for</strong>ms <strong>of</strong> content analysis: quantitative<br />
and qualitative. The quantitative approach is normally referred to as basic content analysis, and<br />
<strong>the</strong> qualitative approach is usually called discourse analysis or textual analysis. 1 The emphasis <strong>of</strong><br />
this white paper is on <strong>the</strong> quantitative approach.<br />
A classic quantitative definition <strong>of</strong> content analysis is “a research technique <strong>for</strong> <strong>the</strong> objective,<br />
systematic, and quantitative description <strong>of</strong> <strong>the</strong> manifest content <strong>of</strong> communication.” 2 It is<br />
important to understand <strong>the</strong> words objective, systematic and quantitative. As Stempel notes, in<br />
this approach <strong>the</strong> content is (a) selected according to explicit and consistently applied rules<br />
(systematic), (b) not influenced by <strong>the</strong> researcher’s personal bias (objective), and is<br />
(c) quantified, that is, numerical values are recorded and analyzed (quantitative). 3 Historically,<br />
content analysis focused on <strong>the</strong> manifest (surface) meaning <strong>of</strong> a message, as opposed to <strong>the</strong> latent<br />
(underlying) meaning. Today, most researchers recognize <strong>the</strong> value <strong>of</strong> both analyses and <strong>of</strong>ten<br />
advocate <strong>the</strong> examination <strong>of</strong> both manifest and latent meanings if possible.<br />
There are numerous reasons <strong>for</strong> conducting a content analysis; ten common reasons are provided<br />
in <strong>the</strong> table below.<br />
Table 3.3-1. Reasons to Conduct a Content Analysis 4<br />
1. Describe trends in content over time 6. Trace conceptual development in intellectual<br />
history<br />
2. Describe <strong>the</strong> relative focus <strong>of</strong> attention <strong>for</strong> a 7. Compare actual content with intended content<br />
set <strong>of</strong> topics<br />
3. Compare international differences in content 8. Expose use <strong>of</strong> biased terms in propaganda<br />
research<br />
4. Compare group differences in content 9. Test hypo<strong>the</strong>ses about cultural and symbolic<br />
use <strong>of</strong> terms<br />
5. Compare individual differences in<br />
10. Code open-ended survey items<br />
communication style<br />
213
The following section presents a methodology to conduct a basic content analysis.<br />
How to Conduct Content Analysis Research<br />
Specifically, content analysis involves (1) selecting and defining a set <strong>of</strong> content categories,<br />
(2) defining and <strong>the</strong>n sampling <strong>the</strong> elements <strong>of</strong> <strong>the</strong> text that are described by <strong>the</strong> categories,<br />
(3) quantifying <strong>the</strong> categories, such as by counting <strong>the</strong>ir frequency <strong>of</strong> occurrence, and<br />
(4) drawing conclusions from <strong>the</strong> findings. These steps are clearly captured in Neuendorf’s<br />
(2002) 5 flowchart <strong>of</strong> a typical content analysis process, which is adapted below. In <strong>the</strong> remainder<br />
<strong>of</strong> <strong>the</strong> section, <strong>the</strong> flowchart is discussed step by step.<br />
1<br />
Theory & Rationale<br />
(What content and<br />
why?)<br />
2 3 4 5<br />
Conceptualizations<br />
(variables and<br />
definitions)<br />
Operationalizations<br />
(unit <strong>of</strong> analysis,<br />
coding scheme)<br />
Sampling Plan<br />
(representative<br />
sample?)<br />
Coding Process<br />
Human<br />
Coding<br />
Coding<br />
Schemes<br />
Computer<br />
Coding<br />
Human<br />
Training<br />
Sessions<br />
Training<br />
Independent<br />
Human<br />
Coding<br />
Coding<br />
Apply<br />
Coding<br />
6<br />
Reliability<br />
Calculations<br />
7<br />
Tabulation &<br />
Reporting<br />
Figure 3.3-1. Content Analysis Flowchart. 6<br />
Step 1 Theory and Rationale<br />
Content analysis, like all research, begins with a research problem: “what content will be<br />
examined and why?” 7 A sound content analysis states explicitly a rationale that supports why<br />
certain messages are worth examining. The research question should be based on existing <strong>the</strong>ory,<br />
prior research, or practical problems.<br />
For example, decades <strong>of</strong> communication research on television violence demonstrated that<br />
exposure to violence in mass media led to (1) learning <strong>of</strong> aggressive attitudes and behavior,<br />
(2) fear, and (3) desensitization to violence. As a result, <strong>the</strong> <strong>National</strong> Cable Television<br />
Association funded a national television violence study in which academics from four<br />
universities conducted a three-year content analysis to describe <strong>the</strong> violence on broadcast<br />
television. This allowed <strong>the</strong> industry to monitor <strong>the</strong> issue be<strong>for</strong>e Congress passed legislation that<br />
would <strong>for</strong>ce <strong>the</strong>m to do so.<br />
Step 2 Conceptualizations<br />
It is crucial that <strong>the</strong> researcher defines <strong>the</strong> concepts or variables <strong>of</strong> interest (conceptualization)<br />
and develops specific methods <strong>for</strong> observing <strong>the</strong> concepts in relation to that framework<br />
(operationalization).<br />
214
There are two main approaches to defining <strong>the</strong> meaning <strong>of</strong> communication content. One<br />
approach is to define <strong>the</strong> content by its surface or visible meaning (manifest content). For<br />
example, a researcher may count <strong>the</strong> number <strong>of</strong> times a weapon appears in a television show.<br />
The meaning <strong>of</strong> this symbol is on <strong>the</strong> surface, and what you see is what you get. Alternatively,<br />
<strong>the</strong> researcher can define <strong>the</strong> content by examining <strong>the</strong> underlying, implicit meaning <strong>of</strong> <strong>the</strong><br />
content <strong>of</strong> a text (latent content). This requires reading between <strong>the</strong> lines and requires <strong>the</strong> coders<br />
to understand <strong>the</strong> relationship between language and social meaning. It is less accurate and<br />
harder than manifest coding. For example, assessing <strong>the</strong> political orientation <strong>of</strong> a newspaper<br />
editorial would constitute latent content.<br />
In <strong>the</strong> national television violence study, <strong>the</strong> researchers defined <strong>the</strong>ir main topic <strong>of</strong> interest,<br />
violence, as <strong>the</strong> following: “Violence is defined as any overt depiction <strong>of</strong> a credible threat <strong>of</strong><br />
physical <strong>for</strong>ce <strong>of</strong> <strong>the</strong> actual use <strong>of</strong> such <strong>for</strong>ce intended to physical harm an animate being or a<br />
group <strong>of</strong> animate beings. Violence also includes certain depictions <strong>of</strong> physically harmful<br />
consequences against an animate being (or group <strong>of</strong> beings) that occur as a result <strong>of</strong> unseen<br />
violent means. Thus, <strong>the</strong>re are three primary types <strong>of</strong> violent depictions: credible threats,<br />
behavioral acts and harmful consequences.” 8 It is clear that <strong>the</strong> coding <strong>of</strong> violence is a complex<br />
task and is usually regarded as latent content, requiring a long list <strong>of</strong> coding rules.<br />
Step 3 Operationalizations<br />
Variables in content analysis are operationalized using a coding system, which is a set <strong>of</strong><br />
instructions or rules on how to systematically observe and record content from text. In creating a<br />
coding system, <strong>the</strong> researcher first selects and defines a unit <strong>of</strong> analysis. Units <strong>of</strong> analysis are<br />
what <strong>the</strong> coders actually count. Depending on <strong>the</strong> aim <strong>of</strong> <strong>the</strong> project, <strong>the</strong> unit <strong>of</strong> analysis may be<br />
newspapers, speeches, photographs, television violence, words, sentences, or something else<br />
entirely. The unit <strong>of</strong> analysis must be related to <strong>the</strong> purpose <strong>of</strong> <strong>the</strong> study. It is important that <strong>the</strong><br />
unit <strong>of</strong> analysis is clear and precise, and <strong>the</strong> rules <strong>for</strong> inclusion are apparent and easily<br />
observable. For example, <strong>the</strong> national television violence study used a unit <strong>of</strong> analysis <strong>the</strong>y<br />
termed “violent incident.” Violent incidents were <strong>of</strong>ten indicated by <strong>the</strong> acronym “PAT,” as <strong>the</strong>y<br />
included <strong>the</strong> interaction between a perpetrator (P) and a target (T) involved in a violent act (A).<br />
There are two approaches to coding data: emergent and a priori coding. With emergent coding,<br />
categories are established following some preliminary examination <strong>of</strong> <strong>the</strong> data. The researcher<br />
reviews <strong>the</strong> material and comes up with a set <strong>of</strong> features that <strong>for</strong>m a coding scheme. If multiple<br />
researchers are involved, <strong>the</strong>y compare notes and reconcile any differences. The second approach<br />
is a priori coding, where <strong>the</strong> categories are established prior to <strong>the</strong> analysis based upon some<br />
<strong>the</strong>ory. The researcher(s) decide on <strong>the</strong> categories, and <strong>the</strong> coding is applied to <strong>the</strong> data.<br />
Regardless <strong>of</strong> which approach is used, Holsti provides five general guidelines to follow in<br />
constructing a set <strong>of</strong> content analysis categories or a category scheme. 9 The first is that <strong>the</strong><br />
categories should reflect <strong>the</strong> purposes <strong>of</strong> <strong>the</strong> research. The second rule <strong>for</strong> constructing a set <strong>of</strong><br />
categories is that <strong>the</strong> categories be exhaustive or that <strong>the</strong>re must be a category into which each<br />
relevant item can be placed. The third guideline states <strong>the</strong> content should only be capable <strong>of</strong><br />
being placed in one category, which is known as mutually exclusive categories. The fourth rule<br />
is known as independence <strong>of</strong> categories. The assignment <strong>of</strong> one item to a given category should<br />
not affect <strong>the</strong> assignment <strong>of</strong> o<strong>the</strong>r items. The fifth category deals with <strong>the</strong> unit <strong>of</strong> analysis. One<br />
cannot mix different levels <strong>of</strong> analysis in <strong>the</strong> categories. Failing to follow <strong>the</strong>se rules (especially<br />
215
mutually exclusive and exhaustive categories) can result in a faulty content analysis because it<br />
compromises <strong>the</strong> study’s reliability and validity.<br />
The national television violence study provided an a priori category scheme <strong>for</strong> <strong>the</strong>ir unit <strong>of</strong><br />
analysis, violent incident. One <strong>of</strong> <strong>the</strong> several variables included in this scheme was titled “reason<br />
<strong>for</strong> violence.” For any given violent incident addressed by <strong>the</strong> coders, a determination was made<br />
<strong>of</strong> which reason <strong>for</strong> violence applied most clearly, choosing between a set <strong>of</strong> ten potential coding<br />
values. O<strong>the</strong>r variables related to <strong>the</strong> unit <strong>of</strong> analysis were similarly coded. The reason-<strong>for</strong>violence<br />
potential values are included in <strong>the</strong> table below; note that <strong>the</strong>y adhere well to Holsti’s<br />
guidelines.<br />
Table 3.3-2. Reason <strong>for</strong> Violence.<br />
1. Self Defense Violence intended to protect <strong>the</strong> self against harm<br />
2. Protect O<strong>the</strong>rs Violence intended to protect o<strong>the</strong>r characters<br />
3. Ideology/Belief Violence accomplished to promote or adhere to an ideology<br />
4. Anger Violence triggered by feelings <strong>of</strong> hostility, rage, resentment<br />
5. Retaliation Violence triggered by feelings <strong>of</strong> retribution<br />
6. Personal Gain Violence <strong>for</strong> purposes <strong>of</strong> selfish gain (material goods, power)<br />
7. Amusement Violence <strong>for</strong> <strong>the</strong> sake <strong>of</strong> ones own enjoyment<br />
8. Mental Incompetence Violence from a person who lacks mental competence<br />
9. Forced Compliance Violence as a result <strong>of</strong> orders from more powerful o<strong>the</strong>rs<br />
10. Accident Violence occurred even though perpetrator didn’t intent <strong>for</strong> it to<br />
Step 4 Sampling Plan<br />
Often <strong>the</strong>re is a large amount <strong>of</strong> relevant content, and with limited time and funding constraints,<br />
it is rare to analyze all <strong>the</strong> potential content. As a result, <strong>the</strong> researcher almost always selects an<br />
appropriate sample from <strong>the</strong> population. To provide useful descriptions <strong>of</strong> <strong>the</strong> content, <strong>the</strong><br />
sample content must be selected so as to represent <strong>the</strong> entire population, which requires using<br />
precise statistical techniques. There are a number <strong>of</strong> science-based probability sampling<br />
techniques that <strong>the</strong> researcher can use, 10 which are no different from <strong>the</strong> sampling procedures<br />
used in survey research.<br />
The national television violence study examined <strong>the</strong> largest and most representative sample <strong>of</strong><br />
television content ever evaluated in a single study. For three years, programs on 23 television<br />
channels were randomly selected over a nine-month period to create a composite week <strong>of</strong><br />
programming. 11<br />
Step 5 Coding Process<br />
As Babbie notes, “content analysis is essentially a coding operation. Coding is <strong>the</strong> process <strong>of</strong><br />
trans<strong>for</strong>ming raw data into a standardized <strong>for</strong>m.” 12 This is usually <strong>the</strong> most time-consuming part<br />
<strong>of</strong> a content analysis.<br />
216
Researchers can choose to use ei<strong>the</strong>r manual coding (humans) or automatic coding (computers).<br />
If <strong>the</strong> study employs humans, <strong>the</strong> people who do <strong>the</strong> coding are called coders. The number <strong>of</strong><br />
coders involved in a content analysis is usually small (two to three). Their job is to place a unit <strong>of</strong><br />
analysis into a content category. The researcher needs to provide definitions and coding rules <strong>for</strong><br />
<strong>the</strong> coders to use in assigning units to categories. This is provided in a codebook, in which all <strong>the</strong><br />
variable measures are fully explained. Coders participate in training sessions to increase <strong>the</strong>ir<br />
accuracy and to become calibrated with each o<strong>the</strong>r. The coders as a group code sample material<br />
and discuss <strong>the</strong> results afterward. When <strong>the</strong> coders become consistent and com<strong>for</strong>table with <strong>the</strong><br />
coding task, <strong>the</strong>y code <strong>the</strong> data independent <strong>of</strong> one ano<strong>the</strong>r.<br />
Some researchers choose to save time and select automated coding <strong>for</strong> <strong>the</strong> repetitive tasks (e.g.,<br />
searching, listing, and counting). There are many different s<strong>of</strong>tware packages available that help<br />
facilitate coding. The researcher must provide a codebook or data dictionary that defines all <strong>the</strong><br />
variables and <strong>the</strong> method <strong>for</strong> applying <strong>the</strong>m. Although computers can aid in identifying content,<br />
<strong>the</strong>re is <strong>of</strong>ten a problem with contextual bias or computers misidentifying irrelevant content. As<br />
Krippendorf points out, it is important to determine what humans and computers do best.<br />
Computers do not per<strong>for</strong>m <strong>the</strong> analysis, but <strong>the</strong>y aid it. 13<br />
Regardless <strong>of</strong> whe<strong>the</strong>r human or computer coding is employed, <strong>the</strong> overall value <strong>of</strong> <strong>the</strong> content<br />
analysis depends on coding accuracy or reliability, which is discussed below.<br />
Step 6 Reliability Calculations<br />
When <strong>the</strong> coding is finished, <strong>the</strong> researcher establishes <strong>the</strong> reliability <strong>of</strong> <strong>the</strong> coding. Reliability<br />
helps <strong>the</strong> researcher explain how <strong>the</strong> data were collected in order to justify <strong>the</strong> au<strong>the</strong>nticity and<br />
accuracy <strong>of</strong> <strong>the</strong> coding. The reliability <strong>of</strong> a content analysis is discussed with regard to two<br />
dimensions. The first is called stability or intra-rater reliability. This refers to <strong>the</strong> coder’s ability<br />
to consistently re-code <strong>the</strong> same data in <strong>the</strong> same way over a period <strong>of</strong> time. The second is titled<br />
reproducibility or inter-rater reliability. This refers to whe<strong>the</strong>r <strong>the</strong> coding-schemes enable <strong>the</strong><br />
same text to be coded in <strong>the</strong> same category by different people. As Weber (1990) points out,<br />
“reliability problems usually grow out <strong>of</strong> <strong>the</strong> ambiguity <strong>of</strong> word meanings, category definitions,<br />
or o<strong>the</strong>r coding rules.” 14<br />
Researchers establish reliability among coders through statistical analysis and a statistical<br />
coefficient that determines <strong>the</strong> degree <strong>of</strong> consistency among coders (e.g., Scott’s pi or Cohen’s<br />
Kappa). A general rule <strong>of</strong> thumb is that reliability estimates above .80 demonstrate good<br />
reliability among coders, estimates between .70–.80 illustrate moderate reliability, estimates<br />
between .60–.70 show fair reliability, and coefficients below .60 are unacceptable. For example,<br />
in <strong>the</strong> national television violence study, <strong>the</strong> overall reliability estimates were very high<br />
(e.g., .90).<br />
Step 7 Tabulation & Reporting<br />
It is important to remember that content analysis describes what is in <strong>the</strong> text. It cannot<br />
demonstrate effects or draw causal inferences (x causes y). Validation <strong>of</strong> <strong>the</strong> inferences made<br />
from content analysis usually demands <strong>the</strong> use <strong>of</strong> multiple sources <strong>of</strong> in<strong>for</strong>mation and may<br />
require <strong>the</strong> use <strong>of</strong> benchmark data to know if a value is high or low. Content analysis itself is<br />
only valid and meaningful to <strong>the</strong> extent that <strong>the</strong> results are related to o<strong>the</strong>r measures. 15 Hence,<br />
analysts should be cautious about <strong>the</strong> statements that are drawn from a content analysis and<br />
should verify that <strong>the</strong>y are appropriate <strong>for</strong> <strong>the</strong> analysis.<br />
217
For example, <strong>the</strong> national television violence study provided descriptive data about violent<br />
content on broadcast television. The first year provided a benchmark from which to compare <strong>the</strong><br />
following years. Moreover, <strong>the</strong> researchers were aware <strong>of</strong> <strong>the</strong> appropriate use <strong>of</strong> content analysis,<br />
and <strong>the</strong>y knew that a discussion <strong>of</strong> <strong>the</strong> potential effects <strong>of</strong> <strong>the</strong> violent content on viewers would<br />
require a different method—an experiment.<br />
Conclusion<br />
The applications <strong>of</strong> content analysis are extensive. For example, with regard to<br />
counterinsurgency operations, <strong>the</strong>re are many interesting questions that can be answered by<br />
conducting a quantitative content analysis. Successful operations depend on thoroughly<br />
understanding <strong>the</strong> society and culture within which <strong>the</strong>y are being conducted. 16 One way to<br />
examine <strong>the</strong> society is to content analyze messages (television, radio, paper, speeches) in order to<br />
describe (1) relationships and tensions among groups, (2) ideologies and narratives that resonate<br />
with groups, (3) values <strong>of</strong> groups, interests and motivations, and (4) how a particular culture<br />
defines effective and legitimate governance. Moreover, intelligence and counter-terrorism<br />
agencies absorb massive amounts <strong>of</strong> in<strong>for</strong>mation, and content analysis provides a mechanism <strong>for</strong><br />
converting it to actionable data.<br />
This white paper was written to help readers determine when to use a content analysis and to<br />
understand what steps are involved in designing an effective study.<br />
↑ Back to <strong>the</strong> top<br />
1 Krippendorf, K. (2004). Content Analysis: An Introduction to its Methodology. 2nd ed. Thousand Oaks,<br />
CA: Sage Publications.<br />
2 Berelson, B. (1952). Content Analysis in Communication Research. New York, NY: Free Press.<br />
3 Stempel, G. (1989). “Content Analysis.” In G. Stempel & B. Westley (Eds.) Research Methods in Mass<br />
Communication. Prentice Hall.<br />
4 Berelson, B. (1952). Content Analysis in Communication Research. New York, NY: Free Press.<br />
5 Neuendorf, K. (2002). The Content Analysis Guidebook. Thousand Oaks, CA: Sage Publications.<br />
6 Neuendorf, K. (2002). The Content Analysis Guidebook. Thousand Oaks, CA: Sage Publications.<br />
7 Neuendorf, K. (2002). The Content Analysis Guidebook. Thousand Oaks, CA: Sage Publications.<br />
8 Seawell, M. (Ed.) (1998). <strong>National</strong> Television Violence Study (Vol. 3). Thousand Oaks, CA: Sage<br />
Publications.<br />
9 Holsti, O. (1969). Content Analysis <strong>for</strong> <strong>the</strong> Social Sciences and Humanities. Reading, MA: Addison-<br />
Wesley.<br />
10 Babbie, E. (2004). The Practice <strong>of</strong> Social Research. 10th ed. Belmont, CA: Thomson Wadsworth.<br />
11 Seawell, M. (Ed.) (1998). <strong>National</strong> Television Violence Study (Vol. 3). Thousand Oaks, CA: Sage<br />
Publications.<br />
12 Babbie, E. (2004). The Practice <strong>of</strong> Social Research. 10th ed. Belmont, CA: Thomson Wadsworth.<br />
13 Krippendorf, K. (2004). Content Analysis: An Introduction to its Methodology. 2nd ed. Thousand Oaks,<br />
CA: Sage Publications.<br />
14 Weber, R. (1990). Basic Content Analysis 2nd ed. Thousand Oaks, CA: Sage Publications.<br />
15 Shapiro, G. & Mark<strong>of</strong>f, J. (1997). “A Matter <strong>of</strong> Definition.” In C. Roberts (Ed.). Text Analysis <strong>for</strong> <strong>the</strong><br />
Social Sciences: Methods <strong>for</strong> Drawing Statistical Inferences from Text and Transcripts. Mahwah, NJ:<br />
Lawrence Erlbaum Associates.<br />
16 The Counterinsurgency Field Manual, 2007.<br />
218
3.4. The Peace and Conflict Instability Ledger Ranking States on Future<br />
Risks (J. Joseph Hewitt)<br />
Author and Organization: J. Joseph Hewitt, Center <strong>for</strong> International Development and Conflict<br />
Management, University <strong>of</strong> Maryland<br />
Contact In<strong>for</strong>mation: jhewitt@cidcm.umd.edu<br />
Introduction<br />
Over <strong>the</strong> past two years, <strong>the</strong> risks <strong>of</strong> instability and conflict have increased significantly in <strong>the</strong><br />
regions <strong>of</strong> <strong>the</strong> world where <strong>the</strong>se dangers were already very high. This is one <strong>of</strong> <strong>the</strong> most<br />
important conclusions to be drawn from <strong>the</strong> most recent analyses that produce <strong>the</strong> 2010 Peace<br />
and Conflict Instability Ledger. The heightened risks are not <strong>the</strong> result <strong>of</strong> worsening government<br />
effectiveness in delivering services to <strong>the</strong> population or deteriorating economies. The heightened<br />
estimated risks are associated with a development that is normally welcomed—<strong>the</strong> initial steps<br />
toward democratic governance. Additionally, since <strong>the</strong> last publication <strong>of</strong> rankings, new armed<br />
conflicts have outnumbered those that have terminated, driving up estimated risks <strong>of</strong> instability<br />
in many regions <strong>of</strong> <strong>the</strong> world where neighborhood security has now worsened. This chapter<br />
presents country rankings based on newly calculated risk estimates and discusses some <strong>of</strong> <strong>the</strong><br />
key results from <strong>the</strong> analysis, including <strong>the</strong> pivotal relationship between democratization and risk<br />
<strong>of</strong> instability.<br />
The Peace and Conflict Instability Ledger (“<strong>the</strong> ledger,” <strong>for</strong> short) is a ranking <strong>of</strong> 162 countries<br />
based on <strong>the</strong>ir estimated risk <strong>of</strong> experiencing major bouts <strong>of</strong> political instability or armed conflict<br />
in <strong>the</strong> three-year period <strong>of</strong> 2008–2010. The estimates are obtained from a statistical <strong>for</strong>ecasting<br />
model that uses 2007 data (<strong>the</strong> most current data available) <strong>for</strong> several variables that correlate<br />
strongly with <strong>the</strong> onset <strong>of</strong> political instability or armed conflict. The ledger represents a syn<strong>the</strong>sis<br />
<strong>of</strong> some <strong>of</strong> <strong>the</strong> leading research on explaining and <strong>for</strong>ecasting state instability. As such, <strong>the</strong><br />
selection <strong>of</strong> factors accounted <strong>for</strong> in <strong>the</strong> ledger’s underlying <strong>for</strong>ecasting models was based on<br />
identifying variables <strong>for</strong> which agreement was strong among researchers about <strong>the</strong>ir relative<br />
importance. An abridged version <strong>of</strong> <strong>the</strong> full rankings appears at <strong>the</strong> end <strong>of</strong> <strong>the</strong> chapter. (The full<br />
listing is included with Hewitt [<strong>for</strong>thcoming] 1 ). Readers are encouraged to consult this<br />
in<strong>for</strong>mation regularly while proceeding through this overview.<br />
The Peace and Conflict Instability Ledger<br />
Figure 3.4-1 shows how <strong>the</strong> countries in <strong>the</strong> analysis were classified according to <strong>the</strong>ir estimated<br />
risk scores. A quick review <strong>of</strong> <strong>the</strong> map <strong>of</strong>fers a broad overview <strong>of</strong> what <strong>the</strong> geographic landscape<br />
looks like from <strong>the</strong> perspective <strong>of</strong> <strong>the</strong> risks <strong>of</strong> instability. Undoubtedly, Africa remains <strong>the</strong> most<br />
serious concern. More than half <strong>the</strong> countries on <strong>the</strong> continent qualify <strong>for</strong> <strong>the</strong> high or highest risk<br />
categories. Of all <strong>the</strong> countries worldwide that qualify in those categories, African countries<br />
make up more than 75 percent <strong>of</strong> <strong>the</strong> states (28 <strong>of</strong> <strong>the</strong> 36 total). A similar concentration <strong>of</strong> states<br />
qualifying at high or highest risk exists in South Asia, a grouping that contains crucial states like<br />
Pakistan (newly classified as high-risk) and Afghanistan, which are pivotal because <strong>the</strong>ir fates<br />
have direct repercussions <strong>for</strong> global trends in terrorism.<br />
219
Figure 3.4-1. Risk <strong>of</strong> Future Instability, 2008-2010.<br />
The ledger’s conceptualization <strong>of</strong> political instability relies on <strong>the</strong> definition developed by <strong>the</strong><br />
Political Instability Task Force (PITF). (The initial compilation <strong>of</strong> state failure events <strong>for</strong> <strong>the</strong><br />
Task Force was conducted at CIDCM in 1994–1995 under <strong>the</strong> direction <strong>of</strong> Ted Robert Gurr. The<br />
roster <strong>of</strong> genocides and politicides was provided by Barbara Harff. The PITF presents full<br />
definitions <strong>for</strong> revolutionary wars, ethnic wars, adverse regime changes, genocide, and politicide<br />
in Esty et al. [1999]). 2 This definition, which has guided <strong>the</strong> task <strong>for</strong>ce’s comprehensive<br />
compilation <strong>of</strong> state failure events covering <strong>the</strong> period 1955–2006, encompasses a wide variety<br />
<strong>of</strong> event types. These include revolutionary wars, ethnic wars, adverse regime changes, and<br />
genocides or politicides. The onset <strong>of</strong> any <strong>of</strong> <strong>the</strong>se types <strong>of</strong> episodes <strong>for</strong> a state marks <strong>the</strong><br />
beginning <strong>of</strong> an instability event. While this set <strong>of</strong> events is quite heterogeneous, <strong>the</strong>y all share a<br />
fundamental similarity—<strong>the</strong> onset <strong>of</strong> any one <strong>of</strong> <strong>the</strong>se events signals <strong>the</strong> arrival <strong>of</strong> a period in<br />
which government’s capacity to deliver core services and to exercise meaningful authority has<br />
been disrupted, threatening its overall stability.<br />
Empirical studies using 60 years <strong>of</strong> historical data show that instability can emerge from a<br />
combination <strong>of</strong> five factors in four domains <strong>of</strong> government and society. (Readers interested in<br />
some <strong>of</strong> <strong>the</strong> more significant recent contributions to this literature should consult Collier et al.<br />
[2003], 3 Collier and Hoeffler [2004], 4 Esty et al. [1999] 5 , Fearon and Laitin [2003], 6 Goldstone<br />
220
et al. [2005], 7 Hegre and Sambanis [2006], 8 Hegre et al. [2001], 9 King and Zeng [2001], 10<br />
Sambanis [2002, 2004], 11,12 and <strong>the</strong> United States Agency <strong>for</strong> International Development<br />
[2005] 13 ).The key factor in <strong>the</strong> political domain is <strong>the</strong> institutional consistency <strong>of</strong> a country’s<br />
governmental institutions. In <strong>the</strong> economic domain, it is openness to international trade: <strong>the</strong> more<br />
interdependent a country’s economy with o<strong>the</strong>rs, <strong>the</strong> less likely a country will experience<br />
instability in <strong>the</strong> near future. In <strong>the</strong> societal domain, <strong>the</strong> infant mortality rate is a crucial indicator<br />
<strong>of</strong> socioeconomic well-being. And in <strong>the</strong> security domain <strong>the</strong>re are two factors: one is <strong>the</strong> extent<br />
to which a country is militarized, and <strong>the</strong> o<strong>the</strong>r is whe<strong>the</strong>r neighboring countries have armed<br />
conflict. Table 4.4-1 provides a brief overview <strong>of</strong> <strong>the</strong> <strong>the</strong>oretical relationship between each <strong>of</strong><br />
<strong>the</strong>se factors and risks <strong>of</strong> instability. A fuller discussion is given in Peace and Conflict 2008. 14<br />
Leveraging <strong>the</strong> strong historical relationships that exist among <strong>the</strong> five factors and <strong>the</strong> risk <strong>of</strong><br />
future instability, <strong>the</strong> ledger uses a statistical model to obtain risk scores <strong>for</strong> all countries having<br />
a population <strong>of</strong> at least 500,000 in 2007 (162 countries total). The data collection that serves as<br />
<strong>the</strong> foundation <strong>for</strong> this analysis contains an annual observation <strong>for</strong> each country <strong>for</strong> every year<br />
that data exist <strong>for</strong> <strong>the</strong> five factors. Each annual observation in <strong>the</strong> data collection records whe<strong>the</strong>r<br />
<strong>the</strong> country experienced an onset <strong>of</strong> a new instability event in any <strong>of</strong> <strong>the</strong> three years following<br />
<strong>the</strong> year <strong>of</strong> <strong>the</strong> observation. In this fashion, <strong>the</strong> data can be analyzed to assess <strong>the</strong> empirical<br />
relationship that <strong>the</strong> five factors have with <strong>the</strong> risk <strong>of</strong> future instability. To maintain<br />
comparability with <strong>the</strong> results presented in <strong>the</strong> previous volume <strong>of</strong> Peace and Conflict, we<br />
continue to estimate <strong>the</strong> model using data from 1950–2003. The logistic regression procedure <strong>for</strong><br />
estimating <strong>the</strong> model on this data (sometimes called “training data”) produces weights <strong>for</strong> each<br />
factor that reflect <strong>the</strong> relative influence that each has on explaining future instability. The<br />
previous ledger results, 15 which used 2004 data to produce <strong>for</strong>ecasts <strong>for</strong> <strong>the</strong> period 2005–2007,<br />
were based on <strong>the</strong> same 1950–2003 training data. For <strong>the</strong> updated ledger, we now use 2007 data<br />
(<strong>the</strong> last year <strong>for</strong> which complete data are available <strong>for</strong> all five factors) to produce a three-year<br />
<strong>for</strong>ecast indicating <strong>the</strong> risk <strong>of</strong> instability at any time during <strong>the</strong> period 2008–2010. It should be<br />
noted that in <strong>the</strong> absence <strong>of</strong> significant change to any <strong>of</strong> <strong>the</strong> five factors, risks change only<br />
gradually from year to year. There<strong>for</strong>e, a high-risk country that experiences no major structural<br />
change to its regime, socioeconomic status, or security situation in <strong>the</strong> period 2008–2010 will<br />
likely remain at high risk beyond this <strong>for</strong>ecast period.<br />
Table 3.4-1. Factors Influencing <strong>the</strong> Risk <strong>of</strong> Instability.<br />
Factor Domain Description<br />
Institutional<br />
Consistency<br />
Economic<br />
Openness<br />
Political<br />
Economic<br />
The ledger accounts <strong>for</strong> <strong>the</strong> impact <strong>of</strong> institutional consistency. This<br />
refers to <strong>the</strong> extent to which <strong>the</strong> institutions comprising a country’s<br />
political system are uni<strong>for</strong>mly and consistently autocratic or<br />
democratic. Political institutions with a mix <strong>of</strong> democratic and<br />
autocratic features are inconsistent, a common attribute <strong>of</strong> polities in<br />
<strong>the</strong> midst <strong>of</strong> a democratic transition. Based on a series <strong>of</strong> findings<br />
reported in <strong>the</strong> academic literature, we expect regimes with<br />
inconsistent institutions to be more likely to experience political<br />
instability. 16,17,18<br />
The ledger accounts <strong>for</strong> <strong>the</strong> impact <strong>of</strong> economic openness, which is<br />
<strong>the</strong> extent to which a country’s economy is integrated with <strong>the</strong> global<br />
economy. Countries that are more tightly connected to global<br />
markets have been found to experience less instability. 19,20<br />
221
Infant<br />
Rates<br />
Militarization<br />
Neighborhood<br />
Security<br />
Mortality<br />
Economic, Social<br />
Security<br />
Security<br />
The ledger examines <strong>the</strong> impact <strong>of</strong> infant mortality rates, an indicator<br />
that serves as a proxy <strong>for</strong> a country’s overall economic development,<br />
its level <strong>of</strong> advancement in social welfare policy, and its capacity to<br />
deliver core services to <strong>the</strong> population. In this respect, this indicator<br />
taps into both <strong>the</strong> economic and social domains <strong>of</strong> a country.<br />
Research findings reported by <strong>the</strong> PITF have been especially notable<br />
<strong>for</strong> <strong>the</strong> strong relationship found between high infant mortality rates<br />
and <strong>the</strong> likelihood <strong>of</strong> future instability. 21,22<br />
To account <strong>for</strong> <strong>the</strong> security domain, <strong>the</strong> ledger focuses on a country’s<br />
level <strong>of</strong> militarization. Instability is most likely in countries where<br />
<strong>the</strong> opportunities <strong>for</strong> armed conflict are greatest. In societies where<br />
<strong>the</strong> infrastructure and capital <strong>for</strong> organized armed conflict are more<br />
plentiful and accessible, <strong>the</strong> likelihood <strong>for</strong> civil conflict increases. 23<br />
Extensive militarization in a country typically implies that a large<br />
portion <strong>of</strong> <strong>the</strong> society’s population has military skill and training,<br />
weapons stocks are more widely available, and o<strong>the</strong>r pieces <strong>of</strong><br />
military equipment are more diffused throughout <strong>the</strong> country. The<br />
likelihood <strong>of</strong> instability is greater in this setting because increased<br />
access to and availability <strong>of</strong> <strong>the</strong>se resources multiplies <strong>the</strong><br />
opportunities <strong>for</strong> organizing and mobilizing.<br />
The likelihood <strong>of</strong> political instability in a state increases substantially<br />
when a neighboring state is currently experiencing armed conflict.<br />
This risk is especially acute when ethnic or o<strong>the</strong>r communal groups<br />
span across borders. A number <strong>of</strong> studies have shown that<br />
neighborhood conflict is a significant predictor <strong>of</strong> political<br />
instability. 24,25,26<br />
The full listing <strong>of</strong> all 162 countries is presented at <strong>the</strong> end <strong>of</strong> <strong>the</strong> chapter. The table includes an<br />
indication <strong>of</strong> how each country is per<strong>for</strong>ming on each <strong>of</strong> <strong>the</strong> risk factors, which enables a quick<br />
assessment <strong>of</strong> how <strong>the</strong> ultimate risk estimate relates to each indicator. In this fashion, <strong>the</strong> full<br />
ledger table serves as a diagnostic tool, <strong>of</strong>fering comprehensive in<strong>for</strong>mation about all countries<br />
so that comparisons can be drawn about how <strong>the</strong> levels <strong>of</strong> each factor influence risk.<br />
To ease interpretation <strong>of</strong> <strong>the</strong> results, <strong>the</strong> ledger presents each country’s likelihood <strong>of</strong> future<br />
instability as a risk ratio. The risk ratio gives <strong>the</strong> relative risk <strong>of</strong> instability in a country compared<br />
to <strong>the</strong> average estimated likelihood <strong>of</strong> instability <strong>for</strong> 28 members <strong>of</strong> <strong>the</strong> Organization <strong>for</strong><br />
Economic Cooperation and Development (OECD). The OECD serves as a useful baseline<br />
because its membership is widely viewed to contain <strong>the</strong> most stable countries in <strong>the</strong> world. The<br />
estimated probability <strong>of</strong> <strong>the</strong> average OECD country’s experiencing an instability event in <strong>the</strong><br />
period 2008–2010 is 0.007. To illustrate, Nicaragua’s estimated probability <strong>of</strong> experiencing<br />
instability in <strong>the</strong> next three years is 0.029, which yields a risk ratio <strong>of</strong> approximately 4.1.<br />
Presented in this way, <strong>the</strong> analysis indicates that Nicaragua’s risk <strong>of</strong> instability is about four<br />
times greater than an average OECD country—a more useful characterization <strong>of</strong> its risk than <strong>the</strong><br />
simple probability 0.029 by itself.<br />
The risk ratios appearing in <strong>the</strong> ledger are statistical estimates and, accordingly, are accompanied<br />
by varying levels <strong>of</strong> confidence, depending on <strong>the</strong> particular attributes <strong>of</strong> a given country. An<br />
under-appreciated characteristic <strong>of</strong> statistical inferences is that <strong>the</strong>y are always associated with<br />
some level <strong>of</strong> uncertainty. For instance, in <strong>the</strong> model used to create <strong>the</strong> ledger, infant mortality<br />
rates were found to be positively related to <strong>the</strong> onset <strong>of</strong> instability. The level <strong>of</strong> uncertainty <strong>for</strong><br />
that estimate was sufficiently small to rule out <strong>the</strong> possibility that <strong>the</strong> model was pointing<br />
erroneously to a positive relationship when <strong>the</strong> “true” relationship was actually negative (or<br />
nonexistent). However, uncertainty around <strong>the</strong> estimate remains. The uncertainty exists because<br />
222
many countries with high infant mortality rates have not experienced instability (e.g., Malawi,<br />
Saudi Arabia, or Bolivia) and some with a low rate do (e.g., Israel). These outlier states create<br />
“noise” in <strong>the</strong> estimated relationship between instability and infant mortality rates. Each <strong>of</strong> <strong>the</strong><br />
variables in <strong>the</strong> model is accompanied by this kind <strong>of</strong> uncertainty or noise.<br />
In<strong>for</strong>mation extracted from <strong>the</strong> statistical model <strong>for</strong> instability can be used to compute <strong>the</strong> total<br />
amount <strong>of</strong> uncertainty surrounding an individual country’s estimate <strong>for</strong> instability risk. The<br />
ledger reports this level <strong>of</strong> uncertainty. For each country, <strong>the</strong> ledger reports a single best estimate<br />
<strong>of</strong> <strong>the</strong> overall risk <strong>of</strong> instability. Additionally, <strong>the</strong> ledger reports a range <strong>of</strong> values within which<br />
<strong>the</strong> best estimate lies. Statistically speaking, <strong>the</strong> “true” risk <strong>of</strong> instability lies within this range<br />
with a confidence probability <strong>of</strong> 95 percent. The graphical display <strong>of</strong> <strong>the</strong> confidence range shows<br />
how it extends across risk categories. For some countries, <strong>the</strong> confidence range is confined<br />
largely within one category. For o<strong>the</strong>rs, large segments may extend across multiple categories,<br />
suggesting that assessments about <strong>the</strong> country’s status should be drawn with more caution.<br />
The updated ledger presented in this volume features an innovation that leverages in<strong>for</strong>mation<br />
from <strong>the</strong> confidence intervals to in<strong>for</strong>m <strong>the</strong> classification <strong>of</strong> countries into separate risk<br />
categories. In <strong>the</strong> previous ledger, <strong>the</strong> three-category classification scheme (high risk, moderate<br />
risk, and low risk) was based simply on <strong>the</strong> percentile ranking <strong>of</strong> states. This method has been<br />
improved by incorporating greater gradation into <strong>the</strong> set <strong>of</strong> risk categories and in<strong>for</strong>ming <strong>the</strong><br />
classification <strong>of</strong> states based on statistical confidence. A brief comment is warranted about <strong>the</strong><br />
new classification procedure to better appreciate its advantages.<br />
With <strong>the</strong> list <strong>of</strong> 162 countries sorted from highest score to lowest, <strong>the</strong> country with <strong>the</strong> highest<br />
risk score (Afghanistan) establishes a new grouping <strong>of</strong> states. Moving down <strong>the</strong> list, any country<br />
whose upper bound on its confidence range is higher than Afghanistan’s risk score is assigned to<br />
<strong>the</strong> same group as Afghanistan (Niger, Burundi, DRC, and Djibouti). For each <strong>of</strong> <strong>the</strong>se countries,<br />
<strong>the</strong> extensive overlap across <strong>the</strong>ir respective confidence ranges indicates little qualitative<br />
difference in <strong>the</strong>ir respective risk scores. The first country with an upper bound less than<br />
Afghanistan’s score begins a new grouping. In this case, that would be Ethiopia. Moving fur<strong>the</strong>r<br />
down <strong>the</strong> list, any country with an upper bound value greater than Ethiopia’s risk score <strong>of</strong> 26.8<br />
would be grouped with Ethiopia. These two groups are combined to <strong>for</strong>m <strong>the</strong> “highest risk”<br />
category.<br />
Moving down <strong>the</strong> list in a similar manner, <strong>the</strong> third grouping <strong>of</strong> states (beginning with Kenya)<br />
will be assigned to <strong>the</strong> “high risk” category. Proceeding in <strong>the</strong> same fashion, <strong>the</strong> next grouping<br />
makes up <strong>the</strong> “moderate risk” category, followed in turn by <strong>the</strong> next grouping that makes up <strong>the</strong><br />
“some risk” category. All remaining groups below <strong>the</strong> “some risk” grouping are combined into<br />
<strong>the</strong> “low risk” category.<br />
The new procedure establishes risk categories that have qualitative meaning. Within each<br />
grouping, a solid empirical basis exists that indicates that <strong>the</strong> identified states are quite<br />
comparable in terms <strong>of</strong> risk. Moreover, we can be more confident that states assigned to different<br />
groupings are qualitatively distinct. Since <strong>the</strong> groupings were created by using in<strong>for</strong>mation from<br />
<strong>the</strong> confidence ranges, it is unlikely that states in lower groupings have a true estimated risk that<br />
is higher than countries assigned to higher risk categories. In sum, by moving away from<br />
arbitrary categories <strong>of</strong> risk, <strong>the</strong> new classification procedure provides better guidance <strong>for</strong> making<br />
more accurate country assessments.<br />
223
Overview <strong>of</strong> Results<br />
Table 3.4-2 lists <strong>the</strong> 25 countries with <strong>the</strong> highest risk scores. With <strong>the</strong> exception <strong>of</strong> three states<br />
(Afghanistan, Iraq, and Nepal), all <strong>of</strong> <strong>the</strong>m are African. Indeed, <strong>the</strong> concentration <strong>of</strong> African<br />
states among <strong>the</strong> grouping <strong>of</strong> states with <strong>the</strong> highest estimated risk is even higher than <strong>the</strong><br />
previous findings reported in 2008, when 19 <strong>of</strong> <strong>the</strong> 25 states were from Africa. Higher estimated<br />
risk scores in <strong>the</strong> Democratic Republic <strong>of</strong> <strong>the</strong> Congo, Guinea-Bissau, and Mauritania have led<br />
<strong>the</strong>se countries into <strong>the</strong> top 25, supplanting Bangladesh, Lebanon, and Haiti. No doubt, a quick<br />
review <strong>of</strong> <strong>the</strong> top 25 list reveals that problems in Africa remain acute, and, as <strong>the</strong> discussion<br />
below suggests, <strong>the</strong>y are likely getting worse.<br />
Overall, <strong>the</strong> mean instability scores across countries <strong>for</strong>merly classified at moderate or high risk<br />
have increased significantly since <strong>the</strong> last report. Among countries classified at high risk in <strong>the</strong><br />
previous analyses, <strong>the</strong> average risk score was 14.1. For <strong>the</strong> same set <strong>of</strong> countries, <strong>the</strong> average is<br />
now 17.3, a difference that is statistically significant. For <strong>the</strong> countries previously classified at<br />
moderate risk, <strong>the</strong> previous average was 5.3. It is now 7.4 <strong>for</strong> those countries, a difference that is<br />
also statistically significant. Among countries classified previously at low risk, <strong>the</strong> average score<br />
did increase somewhat (from 1.5 to 1.6), but that difference is not statistically meaningful. What<br />
factors explain <strong>the</strong> upward shift in risk estimates among states that are already vulnerable to<br />
instability and conflict?<br />
Table 3.4-2. Highest Estimated Risk <strong>for</strong> Instability, 2008-2010.<br />
Rank Country Risk Score<br />
1 Afghanistan 38.9<br />
2 Niger 33.1<br />
3 Burundi 30.3<br />
4 Congo, Democratic Republic* 29.1<br />
5 Djibouti 28.2<br />
6 Ethiopia 26.8<br />
7 Mali 25.9<br />
8 Nigeria 25.6<br />
9 Tanzania 24.5<br />
10 Zambia 24.2<br />
11 Sierra Leone 23.3<br />
12 Liberia 22.7<br />
13 Mauritania* 21.4<br />
14 Guinea-Bissau* 20.2<br />
15 Angola 20.0<br />
16 Iraq 19.7<br />
17 Côte d’Ivoire 19.5<br />
18 Kenya 18.0<br />
19 Central African Republic 17.6<br />
20 Somalia 16.9<br />
21 Chad 16.6<br />
22 Benin 16.0<br />
23 Mozambique 15.8<br />
24 Malawi 15.5<br />
25 Nepal 15.2<br />
* New to <strong>the</strong> top 25 in <strong>the</strong> most recent rankings<br />
224
The modest push <strong>of</strong> democratization and <strong>the</strong> inherent inconsistency <strong>of</strong> regime that follows is one<br />
<strong>of</strong> <strong>the</strong> key factors contributing to increased risks <strong>of</strong> instability. In <strong>the</strong> most recent data available<br />
on regime characteristics, seven countries <strong>for</strong>mally classified at moderate risk or high risk<br />
transitioned to partial democracies from more autocratic regime types. No countries in ei<strong>the</strong>r <strong>of</strong><br />
those categories <strong>of</strong> risk transitioned to consolidated democracies. (In <strong>the</strong> low-risk category, Chile<br />
and <strong>the</strong> Slovak Republic transitioned to more coherent democracies, which led to significantly<br />
lower risk scores <strong>for</strong> both countries.) One country, Bangladesh, experienced a setback in its<br />
democratic transition and was reclassified as a more autocratic state in <strong>the</strong> most recent data,<br />
which contributed to a lower estimated risk. On <strong>the</strong> whole, though, <strong>the</strong> net effect <strong>of</strong> regime<br />
changes in <strong>the</strong> class <strong>of</strong> states with at least moderate risk was an exertion <strong>of</strong> more upward<br />
pressure on risk scores.<br />
A slight increase in <strong>the</strong> number <strong>of</strong> active armed conflicts around <strong>the</strong> world has also contributed<br />
to <strong>the</strong> overall increase in <strong>the</strong> risk <strong>of</strong> instability. With more neighborhoods experiencing <strong>the</strong><br />
volatile externalities generated by violent conflict—refugee flows, arms trafficking, threats <strong>of</strong><br />
intervention—<strong>the</strong> risk <strong>of</strong> instability <strong>for</strong> <strong>the</strong> residents has increased. (Since <strong>the</strong> last publication <strong>of</strong><br />
<strong>the</strong> rankings, a slight improvement has been implemented to <strong>the</strong> definition <strong>of</strong> a neighborhood<br />
conflict. As a result, several states that were originally coded as involved in active conflict are no<br />
longer coded as such. Previously, a neighbor was classified at war when it was involved in any<br />
armed conflict, even a conflict not being fought on its territory. But that definition was<br />
inconsistent with <strong>the</strong> <strong>the</strong>oretical expectation about how a neighborhood conflict relates to <strong>the</strong><br />
risks <strong>of</strong> instability. In almost all imaginable circumstances, <strong>the</strong> spillover effects <strong>of</strong> neighborhood<br />
conflict operate only when <strong>the</strong> conflict is being fought directly on <strong>the</strong> neighbor’s territory. As a<br />
result <strong>of</strong> this coding change, <strong>the</strong> only significant coding change implemented in <strong>the</strong> new<br />
analyses, <strong>the</strong> risk scores <strong>for</strong> some states declined. Examples <strong>of</strong> such states include any state that<br />
bordered a state that had contributed troops to <strong>the</strong> multilateral ef<strong>for</strong>ts in Iraq or Afghanistan. This<br />
set <strong>of</strong> countries tended to have relative low risks <strong>of</strong> instability in <strong>the</strong> first place, so <strong>the</strong> impact <strong>of</strong><br />
<strong>the</strong> definitional change was slight.) All told, risk estimates <strong>for</strong> 13 countries increased because a<br />
new conflict erupted in a neighboring state (or an old conflict resurged). Only one state—Papua<br />
New Guinea—has a lower risk estimate because a conflict subsided in a neighboring state (<strong>the</strong><br />
conflict in <strong>the</strong> Aceh territory in Indonesia, which subsided in 2006).<br />
Changes Since 2007<br />
To see more clearly how democratization and neighborhood conflict can have an immediate<br />
impact on increasing <strong>the</strong> risks <strong>of</strong> instability, let us take a more detailed look at <strong>the</strong> circumstances<br />
in some countries that experienced significant change from <strong>the</strong> previous rankings.<br />
For purposes <strong>of</strong> identifying cases in which significant change has occurred, we adopt a clear<br />
standard that utilizes in<strong>for</strong>mation from each country’s confidence interval. To identify cases in<br />
which <strong>the</strong> risk <strong>of</strong> instability has significantly increased, we require that <strong>the</strong> lower end <strong>of</strong> <strong>the</strong> new<br />
confidence range be greater than <strong>the</strong> risk estimate from <strong>the</strong> previous analysis. This standard<br />
allows us to conclude that <strong>the</strong> change in underlying risk has increased or has remained largely<br />
unchanged, but we can be nearly certain that it has not decreased. Cases <strong>of</strong> significant<br />
improvement require that <strong>the</strong> upper bound <strong>of</strong> <strong>the</strong> new confidence range be less than <strong>the</strong> risk<br />
estimate from <strong>the</strong> previous analysis. In this case, <strong>the</strong> standard permits an interpretation that <strong>the</strong><br />
risk in a given country has likely declined or remained unchanged, but it has not increased.<br />
225
Table 3.4-3 lists <strong>the</strong> 17 countries with <strong>the</strong> largest increase in risk scores. Of <strong>the</strong>se, <strong>the</strong> change in<br />
13 <strong>of</strong> <strong>the</strong> countries satisfies <strong>the</strong> standard <strong>for</strong> a significant worsening. For each <strong>of</strong> <strong>the</strong> countries,<br />
data are presented corresponding to <strong>the</strong> previous ledger rankings (based on <strong>the</strong> <strong>for</strong>ecast period<br />
2005–2007) alongside data used <strong>for</strong> <strong>the</strong> current <strong>for</strong>ecast period (2008–2010). The net change in<br />
risk score is listed with an indication (*) <strong>of</strong> whe<strong>the</strong>r <strong>the</strong> change satisfies <strong>the</strong> threshold defined<br />
above. In most <strong>of</strong> <strong>the</strong>se cases, <strong>the</strong> increase in risk can be traced to two separate factors:<br />
transitions to democratic governance and armed conflict in neighboring countries.<br />
Undoubtedly, <strong>the</strong> process <strong>of</strong> democratization is a welcome development because it brings<br />
desirable qualities to governance (e.g., greater citizen participation, broader competition <strong>for</strong><br />
leadership positions, more expansive civil liberties, etc.). For many observers, though, <strong>the</strong><br />
heightened dangers <strong>of</strong> instability during this period are <strong>of</strong>ten under-appreciated.<br />
Table 3.4-3. Largest Increases in Risk <strong>of</strong> Instability.<br />
Forecast<br />
Period<br />
Country<br />
Risk Score<br />
Net Change<br />
Confidence<br />
Range<br />
Regime<br />
Consistency<br />
Partial<br />
Democracy<br />
Infant<br />
Mortality<br />
Economic<br />
Openness<br />
Militarization<br />
Neighborhood<br />
War<br />
2005-07<br />
2008–10<br />
Congo, Dem.<br />
Rep.<br />
6.9<br />
29.1 22.2*<br />
3.7 – 11.8<br />
18.0 – 42.5<br />
0<br />
25<br />
<br />
•<br />
129<br />
128<br />
70%<br />
65%<br />
115<br />
115<br />
•<br />
•<br />
2005–07<br />
2008–10<br />
Burundi 11.1<br />
30.3 19.2*<br />
6.5 – 18.0<br />
19.0 – 45.2<br />
0<br />
36<br />
<br />
•<br />
114<br />
109<br />
40%<br />
59%<br />
1112<br />
112<br />
<br />
•<br />
2005–07<br />
2008–10<br />
Mauritania 5.1<br />
21.4 16.3*<br />
3.1–7.5<br />
12.6–33.0<br />
36<br />
16<br />
<br />
<br />
78<br />
77<br />
25%<br />
123%<br />
671<br />
690<br />
•<br />
•<br />
2005–07<br />
2008–10<br />
Nigeria 13.4<br />
25.6 12.2*<br />
7.6–21.5<br />
15.9–37.4<br />
16<br />
16<br />
•<br />
•<br />
101<br />
98<br />
92%<br />
69%<br />
124<br />
112<br />
<br />
•<br />
2005–07<br />
2008–10<br />
2005–07<br />
2008–10<br />
2005–07<br />
2008–10<br />
2005–07<br />
2008–10<br />
2005–07<br />
2008–10<br />
2005–07<br />
2008–10<br />
Djibouti 17.1<br />
28.2 11.1<br />
Guinea–<br />
9.3<br />
Bissau<br />
20.2 10.9*<br />
Angola 10.5<br />
20.0 9.5<br />
Zambia 14.8<br />
24.2 9.4*<br />
Pakistan 5.2<br />
14.6 9.4*<br />
Nepal 6.4<br />
15.2 8.8*<br />
8.4–31.3<br />
15.7–45.3<br />
4.8–16.6<br />
11.3–32.7<br />
4.7–20.6<br />
9.2–35.8<br />
9.1–23.1<br />
14.9–36.8<br />
3.3–7.9<br />
9.2–22.0<br />
3.8–10.0<br />
10.6–21.1<br />
4<br />
4<br />
1<br />
36<br />
4<br />
4<br />
25<br />
25<br />
25<br />
4<br />
36<br />
36<br />
•<br />
•<br />
<br />
•<br />
<br />
<br />
•<br />
•<br />
<br />
<br />
<br />
•<br />
101<br />
86<br />
125<br />
129<br />
154<br />
154<br />
101<br />
101<br />
80<br />
77<br />
59<br />
46<br />
133%<br />
137%<br />
87%<br />
89%<br />
125%<br />
108%<br />
47%<br />
78%<br />
31%<br />
36%<br />
48%<br />
41%<br />
1412<br />
1412<br />
585<br />
547<br />
762<br />
664<br />
139<br />
137<br />
606<br />
581<br />
493<br />
474<br />
~<br />
•<br />
<br />
<br />
<br />
•<br />
<br />
•<br />
•<br />
•<br />
•<br />
•<br />
2005–07<br />
2008–10<br />
2005–07<br />
2008–10<br />
2005–07<br />
2008–10<br />
Uganda 4.9<br />
12.9 8.0*<br />
Burkina Faso 8.3<br />
14.1 5.8*<br />
Cameroon 6.8<br />
12.5 5.7*<br />
2.8–8.1<br />
8.0–19.8<br />
5.0–12.9<br />
8.8–21.4<br />
4.2–10.5<br />
7.3–19.7<br />
16<br />
1<br />
0<br />
0<br />
16<br />
16<br />
<br />
<br />
<br />
<br />
<br />
<br />
80<br />
77<br />
97<br />
122<br />
87<br />
86<br />
41%<br />
45%<br />
32%<br />
38%<br />
39%<br />
43%<br />
198<br />
198<br />
80<br />
80<br />
143<br />
143<br />
•<br />
•<br />
<br />
<br />
<br />
•<br />
2005–07<br />
2008–10<br />
Tanzania 18.9<br />
24.5<br />
5.6 12.3–27.9<br />
16.2–35.5<br />
4<br />
1<br />
•<br />
•<br />
78<br />
74<br />
46%<br />
50%<br />
74<br />
74<br />
•<br />
•<br />
2005–07<br />
2008–10<br />
Chad 11.2<br />
16.6<br />
5.4 5.4–20.7<br />
8.8–27.7<br />
4<br />
4<br />
<br />
<br />
78<br />
124<br />
46%<br />
83%<br />
74<br />
360<br />
•<br />
•<br />
226
Table 3.4-3. Largest Increases in Risk <strong>of</strong> Instability.<br />
Forecast<br />
Period<br />
Country<br />
Risk Score<br />
Net Change<br />
Confidence<br />
Range<br />
Regime<br />
Consistency<br />
Partial<br />
Democracy<br />
Infant<br />
Mortality<br />
Economic<br />
Openness<br />
Militarization<br />
Neighborhood<br />
War<br />
2005–07<br />
2008–10<br />
2005–07<br />
2008–10<br />
Kyrgyz<br />
Republic<br />
3.5<br />
8.8<br />
Bolivia 7.6<br />
12.8<br />
5.3* 1.7–6.2<br />
4.7–14.6<br />
5.2* 4.5–12.1<br />
7.8–19.3<br />
9<br />
9<br />
<br />
•<br />
59<br />
36<br />
96%<br />
116%<br />
NOTE: An asterisk (*) indicates a net change that qualifies as significant according to <strong>the</strong> definition <strong>of</strong>fered above. The<br />
numbers in <strong>the</strong> infant mortality column are <strong>the</strong> total infant deaths per 1,000 live births. The percentage in <strong>the</strong> economic<br />
openness column refers to <strong>the</strong> percentage <strong>of</strong> a country’s GDP accounted <strong>for</strong> by <strong>the</strong> value <strong>of</strong> its imports plus exports. The<br />
number in <strong>the</strong> militarization column refers to <strong>the</strong> number <strong>of</strong> active military personnel per 100,000 people. Finally, <strong>the</strong><br />
symbol • means “yes” and <strong>the</strong> symbol means “no.”<br />
Partial democracies are at greater risk <strong>for</strong> instability than autocracies or full democracies.<br />
Repressive tactics adopted by autocratic governments <strong>of</strong>ten smo<strong>the</strong>r <strong>the</strong> potential <strong>for</strong> political<br />
instability. Coherent and mature democracies possess <strong>the</strong> capacity to address group grievances<br />
and manage <strong>the</strong> competition between groups that vie <strong>for</strong> political power and o<strong>the</strong>r resources,<br />
<strong>the</strong>reby reducing <strong>the</strong> risks <strong>of</strong> instability. Partial democracies typically possess nei<strong>the</strong>r <strong>of</strong> <strong>the</strong><br />
qualities <strong>of</strong> full autocracies nor those <strong>of</strong> democracies, leaving <strong>the</strong>m more vulnerable to <strong>the</strong><br />
drivers <strong>of</strong> instability and conflict. 27 Indeed, <strong>the</strong> historical data over <strong>the</strong> past half-century shows a<br />
strong empirical relationship between partial democracy and <strong>the</strong> future onset <strong>of</strong> instability or<br />
conflict.<br />
The bout <strong>of</strong> instability that raged in Kenya after its December 2007 presidential election serves<br />
as a recent illustration. In <strong>the</strong> ledger published in Peace and Conflict 2008, data from 2004 were<br />
used to produce Kenya’s risk estimate <strong>for</strong> <strong>the</strong> period 2005–2007. At <strong>the</strong> time, Kenya was<br />
classified as a partial democracy, according to <strong>the</strong> Polity project, because <strong>the</strong> competitiveness <strong>of</strong><br />
political participation was still seen as in transition from competition that had been largely<br />
suppressed by <strong>the</strong> regime. Its risk score, 12.9, reflected <strong>the</strong> potential <strong>for</strong> instability associated<br />
with <strong>the</strong>se regime characteristics, placing it squarely among o<strong>the</strong>r high-risk states in Africa,<br />
despite a record <strong>of</strong> relative stability compared to neighbors like Ethiopia, Somalia, and Sudan.<br />
Those institutions would prove to lack <strong>the</strong> resilience to withstand <strong>for</strong>ces that developed in <strong>the</strong><br />
months preceding <strong>the</strong> close presidential election, as well as <strong>the</strong> pressures that were released in its<br />
aftermath. After months <strong>of</strong> campaigning with appeals to rectifying injustices based on<br />
advantages accorded to ethnic Kikuyus, opposition candidate Raila Odinga appeared to be<br />
positioned to win <strong>the</strong> election based on pre-election polling. When reports indicated that he had<br />
lost by a slim margin, amid widespread reports <strong>of</strong> election fraud, <strong>the</strong> <strong>for</strong>ces driving <strong>the</strong> potential<br />
<strong>for</strong> instability were catalyzed. In <strong>the</strong> weeks following <strong>the</strong> election, approximately 1,000 people<br />
were killed in ethnically based violence throughout <strong>the</strong> country.<br />
The experience <strong>of</strong> Kenya in late 2007 and early 2008 illustrates <strong>the</strong> vulnerabilities <strong>of</strong> partial<br />
democracies to some <strong>of</strong> <strong>the</strong> <strong>for</strong>ces that can catalyze major episodes <strong>of</strong> instability. Kenya<br />
continues to be classified as a partial democracy, receiving an updated risk score <strong>of</strong> 18.0, which<br />
reflects some <strong>of</strong> <strong>the</strong> worsening conditions in <strong>the</strong> country in <strong>the</strong> aftermath <strong>of</strong> recent instability.<br />
With Kenya’s experience in mind, it is worthwhile to briefly note some o<strong>the</strong>r countries that have<br />
64<br />
64<br />
•<br />
•<br />
54<br />
49<br />
58%<br />
66%<br />
333<br />
404<br />
759<br />
887<br />
•<br />
<br />
<br />
•<br />
227
een newly classified as partial democracies in <strong>the</strong> updated rankings, a change that has<br />
significantly increased <strong>the</strong>ir respective risk <strong>for</strong> future instability.<br />
The Democratic Republic <strong>of</strong> Congo, Burundi, Mauritania, Guinea-Bissau, Nepal, and <strong>the</strong> Kyrgyz<br />
Republic all transitioned in varying extents to partial democratic rule between 2005–2007. For<br />
any <strong>of</strong> <strong>the</strong>se countries, much could be written about how <strong>the</strong> transition to more democratic<br />
governing arrangements influences <strong>the</strong> estimated risk <strong>for</strong> instability. Space constraints permit a<br />
focus on just one <strong>of</strong> <strong>the</strong>se states. For <strong>the</strong> purposes <strong>of</strong> illustrating <strong>the</strong> impact that democratic<br />
transition can have on <strong>the</strong> estimated risk <strong>of</strong> instability, <strong>the</strong> case <strong>of</strong> <strong>the</strong> Kyrgyz Republic will be<br />
most suitable.<br />
In <strong>the</strong> previous ledger rankings, <strong>the</strong> Kyrgyz Republic estimate <strong>for</strong> risk <strong>of</strong> instability from 2005 to<br />
2007 was based on data from 2004. In that year, governing arrangements in <strong>the</strong> country tended<br />
toward autocracy, although constitutional provisions did allow <strong>for</strong> some competitive elections<br />
and fewer restrictions on political participation. Still, Kyrgyzstan did not qualify as a partial<br />
democracy, which contributed to an estimate <strong>of</strong> only moderate risk <strong>for</strong> instability (3.5). By late<br />
2006, a new constitution was in place that gave more political authority to <strong>the</strong> parliament. The<br />
changes in regime characteristics were sufficient to reclassify Kyrgyzstan as a partial democracy<br />
according to <strong>the</strong> Polity project’s coding rules. In subsequent months, that authority would shift<br />
back to <strong>the</strong> presidency, but Kyrgyzstan continues to be coded as partially democratic.<br />
Predictably, <strong>the</strong> tenuous step toward democratization in Kyrgyzstan led to an increase in <strong>the</strong><br />
estimated risk <strong>of</strong> instability (8.8). What makes <strong>the</strong> case <strong>of</strong> Kyrgyzstan notable is that <strong>the</strong><br />
estimated risk <strong>of</strong> instability increased despite significant improvement in o<strong>the</strong>r areas. From 2004<br />
to 2007, <strong>the</strong> country’s infant mortality rate declined from roughly 58 deaths per 1,000 live births<br />
to 36. Moreover, a low-intensity armed conflict in neighboring Uzbekistan in 2004 had subsided<br />
by 2007. Despite <strong>the</strong>se changes, which exert modest downward pressure on risk estimates, <strong>the</strong><br />
movement toward democracy had a more powerful impact on pushing <strong>the</strong> estimated risk upward.<br />
For o<strong>the</strong>r countries listed in Table 3.4-3, <strong>the</strong> heightened risk <strong>of</strong> instability is due to <strong>the</strong> onset (or<br />
recurrence) <strong>of</strong> armed conflict in a neighboring state. In Burundi, <strong>for</strong> example, <strong>the</strong> risk <strong>of</strong><br />
instability increased substantially, due to renewed fighting in <strong>the</strong> neighboring Democratic<br />
Republic <strong>of</strong> <strong>the</strong> Congo (DRC). That same recurrence <strong>of</strong> conflict in <strong>the</strong> DRC is responsible <strong>for</strong> <strong>the</strong><br />
heightened risk estimates in Angola. Nigeria’s risk <strong>of</strong> instability increased with <strong>the</strong> recurrence <strong>of</strong><br />
conflict in Chad in 2005 and less intense violence in Niger in 2007.<br />
Table 3.4-4 presents a list <strong>of</strong> ten countries that showed <strong>the</strong> largest improvement in risk scores. Of<br />
<strong>the</strong>se countries, seven made improvements that satisfied <strong>the</strong> requirements <strong>for</strong> significance<br />
outlined above. Glancing down <strong>the</strong> “Net Change” column <strong>of</strong> <strong>the</strong> table, it can be seen that <strong>the</strong><br />
absolute level <strong>of</strong> reductions in risk is much lower than <strong>the</strong> absolute level <strong>of</strong> increases observed in<br />
Table 3.4-3. Given <strong>the</strong> overall global trend toward greater levels <strong>of</strong> instability, <strong>the</strong>se differences<br />
should be expected.<br />
Just as <strong>the</strong> risk <strong>of</strong> instability can increase substantially in a short period <strong>of</strong> time, it can decrease<br />
just as suddenly. For instance, <strong>the</strong> termination <strong>of</strong> a neighborhood conflict can reduce <strong>the</strong> risk <strong>of</strong><br />
instability <strong>for</strong> a country abruptly. As mentioned previously, <strong>the</strong> lower risk score <strong>for</strong> Papua New<br />
Guinea is <strong>the</strong> result <strong>of</strong> <strong>the</strong> cessation <strong>of</strong> serious armed violence in neighboring Indonesia in<br />
2006—<strong>the</strong> only conflict termination since <strong>the</strong> previous publication <strong>of</strong> <strong>the</strong> ledger.<br />
For some countries in Table 3.4-4, <strong>the</strong> estimated risk <strong>of</strong> instability decreased because <strong>the</strong> country<br />
experienced a setback in its transition to democracy. Both Fiji and Bangladesh were coded as<br />
228
partial democracies in <strong>the</strong> previous rankings. In <strong>the</strong> most recent data, governing arrangements in<br />
both countries have shifted toward greater autocracy, which produces lower estimated risk<br />
scores. In Bangladesh, <strong>the</strong> lower risk estimate may be short-lived. Parliamentary elections were<br />
postponed in January 2007 due to serious concerns <strong>of</strong> potential electoral fraud and corruption.<br />
President Iajuddin Ahmed resigned from <strong>of</strong>fice, and a series <strong>of</strong> measures were implemented as<br />
part <strong>of</strong> a general state <strong>of</strong> emergency. The changes led to <strong>the</strong> Polity project’s recoding<br />
Bangladesh’s regime as essentially autocratic in 2007. Since <strong>the</strong> parliamentary elections were<br />
held in December 2008, it is conceivable that Bangladesh may qualify as a partial democracy in<br />
a future release <strong>of</strong> Polity data, which would cause risk estimates to return to higher levels.<br />
Table 3.4-4. Largest Reduction in Risk <strong>of</strong> Instability.<br />
Forecast<br />
Period<br />
Country<br />
Confidence<br />
Range<br />
2005–07<br />
2008–10<br />
2005–07<br />
2008–10<br />
2005–07<br />
2008–10<br />
2005–07<br />
2008–10<br />
2005–07<br />
2008–10<br />
Risk Score<br />
Iraq 29.9<br />
19.7<br />
Bangladesh 13.1<br />
3.0<br />
Serbia 4.5<br />
1.7<br />
Fiji 3.6<br />
0.8<br />
Papua New<br />
Guinea<br />
5.1<br />
2.4<br />
Net Change<br />
–10.2* 20.0 – 43.2<br />
12.0 – 28.8<br />
–10.1* 9.1 – 18.7<br />
19.0 – 5.2<br />
–2.8* 2.4–8.0<br />
0.7–3.5<br />
–2.8* 1.9–6.0<br />
0.3–1.7<br />
–2.7 2.5–9.3<br />
1.1–4.8<br />
Regime<br />
Consistency<br />
0<br />
0<br />
36<br />
36<br />
36<br />
64<br />
36<br />
16<br />
100<br />
100<br />
Partial<br />
Democracy<br />
Infant<br />
Mortality<br />
• 101<br />
• 50<br />
• 56<br />
51<br />
• 13<br />
• 7<br />
•<br />
<br />
<br />
<br />
16<br />
16<br />
69<br />
55<br />
Economic<br />
Openness<br />
22%<br />
62%<br />
36%<br />
51%<br />
74%<br />
76%<br />
40%<br />
128%<br />
32%<br />
147%<br />
Militarization<br />
668<br />
668<br />
180<br />
137<br />
1350<br />
324<br />
357<br />
480<br />
52<br />
48<br />
Neighborhood<br />
War<br />
•<br />
•<br />
•<br />
•<br />
•<br />
<br />
<br />
<br />
•<br />
<br />
2005–07<br />
2008–10<br />
Honduras 6.6<br />
4.2<br />
–2.4 3.9–9.3<br />
2.2–6.8<br />
49<br />
49<br />
•<br />
•<br />
32<br />
23<br />
85%<br />
130%<br />
284<br />
287<br />
•<br />
<br />
2005–07<br />
2008–10<br />
Albania 4.5<br />
2.6<br />
–1.9* 2.6–7.3<br />
1.4–4.3<br />
49<br />
81<br />
•<br />
•<br />
16<br />
15<br />
65%<br />
79%<br />
691<br />
363<br />
•<br />
<br />
2005–07<br />
2008–10<br />
Nicaragua 5.9<br />
4.1<br />
–1.8 3.4–95<br />
2.2–6.7<br />
64<br />
81<br />
•<br />
•<br />
31<br />
29<br />
81%<br />
120%<br />
260<br />
253<br />
•<br />
<br />
2005–07<br />
2008–10<br />
Guatemala 7.3<br />
5.6<br />
–1.7 4.8–11.0<br />
3.5–8.7<br />
64<br />
64<br />
•<br />
•<br />
33<br />
31<br />
48%<br />
66%<br />
390<br />
269<br />
•<br />
<br />
2005–07<br />
2008–10<br />
Vietnam 2.3<br />
0.6<br />
–1.7* 0.6–5.8<br />
0.2–1.1<br />
49<br />
49<br />
<br />
<br />
17<br />
15<br />
140%<br />
159%<br />
6772<br />
589<br />
<br />
<br />
NOTE: An asterisk (*) indicates a net change that qualifies as significant according to <strong>the</strong> definition <strong>of</strong>fered above.<br />
The numbers in <strong>the</strong> infant mortality column are <strong>the</strong> total infant deaths per 1,000 live births. The percentage in <strong>the</strong><br />
economic openness column refers to <strong>the</strong> percentage <strong>of</strong> a country’s GDP accounted <strong>for</strong> by <strong>the</strong> value <strong>of</strong> its imports<br />
plus exports. The number in <strong>the</strong> militarization column refers to <strong>the</strong> number <strong>of</strong> active military personnel per 100,000<br />
people. Finally, <strong>the</strong> symbol •means “yes” and <strong>the</strong> symbol means “no.”<br />
For many <strong>of</strong> <strong>the</strong> o<strong>the</strong>r countries in Table 3.4-4, improvements in <strong>the</strong> economic and social<br />
domains were most responsible <strong>for</strong> reductions in <strong>the</strong> underlying risk <strong>of</strong> instability. Iraq posted<br />
<strong>the</strong> largest improvement from <strong>the</strong> previous rankings <strong>for</strong> <strong>the</strong> 2005–2007 period. Large<br />
improvements in infant mortality rates and in economic openness are <strong>the</strong> main sources <strong>of</strong> <strong>the</strong><br />
reduced risk estimate. The figures from 2004 were particularly bad, an unsurprising artifact <strong>of</strong><br />
<strong>the</strong> vast disruption caused by <strong>the</strong> war that began in 2003. Iraq’s infant mortality rate (as<br />
estimated in <strong>the</strong> CIA Factbook) was approximately 100 per 1,000 live births, <strong>the</strong> twentieth<br />
highest figure <strong>of</strong> all countries worldwide. The proportion <strong>of</strong> its GDP accounted <strong>for</strong> by trade was<br />
just 22 percent, ninth worst in <strong>the</strong> world. By 2007, those indicators had improved. Now, Iraq’s<br />
infant mortality (about 50 deaths per 1,000 live births) is more comparable to that <strong>of</strong> Bangladesh.<br />
229
In addition, <strong>the</strong> indicator <strong>for</strong> economic openness has improved substantially to 62 percent. While<br />
<strong>the</strong> improvements are notable, Iraq’s overall risk score (19.7) continues to place it in <strong>the</strong> highest<br />
risk category, a solemn reminder <strong>of</strong> how grim <strong>the</strong> circumstances remain <strong>the</strong>re.<br />
In Serbia, improvements on several dimensions contributed to substantial reductions in its risk<br />
score. Although coded as a partial democracy, Serbia’s regime consistency score improved from<br />
36 in 2004 to 64, reflecting steady movement toward greater democratic consolidation. Infant<br />
mortality rates decreased from about 12 per 1,000 births to about 7. Finally, <strong>the</strong> militarization<br />
indictor dropped significantly, reflecting a sizeable reduction in <strong>the</strong> number <strong>of</strong> active armed<br />
personnel in Serbia from 2004 to 2007. In Albania and Vietnam, combined improvements in<br />
infant mortality, economic openness, and militarization all contributed to modest, yet significant,<br />
reductions in estimated risk. The achievement in Albania is notable because it qualifies as a<br />
partial democracy, illustrating how countries in <strong>the</strong> midst <strong>of</strong> a democratic transition can mitigate<br />
<strong>the</strong> pr<strong>of</strong>ound risks inherent in that trans<strong>for</strong>mation through effective governance.<br />
Conclusion<br />
The sudden and significant increase in <strong>the</strong> estimated risk <strong>of</strong> instability across countries that were<br />
already vulnerable should be a cause <strong>for</strong> concern <strong>for</strong> policy-makers involved with managing<br />
conflict and addressing <strong>the</strong> larger challenges to state stability. There are two distinct causes <strong>for</strong><br />
heightened levels <strong>of</strong> risk, which means that policy-makers should be attentive to how policy<br />
responses relate to each.<br />
As regimes trans<strong>for</strong>m from autocracies to partial democracies, <strong>the</strong> estimated risks <strong>of</strong> major<br />
instability events increases dramatically. Policy responses that address <strong>the</strong> specific vulnerabilities<br />
<strong>of</strong> such regimes have <strong>the</strong> potential to mitigate instability risks. For example, any government<br />
policies that reduce <strong>the</strong> extent <strong>of</strong> factional-based political competition can increase <strong>the</strong> prospects<br />
that multiple sub-national groups (ethnic or non-ethnic) see <strong>the</strong>mselves as stakeholders in <strong>the</strong><br />
current set <strong>of</strong> institutional arrangements. A greater sensitivity to <strong>the</strong> importance <strong>of</strong> transparency<br />
in electoral procedures can reduce <strong>the</strong> catalytic potential <strong>for</strong> tightly contested elections to trigger<br />
instability. And, <strong>of</strong> course, while <strong>the</strong> volatile transition to consolidated democracy occurs, it is<br />
crucial that attention be paid to policies that enhance government’s ability to deliver core<br />
services to <strong>the</strong> population (as illustrated by Albania’s recent experience). Doing so will enhance<br />
<strong>the</strong> likelihood that it is viewed as legitimate, mitigating <strong>the</strong> risks faced by typical partial<br />
democracies.<br />
At <strong>the</strong> same time, estimated risks may suddenly become elevated because <strong>of</strong> <strong>the</strong> onset or<br />
recurrence <strong>of</strong> a neighborhood conflict. In <strong>the</strong>se cases, appropriate policy responses should<br />
address some <strong>of</strong> <strong>the</strong> contagion effects <strong>of</strong> conflicts. For a country with a neighbor involved in<br />
civil conflict, attention should be paid to <strong>the</strong> relationship that ethnic groups located near <strong>the</strong><br />
border may have with warring parties in <strong>the</strong> country at war. Where <strong>the</strong>re is potential <strong>for</strong> crossborder<br />
activity, appropriate responses may include heightened border monitoring and control to<br />
prevent <strong>the</strong> transfer <strong>of</strong> arms or <strong>the</strong> movement <strong>of</strong> soldiers into <strong>the</strong> warring country.<br />
Ultimately, <strong>the</strong> key to effective policy responses to heightened risks <strong>of</strong> instability depends<br />
heavily on an ability to trace back from <strong>the</strong> estimate to <strong>the</strong> particular factors that exert <strong>the</strong> most<br />
influence on it. The Peace and Conflict Instability Ledger places an emphasis on making<br />
in<strong>for</strong>mation about <strong>the</strong> risk estimates as accessible and interpretable as possible, so that<br />
diagnosing <strong>the</strong> foundations <strong>of</strong> <strong>the</strong>se risks can be more effective. Moreover, by explicitly<br />
reporting confidence ranges associated with each country estimate, <strong>the</strong> ledger <strong>of</strong>fers policy-<br />
230
makers enhanced leverage <strong>for</strong> making more confident assertions about <strong>the</strong> substantive<br />
importance <strong>of</strong> any year-to-year change observed in a particular country—a crucial necessity <strong>for</strong><br />
making precise assessments about progress in at-risk countries. This chapter has <strong>of</strong>fered several<br />
brief discussions <strong>of</strong> cases to be suggestive <strong>of</strong> how in<strong>for</strong>mation from <strong>the</strong> ledger can be used to<br />
help clarify risk trends in a particular country. Employed alongside <strong>the</strong> detailed in<strong>for</strong>mation<br />
(both qualitative and quantitative) available to country experts, <strong>the</strong> ledger can be a powerful<br />
diagnostic tool in any policy-makers’ toolkit <strong>for</strong> assessing risk levels across countries.<br />
The Peace and Conflict Instability Ledger ranks states according to <strong>the</strong> <strong>for</strong>ecasted risk <strong>of</strong> future<br />
instability. See notes following <strong>the</strong>se listings <strong>for</strong> a description <strong>of</strong> <strong>the</strong> codes <strong>for</strong> each indicator and<br />
also a detailed explanation <strong>of</strong> <strong>the</strong> confidence range (note 10).<br />
Table 3.4-5 - The Peace and Conflict Instability Ledger (abridged).<br />
Region<br />
Recent Instability<br />
Country<br />
Regime<br />
Consistency<br />
Infant<br />
Mortality<br />
Economic<br />
Openness<br />
Militarization<br />
Neighborhood<br />
War<br />
Risk Category<br />
Risk Score<br />
Confidence<br />
Range<br />
Lower<br />
Upper<br />
Africa (Top 15)<br />
Asia (Top 10)<br />
Eastern Europe (Top 10)<br />
&<br />
th<br />
e<br />
C<br />
Niger • • • • 38.9 21.3 47.6<br />
Burundi • • • • 30.3 19.0 45.2<br />
• Dem. Rep. <strong>of</strong> Congo • • • • • 29.1 18.0 42.5<br />
Djibouti • • • • • 28.2 15.7 38.7<br />
Ethiopia • • • • 26.8 18.2 38.0<br />
Mali • • • 25.9 15.7 38.7<br />
Nigeria • • • • 25.6 15.9 37.4<br />
Tanzania • • • 24.5 16.2 35.5<br />
Zambia • • • • 24.2 14.9 36.8<br />
Sierra Leone • • 23.3 12.4 37.7<br />
Liberia • • 22.7 12.3 38.1<br />
Mauritania • • 21.4 12.6 33.0<br />
Guinea-Bissau • • 20.2 11.3 32.7<br />
Angola • • • 20.0 9.2 35.8<br />
• Côte d’Ivoire • • • 19.5 11.7 30.1<br />
• Afghanistan • • • • 38.9 23.7 58.2<br />
Nepal • • 15.2 10.6 21.1<br />
• Pakistan • • 14.6 9.2 22.0<br />
Timor-Leste • 14.3 14.3 20.3<br />
• India • • 12.0 7.1 18.2<br />
Kyrgyz Republic • 8.8 4.7 14.6<br />
Korea, Dem. Rep. • • • 8.7 3.2 17.9<br />
Tajikistan • 8.3 4.7 14.0<br />
Cambodia • 7.8 4.1 13.6<br />
• Myanmar • • • 6.0 3.9 8.0<br />
Armenia • • • 10.8 6.0 17.2<br />
Georgia • 9.0 5.5 13.6<br />
Russia • • • 6.7 3.4 11.4<br />
Ukraine • 5.8 3.4 9.6<br />
Bosnia • ◦ 4.2 1.6 8.7<br />
Azerbaijan • • ◦ 3.9 2.3 6.4<br />
Romania ◦ 3.1 1.7 5.4<br />
Montenegro • ◦ 2.9 1.3 5.5<br />
Bulgaria • • ◦ 2.8 1.4 4.9<br />
Moldova ◦ 2.7 1.5 4.9<br />
Haiti • ◦ ◦ 13.1 8.3 19.1<br />
Bolivia • • 12.8 7.8 19.3<br />
231
Table 3.4-5 - The Peace and Conflict Instability Ledger (abridged).<br />
Ecuador • • 7.8 4.5 12.7<br />
Guyana ◦ ◦ 7.7 4.0 13.6<br />
Mexico • ◦ 7.3 4.6 11.1<br />
Venezuela • • • ◦ 7.2 4.0 11.7<br />
• Columbia • • • ◦ 6.6 4.1 10.8<br />
Brazil • • ◦ 5.9 4.0 10.3<br />
Peru • • ◦ 5.9 3.6 9.0<br />
Guatemala ◦ ◦ 5.6 3.5 8.7<br />
Region<br />
Recent Instability<br />
Country<br />
Regime<br />
Consistency<br />
Infant<br />
Mortality<br />
Economic<br />
Openness<br />
Militarization<br />
Neighborhood<br />
War<br />
Risk<br />
Category<br />
Risk<br />
Score<br />
Lower<br />
Confidence<br />
Range<br />
Upper<br />
Middle East and North<br />
Africa (Top 10)<br />
North<br />
Atlantic<br />
(Top 5)<br />
• Iraq • • • 19.7 12.0 28.8<br />
• Yemen • 11.6 7.7 16.5<br />
Lebanon • • 10.5 8.3 6.0<br />
• Turkey • • • 8.3 5.3 12.3<br />
Egypt • • 6.0 3.4 9.9<br />
Algeria • 5.0 2.8 8.1<br />
Jordan • • 4.7 2.3 8.1<br />
Tunisia • ◦ 3.2 1.6 5.6<br />
Morocco • • ◦ 2.2 1.2 3.9<br />
Iran • • ◦ 2.1 1.1 3.7<br />
Macedonia • ◦ ◦ 2.5 1.3 4.3<br />
United States • • ◦ 0.9 0.4 1.9<br />
Belgium ◦ ◦ 0.8 0.2 1.8<br />
Greece • • • ◦ 0.6 0.2 1.4<br />
Cyprus • • • ◦ 0.6 0.2 1.3<br />
Explanations <strong>for</strong> <strong>the</strong> Ledger<br />
The ledger is based on a model that estimates <strong>the</strong> statistical relationship between <strong>the</strong> future<br />
likelihood <strong>of</strong> instability and each <strong>of</strong> <strong>the</strong> five factors in <strong>the</strong> chapter. The model is estimated based<br />
on data <strong>for</strong> <strong>the</strong> period 1950–2003, which indicated that each <strong>of</strong> <strong>the</strong> five factors was strongly<br />
related to <strong>the</strong> future risk <strong>of</strong> instability. Using <strong>the</strong> model estimates <strong>for</strong> <strong>the</strong> causal weight assigned<br />
to each factor, data from 2007 (<strong>the</strong> last year <strong>for</strong> which complete data are available <strong>for</strong> all five <strong>of</strong><br />
our factors) were used to produce a three-year <strong>for</strong>ecast indicating <strong>the</strong> risk <strong>of</strong> instability in <strong>the</strong><br />
period 2008–2010. The color codes used in <strong>the</strong> ledger to present a country’s standing on each <strong>of</strong><br />
<strong>the</strong> five factors are based on <strong>the</strong> values in 2007. The notes below explain <strong>the</strong> various codings.<br />
(1) Recent Instability: indicates (with a •) whe<strong>the</strong>r <strong>the</strong> country has been coded by <strong>the</strong> Political<br />
Instability Task Force (PITF) as being involved in an instability event as <strong>of</strong> <strong>the</strong> end <strong>of</strong> 2006. The<br />
country’s risk score (see column 10) provides an assessment <strong>of</strong> <strong>the</strong> likelihood <strong>of</strong> <strong>the</strong> country’s<br />
experiencing future instability. One might interpret <strong>the</strong> risk score <strong>for</strong> countries currently<br />
experiencing instability as <strong>the</strong> risk <strong>of</strong> continued instability, but readers are cautioned that <strong>the</strong><br />
causal factors that drive <strong>the</strong> continuation <strong>of</strong> instability are likely not <strong>the</strong> same as <strong>the</strong> factors that<br />
drive <strong>the</strong> onset <strong>of</strong> instability.<br />
232
(2) Country: <strong>the</strong> ledger examines only those countries with populations greater than 500,000 in<br />
2007.<br />
(3) Regime Consistency: <strong>the</strong> risk <strong>of</strong> future instability is strongly related to <strong>the</strong> extent to which<br />
<strong>the</strong> institutions comprising a country’s political system are uni<strong>for</strong>mly and consistently autocratic<br />
or democratic. Political institutions with a mix <strong>of</strong> democratic and autocratic features are deemed<br />
inconsistent, a common attribute <strong>of</strong> polities in <strong>the</strong> midst <strong>of</strong> a democratic transition (or a reversal<br />
from democratic rule to more autocratic governance). Regimes with inconsistent institutions are<br />
expected to be more likely to experience political instability. In <strong>the</strong> ledger, highly consistent<br />
democracies (polity score ≥6) and autocracies (polity score ≤ -6) receive a green marker. The<br />
symbol • has been assigned to regimes with inconsistent characteristics that also qualify as<br />
partial democracies according to PITF. Regimes with <strong>the</strong>se characteristics have been found to<br />
have <strong>the</strong> highest risk <strong>for</strong> instability. The symbol has been assigned to partial autocracies<br />
because <strong>the</strong> propensity <strong>for</strong> instability in <strong>the</strong>se regimes is somewhat less than in partial<br />
democracies.<br />
(4) Infant Mortality: infant mortality rates serve as a proxy <strong>for</strong> overall governmental<br />
effectiveness in executing policies and delivering services that improve social welfare in a<br />
country. High infant mortality rates are associated with an increased likelihood <strong>of</strong> future<br />
instability. The states with <strong>the</strong> best records are indicated with <strong>the</strong> symbol (scoring in <strong>the</strong><br />
bottom 25th percentile <strong>of</strong> global infant mortality rates). States with <strong>the</strong> worst record (scoring in<br />
<strong>the</strong> highest 25th percentile) are indicated with <strong>the</strong> symbol •. States in <strong>the</strong> middle 50th percentile<br />
are indicated with <strong>the</strong> symbol .<br />
(5) Economic Openness Closer integration with global markets reduces <strong>the</strong> likelihood <strong>of</strong> armed<br />
civil conflict and political instability. Policies that integrate global and domestic markets can<br />
produce higher growth rates and sometimes reduce inequality. To that extent, economic openness<br />
can remove or weaken common drivers <strong>for</strong> civil unrest related to economic grievances. We focus<br />
on <strong>the</strong> proportion <strong>of</strong> a country’s GDP accounted <strong>for</strong> by <strong>the</strong> value <strong>of</strong> all trade (exports plus<br />
imports) as a measure <strong>for</strong> economic openness. The countries with <strong>the</strong> lowest score <strong>for</strong> economic<br />
openness are considered to be at <strong>the</strong> highest risk <strong>for</strong> instability. These states are designated with<br />
<strong>the</strong> symbol •. The states in <strong>the</strong> highest 25th percentile receive <strong>the</strong> symbol in <strong>the</strong> ledger. The<br />
middle 50th percentile receives <strong>the</strong> symbol .<br />
(6) Militarization Instability is most likely in countries where <strong>the</strong> opportunities <strong>for</strong> armed<br />
conflict are greatest. In societies where <strong>the</strong> infrastructure and capital <strong>for</strong> organized armed conflict<br />
are more plentiful and accessible, <strong>the</strong> likelihood <strong>for</strong> civil conflict increases. The ledger measures<br />
militarization as <strong>the</strong> number <strong>of</strong> individuals in a country’s active armed <strong>for</strong>ces as a percentage <strong>of</strong><br />
<strong>the</strong> country’s total population. Countries with militarization scores in <strong>the</strong> bottom 25 th percentile<br />
are indicated with <strong>the</strong> symbol . Countries in <strong>the</strong> top 25 th percentile are presented with <strong>the</strong><br />
symbol •. The middle 50 th percentile is indicated with <strong>the</strong> symbol .<br />
(7) Neighborhood War The presence <strong>of</strong> an armed conflict in a neighboring state (internal or<br />
interstate) increases <strong>the</strong> risk <strong>of</strong> state instability. The contagion effects <strong>of</strong> regional armed conflict<br />
can heighten <strong>the</strong> risk <strong>of</strong> state instability, especially when ethnic or o<strong>the</strong>r communal groups span<br />
across borders. The most recent data release from <strong>the</strong> Uppsala Conflict Data Project at <strong>the</strong><br />
International Peace Research Institute is used to determine <strong>the</strong> conflict status <strong>of</strong> states in 2007. 28<br />
For a neighbor to be considered involved in armed conflict, <strong>the</strong> conflict must produce 25 or more<br />
battle-related fatalities per year. The symbol indicates when at least one neighbor is involved in<br />
233
armed conflict. The symbol indicates <strong>the</strong> absence <strong>of</strong> armed conflict in all neighboring states.<br />
(8) Risk Category States have been placed in one <strong>of</strong> five categories corresponding to <strong>the</strong>ir risk<br />
score. The chapter text discusses <strong>the</strong> procedure <strong>for</strong> assigning states to <strong>the</strong> highest risk category<br />
(•), <strong>the</strong> high risk category (), <strong>the</strong> moderate risk category (), <strong>the</strong> some risk category (), or <strong>the</strong><br />
low risk category (◦).<br />
(9) Risk Score The risk score gives a three-year <strong>for</strong>ecast <strong>of</strong> <strong>the</strong> relative risk (compared to an<br />
average member <strong>of</strong> <strong>the</strong> OECD) <strong>of</strong> experiencing instability. The score is computed based on <strong>the</strong><br />
results <strong>of</strong> estimating a statistical model using global data from <strong>the</strong> period 1950–2003. Then,<br />
using <strong>the</strong> model estimates, data from 2007 were used to obtain <strong>the</strong> three-year <strong>for</strong>ecasts <strong>for</strong> each<br />
country <strong>for</strong> <strong>the</strong> period 2008–2010.<br />
(10) Confidence Range The confidence range provides in<strong>for</strong>mation about <strong>the</strong> degree <strong>of</strong><br />
uncertainty corresponding to a country’s estimated risk score. Statistically speaking, <strong>the</strong> “true”<br />
risk <strong>of</strong> instability lies within this range with a confidence probability <strong>of</strong> 95 percent.<br />
↑ Back to <strong>the</strong> top<br />
1 Hewitt, J. Joseph. <strong>for</strong>thcoming. “The Peace and Conflict Instability Ledger: Ranking States Based on<br />
Future Risks,” in Peace and Conflict 2010 (J. Joseph Hewitt, Jonathan Wilkenfeld, Ted Gurr). Boulder:<br />
Paradigm Publishers.<br />
2 Esty, Daniel C., Jack Goldstone, Ted Robert Gurr, Barbara Harff, Marc Levy, Ge<strong>of</strong>frey D. Dabelko,<br />
Pamela T. Surko, and Alan N. Unger. 1999. The State Failure Report: Phase II Findings.<br />
3 Collier, Paul, V. L. Elliott, Håvard Hegre, Anke Hoeffler, Marta Reynal-Querol, and Nicholas<br />
Sambanis. 2003. Breaking <strong>the</strong> Conflict Trap: Civil War and Development Policy. Washington, DC: The<br />
World Bank.<br />
4 Collier, Paul, and Anke Hoeffler. 2004. “Greed and Grievance in Civil War,” Ox<strong>for</strong>d Economic Papers<br />
56:563-95.<br />
5 Esty, Daniel C., Jack Goldstone, Ted Robert Gurr, Barbara Harff, Marc Levy, Ge<strong>of</strong>frey D. Dabelko,<br />
Pamela T. Surko, and Alan N. Unger. 1999. The State Failure Report: Phase II Findings.<br />
6 Fearon, James D., and David D. Laitin. 2003. “Ethnicity, Insurgency, and Civil War.” American<br />
Political Science Review 97:75-90.<br />
7 Goldstone, Jack A. Robert H. Bates, Ted Robert Gurr, Michael Lustik, Monty G. Marshall, Jay Ulfelder,<br />
and Mark Woodward. 2005. “A Global Forecasting Model <strong>of</strong> Political Instability.” Presented at <strong>the</strong><br />
Annual Meeting <strong>of</strong> <strong>the</strong> American Political Science Association, Washington, DC. September 1-4.<br />
8 Hegre, Håvard, and Nicholas Sambanis. 2006. “Sensitivity Analysis <strong>of</strong> Empirical Results on Civil War<br />
Onset.” Journal <strong>of</strong> Conflict Resolution 50:508-35.<br />
9 Hegre, Håvard, Tanja Ellingsen, Scott Gates, and Nils Petter Gleditsch. 2001. “Toward a Democratci<br />
Civil Peace? Democracy, Political Change, and Civil War, 1816-1992.” American Political Science<br />
Review 95 (1):33-48.<br />
10 King, Gary, and Langche Zeng. 2001. “Improving Forecasts <strong>of</strong> State Failure.” World Politics 53:623-<br />
58.<br />
11 Sambanis, Nicholas. 2002. “A Review <strong>of</strong> Recent Advances and Future Directions in <strong>the</strong> Quantitative<br />
Literature on Civil Wars.” Defense and Peace Economics 13:215-43.<br />
12 Sambanis, Nicholas. 2004. “What Is a Civil War? Conceptual and Empirical Complexities <strong>of</strong> an<br />
Operational Definition.” Journal <strong>of</strong> Conflict Resolution 48:814-58.<br />
234
13 United States Agency <strong>for</strong> International Development (2005) Measuring Fragility: Indicators and<br />
Methods <strong>for</strong> Rating State Per<strong>for</strong>mance. Washington DC.<br />
14 Hewitt, J. Joseph. 2008. “The Peace and Conflict Instability Ledger: Ranking States Based on Future<br />
Risks,” in Peace and Conflict 2008 (J. Joseph Hewitt, Jonathan Wilkenfeld, Ted Gurr). Boulder:<br />
Paradigm Publishers.<br />
15 Hewitt, J. Joseph. 2008. “The Peace and Conflict Instability Ledger: Ranking States Based on Future<br />
Risks,” in Peace and Conflict 2008 (J. Joseph Hewitt, Jonathan Wilkenfeld, Ted Gurr). Boulder:<br />
Paradigm Publishers.<br />
16 Gurr, Ted Robert. 1974. “Persistence and Change in Political Systems, 18001971.” American<br />
Political Science Review 68(4):14821504.<br />
17 Gates, Scott, Håvard Hegre, Mark P. Jones, and Håvard Strand. 2006. “Institutional Inconsistency and<br />
Political Instabiliity: Polity Duration, 1800‐2000.” American Journal <strong>of</strong> Political Science<br />
50(4):893‐908.<br />
18 Hegre, Håvard, Tanja Ellingsen, Scott Gates, and Nils Petter Gleditsch. 2001. “Toward a Democratci<br />
Civil Peace? Democracy, Political Change, and Civil War, 1816-1992.” American Political Science<br />
Review 95 (1):33-48.<br />
19 Hegre, Håvard, Ranveig Gissinger, and Nils Petter Gleditsch. 2003. “Globalization and Internal<br />
Conflict,” in Globalization and Armed Conflict, by Gerald Schneider, Ka<strong>the</strong>rine Barbieri, and Nils<br />
Petter Gleditsch. Lanham, Maryland: Rowman & Littlefield Publishers.<br />
20 Goldstone, Jack A., Ted Robert Gurr, Barbara Harff, Marc A. Levy, Monty G. Marshall, Robert H.<br />
Bates, David L. Epstein, Colin H. Kahl, Pamela T. Surkom, John Ulfelder, and Alan N. Unger. 2000.<br />
“State Failure Task Force Report: Phase III Findings.” McLean, VA: Science Applications International<br />
Corporation (SAIC).<br />
21 Esty, Daniel C., Jack Goldstone, Ted Robert Gurr, Barbara Harff, Marc Levy, Ge<strong>of</strong>frey D. Dabelko,<br />
Pamela T. Surko, and Alan N. Unger. 1999. The State Failure Report: Phase II Findings.<br />
22 Goldstone, Jack A. Robert H. Bates, Ted Robert Gurr, Michael Lustik, Monty G. Marshall, Jay<br />
Ulfelder, and Mark Woodward. 2005. “A Global Forecasting Model <strong>of</strong> Political Instability.” Presented<br />
at <strong>the</strong> Annual Meeting <strong>of</strong> <strong>the</strong> American Political Science Association, Washington, DC. September 1-4.<br />
23 Collier, Paul, and Anke Hoeffler. 2004. “Greed and Grievance in Civil War,” Ox<strong>for</strong>d Economic Papers<br />
56:563-95.<br />
24 Hegre, Håvard, and Nicholas Sambanis. 2006. “Sensitivity Analysis <strong>of</strong> Empirical Results on Civil War<br />
Onset.” Journal <strong>of</strong> Conflict Resolution 50:508-35.<br />
25 Goldstone, Jack A. Robert H. Bates, Ted Robert Gurr, Michael Lustik, Monty G. Marshall, Jay<br />
Ulfelder, and Mark Woodward. 2005. “A Global Forecasting Model <strong>of</strong> Political Instability.” Presented<br />
at <strong>the</strong> Annual Meeting <strong>of</strong> <strong>the</strong> American Political Science Association, Washington, DC. September 1-4.<br />
26 Sambanis, Nicholas. 2001. “Do Ethnic and Non‐Ethnic Civil Wars Have <strong>the</strong> Same Causes? A<br />
Theoretical and Empirical Inquiry (Part 1).” Journal <strong>of</strong> Conflict Resolution 45:259‐282.<br />
27 Pate, Amy. 2008. “Trends in Democratization: A Focus on Instability in Anocracies.” in Peace and<br />
Conflict 2008 by J. Joseph Hewitt, Jonathan Wilkenfeld, and Ted R. Gurr. Boulder, Colorado: Paradigm<br />
Publishers.<br />
28 Gleditsch, Nils Petter, 2002. “The Future <strong>of</strong> Armed Conflict.” Ramat Gan, Israel, The Begin-Sadat<br />
Center <strong>for</strong> Strategic Studies, Bar-Ilan University.<br />
235
3.5. Perception is Reality: Stability through <strong>the</strong> Eyes <strong>of</strong> <strong>the</strong> Populace (Tom<br />
Rieger)<br />
Author and Organization: Tom Rieger, Gallup<br />
Contact In<strong>for</strong>mation: tom_rieger@gallup.com<br />
Introduction<br />
It has been said that <strong>the</strong> only constant is change. Countries that are stable today may quickly<br />
deteriorate under certain conditions. Catastrophic events may be wea<strong>the</strong>red better by some<br />
countries than by o<strong>the</strong>rs. Spillover from instability elsewhere may threaten neighbors, or it may<br />
destabilize an entire region. Having a robust model <strong>of</strong> <strong>the</strong> level <strong>of</strong> stability <strong>for</strong> a given population<br />
can be <strong>of</strong> tremendous value in being able to plan <strong>for</strong>, and possible help to avoid, significant<br />
human suffering as a result <strong>of</strong> instability. Many different models <strong>of</strong> state stability are currently in<br />
use or are regularly published from a variety <strong>of</strong> sources. While providing valuable insight, <strong>the</strong>se<br />
models also <strong>of</strong>fer some limitations.<br />
Sources <strong>for</strong> Stability Models<br />
To date, development <strong>of</strong> stability models has been limited by <strong>the</strong> sources available. The first and<br />
most obvious source available to <strong>the</strong> modeler is <strong>of</strong>ficial or government statistics. However, that<br />
means trying to determine if a country is stable based on metrics compiled by a potentially<br />
unstable government. As an example, it has been argued that <strong>the</strong>re are numerous problems in <strong>the</strong><br />
statistics available from countries like Nepal <strong>for</strong> monitoring progress toward <strong>the</strong> Millennium<br />
Development Goals, ranging from gaps in data, lack <strong>of</strong> benchmarks, inconsistent methodologies,<br />
and controversy over basic definitions. 1 O<strong>the</strong>rs have argued that <strong>of</strong>ficial statistics are <strong>of</strong>ten ei<strong>the</strong>r<br />
not available, not comparable across countries, not comparable across time, and lack subnational<br />
breakouts. 2 In o<strong>the</strong>r words, even when statistics are available and reliable, <strong>the</strong>re are no<br />
global uni<strong>for</strong>m standards regarding methodology and definition <strong>of</strong> those statistics, meaning that<br />
<strong>the</strong> data points used in creating <strong>the</strong> model will likely not be entirely comparable.<br />
Ano<strong>the</strong>r readily available source <strong>of</strong> data is articles and news content. While content analysis is<br />
highly useful <strong>for</strong> a number <strong>of</strong> applications, it is subject to self-selection bias, as well as <strong>the</strong> bias<br />
<strong>of</strong> <strong>the</strong> news source running <strong>the</strong> content. News media do not run every single story that crosses<br />
<strong>the</strong>ir desks. The editors choose which stories are worth reporting and which ones will likely<br />
increase readership or sell more advertising. There<strong>for</strong>e, news media should not be mistaken to<br />
represent a comprehensive and representative overview <strong>of</strong> everything that is happening in a<br />
particular geography. In addition, many countries have state-controlled media, which only report<br />
what <strong>the</strong>y want <strong>the</strong> populace and <strong>the</strong> outside world to know. Even within more open societies,<br />
including <strong>the</strong> United States, different news sources are characterized by and subject to <strong>the</strong>ir own<br />
biases. 3<br />
All <strong>of</strong> <strong>the</strong>se limitations mean that <strong>the</strong> media content as an input to a model will by its nature be<br />
incomplete, biased, and self-selected. Since a model is only as good as <strong>the</strong> data that feeds it,<br />
content-based models will have <strong>the</strong>se limitations, as well. But even beyond <strong>the</strong>se limitations,<br />
<strong>the</strong>re are two o<strong>the</strong>r serious problems with state-level estimates <strong>of</strong> stability based on metrics<br />
representing actual outcomes. These issues are discussed in <strong>the</strong> following sections.<br />
236
Perceptions <strong>of</strong> Outcomes<br />
The first is that actual outcomes do not necessarily reflect satisfaction with those outcomes. For<br />
example, according to <strong>the</strong> Gallup World Poll, in <strong>the</strong> fourth quarter <strong>of</strong> 2008, <strong>the</strong> percent <strong>of</strong> people<br />
saying <strong>the</strong> Afghanistan economy was poor was 35%. The percent <strong>of</strong> people saying <strong>the</strong> United<br />
States economy was poor was 62%, nearly twice as bad as <strong>the</strong> Afghanistan level, 4 and yet percapita<br />
GDP in <strong>the</strong> United States is over $43,000, compared to only $270 in Afghanistan. 5<br />
One possible reason <strong>for</strong> this apparent disconnect can be found in Kahneman and Tversky’s<br />
Prospect Theory. They found that <strong>the</strong> value <strong>of</strong> an outcome is determined not by <strong>the</strong> outcome<br />
itself, but ra<strong>the</strong>r by a perceptual evaluation <strong>of</strong> that outcome relative to a reference point, and that<br />
<strong>the</strong>re is much greater pain in being below that reference point than joy in being above it. 6<br />
While Kahneman and Tversky’s original work was primarily focused on decisions under risk,<br />
<strong>the</strong>se principles have since been related to perceptual evaluations <strong>of</strong> progress toward goals and<br />
outcomes. 7,8<br />
In o<strong>the</strong>r words, if a person were to live in Chicago and that person was used to having 24 hours<br />
<strong>of</strong> electricity per day, facing a day with only 18 hours <strong>of</strong> electricity would be viewed as a<br />
catastrophe. If a person were to live in Fallujah in 2007, that same 18 hours <strong>of</strong> electricity per day<br />
would have been viewed as a godsend.<br />
The United Nations Development Group acknowledged this limitation, in that statistics about<br />
poverty are limited because <strong>the</strong>y “do not reflect people’s feeling about relative deprivation” or<br />
even risks to <strong>the</strong>ir health. 9<br />
Lack <strong>of</strong> Homogeneity<br />
The second problem with reliance on state-level outcome-based stability estimates is that levels<br />
<strong>of</strong> stability are rarely, if ever, completely homogenous across an entire nation, especially when<br />
conditions are first starting to destabilize.<br />
Chechnya experienced violent unrest; Moscow did not. The Northwest Frontier Provinces <strong>of</strong><br />
Pakistan are currently in a state <strong>of</strong> open conflict, while Punjab is relatively calm. During <strong>the</strong><br />
worst <strong>of</strong> “The Troubles,” Nor<strong>the</strong>rn Ireland was much more unstable than Ireland or any o<strong>the</strong>r<br />
part <strong>of</strong> <strong>the</strong> United Kingdom. The problems in Sudan are much more severe in Darfur than <strong>the</strong>y<br />
are in Khartoum. Even here in <strong>the</strong> United States, South Central Los Angeles is rife with crime<br />
and economic instability, while just a few miles away, South Orange County remains safe and<br />
relatively prosperous.<br />
If a stability estimate is an amalgamation <strong>of</strong> some very stable areas and some very unstable<br />
areas, <strong>the</strong> estimate would be somewhere in <strong>the</strong> middle between stability and instability and<br />
would not be an accurate portrayal <strong>of</strong> ei<strong>the</strong>r.<br />
An Ideal Model<br />
In order to avoid all <strong>of</strong> <strong>the</strong>se limitations, a model should ideally (1) avoid <strong>of</strong>ficial statistics or<br />
content analysis, (2) be based on perceptions <strong>of</strong> satisfaction with outcomes ra<strong>the</strong>r than <strong>the</strong> level<br />
<strong>of</strong> <strong>the</strong> outcome itself, and (3) have <strong>the</strong> ability to be easily applied to any subgroup <strong>of</strong> <strong>the</strong><br />
population at any time.<br />
One such model is Gallup Leading Assessment <strong>of</strong> State Stability (GLASS), which was<br />
developed entirely based on representative surveys <strong>of</strong> <strong>the</strong> populations <strong>of</strong> different countries using<br />
237
<strong>the</strong> Gallup World Poll. The World Poll methodology is quite robust, including a mix <strong>of</strong> urban<br />
and rural coverage, a randomized choice <strong>of</strong> household members, weighting to non-responders to<br />
account <strong>for</strong> non-response bias, and several o<strong>the</strong>r quality control procedures. 10<br />
The model was developed under <strong>the</strong> assumption that people’s expectations and satisfaction with<br />
<strong>the</strong>ir conditions will be a better measure <strong>of</strong> <strong>the</strong> likelihood <strong>of</strong> civil unrest than <strong>the</strong> outcome itself,<br />
<strong>for</strong> <strong>the</strong> reasons stated above.<br />
To test this assumption, data from 69 countries from <strong>the</strong> 2007 Gallup World Poll were utilized,<br />
representing approximately 98,000 respondents. An initial set <strong>of</strong> independent and nonoverlapping<br />
factors were statistically derived based on <strong>the</strong>se data. The factors that were distilled<br />
through <strong>the</strong> analysis included <strong>the</strong> following:<br />
Basic needs, such as food and water<br />
Living conditions, covering “quality <strong>of</strong> life” issues<br />
Perceptions <strong>of</strong> economic conditions<br />
Government confidence, including local and national leadership, as well as <strong>the</strong> judicial<br />
system, electoral process, military, etc.<br />
Safety and security<br />
Weighting <strong>the</strong> Factors<br />
The next step was to determine <strong>the</strong> relative weight <strong>for</strong> each <strong>of</strong> <strong>the</strong>se factors.<br />
Each <strong>of</strong> <strong>the</strong> 69 countries included in <strong>the</strong> analysis was classified into one <strong>of</strong> three groups based on<br />
<strong>the</strong>ir current level <strong>of</strong> civil unrest. Those that were completely at peace with strong economies and<br />
relatively low crime were classified as a 2, indicating “stable.” Those that were currently<br />
experiencing some <strong>for</strong>m <strong>of</strong> significant civil unrest were classified as a 0, indicating “unstable.”<br />
Countries that were somewhere in <strong>the</strong> middle were classified as a 1, indicating “moderate.”<br />
A linear regression was <strong>the</strong>n run to determine <strong>the</strong> degree to which each factor could predict <strong>the</strong><br />
current level <strong>of</strong> stability. Since <strong>the</strong> factors were derived in a manner that ensured statistical<br />
independence (orthogonality), a straight linear regression could be run without concerns over<br />
multicolinearity. The results <strong>of</strong> <strong>the</strong> regression were quite compelling. Overall, <strong>the</strong> model<br />
explained 71% <strong>of</strong> <strong>the</strong> variance (r-squared=.71). 11<br />
95% confidence intervals were calculated to <strong>the</strong>n determine <strong>the</strong> appropriate ranges <strong>for</strong> stable,<br />
moderate, and unstable GLASS levels.<br />
Testing <strong>the</strong> Model’s Replicability<br />
In order to test <strong>the</strong> replicability <strong>of</strong> <strong>the</strong> model, data sets were analyzed from an additional 30<br />
countries that were not included in <strong>the</strong> original analysis, including some countries that were<br />
highly stable (such as Norway and Australia), some that were more moderate (such as Jamaica<br />
and Indonesia), and some that were clearly unstable (such as Chad, Afghanistan, and Haiti). In<br />
each case, <strong>the</strong> GLASS model accurately predicted <strong>the</strong> level <strong>of</strong> instability or civil unrest at <strong>the</strong><br />
time <strong>of</strong> measurement.<br />
In looking across <strong>the</strong> original set <strong>of</strong> 69 countries, however, <strong>the</strong>re were a few countries that <strong>the</strong><br />
model indicated as unstable, even though <strong>the</strong>y were at <strong>the</strong> time relatively calm. Those countries<br />
included, among o<strong>the</strong>rs, Georgia, Kenya, Peru, Mauritania, and Moldova. In each <strong>of</strong> <strong>the</strong>se<br />
countries, within a year after measurement took place, stability markedly declined.<br />
238
O<strong>the</strong>r countries that were estimated to be unstable became significantly worse <strong>of</strong>f, such as<br />
Nigeria, Zimbabwe, Madagascar, Haiti, as well as many <strong>of</strong> <strong>the</strong> countries experiencing foot riots<br />
in 2008. 12<br />
As fur<strong>the</strong>r validation, a list <strong>of</strong> countries was compiled that had an election scheduled within a<br />
year following <strong>the</strong> interviews. Each <strong>of</strong> <strong>the</strong>se countries was <strong>the</strong>n classified, once <strong>the</strong> election<br />
occurred, into two groups based on <strong>the</strong> level <strong>of</strong> post-election violence (no violence, violence). 13<br />
The average level <strong>of</strong> stability as determined by GLASS <strong>for</strong> <strong>the</strong> countries that experienced postelection<br />
violence was firmly in <strong>the</strong> unstable zone, while those that did not experience violence<br />
were in <strong>the</strong> stable zone:<br />
Stability (GLASS)<br />
STABLE<br />
MODERATE<br />
UNSTABLE<br />
No Post-Election Violence<br />
Post Election Violence<br />
Figure 3.5-1. Post-measurement Election Outcome.<br />
It is important to emphasize that <strong>the</strong>se elections occurred after <strong>the</strong> time that interviews were<br />
collected, indicating that <strong>the</strong> GLASS estimate was a leading indicator <strong>of</strong> potential instability, and<br />
not just a reflection <strong>of</strong> <strong>the</strong> current state <strong>of</strong> affairs.<br />
Measuring Potential <strong>for</strong> Instability<br />
This lag effect apparent in <strong>the</strong> data presents an interesting implication <strong>for</strong> <strong>the</strong> model. Based on<br />
<strong>the</strong>se results, as well as <strong>the</strong> countries that <strong>the</strong> model predicted will worsen, it appears that what<br />
<strong>the</strong> model is measuring is potential <strong>for</strong> instability. In o<strong>the</strong>r words, if an area can be thought <strong>of</strong> as<br />
a big pile <strong>of</strong> sticks, <strong>the</strong> model can help indicate <strong>the</strong>ir “flammability”: whe<strong>the</strong>r <strong>the</strong>y are soaked in<br />
water, soaked in gasoline, or dry wood. Be<strong>for</strong>e unrest occurs, <strong>the</strong>re may be <strong>the</strong> need <strong>for</strong> <strong>the</strong><br />
occurrence <strong>of</strong> a “matchstick event” such as an election, a spike in food prices, or some o<strong>the</strong>r<br />
inflammatory occurrence.<br />
While <strong>the</strong> model has proven useful <strong>for</strong> a number <strong>of</strong> applications and initiatives, <strong>the</strong>re are some<br />
important caveats to keep in mind.<br />
Limitations<br />
First, since <strong>the</strong> model is survey based, it can only be applied where it is possible to conduct<br />
surveys. While <strong>the</strong>re are very few denied areas <strong>for</strong> research and polling, some do exist (such as<br />
North Korea, Darfur, etc.). GLASS estimates cannot be ga<strong>the</strong>red <strong>for</strong> <strong>the</strong>se populations.<br />
Secondly, where sub-group analysis has been possible (due to large enough sample size), levels<br />
<strong>of</strong> stability, as well as <strong>the</strong> primary causes <strong>of</strong> instability, differ dramatically within countries. One<br />
area <strong>of</strong> a country may be highly stable, while ano<strong>the</strong>r may be highly unstable. Even within<br />
239
unstable areas, <strong>the</strong> most critical needs tend to differ. Perhaps in one village <strong>the</strong> water supply is<br />
not adequate, while in ano<strong>the</strong>r, <strong>the</strong>re may be no jobs. In a third, <strong>the</strong>re may be extremely high<br />
crime. The model provides <strong>the</strong> ability to easily create <strong>the</strong>se estimates <strong>for</strong> different subgroups<br />
(virtually any combination <strong>of</strong> respondents), but doing so requires adequate sample size, as well<br />
as <strong>the</strong> necessary classification variables included in <strong>the</strong> fieldwork.<br />
Finally, cultural factors must be considered. While great care has been taken in <strong>the</strong> design <strong>of</strong> <strong>the</strong><br />
World Poll to find questions that are generalizable across populations, <strong>the</strong>re are some instances<br />
where, <strong>for</strong> <strong>the</strong> purposes <strong>of</strong> <strong>the</strong> model, questions may not apply. For example, in Thailand, it is<br />
not sufficient to simply ask about confidence in government leadership since it is against <strong>the</strong> law<br />
to say anything critical <strong>of</strong> <strong>the</strong> king (who enjoys extremely high support from <strong>the</strong> population<br />
regardless), but <strong>the</strong>re is quite a bit <strong>of</strong> dissatisfaction with o<strong>the</strong>r leaders. When such issues exist, it<br />
is critical to ensure that <strong>the</strong>se distinctions are taken into account in data collection.<br />
Conclusion<br />
They key point to consider is that ultimately, unrest occurs among <strong>the</strong> population. Determining<br />
<strong>the</strong> potential <strong>for</strong> unrest must <strong>the</strong>re<strong>for</strong>e take into account how that population feels about <strong>the</strong>ir<br />
conditions. When used appropriately, taking <strong>the</strong> approach described herein can be valuable <strong>for</strong><br />
determining where <strong>the</strong> next hot spot may occur, perhaps with enough advance notice to prevent<br />
instability from occurring, or lessen its impact.<br />
↑ Back to <strong>the</strong> top<br />
1 Kayastha, R.P. (2007). “Statistical Problems <strong>for</strong> Monitoring <strong>of</strong> <strong>the</strong> Millennium Development Goals in<br />
Nepal.” International Conference on <strong>the</strong> Millennium Development Goals Statistics (ICMDGS), Manila,<br />
Philippines, October 1-3, 2007.<br />
2 Maligalig, D.S. (2003). “Measuring <strong>the</strong> Millennium Development Goals Indicators.” Concluding<br />
Workshop, RETA 6007: Enhancing Social and Gender Statistics. Bangkok, Thailand, June 24-27, 2003.<br />
3 Roseclose, TG and Milyo, J. (2005) “A Measure <strong>of</strong> Media Bias.” Quarterly Journal <strong>of</strong> Economics. VOL<br />
CXX, Issue 4, Nov 2005.<br />
4 “Gallup World Poll 2008 Results” (unpublished). Gallup, Inc., Washington D.C.<br />
5 Brown, S., et. al. (2009). The Economist: Pocket World in Figures. London, UK: Pr<strong>of</strong>ile Books, Ltd. p.<br />
28.<br />
6 Kahneman, D. and Tversky, A. (1979). “Prospect Theory: An Analysis <strong>of</strong> Decision under Risk.”<br />
Econometrica. Vol. 47 No. 2: pp. 263-91.<br />
7 Heath, C., Larrick, R. and Wu, G. (1999). “Goals and Reference Points.” Cognitive Psychology, 38: pp.<br />
79-109.<br />
8 Kahneman, D. Personal interviews, August 10, 2006 and August 30, 2007, Berkeley, CA.<br />
9 United Nations Development Group. (2003). “Indicators <strong>for</strong> Monitoring <strong>the</strong> Millennium Development<br />
Goals: Definitions, Rationale, Concepts and Sources,” p. 7.<br />
10 Gallup, Inc. (2009) “Gallup World Poll: World Poll Methodology.” Gallup, Inc., Washington D.C.<br />
11 Rieger, T. (2008). White Paper: “GLASS: Gallup Leading Assessment <strong>of</strong> State Stability,<br />
Methodological Overview Paper” (unpublished).<br />
12 “ 2007–2008 world food price crisis,” retrieved June 2, 2009, from Wikipedia:<br />
http://en.wikipedia.org/wiki/2007%E2%80%932008_world_food_price_crisis.<br />
13 IFES Election Guide, retrieved August 2008, from: http://www.electionguide.org/index.php.<br />
240
241
3.6. Assessing <strong>the</strong> Stability <strong>of</strong> Interstate Relationships Using Game Theory<br />
(Frank Zagare)<br />
Author and Organization: Frank C. Zagare, Department <strong>of</strong> Political Science, University at<br />
Buffalo, SUNY<br />
Contact In<strong>for</strong>mation: FCZagare@buffalo.edu<br />
Abstract<br />
Game models have long been used to analyze <strong>the</strong> robustness <strong>of</strong> contentious interstate<br />
relationships. Early attempts to analyze deterrence game-<strong>the</strong>oretically, however, were limited by<br />
certain deficiencies <strong>of</strong> <strong>the</strong> methodology. But, many <strong>of</strong> <strong>the</strong>se limitations have now been<br />
overcome. The most recent generation <strong>of</strong> game models is dynamic, more realistic and easily<br />
adaptable to a wide range <strong>of</strong> strategic relationships. This paper explains <strong>the</strong> sense in which game<br />
models can be used to establish <strong>the</strong> stability, or lack <strong>the</strong>re<strong>of</strong>, <strong>of</strong> typical deterrence situations and<br />
to understand <strong>the</strong> context <strong>of</strong> <strong>the</strong>ir policy recommendations.<br />
Early Literature<br />
There is perhaps no tool more appropriate <strong>for</strong> analyzing <strong>the</strong> stability <strong>of</strong> contentious interstate<br />
competitions, nuclear or o<strong>the</strong>rwise, than <strong>the</strong> ma<strong>the</strong>matical <strong>the</strong>ory <strong>of</strong> games. When it was<br />
originally developed by John von Neumann and Oskar Morgenstern in 1944 in <strong>the</strong>ir magisterial<br />
Theory <strong>of</strong> Games and Economic Behavior, game <strong>the</strong>ory seemed to <strong>of</strong>fer a systematic framework<br />
<strong>for</strong> analyzing <strong>the</strong> acrimonious relationship <strong>of</strong> <strong>the</strong> United States and <strong>the</strong> Soviet Union. However,<br />
it was not until <strong>the</strong> late 1950s and <strong>the</strong> early 1960s that this potential began to be realized. Among<br />
<strong>the</strong> early contributors to <strong>the</strong> ensuing debate about <strong>the</strong> strategic implications <strong>of</strong> nuclear weapons<br />
were such giants as Morgenstern himself, 1,2 Herman Kahn, 3,4,5 Albert Wohlstetter, 6 Glenn Snyder<br />
(1961), 7 Daniel Ellsberg, 8,9 and, <strong>of</strong> course, Thomas Schelling. 10,11<br />
Much <strong>of</strong> <strong>the</strong> early literature <strong>of</strong> nuclear deterrence focused on <strong>the</strong> well-known game <strong>of</strong> “Chicken”<br />
(see Figure 3.7-1). Chicken is a simple game that many strategic analysts initially believed<br />
<strong>of</strong>fered a powerful <strong>the</strong>oretical context in which to think about interstate conflict. Eventually,<br />
however, it came to be recognized that <strong>the</strong> chicken analogy was inadequate. For one, it was a<br />
static game that took common knowledge about preferences (i.e., pay<strong>of</strong>fs) as axiomatic.<br />
Additionally, it assumed that <strong>the</strong> pay<strong>of</strong>fs to <strong>the</strong> players (i.e., states) were constant across time<br />
and issue areas. As <strong>the</strong> literature <strong>of</strong> deterrence evolved and matured over <strong>the</strong> next twenty years,<br />
game-<strong>the</strong>oretic models became more sophisticated. The first to be dismissed was <strong>the</strong> static<br />
framework and <strong>the</strong> assumption <strong>of</strong> complete in<strong>for</strong>mation. 12 Shortly <strong>the</strong>reafter, <strong>the</strong> simplifying<br />
assumption <strong>of</strong> uni<strong>for</strong>m preferences was abandoned. 13 Consequently, recent game-<strong>the</strong>oretic<br />
attempts to penetrate strategic issues have become more relevant to policy makers.<br />
242
State B<br />
Cooperate (C)<br />
Defect (D)<br />
State A<br />
Cooperate (C)<br />
Status Quo<br />
(3,3)<br />
B Wins<br />
(2,4)*<br />
Defect (D)<br />
A Wins<br />
(4,2)*<br />
Conflict<br />
(1,1)<br />
_____________________<br />
Key: (x,y) = pay<strong>of</strong>f to State A, pay<strong>of</strong>f to State B<br />
4 = best; 3 = next-best; 2 = next-worst; 1 = worst<br />
* = Nash equilibrium<br />
Figure 3.6-1. Chicken.<br />
Assessing Strategic Stability<br />
There are many reasons why game-<strong>the</strong>ory has proven to be <strong>the</strong> methodology <strong>of</strong> choice among<br />
academic researchers who study deterrence, both early on and currently. For one, game models<br />
provide a <strong>for</strong>mal framework that enhances <strong>the</strong> probability <strong>of</strong> logical consistency. Additionally,<br />
<strong>the</strong> assumption that state actors make purposeful choices is more than compatible with standard<br />
approaches to security studies. But perhaps <strong>the</strong> most important reason <strong>for</strong> <strong>the</strong> application <strong>of</strong> this<br />
methodology to strategic issues is <strong>the</strong> conceptual foundation <strong>of</strong> almost all game-<strong>the</strong>oretic<br />
solution concepts, that is, <strong>the</strong> concept <strong>of</strong> an equilibrium outcome. The equilibria <strong>of</strong> a game model<br />
are uniquely appropriate <strong>for</strong> assessing <strong>the</strong> stability <strong>of</strong> competitive interstate relationships.<br />
Equilibrium can be thought <strong>of</strong> as a state <strong>of</strong> decision-making stasis. An equilibrium is said to exist<br />
when no one player in a game has an incentive to switch to ano<strong>the</strong>r course <strong>of</strong> action (i.e., to<br />
ano<strong>the</strong>r strategy or policy). Thus, an equilibrium outcome is a natural measure <strong>of</strong> strategic<br />
stability. Conversely, when at least one actor has an incentive to abandon its strategy, ei<strong>the</strong>r by<br />
attacking <strong>the</strong> o<strong>the</strong>r, demanding an alteration <strong>of</strong> <strong>the</strong> status quo, or more generally, by unilaterally<br />
adjusting its relationship with ano<strong>the</strong>r actor, equilibrium cannot be said to exist; that is, <strong>the</strong><br />
strategic relationship is unstable.<br />
As it turns out, <strong>the</strong>re are more than a few distinct definitions <strong>of</strong> a game-<strong>the</strong>oretic equilibrium, and<br />
some <strong>of</strong> <strong>the</strong>se definitions are quite elaborate ma<strong>the</strong>matically. The most well-known and<br />
commonly employed definitions are <strong>the</strong>oretically consistent, differing mainly in <strong>the</strong><br />
circumstances to which <strong>the</strong>y pertain. For example, <strong>the</strong> well-know definition <strong>of</strong> Nash equilibrium<br />
is <strong>the</strong> standard measure <strong>of</strong> rational behavior in static games <strong>of</strong> complete in<strong>for</strong>mation like<br />
“chicken.” By contrast, in dynamic games, rationality is gauged by subgame perfect equilibria in<br />
243
games <strong>of</strong> complete in<strong>for</strong>mation and by perfect Bayesian equilibrium in games <strong>of</strong> incomplete<br />
in<strong>for</strong>mation. None<strong>the</strong>less, leaving technicalities aside, <strong>the</strong> underlying notions are quite similar.<br />
Equilibria, however <strong>the</strong>y are defined, indicate that no incentive exists <strong>for</strong> an actor to do anything<br />
o<strong>the</strong>r than what it is doing at <strong>the</strong> present moment and that it will persist in that behavior until<br />
something material changes. In o<strong>the</strong>r words, a stable strategic relationship can quite naturally be<br />
associated with a status quo that is in equilibrium, and conversely.<br />
Knowing that a strategic relationship is stable—that is, that it is in a peaceful equilibrium—can<br />
be quite useful, not to mention reassuring, but knowing <strong>the</strong> conditions that give rise to that<br />
stability, and <strong>the</strong> conditions that might upset it, is even more important to decision-makers since<br />
<strong>the</strong> political and military policies <strong>the</strong>y pursue sometimes are determinative.<br />
For example, consider <strong>for</strong> now <strong>the</strong> simple game model, called <strong>the</strong> “generalized mutual deterrence<br />
game,” depicted in Figure 3.6-2. At <strong>the</strong> start <strong>of</strong> this game, both players (i.e., States A and B)<br />
simultaneously choose to cooperate (C) or to defect (D). If both choose ei<strong>the</strong>r C or D, <strong>the</strong> game<br />
ends, but if one chooses C and <strong>the</strong> o<strong>the</strong>r chooses D, <strong>the</strong> player choosing C is provided with<br />
ano<strong>the</strong>r opportunity to defect, that is, to retaliate. If, at <strong>the</strong> end <strong>of</strong> <strong>the</strong> game, both players have<br />
chosen C, <strong>the</strong> status quo prevails; if both have chosen D, conflict (or war) results. If one player<br />
chooses C and <strong>the</strong> o<strong>the</strong>r D, <strong>the</strong> defecting player gains an advantage—ei<strong>the</strong>r A wins or B wins.<br />
The generalized mutual deterrence game is austere, but not quite as austere as chicken because it<br />
is dynamic. It has also been examined systematically under both complete and incomplete<br />
in<strong>for</strong>mation and under a variety <strong>of</strong> preference configurations. It is, <strong>the</strong>re<strong>for</strong>e, a much more useful<br />
model since it is readily adaptable to whatever empirical circumstances or analytic purposes are<br />
at hand. It is not <strong>the</strong> only model that can be used to study contentious interstate relationships.<br />
O<strong>the</strong>r more elaborate, and perhaps more pertinent models exist. The generalized mutual<br />
deterrence game is simply an example <strong>of</strong> one possible strategic relationship, albeit one that is<br />
both important and fundamental.<br />
Node 1<br />
Nodes 2a,<br />
2b<br />
Nodes 3a,<br />
3b<br />
C<br />
State B<br />
C<br />
D<br />
Status Quo<br />
(SQ )<br />
State A<br />
C<br />
D<br />
B Wins<br />
(CD)<br />
Conflict<br />
(D D)<br />
State A<br />
D<br />
State B<br />
C<br />
D<br />
State B<br />
Conflict<br />
(D D )<br />
C<br />
D<br />
A Wins<br />
(D C)<br />
Conflict<br />
(D D)<br />
Key: C = Cooperate/D = Defect<br />
Figure 3.6-2. Generalized Mutual Deterrence Game.<br />
244
In Figure 3.6-2, <strong>the</strong> vertical line connecting State B’s moves at node 2 is called an in<strong>for</strong>mation<br />
set. In<strong>for</strong>mation sets are simply graphical devices used to indicate what a player knows, or does<br />
not know, about prior choices at a particular decision point in a game. As drawn here, <strong>the</strong><br />
in<strong>for</strong>mation set joining nodes 2a and 2b indicates that when State B makes a choice at decision<br />
node 2 it does not know exactly what strategy State A has selected.<br />
In analyzing this game model, one might be interested in <strong>the</strong> conditions that give rise to stable<br />
deterrence. These conditions are associated with <strong>the</strong> existence <strong>of</strong> an equilibrium outcome or<br />
strategy pair. It might not be surprising to learn that decision-makers may choose to cooperate<br />
with one ano<strong>the</strong>r in this game rationally as long as each actor’s deterrent threat is sufficiently<br />
credible (or believable). This is a straight<strong>for</strong>ward conclusion that is consistent with intuition.<br />
What might also be surprising, however, is that <strong>the</strong>se same conditions generally give rise to<br />
ano<strong>the</strong>r equilibrium under which nei<strong>the</strong>r player cooperates. When this equilibrium is selected by<br />
<strong>the</strong> actors, <strong>the</strong> status quo is upset, and conflict (or war) is implied. While this outcome can be<br />
said to be stable in a game-<strong>the</strong>oretic sense, it is not <strong>the</strong> sense in which most strategic analysts<br />
think <strong>of</strong> stability.<br />
The co-existence <strong>of</strong> two rational outcomes, one associated with mutual cooperation and <strong>the</strong> o<strong>the</strong>r<br />
with conflict, strongly suggests that dyadic strategic relationships may not be as stable as some<br />
strategic thinkers have concluded. 14 It also suggests that <strong>the</strong> policies that decision-makers adopt,<br />
and not just <strong>the</strong> so-called strategic balance, may make <strong>the</strong> difference between war and peace. As<br />
it turns out, in this illustrative example, conditionally cooperative (i.e., tit-<strong>for</strong>-tat) strategies,<br />
when <strong>the</strong>y are implemented by both parties, <strong>of</strong>fer <strong>the</strong> greatest prospects <strong>for</strong> mutual cooperation.<br />
This is a fairly robust <strong>the</strong>oretical finding that persists across a number <strong>of</strong> distinct game models.<br />
It is interesting to observe that stable deterrence is much more likely to occur in one-sided or<br />
unilateral deterrence relationships than in those situations in which all <strong>the</strong> players have an<br />
incentive to overturn <strong>the</strong> status quo. This straight<strong>for</strong>ward conclusion has some important policy<br />
implications: under certain conditions, ongoing conflicts are best settled unilaterally by a<br />
dominating actor ra<strong>the</strong>r than being negotiated bilaterally. There is systematic empirical support<br />
<strong>for</strong> this prescription: imposed settlements generally last longer than negotiated settlements,<br />
regardless <strong>of</strong> <strong>the</strong> circumstances under which <strong>the</strong> conflict take place. 15<br />
Conclusions<br />
Game-<strong>the</strong>oretic models are a natural and intuitively satisfying framework in which to assess <strong>the</strong><br />
stability <strong>of</strong> contentious interstate relationships. Current modeling ef<strong>for</strong>ts are much more realistic,<br />
and hence, potentiality much more useful <strong>for</strong> policy makers than <strong>the</strong> first wave <strong>of</strong> academic<br />
studies. 16 They are also easily modified to take account <strong>of</strong> shifting strategic conditions. The<br />
models can be used not only to assess <strong>the</strong> robustness <strong>of</strong> strategic relationships, but also to<br />
generate and evaluate competing policy prescriptions. 17,18<br />
↑ Back to <strong>the</strong> top<br />
1 Morgenstern, Oskar (1959). The Question <strong>of</strong> <strong>National</strong> Defense. New York: Random House.<br />
2 Morgenstern, Oskar (1961). “The Cold War Is Cold Poker.” New York Times Magazine, February 5.<br />
3 Kahn, Herman (1960). On Thermonuclear War. Princeton: Princeton University Press.<br />
245
4 Kahn, Herman (1962). Thinking About <strong>the</strong> Unthinkable. New York: Horizon Press.<br />
5 Kahn, Herman (1965). On Escalation. New York: Praeger.<br />
6 Wohlstetter, Albert (1959). “The Delicate Balance <strong>of</strong> Terror.” Foreign Affairs, 37: 211 – 234.<br />
7 Snyder, Glenn H. (1961). Deterrence and Defense: Toward a Theory <strong>of</strong> <strong>National</strong> Security. Princeton:<br />
Princeton University Press.<br />
8 Ellsberg, Daniel (1959). “The Theory and Practice <strong>of</strong> Blackmail.” Lecture at <strong>the</strong> Lowell Institute,<br />
Boston, MA, March 10. Reprinted in Oran R. Young, [ed.], Bargaining: Formal Theories <strong>of</strong><br />
Negotiation. Urbana, IL: University <strong>of</strong> Illinois Press, (1975).<br />
9 Ellsberg, Daniel (1961). “The Crude Analysis <strong>of</strong> Strategic Choice.” American Economic Review, 51:<br />
472 478.<br />
10 Schelling, Thomas C. (1960). The Strategy <strong>of</strong> Conflict. Cambridge, MA: Harvard University Press.<br />
11 Schelling, Thomas C. (1966). Arms and Influence. New Haven: Yale University Press.<br />
12 Powell, Robert (1990). Nuclear Deterrence Theory: The Search <strong>for</strong> Credibility. New York: Cambridge<br />
University Press.<br />
13 Zagare, Frank C. and D. Marc Kilgour (2000). Perfect Deterrence. Cambridge: Cambridge University<br />
Press.<br />
14 Waltz, Kenneth N. (1964). “The Stability <strong>of</strong> <strong>the</strong> Bipolar World.” Daedalus, 93: 881 – 909.<br />
15 Senese, Paul D. and Stephen L. Quackenbush (2003). “Sowing <strong>the</strong> Seeds <strong>of</strong> Conflict: The Effect <strong>of</strong><br />
Dispute Settlements on Durations <strong>of</strong> Peace.” Journal <strong>of</strong> Politics, 65: 696 – 717.<br />
16 Zagare, Frank C. and Branislav L. Slantchev (2009). “Game Theory and O<strong>the</strong>r Modeling Approaches.” In<br />
Robert A. Denemark et al., [eds.], The International Studies Compendium Project. Ox<strong>for</strong>d: Wiley-<br />
Blackwell, in press.<br />
17 Powell Robert (2003.) “Nuclear Deterrence Theory, Nuclear Proliferation, and <strong>National</strong> Missile<br />
Defense.” International Security, 27: 86 – 118.<br />
18 Quackenbush, Stephen L. (2006). “<strong>National</strong> Missile Defense and Deterrence.” Political Research<br />
Quarterly, 59: 533 – 41.<br />
246
3.7. Theoretical Foundations <strong>of</strong> Partnerships <strong>for</strong> Economic Development<br />
(Robert Axelrod)<br />
Author and Organization: Robert Axelrod, Ford School <strong>of</strong> Public Policy, University <strong>of</strong> Michigan<br />
Contact In<strong>for</strong>mation: axe@umich.edu<br />
Introduction<br />
In recent years, <strong>the</strong> international development community has come to recognize that “despite<br />
<strong>the</strong> potential benefits <strong>of</strong> globalization and technological change, world poverty has increased and<br />
growth prospects have dimmed <strong>for</strong> developing countries during <strong>the</strong> 1980s and 90s.” 1 This<br />
realization has led to a change in focus from donations from <strong>the</strong> rich to <strong>the</strong> poor—<strong>of</strong>ten with <strong>the</strong><br />
imposition <strong>of</strong> strict conditions—to a new emphasis on partnership. (The <strong>the</strong>me <strong>of</strong> partnership can<br />
be traced back to 1969, when <strong>the</strong> Pearson Commission called <strong>for</strong> “a new partnership based on an<br />
in<strong>for</strong>mal understanding expressing <strong>the</strong> reciprocal rights and obligations <strong>of</strong> donors and<br />
recipients.” 2,3 ) For example, at <strong>the</strong> World Bank, <strong>the</strong> intention is<br />
. . . to treat partnerships as an organic process, in which trust is built over time, in which<br />
steps are taken to weave a “fabric <strong>of</strong> sustainability”; and to consider how mutual<br />
accountability may be built, perhaps in <strong>the</strong> <strong>for</strong>m <strong>of</strong> a contractual arrangement 4 .<br />
The purpose <strong>of</strong> this essay is to help clarify <strong>the</strong> <strong>the</strong>oretical foundations <strong>of</strong> partnerships in a<br />
development context. The essay proceeds by explicitly taking into account that a donor and<br />
recipient may have divergent as well as complementary interests. Thus, a partnership between a<br />
donor and recipient can be analyzed in terms <strong>of</strong> a mixed-motive game between two players. In<br />
particular, <strong>the</strong> iterated “prisoner’s dilemma” game is helpful <strong>for</strong> analyzing <strong>the</strong> <strong>the</strong>oretical<br />
foundations <strong>of</strong> partnerships. Analyzing partnerships from this <strong>the</strong>oretical perspective suggests<br />
implications <strong>for</strong> selecting a partner, setting up a partnership, choosing a modus operandi,<br />
building trust, achieving selectivity, and per<strong>for</strong>ming monitoring and evaluation.<br />
The <strong>the</strong>oretical framework <strong>of</strong>fered here is deliberately kept very simple. The simplicity <strong>of</strong> <strong>the</strong><br />
framework helps to highlight some important principles. The goal is to promote insight about<br />
some fundamental issues ra<strong>the</strong>r than to provide a fully accurate rendition <strong>of</strong> all <strong>the</strong> complexities<br />
<strong>of</strong> partnerships <strong>for</strong> economic development.<br />
How Partnerships Differ from O<strong>the</strong>r Kinds <strong>of</strong> Relationships<br />
A working definition <strong>of</strong> partnership is “a collaborative relationship between entities to work<br />
toward shared objectives through a mutually agreed division <strong>of</strong> labor.” 5 While this working<br />
definition is not very precise, it does help distinguish partnerships from o<strong>the</strong>r <strong>for</strong>ms <strong>of</strong> aid<br />
relationship.<br />
1. A partnership is not a gift. A partnership aims at taking advantage <strong>of</strong> what <strong>the</strong> recipient,<br />
as well as <strong>the</strong> donor, can bring to <strong>the</strong> relationship. This can include local expertise, onsite<br />
workers, and a better understanding <strong>of</strong> priorities, needs, and constraints. Even more<br />
important, a partnership seeks joint “ownership” <strong>of</strong> <strong>the</strong> relationship and tries to build <strong>the</strong><br />
capacity <strong>of</strong> <strong>the</strong> recipient government to undertake sustainable development.<br />
247
2. A partnership is not a relationship based on conditionality as a one-<strong>of</strong>f event. Such<br />
conditionality presumes that donors can impose conditions to coerce poor countries to do<br />
things <strong>the</strong>y do not want to do in order to obtain resources <strong>the</strong>y need. A partnership is<br />
consistent, however, with conditionality seen as a process over time with mutual<br />
accountability. 6 Some researchers even question whe<strong>the</strong>r strict conditionality has been<br />
effective at promoting development. 7 Partnership recognizes that both sides must be<br />
involved in defining <strong>the</strong> terms <strong>of</strong> <strong>the</strong> relationship.<br />
3. Similarly, a partnership is not a principal-agent relationship between a donor and a<br />
recipient. In a partnership, <strong>the</strong> donor cannot prescribe <strong>the</strong> terms <strong>of</strong> <strong>the</strong> relationship in <strong>the</strong><br />
way that an employer can specify terms <strong>of</strong> employment when hiring a worker. (The<br />
principal-agent framework is very useful <strong>for</strong> <strong>the</strong> examination <strong>of</strong> issues that arise from<br />
in<strong>for</strong>mation asymmetries. For example, in partnerships <strong>for</strong> economic development <strong>the</strong><br />
recipient <strong>of</strong>ten knows more than <strong>the</strong> donor about what is happening at <strong>the</strong> local level.)<br />
4. A partnership is not a simply “team” activity. In an ideal sports team, everyone has<br />
exactly <strong>the</strong> same interest in winning, and everyone on <strong>the</strong> team ei<strong>the</strong>r wins or everyone<br />
on <strong>the</strong> team loses. While <strong>the</strong> members <strong>of</strong> a partnership <strong>for</strong> economic development<br />
certainly have strong interests in common, <strong>the</strong>y are also likely to have some divergent<br />
interests, as well.<br />
Finally, although <strong>the</strong> <strong>for</strong>mal terms <strong>of</strong> a partnership may be expressed in a valid contract under<br />
international law, <strong>the</strong> donor and recipient usually have no intention to use courts to resolve <strong>the</strong>ir<br />
conflicts. Instead, like nations bound by treaties, partners rely mainly on each o<strong>the</strong>r's need to<br />
maintain a good reputation to secure future agreements.<br />
A Partnership as a Prisoner’s Dilemma<br />
In order to understand <strong>the</strong> <strong>the</strong>oretical foundations <strong>of</strong> a partnership, it is helpful to use game<br />
<strong>the</strong>ory. In game <strong>the</strong>ory, a relationship is defined by (1) identifying <strong>the</strong> players, (2) specifying <strong>the</strong><br />
choices <strong>the</strong>y have, and (3) spelling out <strong>the</strong> consequences <strong>of</strong> <strong>the</strong>se choices in terms <strong>of</strong> <strong>the</strong> pay<strong>of</strong>fs<br />
to <strong>the</strong> players. Analyzing <strong>the</strong> strategies available to <strong>the</strong> players reveals what is needed to foster<br />
mutually beneficial outcomes.<br />
In <strong>the</strong> case <strong>of</strong> a partnership <strong>for</strong> economic development, <strong>the</strong> game can be specified as shown<br />
below. (Game <strong>the</strong>ory has previously been used to model o<strong>the</strong>r aspects <strong>of</strong> <strong>the</strong> development aid.<br />
For example, conditionality has been modeled as a principal-agent game, 8 and <strong>the</strong> en<strong>for</strong>cement<br />
<strong>of</strong> debt service has been modeled as a game with a choice to default. 9<br />
1. The players are <strong>the</strong> donor and <strong>the</strong> recipient. The donor might be an international financial<br />
institution such as <strong>the</strong> World Bank, a non-governmental organization, a foundation, a<br />
group <strong>of</strong> countries such as <strong>the</strong> OECD, or a single country. The donor might even be a<br />
coalition <strong>of</strong> diverse contributors. The recipient in a partnership is <strong>of</strong>ten <strong>the</strong> government <strong>of</strong><br />
a single country, although it might be a group <strong>of</strong> countries, a ministry in charge <strong>of</strong> some<br />
sector <strong>of</strong> a single country, or even a local organization.<br />
2. The available choices can be quite complex. To highlight <strong>the</strong> <strong>the</strong>oretical aspects <strong>of</strong> a<br />
partnership, <strong>the</strong> choices can be reduced to just two: cooperate or defect. Choosing to<br />
cooperate at a given point in time means that <strong>the</strong> player per<strong>for</strong>ms <strong>the</strong> agreed upon terms<br />
<strong>of</strong> <strong>the</strong> partnership promptly and fully. Choosing to defect means that <strong>the</strong> player fulfills its<br />
obligations less than completely, or slower than agreed upon.<br />
248
3. The consequences depend upon what each player has chosen. The basis <strong>of</strong> a partnership<br />
is that <strong>the</strong>re is mutual gain to be had by working toge<strong>the</strong>r. Thus, if both cooperate, both<br />
do well. However, <strong>the</strong>re is typically a temptation to defect. Some reasons why a donor<br />
might be tempted to avoid some <strong>of</strong> its commitments include a desire to increase <strong>the</strong><br />
amount <strong>of</strong> tied aid, a desire to reduce costs once it got credit <strong>for</strong> “flag raising,” and a<br />
reluctance in practice to support leadership by <strong>the</strong> recipient government. All three<br />
concerns were voiced in <strong>the</strong> workshop Making Partnerships Work on <strong>the</strong> Ground. 10 On<br />
<strong>the</strong> o<strong>the</strong>r hand, a recipient might be tempted to use some <strong>of</strong> its limited human and<br />
financial resources that were supposed to be devoted to <strong>the</strong> partnership <strong>for</strong> o<strong>the</strong>r pressing<br />
needs. In general, each side would typically prefer that <strong>the</strong> o<strong>the</strong>r fulfill its commitments,<br />
but have freedom to choose which <strong>of</strong> its own commitments will be fulfilled. Finally, if<br />
both sides defect by ignoring <strong>the</strong>ir commitments, nei<strong>the</strong>r does well because nei<strong>the</strong>r side<br />
gets <strong>the</strong> advantages <strong>of</strong> <strong>the</strong> partnership. These consequences are represented in <strong>the</strong> pay<strong>of</strong>f<br />
matrix <strong>of</strong> Table 3.7-1.<br />
Table 3.7-1. A Partnership as a Prisoner’s Dilemma.<br />
Donor<br />
Corporate<br />
Defect<br />
Corporate R = 3, R = 3 S = 0, T = 5<br />
Recipient<br />
Defect T = 5, S = 0 P = 1, P = 1<br />
R = Reward <strong>for</strong> mutual cooperation, T = Temptation to defect, S = Sucker’s pay<strong>of</strong>f, P = Punishment <strong>for</strong><br />
mutual defection. The first number in each cell is <strong>the</strong> pay<strong>of</strong>f to <strong>the</strong> Recipient, and <strong>the</strong> second number is<br />
<strong>the</strong> pay<strong>of</strong>f to <strong>the</strong> Donor.<br />
The pay<strong>of</strong>fs need not be symmetric, or even comparable. What matters is <strong>the</strong> rank order <strong>of</strong> each<br />
player’s pay<strong>of</strong>fs. The pay<strong>of</strong>f matrix <strong>of</strong> Table 3.7-1 is a fundamental tool <strong>for</strong> understanding <strong>the</strong><br />
<strong>the</strong>oretical foundations <strong>of</strong> partnerships. The numbers are meant to be suggestive only. What<br />
matters is <strong>the</strong>ir rank order. Since <strong>the</strong> pay<strong>of</strong>fs reflect <strong>the</strong> incentives <strong>of</strong> <strong>the</strong> players, each side wants<br />
to get as high a pay<strong>of</strong>f as possible. For <strong>the</strong> reasons just described, <strong>the</strong> rank order <strong>of</strong> <strong>the</strong> pay<strong>of</strong>fs in<br />
a partnership relationship (from best to worst) are: (1) <strong>the</strong> Temptation pay<strong>of</strong>f <strong>for</strong> defecting when<br />
<strong>the</strong> o<strong>the</strong>r cooperates, (2) <strong>the</strong> Reward <strong>for</strong> mutual cooperation, (3) <strong>the</strong> Punishment <strong>for</strong> mutual<br />
defection, and (4) <strong>the</strong> Sucker’s pay<strong>of</strong>f <strong>for</strong> cooperating when <strong>the</strong> o<strong>the</strong>r defects. (O<strong>the</strong>r games arise<br />
with o<strong>the</strong>r pay<strong>of</strong>f structures. For example, if mutual cooperation is preferred to unilateral<br />
defection, <strong>the</strong>re is no temptation to defect. The only issue in <strong>the</strong> resulting Assurance Game is <strong>for</strong><br />
<strong>the</strong> players to assure each o<strong>the</strong>r that <strong>the</strong>y are sensible. This essay deliberately focuses on <strong>the</strong><br />
harder case <strong>of</strong> <strong>the</strong> prisoner’s dilemma, in which <strong>the</strong> players need to overcome <strong>the</strong>ir short run<br />
temptation to exploit <strong>the</strong> situation at <strong>the</strong> o<strong>the</strong>r’s expense. With pay<strong>of</strong>fs in this order, <strong>the</strong> game is<br />
a prisoner’s dilemma. Inspection <strong>of</strong> Table 3.7-1 reveals that in <strong>the</strong> prisoner’s dilemma, each side<br />
has an incentive to defect, no matter what <strong>the</strong> o<strong>the</strong>r side does. However, if both defect, both do<br />
worse than <strong>the</strong>y could have done had <strong>the</strong>y both cooperated. That is <strong>the</strong> dilemma. (The original<br />
story involves two prisoners who are being interrogated by <strong>the</strong> police. Each is given an incentive<br />
to confess to help convict <strong>the</strong> o<strong>the</strong>r, but if both confess, <strong>the</strong> police do not need ei<strong>the</strong>r’s testimony.<br />
Technically, <strong>the</strong> game is a “prisoner’s dilemma” if <strong>the</strong> pay<strong>of</strong>fs <strong>for</strong> both players satisfy not only T<br />
> R > P > S, but also R > [T + S]/2.)<br />
Note that <strong>the</strong> pay<strong>of</strong>f matrix presents <strong>the</strong> game as if <strong>the</strong> relationship is completely symmetric.<br />
Actually, this is unnecessary. The pay<strong>of</strong>fs need not even be comparable between players. All that<br />
249
is necessary is that <strong>the</strong> pay<strong>of</strong>fs <strong>for</strong> each player separately fulfill <strong>the</strong> conditions <strong>of</strong> <strong>the</strong> prisoner’s<br />
dilemma, and this is likely to be true in almost any development partnership. Game <strong>the</strong>ory<br />
provides methods <strong>for</strong> analyzing a very wide range <strong>of</strong> strategic problems. Since <strong>the</strong> prisoner’s<br />
dilemma occurs in many contexts, it is one <strong>of</strong> most thoroughly studied games. (A good<br />
introduction to game <strong>the</strong>ory is Dixit and Skeath [1999]. 11 A more advanced game <strong>the</strong>ory text is<br />
Fudenberg and Tirole [1992]. 12 For reviews on <strong>the</strong> <strong>the</strong>oretical and empirical literature on <strong>the</strong><br />
prisoner’s dilemma, see Axelrod and Dion [1992] 13 and H<strong>of</strong>fman [2000] 14 ).<br />
If <strong>the</strong> Prisoner’s Dilemma is played only once, <strong>the</strong>re is no getting around <strong>the</strong> problem that each<br />
side has an incentive to defect, no matter what <strong>the</strong> o<strong>the</strong>r side does. This would result in a failure<br />
to achieve <strong>the</strong> benefits <strong>of</strong> mutual cooperation. However, if <strong>the</strong> game is played over and over, <strong>the</strong><br />
strategic possibilities are very much richer. Fortunately, this is exactly <strong>the</strong> situation in a<br />
partnership where <strong>the</strong> relationship is not based on a single choice, but an ongoing interaction<br />
between <strong>the</strong> donor and recipient. 15<br />
In <strong>the</strong> iterated prisoner’s dilemma, many strategies are possible since each player can make its<br />
current choice contingent on what has previously happened in <strong>the</strong> relationship. Cooperation<br />
<strong>the</strong>ory is <strong>the</strong> study <strong>of</strong> what strategy a sophisticated player should use and what conditions will<br />
sustain mutual cooperation. To study <strong>the</strong>se questions, Axelrod 16 organized a series <strong>of</strong> round<br />
robin computer tournaments in which both experts and amateurs were invited to submit a<br />
computer program that embodied <strong>the</strong>ir favorite strategy. In both rounds <strong>of</strong> <strong>the</strong>se tournaments,<br />
<strong>the</strong>re was one strategy that did best <strong>of</strong> all. This was <strong>the</strong> strategy called “tit <strong>for</strong> tat.” Tit <strong>for</strong> tat<br />
cooperates on <strong>the</strong> first move and <strong>the</strong>n does whatever <strong>the</strong> o<strong>the</strong>r side did on <strong>the</strong> previous move.<br />
By cooperating on <strong>the</strong> first move and <strong>the</strong>n doing whatever <strong>the</strong> o<strong>the</strong>r player did on <strong>the</strong> previous<br />
move, tit <strong>for</strong> tat managed to do well when interacting with a wide variety <strong>of</strong> more or less<br />
sophisticated strategies. Tit <strong>for</strong> tat’s robust success was due to its being nice, provocable, and<br />
<strong>for</strong>giving. Its niceness means that it was never <strong>the</strong> first to defect. Not being <strong>the</strong> first to defect<br />
prevented it from getting into unnecessary trouble. Its provocability meant that it retaliated when<br />
<strong>the</strong> o<strong>the</strong>r side defected. Provocability discouraged <strong>the</strong> o<strong>the</strong>r side from persisting in defection. By<br />
cooperating again as soon as <strong>the</strong> o<strong>the</strong>r player did, <strong>the</strong> <strong>for</strong>giveness <strong>of</strong> tit <strong>for</strong> tat helped restore<br />
mutual cooperation.<br />
Tit <strong>for</strong> tat is not <strong>the</strong> only strategy that can succeed by being nice, able to be provoked, and<br />
<strong>for</strong>giving. The important thing is reciprocity. For example, <strong>the</strong> strategy <strong>of</strong> tit <strong>for</strong> two tats needs<br />
two defections to be provoked. One advantage <strong>of</strong> tit <strong>for</strong> tat over o<strong>the</strong>r <strong>for</strong>ms <strong>of</strong> reciprocity is that<br />
it is easy <strong>for</strong> <strong>the</strong> o<strong>the</strong>r player to recognize. Once recognized, it is clear that <strong>the</strong> best way to<br />
respond to a tit <strong>for</strong> tat player is to cooperate.<br />
An especially interesting aspect <strong>of</strong> tit <strong>for</strong> tat’s success is that it never did better than any <strong>of</strong> <strong>the</strong><br />
o<strong>the</strong>r strategies it played with. In fact, it cannot do better since it never defects more <strong>of</strong>ten than<br />
<strong>the</strong> o<strong>the</strong>r player. This curious fact highlights <strong>the</strong> difference between a non-zero sum game like<br />
<strong>the</strong> iterated prisoner’s dilemma and a zero-sum game like chess or basketball. The single most<br />
important <strong>the</strong>oretical lesson <strong>of</strong> game <strong>the</strong>ory in general, and <strong>the</strong> iterated prisoner’s dilemma in<br />
particular, is that most interactions are not zero-sum games in which one side’s loss is <strong>the</strong> o<strong>the</strong>r<br />
side’s gain.<br />
Perhaps <strong>the</strong> biggest surprise from <strong>the</strong> tournaments is <strong>the</strong> complementary point that to maintain<br />
stable cooperation in an iterated prisoner’s dilemma, it is necessary to be provocable. In fact, <strong>the</strong><br />
250
sooner one responds to a defection by <strong>the</strong> o<strong>the</strong>r side, <strong>the</strong> easier it is to restore mutual cooperation<br />
by establishing that defection does not pay.<br />
A basic <strong>the</strong>oretical result is that <strong>the</strong> potential <strong>for</strong> mutual cooperation depends on “<strong>the</strong> shadow <strong>of</strong><br />
<strong>the</strong> future,” which is measured by w, <strong>the</strong> rate at which <strong>the</strong> pay<strong>of</strong>f <strong>of</strong> <strong>the</strong> next move is discounted<br />
relative to <strong>the</strong> present. Cooperation based on tit <strong>for</strong> tat is stable if and only if w is at least as great<br />
as <strong>the</strong> larger <strong>of</strong> (T-R)/(T-P) and (T-R)/(R-S). 17 Thus, as long as <strong>the</strong> shadow <strong>of</strong> <strong>the</strong> future is large<br />
enough, when one player is using tit <strong>for</strong> tat, <strong>the</strong> o<strong>the</strong>r player can do no better than using tit <strong>for</strong> tat<br />
as well, and this establishes mutual cooperation on a stable basis.<br />
An unavoidable feature <strong>of</strong> partnerships is <strong>the</strong> possibility <strong>of</strong> misimplemenation or<br />
misunderstanding. With misimplementation, a player intends to do one thing but actually does<br />
ano<strong>the</strong>r. For example, a leader may decide to cooperate, but <strong>the</strong> rest <strong>of</strong> <strong>the</strong> organization may not<br />
properly implement <strong>the</strong> leader’s choice. Misunderstanding occurs when a player does one thing,<br />
but <strong>the</strong> o<strong>the</strong>r player perceives it as something else. In ei<strong>the</strong>r case, a single error can cause an echo<br />
<strong>of</strong> unending trouble between two tit <strong>for</strong> tat players. 18 To deal with ei<strong>the</strong>r <strong>for</strong>m <strong>of</strong> error, a player<br />
should be slightly more generous than simple tit <strong>for</strong> tat. For example, a player might be generous<br />
at <strong>the</strong> 10% level, meaning that 10% <strong>of</strong> <strong>the</strong> time that <strong>the</strong> player would o<strong>the</strong>rwise defect, it<br />
cooperates instead. If a player realizes that it was responsible <strong>for</strong> <strong>the</strong> trouble due to its own<br />
misimplementation, it could even avoid responding to <strong>the</strong> o<strong>the</strong>r player’s defection after its own<br />
unintended defection. This is called “contrition.” Deductive <strong>the</strong>ory and computer simulation<br />
demonstrate that a generous tit <strong>for</strong> tat strategy is effective at dealing with ei<strong>the</strong>r type <strong>of</strong> error.<br />
Adding contrition fur<strong>the</strong>r minimizes <strong>the</strong> disruptive effects <strong>of</strong> misimplementation. 19<br />
Implications <strong>for</strong> Partnerships<br />
1. Implications <strong>for</strong> Selecting a Partner<br />
The principle <strong>of</strong> “selectivity” is usually taken to mean that program aid should be reserved <strong>for</strong><br />
countries that have adopted efficient pro-development policies <strong>for</strong> <strong>the</strong>mselves. 20 Cooperation<br />
<strong>the</strong>ory based on <strong>the</strong> iterated prisoner’s dilemma suggests a related but somewhat different set <strong>of</strong><br />
considerations in choosing a partner.<br />
1. The more favorable <strong>the</strong> pay<strong>of</strong>f structure, <strong>the</strong> easier it will be to achieve and sustain<br />
mutual cooperation. This implies that a potential donor or recipient consider more than<br />
just <strong>the</strong> potential gains from mutual cooperation. In selecting a partner, one should also<br />
consider <strong>the</strong> magnitude <strong>of</strong> <strong>the</strong> temptation to defect that <strong>the</strong> o<strong>the</strong>r will face.<br />
2. Similarly, <strong>the</strong> stronger <strong>the</strong> shadow <strong>of</strong> <strong>the</strong> future, <strong>the</strong> easier it will be to achieve and<br />
sustain mutual cooperation. A good partner is one who has a long enough time horizon<br />
that it will not want to exploit <strong>the</strong> relationship <strong>for</strong> immediate gain.<br />
3. A partner needs <strong>the</strong> organizational and managerial capacity to fulfill its responsibilities. It<br />
should not be overextended with o<strong>the</strong>r commitments.<br />
4. The potential <strong>for</strong> follow-on projects, especially at a larger scale, makes a partner a good<br />
prospect. This prospect <strong>of</strong> a follow-on project, especially one at a larger scale, makes<br />
success in <strong>the</strong> current project an investment in <strong>the</strong> continuing relationship.<br />
5. Selecting a partner who has a good reputation <strong>for</strong> cooperation has two benefits: it rewards<br />
good behavior in <strong>the</strong> past, and it increases <strong>the</strong> chances that <strong>the</strong> current partnership will<br />
succeed.<br />
251
2. Implications <strong>for</strong> Setting up <strong>the</strong> Partnership<br />
Once a donor and recipient have agreed to set up a partnership, <strong>the</strong> terms <strong>of</strong> <strong>the</strong> agreement need<br />
to be worked out. Theoretical and empirical research suggests that <strong>the</strong>re are three aspects <strong>of</strong> an<br />
ongoing relationship that facilitate cooperation based upon reciprocity: clarity <strong>of</strong> obligations,<br />
promptness <strong>of</strong> feedback, and <strong>the</strong> institutionalization <strong>of</strong> reciprocity. In setting up a partnership,<br />
<strong>the</strong> participants should take care that <strong>the</strong>se three conditions will be met throughout <strong>the</strong><br />
partnership.<br />
1. Clarity <strong>of</strong> obligations is needed so that a cooperative choice can be distinguished from a<br />
defection. If <strong>the</strong> partners are not able to agree on whe<strong>the</strong>r a given action was consistent<br />
with <strong>the</strong>ir obligations, <strong>the</strong>y are likely to get into mutual recriminations. Un<strong>for</strong>tunately,<br />
clarity <strong>of</strong> obligations competes with <strong>the</strong> flexibility <strong>of</strong> implementation. Until a deep bond<br />
<strong>of</strong> trust develops between <strong>the</strong> two sides, it may be better to err on <strong>the</strong> side <strong>of</strong> clarity <strong>of</strong><br />
obligations ra<strong>the</strong>r than flexibility in setting up a partnership.<br />
2. Promptness <strong>of</strong> feedback means that each side can monitor <strong>the</strong> behavior <strong>of</strong> <strong>the</strong> o<strong>the</strong>r so<br />
that any problems can be addressed be<strong>for</strong>e <strong>the</strong>y become major grievances. Promptness <strong>of</strong><br />
feedback streng<strong>the</strong>ns <strong>the</strong> shadow <strong>of</strong> <strong>the</strong> future by allowing a timely response to a<br />
perceived problem. Thus, in setting up <strong>the</strong> partnership, <strong>the</strong> obligations <strong>of</strong> <strong>the</strong> two sides<br />
should be chosen so that <strong>the</strong>ir per<strong>for</strong>mance (or nonper<strong>for</strong>mance) is observable as quickly<br />
as possible.<br />
3. The institutionalization <strong>of</strong> reciprocity can help by specifying in advance just what <strong>for</strong>m <strong>of</strong><br />
review and redress is open if ei<strong>the</strong>r side has a complaint about <strong>the</strong> o<strong>the</strong>r. Maxwell and<br />
Riddell 21 even suggest that what is needed is some kind <strong>of</strong> WTO agreement <strong>for</strong> aid<br />
administration. In <strong>the</strong> absence <strong>of</strong> such agreements, even in<strong>for</strong>mal norms can help prevent<br />
problems from echoing out <strong>of</strong> control. 22<br />
3. Implications <strong>for</strong> Modus Operandi<br />
Once a partnership is underway, <strong>the</strong> question <strong>of</strong> modus operandi deals with how <strong>the</strong> partners<br />
should behave in <strong>the</strong>ir relationship. Obviously, mutual cooperation is <strong>the</strong> ideal. But what should<br />
one partner do if <strong>the</strong> o<strong>the</strong>r does not cooperate by fulfilling its commitments in a timely manner?<br />
Theory and simulations show that <strong>the</strong> sooner one is provoked, <strong>the</strong> smaller <strong>the</strong> response needs to<br />
be in order to be effective. 23 Not responding promptly to an uncalled <strong>for</strong> defection risks sending<br />
<strong>the</strong> wrong signal. The longer defections go unchallenged, <strong>the</strong> more likely it is that <strong>the</strong> o<strong>the</strong>r<br />
player will draw <strong>the</strong> conclusion that defection can pay. Fur<strong>the</strong>rmore, <strong>the</strong> more strongly this<br />
pattern is established, <strong>the</strong> more difficult it will be to break.<br />
The importance <strong>of</strong> provocability is increased when <strong>the</strong> relationship is being observed by o<strong>the</strong>rs<br />
who are or may become partners with ei<strong>the</strong>r <strong>of</strong> <strong>the</strong> participants. The reason is that reputation<br />
matters. This gives a recipient some leverage over a donor. For example, if a recipient is<br />
provoked, it cannot only withhold part <strong>of</strong> its contribution to <strong>the</strong> partnership, but it can also<br />
threaten to criticize <strong>the</strong> donor in <strong>for</strong>ums that are important to <strong>the</strong> donor’s reputation and selfimage.<br />
24<br />
Provocability is also important <strong>for</strong> <strong>the</strong> donor. If, <strong>for</strong> example, a lending organization gets a<br />
reputation <strong>of</strong> allowing its partners to ignore <strong>the</strong>ir commitments without consequences, it may be<br />
difficult to hold o<strong>the</strong>r partners accountable in <strong>the</strong> future. This is <strong>the</strong> reason why <strong>the</strong> Grameen<br />
Banks, <strong>for</strong> example, are so insistent on prompt repayment <strong>of</strong> <strong>the</strong>ir microcredit loans (Bornstein,<br />
252
1996). 25 The Grameen Bank is willing, however, to allow late payment when <strong>the</strong>re is a large<br />
external shock beyond <strong>the</strong> <strong>for</strong>esight or control <strong>of</strong> <strong>the</strong> recipient, such as an unusually devastating<br />
monsoon. (Ano<strong>the</strong>r reason <strong>for</strong> adjusting <strong>the</strong> terms <strong>of</strong> <strong>the</strong> partnership would be if <strong>the</strong> premises <strong>of</strong><br />
<strong>the</strong> project were revealed to be inaccurate. Suppose, <strong>for</strong> example, <strong>the</strong> partnership was designed to<br />
supply water from wells. If <strong>the</strong> wells do not give <strong>the</strong> expected yield, <strong>the</strong> partners should<br />
renegotiate <strong>the</strong>ir commitments, perhaps switching to laying pipes. The new agreement would<br />
redefine what counts as cooperation or defection in <strong>the</strong> partnership.)<br />
In general, reciprocity is effective. In addition to being provocable, it is important to restore<br />
mutual cooperation as soon as possible by being <strong>for</strong>giving when <strong>the</strong> o<strong>the</strong>r side returns to<br />
cooperation.<br />
In a partnership <strong>for</strong> economic development, a recipient government may not always have <strong>the</strong><br />
capacity to implement <strong>the</strong> decisions it reaches. In fact, even donors sometimes make promises<br />
that <strong>the</strong>y fail to keep despite <strong>the</strong>ir best intentions. Moreover, <strong>the</strong>re may be cultural differences<br />
between <strong>the</strong> donor and recipient that can contribute to misunderstandings. Thus, an uncalled-<strong>for</strong><br />
defection might be due to misimplementation or misperception. In ei<strong>the</strong>r case, it pays to be<br />
somewhat generous to prevent echoing <strong>of</strong> conflict. This can be done by not responding to some<br />
small proportion <strong>of</strong> <strong>the</strong> o<strong>the</strong>r side’s defections, or by responding in a somewhat milder manner<br />
than usual. In ei<strong>the</strong>r case, however, too much generosity invites exploitation. Also, if <strong>the</strong> o<strong>the</strong>r<br />
side’s defection was simply a response to one’s own unintended defection, it pays to be contrite<br />
by not letting <strong>the</strong> conflict continue.<br />
4. Implications <strong>for</strong> Building Trust<br />
Trust is crucial <strong>for</strong> establishing cooperation based on mutual obligation. (This point is confirmed<br />
by a study <strong>of</strong> 17 joint ventures in <strong>the</strong> United Kingdom and Malaysia.) 26<br />
Since building trust takes time, it is likely to take place mostly between projects ra<strong>the</strong>r than<br />
within projects. In <strong>the</strong>oretical terms, this suggests <strong>the</strong> importance <strong>of</strong> distinguishing two different<br />
time scales <strong>of</strong> a partnership: a particular project and <strong>the</strong> long-term relationship. A project is<br />
typically based on a single agreement lasting several years. Within this time scale <strong>the</strong>re may be<br />
many “moves” as <strong>the</strong> partners fulfill <strong>the</strong>ir obligations. On a longer time scale, each project can be<br />
regarded as a single “move” in <strong>the</strong> relationship between <strong>the</strong> partners. An example is <strong>the</strong><br />
relationship between Conservation International and Starbucks. 27 In <strong>the</strong> first partnership project,<br />
Starbucks committed $150,000 over three years to promote shade-grown c<strong>of</strong>fee. At <strong>the</strong> end <strong>of</strong><br />
this period, Conservation International publicly praised Starbucks <strong>for</strong> helping farmers and <strong>for</strong><br />
improving <strong>the</strong> natural environment. With this endorsement and with consumer acceptance <strong>of</strong><br />
shade grown c<strong>of</strong>fee, Starbucks signed a new three-year partnership quadrupling its commitment.<br />
Theoretically, playing a game on a longer time scale has <strong>the</strong> advantage <strong>of</strong> providing more<br />
reliable feedback, but <strong>the</strong> disadvantage <strong>of</strong> having slower feedback. For <strong>the</strong> sake <strong>of</strong> building trust<br />
over time, <strong>the</strong> partners need a long time horizon as embodied in a strong shadow <strong>of</strong> <strong>the</strong> future.<br />
Theoretical work confirms that starting with small stakes and raising <strong>the</strong>m as <strong>the</strong> relationship<br />
develops helps <strong>the</strong> partners avoid having to take “leaps <strong>of</strong> faith.” 28<br />
5. Implications <strong>for</strong> Achieving Selectivity<br />
Donors need to be selective about <strong>the</strong> partnerships <strong>the</strong>y enter, lest <strong>the</strong>y spread <strong>the</strong>ir managerial<br />
and financial resources too thinly. Cooperation <strong>the</strong>ory suggests some guidelines <strong>for</strong> deciding just<br />
253
how to be selective. We have already discussed <strong>the</strong> characteristics <strong>of</strong> a good partner. Here we<br />
add some strategic considerations based on how reciprocity can work at <strong>the</strong> project level.<br />
1. If <strong>the</strong> recipient has not fulfilled <strong>the</strong> obligations <strong>of</strong> <strong>the</strong> current project, <strong>the</strong> donor can<br />
decide not to expand <strong>the</strong> project in <strong>the</strong> next phase or not to enter into new projects with<br />
this recipient. This has <strong>the</strong> advantage <strong>of</strong> helping to establish that cooperation needs to be<br />
mutual. (Numerous simulation studies show that <strong>the</strong> ability and willingness to leave an<br />
unsatisfactory relationship actually fosters cooperation in <strong>the</strong> long run. For a review see<br />
Axelrod [2000, p. 146f]). 29 Put ano<strong>the</strong>r way, to overcome a recipient’s temptation to<br />
exploit <strong>the</strong> relationship, <strong>the</strong> donor needs to be provocable at <strong>the</strong> long time scale as well as<br />
<strong>the</strong> short time scale.<br />
2. To avoid retreating from a country in need, a donor can be selective about <strong>the</strong> sector<br />
ra<strong>the</strong>r than <strong>the</strong> country. Thus if a project in one sector has not worked well, <strong>the</strong> donor<br />
may switch to a project in ano<strong>the</strong>r sector <strong>of</strong> <strong>the</strong> same country. Assuming that <strong>the</strong> decision<br />
makers are at least somewhat different in <strong>the</strong> two sectors, this can be an effective<br />
strategy. (To <strong>the</strong> degree that aid is fungible across sectors, <strong>the</strong> effectiveness <strong>of</strong> this<br />
approach is reduced.) 30<br />
6. Implications <strong>for</strong> Monitoring and Evaluation<br />
Monitoring is <strong>the</strong> continuous assessment <strong>of</strong> project implementation, while evaluation is <strong>the</strong><br />
periodic assessment <strong>of</strong> <strong>the</strong> project. In <strong>the</strong> aid community, <strong>the</strong> evaluation process is intended to<br />
serve two functions: institutional credibility and organizational learning. For institutional<br />
credibility, <strong>the</strong> acid test is per<strong>for</strong>mance on <strong>the</strong> ground. For this reason, accountability <strong>for</strong> resultbased<br />
assistance has become a fundamental imperative. 31 For organizational learning, <strong>the</strong> goal is<br />
not only to improve individual programs, but to make <strong>the</strong> results available to <strong>the</strong> global<br />
evaluation community.<br />
From <strong>the</strong> point <strong>of</strong> view <strong>of</strong> cooperation <strong>the</strong>ory, monitoring and evaluation can play an active role<br />
in sustaining <strong>the</strong> conditions needed <strong>for</strong> mutual cooperation. As discussed earlier, to achieve<br />
stable cooperation in an iterated prisoner’s dilemma, each player needs to know in a timely<br />
fashion whe<strong>the</strong>r <strong>the</strong> o<strong>the</strong>r is fulfilling its commitments. In particular, knowing when <strong>the</strong> o<strong>the</strong>r<br />
side has defected is needed <strong>for</strong> provocability and <strong>for</strong>giveness. Moreover, knowing when one’s<br />
own side has defected (perhaps unintentionally) is needed <strong>for</strong> contrition.<br />
Determining whe<strong>the</strong>r <strong>the</strong> partners are doing what <strong>the</strong>y promised is a different task than <strong>the</strong><br />
traditional role <strong>of</strong> evaluation <strong>of</strong> how well <strong>the</strong> partnership is achieving its goals. Periodic<br />
evaluation can be joined with continuous monitoring to assure <strong>the</strong> partners when mutual<br />
cooperation is being achieved, and to warn <strong>the</strong>m when it is not.<br />
Theoretically, <strong>the</strong> stability <strong>of</strong> cooperation relies on both partners having timely in<strong>for</strong>mation about<br />
<strong>the</strong> actions <strong>of</strong> <strong>the</strong> o<strong>the</strong>r. In practice, <strong>the</strong> donor is more likely to monitor and evaluate <strong>the</strong> recipient<br />
than <strong>the</strong> o<strong>the</strong>r way around.<br />
Whereas <strong>the</strong> behaviour and per<strong>for</strong>mance <strong>of</strong> low-income developing countries is measured<br />
and assessed in ever-increasing detail within <strong>the</strong> international community, <strong>the</strong> behavior<br />
and per<strong>for</strong>mance <strong>of</strong> <strong>the</strong> donor “partners” receives only cursory attention, except at <strong>the</strong><br />
aggregate level which is <strong>of</strong> little operational usefulness to individual recipients. 32<br />
A step in <strong>the</strong> right direction is <strong>the</strong> World Bank’s recently established Inspection Panel which<br />
investigates claims by local stakeholders that <strong>the</strong> Bank may have failed to adhere to its own<br />
254
operational policies, procedures in design, appraisal, or implementation <strong>of</strong> ongoing or new<br />
operations. 33<br />
The unique position <strong>of</strong> <strong>the</strong> World Bank allows it to play an important role in economic<br />
development activities even when it is not a direct participant. The World Bank’s multinational<br />
character, size and experience allow it to play an increasingly active role as catalyst in<br />
identifying and promoting promising activities. 34 Cooperation <strong>the</strong>ory suggests that even after a<br />
partnership is set up, <strong>the</strong>re are valuable services that could be per<strong>for</strong>med by a credible outside<br />
organization such as <strong>the</strong> World Bank. Potential services include <strong>the</strong> following:<br />
1. Promoting accounting standards to allow timely feedback on <strong>the</strong> per<strong>for</strong>mance <strong>of</strong> partners.<br />
2. Certifying that partners are being responsible in fulfilling <strong>the</strong>ir obligations.<br />
3. Sponsoring institutional mechanisms <strong>for</strong> redress if one side <strong>of</strong> a partnership has a complaint<br />
about <strong>the</strong> o<strong>the</strong>r.<br />
Conclusion<br />
A partnership <strong>for</strong> economic development includes divergent interests, as well as shared<br />
objectives. Analyzing a partnership as an iterated prisoner’s dilemma reveals <strong>the</strong> <strong>the</strong>oretical<br />
conditions needed to sustain mutual cooperation. These conditions lead to important implications<br />
<strong>for</strong> how to promote <strong>the</strong> effectiveness <strong>of</strong> such partnerships. The implications concern selecting a<br />
partner, setting up a partnership, choosing a modus operandi, building trust, achieving<br />
selectivity, and per<strong>for</strong>ming monitoring and evaluation.<br />
↑ Back to <strong>the</strong> top<br />
1 Maxwell, Simon and Tim Conway (2000). “Perspectives on Partnership,” World Bank OED Working<br />
Paper No. 6. Available at www.worldbank.org/html/oed.<br />
2 Pearson, Lester (1969). Partners in Development: Report <strong>of</strong> <strong>the</strong> Commission on International<br />
Development (NY: Praeger).<br />
3 Helleiner, Gerry (2000). “Towards Balance in Aid Relationships: Donor Per<strong>for</strong>mance Monitoring in<br />
Low-Income Developing Countries,” Cooperation South (UNDP), no. 2, p. 21-35. Available at<br />
www.ecdc.net.cn/events/co_south200002/4.htm<br />
4 Maxwell, Simon and Tim Conway (2000). “Perspectives on Partnership,” World Bank OED Working<br />
Paper No. 6. Available at www.worldbank.org/html/oed.<br />
5 World Bank (1998). “Partnership <strong>for</strong> Development: Proposed Actions <strong>for</strong> <strong>the</strong> World Bank,” SecM98-<br />
421, May 28, 1998.<br />
6 Branson, William and Nagy Hanna (2000). “Ownership and Conditionality,” World Bank OED<br />
Working Paper No. 8. Available at www.worldbank.org/html/oed.<br />
7 Gilbert, Christopher L., Andrew Powell, and David Vines (2000). “Positioning <strong>the</strong> World Bank,” in<br />
Christopher L. Gilbert and David Vines (eds.), The World Bank: Structure and Policies (Cambridge,<br />
UK: Cambridge University Press).<br />
8 Squire, Lyn (2000). “Why <strong>the</strong> World Bank Should be Involved in Development Research,” in<br />
Christopher L. Gilbert and David Vines (eds.), The World Bank: Structure and Policies (Cambridge,<br />
UK: Cambridge University Press).<br />
9 Anderson, R. W., C. L. Gilbert, and A. Powell (1991). “Securitising Development Finance: The Role <strong>of</strong><br />
Partial Guarantees and Commodity Contingency,” in T. Privolos and R. C. Duncan (eds.), Commodity<br />
Risk Management and Finance (Ox<strong>for</strong>d: Ox<strong>for</strong>d University Press).<br />
255
10 Making Partnerships Work on <strong>the</strong> Ground (1999). Making Partnerships Work on <strong>the</strong> Ground<br />
(Stockholm, Sweden: Ministry <strong>of</strong> Foreign Affairs), pp. 5 and 14.<br />
11 Dixit, Avinash and Susan Skeath (1999). Games <strong>of</strong> Strategy (NY: Norton).<br />
12 Fudenberg, Drew and Jean Tirole (1992). Game Theory (Cambridge, MA: MIT Press).<br />
13 Robert Axelrod and Douglas Dion, “The Fur<strong>the</strong>r Evolution <strong>of</strong> Cooperation,” Science, 242 (9 December<br />
1988), pp. 1385-1390.<br />
14 H<strong>of</strong>fmann, Robert (2000). “Twenty Years on: The Evolution <strong>of</strong> Cooperation Revisited,” Journal <strong>of</strong><br />
Artificial Societies and Social Simulation, vol. 3, no. 2. Available at<br />
www.soc.surrey.ac.uk/JASSS/3/2/<strong>for</strong>um/1.html<br />
15 Branson, William and Nagy Hanna (2000). “Ownership and Conditionality,” World Bank OED.<br />
Working Paper No. 8. Available at www.worldbank.org/html/oed.<br />
16 Axelrod, Robert (1984). The Evolution <strong>of</strong> Cooperation (NY: Basic Books).<br />
17 Axelrod, Robert (1984). The Evolution <strong>of</strong> Cooperation (NY: Basic Books).<br />
18 Molander, Per (1985). “The Optimal Level <strong>of</strong> Generosity in a Selfish, Uncertain Environment,” Journal<br />
<strong>of</strong> Conflict Resolution, vol. 29. pp.611-618.<br />
19 Wu, Jianzhong and Robert Axelrod (1995). "How to Cope with Noise in <strong>the</strong> Iterated Prisoner's Dilemma,"<br />
Journal <strong>of</strong> Conflict Resolution, vol. 39, 183-189.<br />
20 Hopkins, Raul, Andrew Powell, Amlan Roy, and Christopher L. Gilbert (2000). “The World Bank,<br />
Conditionality and <strong>the</strong> Comprehensive Development Framework,” in Christopher L. Gilbert and David<br />
Vines (eds.), The World Bank: Structure and Policies (Cambridge, UK: Cambridge University Press).<br />
21 Maxwell, Simon and Roger Riddell (1998). “Conditionality or Contract: Perspectives on Partnership<br />
<strong>for</strong> Development,” Journal <strong>of</strong> International Development, vol. 10, 257-268.<br />
22 Axelrod, Robert and Robert Keohane (1985). “Achieving Cooperation Under Anarchy,” World Politics, vol.<br />
38, 226-54. Reprinted in Kenneth A. Oye (ed.), Cooperation Under Anarchy (Princeton, NJ: Princeton<br />
University Press, 1985).<br />
23 Axelrod, Robert (1984). The Evolution <strong>of</strong> Cooperation (NY: Basic Books), pp 119 and 184f.<br />
24 Fox, Jonathan A. (2000), “The World Bank Inspection Panel: Lessons from <strong>the</strong> First Five Years,”<br />
Global Governance, vol. 3, pp. 279-318.<br />
25 Bornstein, David (1996). The Price <strong>of</strong> a Dream (New York: Simon and Schuster).<br />
26 Butler, Richard and Jas Gill (1999). “The Dynamics <strong>of</strong> Trust in Partnership Formation and Operation:<br />
Project Summary,” Mimeo. University <strong>of</strong> Brad<strong>for</strong>d Management Centre.<br />
27 Purcell, Randall (2000). “Good Practices And Regional Programs” (Washington, DC: World Bank),<br />
66f.<br />
28 Roberts, Gilbert and Thomas N. Sherratt (1998), “Development <strong>of</strong> Cooperative Relationships through<br />
Increasing Investment,” Nature, vol. 394, p. 175-179.<br />
29 Axelrod, Robert (2000). “On Six Advances in Cooperation Theory,” Analyse & Kritik, vol. 22, 130-<br />
151, 146f.<br />
30 Devarajan, Shantayanan and Vinya Swaroop (2000). “The Implications <strong>of</strong> Foreign Aid Fungibility <strong>for</strong><br />
Development Assistance,” in Christopher L. Gilbert and David Vines (eds.), The World Bank: Structure<br />
and Policies (Cambridge, UK: Cambridge University Press).<br />
31 Picciotto, Robert (<strong>for</strong>thcoming). “Evaluation in <strong>the</strong> World Bank: Antecedents, Methods, and<br />
Instruments,” in Jan-Eric Furubo, Ray C. Rist, and Rolf Sandahl (eds.) International Atlas <strong>of</strong><br />
Evaluation (Piscataway, NJ: Transaction).<br />
32 Helleiner, Gerry (2000). “Towards Balance in Aid Relationships: Donor Per<strong>for</strong>mance Monitoring in<br />
Low-Income Developing Countries,” Cooperation South (UNDP), no. 2, p. 21-35. Available at<br />
www.ecdc.net.cn/events/co_south200002/4.htm<br />
33 Fox, Jonathan A. (2000), “The World Bank Inspection Panel: Lessons from <strong>the</strong> First Five Years,”<br />
Global Governance, vol. 3, pp. 279-318.<br />
256
34 Gilbert, Christopher L., Andrew Powell, and David Vines (2000). “Positioning <strong>the</strong> World Bank,” in<br />
Christopher L. Gilbert and David Vines (eds.), The World Bank: Structure and Policies (Cambridge,<br />
UK: Cambridge University Press)<br />
257
3.8. Process Query System as a Framework <strong>for</strong> Modeling and Analysis <strong>of</strong><br />
Regional Stability (George Cybenko, Douglas Madory)<br />
Authors and Organizations: George Cybenko, Douglas Madory; Dartmouth College<br />
Contact In<strong>for</strong>mation: gvc@dartmouth.edu; douglas.c.madory@dartmouth.edu<br />
Abstract<br />
During <strong>the</strong> past five years, a study has been conducted <strong>of</strong> situational-awareness problems that<br />
have arisen in multiple application domains including computer security, autonomic computing,<br />
sensor networks, video tracking, and social network analysis. The variety <strong>of</strong> applications<br />
investigated suggests that a common analytic foundation underlies many such problems. As a<br />
result, a general purpose framework has been developed <strong>for</strong> modeling situational-awareness<br />
across multiple sensor types and environments. This framework is called Process Query System<br />
(PQS). In addition, <strong>the</strong> Human Behavioral Modeling Language (HBML) has been developed as a<br />
schema to support behavioral modeling and analysis by large-scale computational systems across<br />
a variety <strong>of</strong> domains. The PQS framework, which is based on process detection, toge<strong>the</strong>r with<br />
HBML, can enable modeling and analysis <strong>of</strong> regional stability by facilitating <strong>the</strong> comparison <strong>of</strong><br />
competing <strong>the</strong>ories or aggregating <strong>the</strong> conclusions <strong>of</strong> multiple domain specific-analytical<br />
approaches.<br />
Introduction<br />
Regional stability can be viewed as an attribute <strong>of</strong> <strong>the</strong> social, political and economic dynamics <strong>of</strong><br />
a geographic area. As such, regional stability is measured and <strong>for</strong>ecasted in terms <strong>of</strong> macro-level<br />
behavioral properties <strong>of</strong> human systems, which in turn may be dependent on and derived from<br />
micro-level human behaviors.<br />
Behavioral modeling <strong>of</strong> systems, both natural and engineered, is an area <strong>of</strong> growing interest. 1,2,3,4<br />
In particular, quantitative behavioral modeling <strong>of</strong> humans is <strong>of</strong> interest at all scales and <strong>for</strong> a<br />
multitude <strong>of</strong> reasons. 5,6 None<strong>the</strong>less, in at least some disciplines, <strong>the</strong> notion <strong>of</strong> what a behavior is<br />
and how it is represented has not been broadly <strong>for</strong>malized. 7 To avoid confusion or<br />
misunderstanding, this paper briefly reviews an approach to behavioral modeling and its uses.<br />
Atomic activities are <strong>the</strong> basic elements <strong>of</strong> behaviors in this approach, in which behaviors are<br />
composed <strong>of</strong> activities. The granularity <strong>of</strong> an activity is defined by <strong>the</strong> modeler, not by <strong>the</strong><br />
underlying application so that an activity in one context can be a behavior in ano<strong>the</strong>r. For<br />
instance, “voting” can be viewed as an activity atomic element in <strong>the</strong> context <strong>of</strong> modeling <strong>the</strong><br />
democratic process. On <strong>the</strong> o<strong>the</strong>r hand, “voting” can be view as a behavior comprised <strong>of</strong> atomic<br />
activities (such as “transit to a polling station,” “voter identification/au<strong>the</strong>ntication,” “casting<br />
confidential votes,” or “tallying votes”).<br />
In <strong>the</strong> framework, behaviors are collections <strong>of</strong> atomic activities. Research ef<strong>for</strong>ts have led to<br />
three distinct categories <strong>of</strong> behaviors. 8<br />
<br />
A 0 th -order behavior is merely a list <strong>of</strong> activities. For example, people commonly list<br />
<strong>the</strong>ir hobbies on <strong>the</strong>ir resumes: cycling, skiing, chess, etc. Such a list <strong>of</strong> activities, with no<br />
258
indication <strong>of</strong> frequencies or interdependencies, constitutes a 0 th order model <strong>of</strong> behavior<br />
in this terminology.<br />
A 1 st order behavior is an enumeration <strong>of</strong> activities toge<strong>the</strong>r with <strong>the</strong>ir relative<br />
frequencies, such as a person saying that he or she goes to <strong>the</strong> bank once a week, watches<br />
television <strong>for</strong> 2 hours a day, or spends three hours preparing <strong>for</strong> a one hour-lecture.<br />
A 2 nd order behavioral model consists <strong>of</strong> causal dependencies between activities,<br />
described in ei<strong>the</strong>r deterministic or statistical terms. For example, if a person says that he<br />
or she has c<strong>of</strong>fee at <strong>the</strong> end <strong>of</strong> every meal, this relates two activities to each o<strong>the</strong>r in a<br />
causal manner. That is <strong>the</strong> probability <strong>of</strong> having c<strong>of</strong>fee, given that a meal was eaten, is<br />
1.0. Statistical assertions, such as <strong>the</strong> probability <strong>of</strong> c<strong>of</strong>fee given a meal, is some number<br />
less than 1 and is also within <strong>the</strong> scope <strong>of</strong> a 2 nd order behavior.<br />
Roughly speaking, 0 th , 1 st and 2 nd order behavioral models can be regarded, respectively, as<br />
collections <strong>of</strong> basic activities, relative frequencies <strong>of</strong> basic activities, and dependencies between<br />
activities.<br />
Fur<strong>the</strong>rmore, this review <strong>of</strong> behavioral model across various domains has suggested that <strong>the</strong>re<br />
are three major uses <strong>of</strong> behavior models.<br />
<br />
<br />
<br />
Enable prediction. The first and most ambitious use is to enable prediction. Specifically,<br />
given a behavioral model and evidence that a system occupies an estimated state<br />
according to <strong>the</strong> behavioral model, prediction strives to <strong>for</strong>ecast <strong>the</strong> next state or to assign<br />
probabilities to <strong>the</strong> next state.<br />
Characterize a system under observation. A second use <strong>of</strong> behavioral models seeks to<br />
characterize, or to assign to a clustered class, a system under observation. For example,<br />
investment records may indicate that an individual is “conservative,” as opposed to<br />
“risky,” in his or her investment decisions. Such a characterization may be possible,<br />
while an accurate prediction or <strong>for</strong>ecast may not be. For this reason, that prediction or<br />
<strong>for</strong>ecasting can be more challenging than characterization.<br />
Detect change or anomaly. The last major use <strong>of</strong> behavioral modeling is change or<br />
anomaly detection. In this use, a system’s behavior is first empirically modeled and<br />
characterized, and <strong>the</strong>n it is monitored to detect when <strong>the</strong> behavior deviates sufficiently<br />
from its original characterization.<br />
A large collection, perhaps all, regional stability models can be <strong>for</strong>mulated in terms <strong>of</strong> <strong>the</strong>se<br />
different orders <strong>of</strong> behaviors and behavioral uses. This research has been focused on (1) generic<br />
technologies, <strong>the</strong>ories, and s<strong>of</strong>tware systems <strong>for</strong> modeling behaviors in <strong>the</strong>se ways, (2)<br />
representing behaviors uni<strong>for</strong>mly so that <strong>the</strong>y can be shared and made operational, and (3)<br />
detecting known or learning new behaviors from empirical observations.<br />
Below a description is provided <strong>of</strong> a s<strong>of</strong>tware system <strong>for</strong> detecting behavioral patterns from a<br />
stream <strong>of</strong> observations, namely process query systems (PQSs), 9 as well as an XML framework<br />
<strong>for</strong> representing various orders <strong>of</strong> behaviors in general systems, be <strong>the</strong>y human, engineered,<br />
standalone or networked. 10 Operational, computational approaches to modeling regional stability<br />
require at least <strong>the</strong>se two technical capabilities. Specifically, models <strong>of</strong> regional stability should<br />
be and could be codified in standardized schema (e.g., HBML) to allow <strong>the</strong>m to be used<br />
simultaneously in simulations and analyses. Computational engines (e.g., PQS) should be created<br />
259
<strong>for</strong> associating evidence, events, observations and indicators with hypo<strong>the</strong>sized models to<br />
estimate which behavioral models are instantiated and to determine <strong>the</strong> status <strong>of</strong> those models.<br />
Process Query Systems<br />
The ability to instrument and collect data from numerous disparate environments has increased<br />
dramatically in recent years. Computer systems and networks now routinely include various<br />
per<strong>for</strong>mance monitors, firewalls, intrusion-detection systems, and application-logging agents. In<br />
addition, sensor networks have been deployed in physical environments to record acoustic,<br />
seismic, infrared, video, electromagnetic, and o<strong>the</strong>r types <strong>of</strong> measurements. 11, 12 These networks<br />
also can monitor and extensively archive communications, as well as financial and social<br />
13, 14<br />
transactions among large communities <strong>of</strong> people and organizations.<br />
While <strong>the</strong> technology to instrument such environments has matured significantly, <strong>the</strong> ability to<br />
obtain situational awareness from <strong>the</strong> resulting enormous data streams has not kept pace. Sensedevent<br />
data are <strong>of</strong>ten displayed in relatively<br />
raw <strong>for</strong>mats, leaving analysis and<br />
interpretation up to human operators, which<br />
ultimately is not scalable.<br />
Nei<strong>the</strong>r traditional database technology nor<br />
rule-based expert systems have proved to be<br />
up to <strong>the</strong> task <strong>of</strong> closing <strong>the</strong> gap between<br />
low-level sensor events and high-level<br />
situational awareness. Database<br />
technologies, including extensions to datastream<br />
processing, effectively store, index,<br />
and retrieve sensor reports, but <strong>the</strong>y do not<br />
provide analysis beyond rudimentary report<br />
generation. On <strong>the</strong> o<strong>the</strong>r hand, decision trees<br />
and logical-rule processing inherit <strong>the</strong> wellknown<br />
brittleness and scalability problems<br />
associated with expert systems. A new<br />
approach <strong>for</strong> extracting situational awareness<br />
from sensed data is <strong>the</strong>re<strong>for</strong>e needed.<br />
During <strong>the</strong> past five years, situationalawareness<br />
problems have been studied that<br />
have arisen in multiple application domains<br />
including computer security, autonomic<br />
computing, sensor networks, video tracking,<br />
and social network analysis. The variety <strong>of</strong><br />
applications suggests that a common analytic<br />
foundation underlies many such problems. A<br />
general-purpose framework has been<br />
Figure 3.8-1. PQS Framework <strong>for</strong> Network<br />
Security.<br />
developed <strong>for</strong> modeling situational awareness across multiple sensor types and environments.<br />
Using this framework, which is based on process detection, a PQS has been implemented and<br />
tested in several applications. The PQS modeling framework consists <strong>of</strong> several steps, as<br />
illustrated in Figure 3.8-1.<br />
260
Step 1. A sensed environment consists <strong>of</strong> processes with distinct states, dynamics, and<br />
observables. In <strong>the</strong> case <strong>of</strong> computer security, computer attacks are <strong>the</strong> processes. Possible states<br />
<strong>of</strong> <strong>the</strong>se attack processes include reconnaissance, intrusion, exploitation, and data exfiltration.<br />
Attack processes change <strong>the</strong>ir states over time as determined by <strong>the</strong> attack model’s dynamics.<br />
Step 2. The states and dynamics <strong>of</strong> processes in an environment cannot be observed directly, but<br />
<strong>the</strong>y do produce observable events and artifacts.<br />
Step 3. The sensing infrastructure detects events and communicates <strong>the</strong>m back to an analysis<br />
center. The events provide evidence <strong>of</strong> <strong>the</strong> processes’ states but are not identical to <strong>the</strong>m. For<br />
example, it is usually impossible to know precisely about a computer attack’s abstract internal<br />
state—only sensing and detecting observable artifacts <strong>of</strong> attacks such as network packets, file<br />
system changes, and system behaviors, including processor utilization, can be expected.<br />
Step 4. Sensor observations about <strong>the</strong> hidden, internal processes’ states <strong>of</strong>ten consist <strong>of</strong><br />
inconclusive and noisy evidence, which makes gaining situational awareness <strong>of</strong> <strong>the</strong> environment<br />
a challenge.<br />
Step 5. Knowledge <strong>of</strong> <strong>the</strong> processes and <strong>the</strong>ir states within an environment provides <strong>the</strong> desired<br />
situational awareness. Whe<strong>the</strong>r in computer security, sensor networks, social network analysis,<br />
or modeling regional stability, a key complicating factor in <strong>the</strong>se application domains is that<br />
many active processes are possible, and observations <strong>of</strong> <strong>the</strong> processes are interwoven,<br />
ambiguous, and unlabeled. Some observations can be missed, while o<strong>the</strong>rs can enter <strong>the</strong> data<br />
stream as noise.<br />
The table below summarizes how <strong>the</strong> PQS framework applies to various application domains.<br />
Table 3.8-1. The PQS Framework as it Applies to Various Application Domains.<br />
Application<br />
Processes States Observables<br />
environment<br />
Computer attacks Host and network<br />
behaviors<br />
<strong>National</strong> border and<br />
physical perimeter<br />
defense<br />
Geographic region<br />
Identity <strong>the</strong>ft and<br />
management<br />
Social networks<br />
Moving objects<br />
(people, animals,<br />
vehicles)<br />
Airborne agent<br />
diffusion and drift<br />
Consumer, bank, ID<br />
thief’s activities<br />
Business and social<br />
activity<br />
Normal, scanned,<br />
infected, failed, trusted,<br />
hostile<br />
Position and velocity<br />
Releases at times T,<br />
locations L<br />
Normal, phished,<br />
exploited<br />
Stages <strong>of</strong> a business or<br />
social process<br />
Tripwire, applications<br />
logs, Snort alerts, hostbased<br />
logs, file access,<br />
user access<br />
Video, infrared images,<br />
acoustic data, seismic<br />
data, electromagnetic<br />
data<br />
Sensor detection <strong>of</strong> an<br />
airborne agent<br />
Credit reports, Web<br />
postings, database<br />
breaches, pretexts<br />
Communications and<br />
transactions<br />
PQS is s<strong>of</strong>tware that uses various algorithms to generate and manage hypo<strong>the</strong>ses about an<br />
observed event sequence, given a set <strong>of</strong> process models. It consists <strong>of</strong> <strong>the</strong> following components:<br />
Track and hypo<strong>the</strong>sis extension. Given a new event, this component updates <strong>the</strong> tracks in <strong>the</strong><br />
current set <strong>of</strong> hypo<strong>the</strong>ses. Specifically, a track can be extended if its current hypo<strong>the</strong>sized state<br />
can transition to a next state that can generate <strong>the</strong> currently observed event. The new tracks can<br />
261
e instantiated to accommodate <strong>the</strong> newly observed event, which creates a new set <strong>of</strong><br />
hypo<strong>the</strong>ses.<br />
Hypo<strong>the</strong>sis scoring. Because <strong>the</strong> number <strong>of</strong> hypo<strong>the</strong>ses can increase exponentially, this<br />
component ranks <strong>the</strong>m according to a score that measures <strong>the</strong> merit <strong>of</strong> tracks within <strong>the</strong><br />
hypo<strong>the</strong>sis or some o<strong>the</strong>r metric. For example, Occam-type rules can assign high scores to <strong>the</strong><br />
simplest hypo<strong>the</strong>ses, or, if <strong>the</strong> models are hidden Markov models (HMMs), a Viterbi-type<br />
decoder can score hypo<strong>the</strong>ses by <strong>the</strong> likelihood <strong>of</strong> <strong>the</strong>ir tracks.<br />
Hypo<strong>the</strong>sis management. This component keeps hypo<strong>the</strong>ses with <strong>the</strong> best scores and scores<br />
above a select threshold. Possible approaches <strong>for</strong> implementing this component include<br />
(1) applying heuristics that simply keep <strong>the</strong> highest scoring hypo<strong>the</strong>ses, (2) clustering hypo<strong>the</strong>ses<br />
and keeping exemplars from each cluster <strong>of</strong> hypo<strong>the</strong>ses, and (3) maintaining a probability<br />
distribution over all possible hypo<strong>the</strong>ses by updating and sampling <strong>the</strong> distribution using Markov<br />
chain Monte Carlo (MCMC) techniques. 15,16<br />
Situation evaluation. This component uses risk-assessment or variance-estimation computations<br />
to address ambiguous situations in<br />
which multiple hypo<strong>the</strong>ses can be<br />
consistent with <strong>the</strong> observed events at<br />
any given time. For example, given<br />
multiple possible explanations <strong>for</strong> a<br />
sequence <strong>of</strong> events, it might assign<br />
reporting priority to those hypo<strong>the</strong>ses<br />
that present a higher risk within <strong>the</strong><br />
environment.<br />
The power <strong>of</strong> <strong>the</strong> PQS approach derives<br />
from <strong>the</strong> separation <strong>of</strong> <strong>the</strong> models from<br />
<strong>the</strong> detection logic. Constructing a<br />
decision tree or a rule set to derive <strong>the</strong><br />
possible hypo<strong>the</strong>ses <strong>for</strong> a series <strong>of</strong><br />
observations and a small set <strong>of</strong> models,<br />
<strong>for</strong> example, is not difficult. However,<br />
how <strong>the</strong> decision tree or rule set would have to Figure 3.8-2. HBML Object Hierarchy.<br />
be changed if o<strong>the</strong>r models were added to <strong>the</strong><br />
environment must be considered. In <strong>the</strong> PQS<br />
framework, if new model descriptions are added, <strong>the</strong> algorithmic steps would operate as usual; in<br />
contrast, without PQS, <strong>the</strong> corresponding rule sets and decision trees would have to be<br />
extensively and carefully revised to maintain <strong>the</strong> ability to disambiguate between <strong>the</strong> different<br />
possible observation sequences and resulting hypo<strong>the</strong>ses. The strength <strong>of</strong> PQS is that it<br />
automates <strong>the</strong> logic <strong>of</strong> <strong>the</strong> detection and disambiguation computation, while decision trees and<br />
expert system-type rule sets must encode both <strong>the</strong> models and <strong>the</strong> detection logic simultaneously.<br />
Human Behavioral Modeling Language (HBML)<br />
Human and machine behavioral modeling and analysis are active areas <strong>of</strong> study in a variety <strong>of</strong><br />
domains <strong>of</strong> current interest including analyzing political and social regional stability. The basic<br />
concept <strong>of</strong> a “behavior” is intuitively easy to grasp, but <strong>the</strong> precise, quantitative notions <strong>of</strong> what<br />
behaviors are and how <strong>the</strong>y can be represented, compared, shared, integrated, and analyzed are<br />
262
not well established. They typically vary from domain to domain, even from researcher to<br />
researcher. The HBML proposes definitions and a framework which can accelerate progress on<br />
computational and algorithmic behavioral modeling and analyses.<br />
The HBML is distinguished from o<strong>the</strong>r behavioral modeling languages such as UML by being<br />
primarily a language <strong>for</strong> instantiating process models <strong>for</strong> pr<strong>of</strong>iling and tracking dynamic objects<br />
in <strong>the</strong> human terrain. There<strong>for</strong>e, <strong>the</strong> analysis <strong>of</strong> <strong>the</strong> represented objects and <strong>the</strong>ir dynamics is data<br />
driven ra<strong>the</strong>r than simulation oriented. Representations are designed to efficiently capture<br />
relationships and behaviors derived from analysis <strong>of</strong> dense data streams such as network traffic<br />
flows, physical traffic flows, SIGINT and HUMINT report streams, etc.<br />
In developing <strong>the</strong> representational framework, <strong>the</strong> intent was to capture <strong>the</strong> essence <strong>of</strong> <strong>the</strong><br />
dynamical objects which exist in <strong>the</strong> human terrain in as generic a framework as possible. The<br />
generic nature <strong>of</strong> <strong>the</strong> representation language is based on insights drawn from <strong>the</strong> successful use<br />
<strong>of</strong> graphical models in probability <strong>the</strong>ory. It incorporates generic process modeling and tracking<br />
techniques such as those <strong>for</strong>ming <strong>the</strong> basis <strong>of</strong> <strong>the</strong> PQS described in <strong>the</strong> previous section.<br />
Experience in process tracking applications in diverse domains indicates that elements <strong>of</strong> a<br />
useful modeling system tend to fall into four broad generic categories. These four categories are<br />
as follows:<br />
Environment: <strong>the</strong> rule system governing interactions among entities<br />
Entities: <strong>the</strong> objects <strong>of</strong> interest with <strong>the</strong>ir functional descriptions captured in one or<br />
more pr<strong>of</strong>iles<br />
<br />
<br />
Behaviors: <strong>the</strong> space <strong>of</strong> potential processes in which an entity may be engaged<br />
Observations: <strong>the</strong> collected and possibly filtered data which support <strong>the</strong> process<br />
tracking application<br />
In <strong>the</strong> following section, a generic representation language is presented <strong>for</strong> describing entities in<br />
<strong>the</strong> human terrain in terms <strong>of</strong> <strong>the</strong>ir range <strong>of</strong> potential behaviors. The language is organized along<br />
two dimensions. The first dimension is scalar, with functional objects organized in multiple<br />
layers <strong>of</strong> aggregation from low level “atomic objects” to progressively larger scales <strong>of</strong><br />
“aggregate objects.” With properly defined dimension reductions at scale, aggregation may<br />
<strong>the</strong>oretically extend from individuals (atomic entities) through multiple scales <strong>of</strong> functional<br />
groupings, possibly to aggregate entities operating at <strong>the</strong> global scale. For example, a multiscalar<br />
aggregation in <strong>the</strong> business domain might be defined in terms <strong>of</strong> a progression <strong>of</strong> discrete<br />
scales, such as: worker to workgroup to division to subsidiary to multi-national conglomerate.<br />
In addition, each entity is defined in terms <strong>of</strong> (1) relevant stationary attributes, (2) <strong>the</strong> entity's<br />
locus in <strong>the</strong> human terrain, and (3) a functional description <strong>of</strong> potential behaviors in which <strong>the</strong><br />
entity may be engaged. Process descriptions are captured in <strong>the</strong> generic Shannon stochastic<br />
process framework in terms <strong>of</strong> <strong>the</strong>ir 0th, 1st, and 2nd order descriptions <strong>of</strong> <strong>the</strong>ir process states<br />
and interactions.<br />
These entities interact in a specified environment which encodes <strong>the</strong> topology and rule system<br />
determining <strong>the</strong> interactions <strong>of</strong> <strong>the</strong> objects. Examples <strong>of</strong> environmental systems include (1) a<br />
communication network infrastructure, associated protocols, and global behaviors, (2) an<br />
electronic auction system and its associated rules <strong>of</strong> order matching and interaction,<br />
(3) transportation and utility systems that support <strong>the</strong> interactions <strong>of</strong> entities in a city, (4) a<br />
political system, which defines rules <strong>for</strong> campaign and election conduct, and (5) a social system<br />
which encodes guidelines <strong>for</strong> interaction among social sects.<br />
263
The table below describes examples <strong>of</strong> HBML applications in a variety <strong>of</strong> domains, along with<br />
0 th , 1 st and 2 nd order behaviors associated with <strong>the</strong>se domains.<br />
Table 3.8-2. Examples <strong>of</strong> HBML Applications.<br />
Domain Application 0 th Order<br />
Behavior<br />
Cyber<br />
Social<br />
Network Use<br />
Pr<strong>of</strong>iling<br />
Corporate<br />
Interactions<br />
Sending e-mail,<br />
visiting web sites,<br />
accessing<br />
fileservers, etc.<br />
Meeting, e-mail,<br />
collaborating,<br />
calling, etc.<br />
Spatial Tracking Frequented<br />
locations<br />
Logistics Stocks Bids, Asks,<br />
Position<br />
1st Order<br />
Behavior<br />
Probability <strong>of</strong><br />
accessing certain<br />
websites at certain<br />
times <strong>of</strong> day<br />
Probability <strong>of</strong><br />
contact with o<strong>the</strong>rs<br />
Probability <strong>of</strong><br />
being at a location<br />
conditioned on<br />
time or context<br />
Frequency <strong>of</strong><br />
buying and selling,<br />
position <strong>for</strong> a<br />
stock<br />
2nd Order<br />
Behavior<br />
Probability <strong>of</strong><br />
visiting web sites<br />
conditioned on<br />
browsing history<br />
Chance <strong>of</strong> meeting<br />
someone from<br />
Group A after<br />
Group B<br />
Probability <strong>of</strong><br />
transiting to and<br />
from locations<br />
Tendency to move<br />
up and down in<br />
position<br />
Applicability to Modeling and Analysis <strong>of</strong> Regional Stability<br />
We believe that regional stability can be modeled as a function <strong>of</strong> behaviors <strong>of</strong> multiple actors at<br />
various levels <strong>of</strong> granularity, interacting within and across <strong>the</strong> domains listed in Table 3.8-2. The<br />
behaviors are responses to situations, stimuli and global events or trends, such as created by<br />
climate change, economics, politics and cultural dynamics <strong>for</strong> example. The levels <strong>of</strong> behavioral<br />
granularity include individual, group, demographic, social, regional and international. Moreover,<br />
<strong>the</strong> behavior <strong>of</strong> actors at any level <strong>of</strong> granularity is influenced and conditioned by <strong>the</strong> context and<br />
composition <strong>of</strong> <strong>the</strong> actors in question. For example, a religious organization’s behavior is<br />
influenced by <strong>the</strong> behaviors <strong>of</strong> <strong>the</strong> organization’s membership and leadership, as well as <strong>the</strong><br />
ambient cultural context in which that group exists.<br />
In order to encode behaviors, it is <strong>the</strong>re<strong>for</strong>e necessary to express actions depending on<br />
preconditions and conditioned on contexts. Human Behavioral Modeling Language (HBML) is<br />
a representational scheme <strong>for</strong> achieving this encoding and we propose it as a mechanism <strong>for</strong><br />
representing, sharing and computing with behaviors across domains and granularity levels.<br />
Once we have a mechanism <strong>for</strong> encoding behaviors at various levels and <strong>of</strong> various types, it<br />
becomes possible to characterize actors based on <strong>the</strong>ir behaviors, cluster actors with similar<br />
behaviors, detect deviations from baseline behaviors and simulate systems on <strong>the</strong> basis <strong>of</strong><br />
estimated behaviors. Given a collection <strong>of</strong> behavioral events, <strong>the</strong> Process Query Systems<br />
technology makes it possible to associate events with specific hypo<strong>the</strong>sized behaviors. The most<br />
likely behaviors <strong>the</strong>n become <strong>the</strong> basis <strong>for</strong> <strong>for</strong>ecasting <strong>the</strong> dynamics <strong>of</strong> a group <strong>of</strong> actors in <strong>the</strong><br />
context <strong>of</strong> regional stability analysis.<br />
264
Summary<br />
The two proposed two technologies, namely PQS and HBML, could <strong>for</strong>m <strong>the</strong> foundation <strong>for</strong> a<br />
standard, common computational capability that can be used <strong>for</strong> representing economic, health,<br />
political and environmental models related to regional stability and reasoning about those models<br />
in <strong>the</strong> context <strong>of</strong> data, observations and o<strong>the</strong>r evidence. The role <strong>of</strong> PQS is to associate events,<br />
observations, and o<strong>the</strong>r evidence with competing or complimentary behavioral models <strong>of</strong><br />
regional stability. HBML is a proposed starting point <strong>for</strong> standard representations <strong>of</strong> behaviors at<br />
different scales and <strong>of</strong> different types.<br />
↑ Back to <strong>the</strong> top<br />
1 V. H. Berk and G. Cybenko. “Process query systems.” IEEE Computer, pages 62-70, January 2007.<br />
http://www.dartmouth.edu/~humanterrain/papers/CYBENKO-IEEE-Computer-PQS.pdf<br />
2 V.H. Berk and N. Fox, “Process Query Systems <strong>for</strong> Network Security Monitoring,” Proc. SPIE—<br />
Sensors, and Command, Control, Communications, and Intelligence (C3I) Technologies <strong>for</strong> Homeland<br />
Security and Homeland Defense IV, 2005, pp. 520-530;<br />
http://people.ists.dartmouth.edu/~vberk/papers/berkfox5778-75.pdf<br />
3 R. Savell and G. Cybenko. “Mining <strong>for</strong> social processes in intelligence data streams.” Social<br />
Computing, Jan 2008.<br />
4 V. H. Berk, W. Chung, V. Crespi, G. Cybenko, R. Gray, D. Hernando, G. Jiang, H. Li, and Y. Sheng.<br />
“Process Query Systems <strong>for</strong> surveillance and awareness”. In Proceedings <strong>of</strong> <strong>the</strong> Seventh World<br />
Multiconference on Systemics, Cybernetics and In<strong>for</strong>matics (SCI 2003), Orlando, Florida, July 2003.<br />
5 R. Savell and G. Cybenko. “Mining <strong>for</strong> social processes in intelligence data streams.” Social<br />
Computing, Jan 2008.<br />
6 N. Sandell, R.Savell, D. Twardowski and G. Cybenko. “HBML: A Language <strong>for</strong> Quantitative<br />
Behavioral Modeling in <strong>the</strong> Human Terrain.” Social Computing and Behavioral Modeling, pages 180-<br />
190, April 2009.<br />
7 6. D. A. Levitis, W. Z. Lidicker Jr. and G. Freund, “Behavioural biologists do not agree on<br />
what constitutes behavior,” Animal Behaviour, Volume 78, Issue 1, July 2009, Pages 103-110.<br />
8 R. Savell and G. Cybenko. “Mining <strong>for</strong> social processes in intelligence data streams.” Social<br />
Computing, Jan 2008.<br />
9 V. H. Berk and G. Cybenko. “Process query systems.” IEEE Computer, pages 62-70, January 2007.<br />
http://www.dartmouth.edu/~humanterrain/papers/CYBENKO-IEEE-Computer-PQS.pdf<br />
10 R. Savell and G. Cybenko. “Mining <strong>for</strong> social processes in intelligence data streams.” Social<br />
Computing, Jan 2008.<br />
11 V. H. Berk and G. Cybenko. “Process query systems.” IEEE Computer, pages 62-70, January 2007.<br />
http://www.dartmouth.edu/~humanterrain/papers/CYBENKO-IEEE-Computer-PQS.pdf<br />
12 V.H. Berk and N. Fox, “Process Query Systems <strong>for</strong> Network Security Monitoring,” Proc. SPIE—<br />
Sensors, and Command, Control, Communications, and Intelligence (C3I) Technologies <strong>for</strong> Homeland<br />
Security and Homeland Defense IV, 2005, pp. 520-530;<br />
http://people.ists.dartmouth.edu/~vberk/papers/berkfox5778-75.pdf<br />
13 V. H. Berk, W. Chung, V. Crespi, G. Cybenko, R. Gray, D. Hernando, G. Jiang, H. Li, and Y. Sheng.<br />
“Process Query Systems <strong>for</strong> surveillance and awareness”. In Proceedings <strong>of</strong> <strong>the</strong> Seventh World<br />
Multiconference on Systemics, Cybernetics and In<strong>for</strong>matics (SCI 2003), Orlando, Florida, July 2003.<br />
14 R. Savell and G. Cybenko. “Mining <strong>for</strong> social processes in intelligence data streams.” Social<br />
Computing, Jan 2008.<br />
15 S.S. Blackman, Multiple-Target Tracking with Radar Applications, Artech House, 1986.<br />
265
16 S. Oh et al., A Scalable Real-Time Multiple-Target Tracking Algorithm <strong>for</strong> Sensor Networks, tech.<br />
report UCB//ERL M05/9, Univ. <strong>of</strong> Cali<strong>for</strong>nia, Berkeley, 2005.<br />
266
3.9. The Use <strong>of</strong> Cross-impact Analysis <strong>for</strong> Modeling, Simulation, and<br />
Forecasting (Stephen Millett)<br />
Author and Organization: Stephen M. Millett, Futuring Associates, LLC<br />
Contact In<strong>for</strong>mation: smillett@futuringassociates.com<br />
The use <strong>of</strong> systems dynamics <strong>for</strong> modeling, simulation, and <strong>for</strong>ecasting is well known. 1,2,3,4,5 It<br />
was made famous by <strong>the</strong> work <strong>of</strong> Jay Forrester and his protégés at MIT, <strong>the</strong> Club <strong>of</strong> Rome<br />
report, and <strong>the</strong> subsequent updated versions <strong>of</strong> Limits to Growth by Donella Meadows, et al., and<br />
<strong>the</strong> best-selling book The Fifth Discipline by Peter Senge. The use <strong>of</strong> cross-impact analysis,<br />
however, <strong>for</strong> <strong>the</strong> same functions is not as well known. The purpose <strong>of</strong> this paper is to assert that<br />
cross-impact analysis may be just as effective and arguably quicker, less expensive, and more<br />
robust than systems dynamics. It certainly is a complementary approach that provides fur<strong>the</strong>r<br />
<strong>for</strong>esight <strong>for</strong> <strong>the</strong> benefit <strong>of</strong> both <strong>for</strong>ward-looking analysts and decision-makers.<br />
Cross-impact analysis was developed in <strong>the</strong> mid-1960s by Olaf Helmer and Ted Gordon at <strong>the</strong><br />
RAND Corporation. It was designed to fulfill a need to integrate many trends with each o<strong>the</strong>r in<br />
a nonlinear way (to capture indirect relationships and feedback loops) and to project <strong>the</strong>m as net<br />
assessments into <strong>the</strong> future. Cross-impact analysis represented a step beyond <strong>the</strong> expert judgment<br />
<strong>of</strong> <strong>the</strong> Delphi Method and <strong>the</strong> hypo<strong>the</strong>tical sequences <strong>of</strong> events in planning scenarios. It also<br />
introduced <strong>the</strong> application <strong>of</strong> Bayesian probabilities <strong>of</strong> future trend outcomes so that <strong>the</strong> method<br />
blended qualitative judgments with quantitative mechanics. 6,7,8<br />
The cross-impact matrix that RAND originated can be viewed as a tabular way to construct a<br />
systems dynamics flow diagram. It is intuitively easier to construct and to interpret, especially<br />
<strong>for</strong> complex models, than <strong>the</strong> approach taken by MIT at about <strong>the</strong> same time. A matrix is created<br />
by listing all <strong>the</strong> trends, issues, or variables relevant to a subject matter in <strong>the</strong> future as both<br />
columns and headings. Values are inserted in <strong>the</strong> cells <strong>of</strong> <strong>the</strong> matrix as to how <strong>the</strong> occurrence <strong>of</strong><br />
one trend outcome would directly impact <strong>the</strong> likelihood <strong>of</strong> o<strong>the</strong>r trend outcomes also occurring.<br />
In <strong>the</strong> language <strong>of</strong> ma<strong>the</strong>matics, <strong>the</strong> a priori probabilities are marginal probabilities, and <strong>the</strong> cell<br />
values are conditional probabilities; <strong>the</strong> net impacts generate a posteriori probabilities, or most<br />
likely future occurrences. Much <strong>of</strong> <strong>the</strong> process was an exercise in expert judgment, but <strong>the</strong> rigor<br />
<strong>of</strong> <strong>the</strong> method and <strong>the</strong> use <strong>of</strong> simple ma<strong>the</strong>matics <strong>for</strong>ced many assumptions to be made explicitly<br />
and logically consistent.<br />
The RAND modeling and <strong>for</strong>ecasting team broke up during <strong>the</strong> 1960s, and <strong>the</strong> cross-impact<br />
method proliferated. Gordon created his own company, The Futures Group, near Hart<strong>for</strong>d,<br />
Connecticut. He fur<strong>the</strong>r developed a variation <strong>of</strong> cross-impact analysis called Trend-Impact<br />
Analysis. 9,10,11 Meanwhile, Helmer migrated across Los Angeles to <strong>the</strong> School <strong>of</strong> Business at <strong>the</strong><br />
University <strong>of</strong> Cali<strong>for</strong>nia, where he teamed with Selwyn Enzer to create a cross-impact method<br />
and mainframe computer s<strong>of</strong>tware program called INTERAX. Enzer subsequently collaborated<br />
in <strong>the</strong> 1970s with a team <strong>of</strong> ma<strong>the</strong>maticians, economists, and social scientists <strong>of</strong> <strong>the</strong> Battelle<br />
Memorial Institute at its laboratories in Geneva (Switzerland), Frank<strong>for</strong>t (Germany), and<br />
Columbus (Ohio). Battelle in turn created its own version <strong>of</strong> cross-impact analysis with group<br />
dynamics and scenario generation by creating its BASICS method and s<strong>of</strong>tware program. In <strong>the</strong><br />
267
mid-1980s, Battelle introduced one <strong>of</strong> <strong>the</strong> earliest personal computer s<strong>of</strong>tware programs to<br />
per<strong>for</strong>m cross-impact analysis and generate scenarios; a decade later it fur<strong>the</strong>r simplified <strong>the</strong><br />
method, updated <strong>the</strong> s<strong>of</strong>tware <strong>for</strong> Windows on a lap top, and renamed it Interactive Future<br />
Simulations, or IFS. 12,13,14,15,16<br />
While <strong>the</strong>re are many variations on cross-impact analysis, this paper focuses on just <strong>the</strong> Battelle<br />
approach. This method is discussed using an illustrative IFS scenario analysis <strong>of</strong> potential<br />
outcomes <strong>for</strong> <strong>the</strong> war in Iraq. This example was run on May 21, 2008 and has not been revised or<br />
updated with new in<strong>for</strong>mation since <strong>the</strong>n. 17 While it is a purely hypo<strong>the</strong>tical example, it does<br />
demonstrate <strong>the</strong> simplicity and robustness <strong>of</strong> generating both <strong>for</strong>ecasting and planning scenarios<br />
by cross-impact analysis. It also shows an example <strong>of</strong> how to model, simulate, and <strong>for</strong>ecast <strong>the</strong><br />
future stability in Iraq within <strong>the</strong> context <strong>of</strong> <strong>the</strong> stability <strong>of</strong> <strong>the</strong> entire Middle East with<br />
implications <strong>for</strong> U.S. security and global stability.<br />
The IFS method, as with many o<strong>the</strong>r <strong>for</strong>ecasting methods, including systems dynamics, begins<br />
with a topic question. In this example, <strong>the</strong> topic question read “What will be <strong>the</strong> most likely<br />
outcomes <strong>of</strong> <strong>the</strong> present war in Iraq by 2012?” It was assumed that <strong>the</strong> reader was familiar with<br />
“<strong>the</strong> present war in Iraq.” At <strong>the</strong> time that this question was posed, <strong>the</strong> potential success <strong>of</strong> <strong>the</strong><br />
Surge was still in question, and <strong>the</strong> presidential and congressional 2008 elections had not yet<br />
been held. The date <strong>of</strong> 2012 is important, because <strong>the</strong> time frame calibrates expert judgments<br />
about what is possible, likely, and virtually impossible to occur just four years into <strong>the</strong> future<br />
(while a longer period <strong>of</strong> time might open <strong>the</strong> imagination up to all kinds <strong>of</strong> future possibilities).<br />
The second step was to select <strong>the</strong> most important descriptors (trends, issues, factors, elements, or<br />
variables) relative to <strong>the</strong> topic question to be included in <strong>the</strong> analysis. In general terms, this phase<br />
is called “<strong>the</strong> specification <strong>of</strong> <strong>the</strong> model,” and it is <strong>the</strong> same <strong>for</strong> both IFS and systems dynamics.<br />
Model specification is always an exercise in expert judgment; someone has to decide which<br />
descriptors to include and which to omit. In effect, <strong>the</strong> specification <strong>of</strong> <strong>the</strong> model creates a<br />
practical although somewhat arbitrary closed system or fixed set, which is one condition <strong>for</strong><br />
predictability.<br />
Who makes <strong>the</strong> selection <strong>of</strong> <strong>the</strong> descriptors is very important. In full-blown projects, it is<br />
recommended that two to five expert focus groups are conducted, including about 12 diverse<br />
experts per session. The Nominal Group Technique is a recommended technique to guide <strong>the</strong><br />
experts toward an expansive list; voting is <strong>the</strong>n used to down-select <strong>the</strong> most important in rank<br />
order. Although <strong>the</strong> IFS s<strong>of</strong>tware can accommodate up to 35 descriptors, it is best to limit <strong>the</strong> set<br />
to no more than two dozen so that models do not become too complex to understand without<br />
providing any marginal benefits. In fact, complex models <strong>of</strong>ten contain redundancies that <strong>for</strong>ce<br />
<strong>the</strong> convergence <strong>of</strong> outcomes through some repetitious and self-rein<strong>for</strong>cing fate. For “quick and<br />
dirty” feasibility studies, 6 to 12 descriptors are enough. In this illustrative example, based on<br />
previous experience, only six descriptors were selected.<br />
Ra<strong>the</strong>r than projecting just one state, or outcome, <strong>for</strong> each descriptor, <strong>the</strong> IFS method calls <strong>for</strong><br />
two to five, typically three, likely future states <strong>for</strong> each descriptor. The states should be mutually<br />
exclusive and exhaustive <strong>of</strong> all reasonable alternative outcomes <strong>for</strong> a descriptor by <strong>the</strong> target<br />
year. This again is ano<strong>the</strong>r design feature that represents a closed system or a fixed set. The<br />
states may be defined qualitatively or expressed as quantitative ranges. Along with <strong>the</strong><br />
specification <strong>of</strong> alternative states in <strong>the</strong> example, <strong>the</strong> a priori probabilities <strong>of</strong> occurrence by 2012<br />
were determined. These a priori probabilities were literally “prior” in <strong>the</strong> sense <strong>of</strong> reflecting<br />
268
previous knowledge and present (May 2008) in<strong>for</strong>mation on <strong>the</strong> descriptors, and “prior” in <strong>the</strong><br />
sense <strong>of</strong> providing a starting point <strong>for</strong> calculations based on <strong>the</strong> <strong>for</strong>thcoming cross-impact matrix.<br />
They reflect <strong>the</strong> judgment <strong>of</strong> a single expert that should be reviewed and potentially revised by<br />
peers.<br />
The list <strong>of</strong> six descriptors, <strong>the</strong>ir alternative outcomes by 2012, and <strong>the</strong> a priori probabilities<br />
appear in Table 3.9-1.<br />
Table 3.9-1. The List <strong>of</strong> Descriptors, Their Alternative States, and A Priori Probabilities.<br />
Descriptors States A Priori Probabilities<br />
1. U.S. Military Presence in Iraq<br />
A. >125,000 troops 0.30<br />
B. 50,000 to 125,000 troops 0.45<br />
C.
increase or decrease <strong>the</strong> a priori probability <strong>of</strong> descriptor y, state a, occurring by <strong>the</strong> target year?<br />
A zero means that <strong>the</strong>re is no impact. There is a presumption <strong>of</strong> symmetry. In arraying <strong>the</strong><br />
descriptor states and in constructing <strong>the</strong> matrix, <strong>the</strong> states are listed in a hierarchical order <strong>of</strong><br />
“high,” “medium,” and “low” relative to <strong>the</strong> definition <strong>of</strong> <strong>the</strong> descriptor (not relative to <strong>the</strong><br />
proportionality <strong>of</strong> <strong>the</strong> a priori probabilities). This design will always align one descriptor’s<br />
“high” with o<strong>the</strong>r descriptors’ “high” states. Conversely, <strong>the</strong> “low” state will always be aligned<br />
with o<strong>the</strong>r “low” states. This symmetry is not required by <strong>the</strong> method, but it facilitates <strong>the</strong> project<br />
team in filling out <strong>the</strong> matrix with <strong>the</strong> use <strong>of</strong> <strong>the</strong> IFS s<strong>of</strong>tware.<br />
The process <strong>of</strong> completing a cross-impact matrix is best left up to two or three lead experts from<br />
<strong>the</strong> project team, using cross-impact guides prepared by <strong>the</strong> descriptor analysis and <strong>the</strong>n<br />
conducting a later review by peers <strong>for</strong> criticism. The completion <strong>of</strong> a matrix initially may take<br />
only a few hours, but typically matrices become iterative with many revisions. It is very much a<br />
learning process, as <strong>the</strong> cross-impacting <strong>of</strong> some descriptors raises questions about descriptor<br />
relationships that have never been thought about or discussed. In per<strong>for</strong>ming cross-impact<br />
analysis, it quickly becomes clear just how much is known and how much still needs to be found<br />
out about <strong>the</strong> descriptors in <strong>the</strong> model. This leads to questions <strong>for</strong> fur<strong>the</strong>r research and<br />
identification <strong>of</strong> issues that must be monitored more closely.<br />
The completed cross-impact matrix <strong>for</strong> <strong>the</strong> illustrative example <strong>of</strong> <strong>the</strong> future stability <strong>of</strong> Iraq<br />
appears as Table 3.9-2.<br />
In order to interpret <strong>the</strong> example cross-impact matrix, starting in <strong>the</strong> upper left hand corner<br />
Descriptor 1 on Descriptor 1 is automatically filled in with zeros. The next is Descriptor 1, U.S.<br />
Military Presence in Iraq, impacting Descriptor 2, Stability <strong>of</strong> <strong>the</strong> Iraqi Government. Descriptor 1<br />
may be seen as having a significant impact on Descriptor 2 <strong>for</strong> <strong>the</strong> period <strong>of</strong> time in question<br />
(2008-2012). There<strong>for</strong>e, >125,000 U.S. troops in Iraq (<strong>the</strong> “high” state <strong>of</strong> Descriptor 1) has a +3<br />
impact on a highly stable and self-supporting (“high” state) Iraqi government.<br />
The opposite relationship, <strong>the</strong> impact <strong>of</strong> Descriptor 2 on Descriptor 1, is judged to be <strong>the</strong><br />
opposite: a highly stable Iraqi government would lower <strong>the</strong> a priori probability that <strong>the</strong>re would<br />
be a high state <strong>of</strong> U.S. troops in Iraq by 2012. Because every descriptor is impacted by every<br />
o<strong>the</strong>r descriptor in <strong>the</strong> matrix, inputs, elements (or “stocks”), outputs, and feedback loops are<br />
shown just as <strong>the</strong>y would be in systems dynamics or any o<strong>the</strong>r model.<br />
270
Table 3.9-2. Cross-impact Matrix <strong>of</strong> <strong>the</strong> Future stability <strong>of</strong> Iraq.<br />
1. U.S.<br />
Military<br />
Presence<br />
in Iraq<br />
2.Stability 3. U.S.<br />
<strong>of</strong> <strong>the</strong> Middle<br />
Iraqi Govt East<br />
Policy<br />
4. Saudi<br />
Role in<br />
Iraqi<br />
Affairs<br />
5. Iranian<br />
Role in<br />
Iraqi<br />
Affairs<br />
6. Level <strong>of</strong><br />
Violence<br />
in Iraq<br />
0.30 A. >125,000 troops<br />
0.45 B. 50,000 to 125,000 troops<br />
0.25 C. 125,000 troops * * * -3 -1 3 3 1 -3 -2 0 2 3 1 -3 3 1 -3 2 14<br />
0.45 B. 50,000 to 125,000 troops * * * -1 1 1 1 1 -1 -1 1 1 1 1 -1 1 1 -1 5 15<br />
0.25 C.
a<strong>the</strong>r than being buried as so many assumptions and expert judgments are made in econometric<br />
and even systems dynamics models. They are subject to peer review and revision by new<br />
in<strong>for</strong>mation. It must be understood that <strong>the</strong> cross-impact method, especially IFS, is based on<br />
what is known about <strong>the</strong> past and <strong>the</strong> present; if better knowledge is available in <strong>the</strong> future, <strong>the</strong>n<br />
<strong>the</strong> model can easily be updated. The current model is not literally depicting <strong>the</strong> future, but ra<strong>the</strong>r<br />
<strong>the</strong> current expectations <strong>for</strong> <strong>the</strong> future, subject to new in<strong>for</strong>mation and model revisions. The<br />
model, <strong>the</strong>re<strong>for</strong>e, can be predictive only to <strong>the</strong> extent that (1) prescient judgments have been<br />
made, (2) reasonable boundaries have been applied to <strong>the</strong> problem (making a closed system or<br />
fixed set), and (3) all known descriptors play out in <strong>the</strong> future as expected. In <strong>the</strong> worst case, a<br />
good model shows much about <strong>the</strong> current state, which becomes a foundation <strong>for</strong> thinking about<br />
<strong>the</strong> future.<br />
The matrix also shows what is considered to be <strong>the</strong> most important descriptors as “drivers” and<br />
“drivens.” A “driver” is a descriptor that has many impacts on o<strong>the</strong>r descriptors, and a “driven”<br />
is a descriptor that is highly impacted by o<strong>the</strong>r descriptors. It is possible that a descriptor can be<br />
both a driver and a driven, indicating a highly volatile descriptor.<br />
In this example, <strong>the</strong> single most impactful driver is considered to be Descriptor 6, <strong>the</strong> Level <strong>of</strong><br />
Violence in Iraq. The second most impactful descriptor is <strong>the</strong> Iranian Role in Iraqi Affairs, and<br />
<strong>the</strong> third is overall U.S. policy <strong>for</strong> stability and security in <strong>the</strong> Middle East. Conversely, <strong>the</strong> most<br />
driven descriptor, or what might be considered <strong>the</strong> “dependent variable,” is Descriptor 1, U.S.<br />
Military Presence in Iraq. This indicates that <strong>the</strong> number <strong>of</strong> American troops remaining in Iraq<br />
depends upon how many o<strong>the</strong>r variations (descriptors) play out from 2008 to 2012. Saudi<br />
involvement in <strong>the</strong> stability <strong>of</strong> Iraq is highly driven, while Iranian involvement is more proactive<br />
(impactful) in Iraqi stability than <strong>the</strong> Saudi role.<br />
With a completed matrix in <strong>the</strong> IFS s<strong>of</strong>tware, <strong>the</strong> IFS algorithm can be run, which in turn will<br />
generate scenarios. Because <strong>the</strong> digital data and memory requirements are relatively small, <strong>the</strong><br />
calculations require one or two seconds to run. The algorithm is deterministic, not Monte Carlo,<br />
in <strong>the</strong> sense that it always calculates <strong>the</strong> numbers <strong>the</strong> same way, with no randomness. There is<br />
nothing deterministic in <strong>the</strong> method in a metaphysical sense o<strong>the</strong>r than <strong>the</strong> judgments made to<br />
complete a cross-impact matrix. The algorithm begins with each descriptor state set to 1.0 and to<br />
0, as <strong>the</strong> starting points to calculate <strong>the</strong> a posteriori probabilities <strong>of</strong> descriptor states from <strong>the</strong><br />
cross-impact matrix and to cluster <strong>the</strong>m into scenarios. In terms <strong>of</strong> Bayesian probabilities, <strong>the</strong><br />
cross-impact values are new in<strong>for</strong>mation that changes <strong>the</strong> a priori probabilities up to 1.0 (will<br />
occur) or to 0 (will not occur). The scenario results, which are clusters <strong>of</strong> identically occurring<br />
sets <strong>of</strong> descriptor states, <strong>for</strong> our illustrative example appear in Table 3.9-3.<br />
In this example, <strong>the</strong>re were six descriptors and a total <strong>of</strong> 18 descriptor states (three alternative<br />
states <strong>for</strong> each descriptor). The total number <strong>of</strong> single simulations, or single scenarios, generated<br />
by <strong>the</strong> IFS s<strong>of</strong>tware algorithm was 36 (2 × 18, or one simulation with each descriptor state set to<br />
1.0 and to 0 as <strong>the</strong> initial point <strong>of</strong> calculation). The most likely scenario has a frequency <strong>of</strong> 12 out<br />
<strong>of</strong> 36 single scenarios, each with identical occurring and non-occurring sets <strong>of</strong> descriptor states.<br />
In addition, <strong>the</strong> a posteriori probabilities can be seen <strong>for</strong> each descriptor state.<br />
Looking at <strong>the</strong> example in Table 3.9-3, a “1” beside a descriptor state means that it occurred, and<br />
a “0” means that alternative descriptor states did not occur. Reading <strong>the</strong> table down <strong>the</strong> columns<br />
shows scenarios as sets <strong>of</strong> consistently occurring descriptor states.<br />
272
It must be restated here that this is only an illustrative example <strong>of</strong> <strong>the</strong> IFS method based on more<br />
general cross-impact methods. This is a highly simplified model <strong>of</strong> a very complex question that<br />
merits far more attention than what was given to this example. The results should not be overinterpreted<br />
or considered a well-considered <strong>for</strong>ecast based on how quickly it was generated by<br />
just one expert. Occurrence<br />
Table 3.9-3. Scenario Results from <strong>the</strong> IFS S<strong>of</strong>tware.<br />
Scenario Type 1 2 3 4 5 6 7<br />
Frequency 12 4 3 3 2 2 2<br />
A Priori<br />
Probability<br />
Total<br />
Occurrences<br />
Posterior<br />
Probability<br />
1. U.S. Military Presence in Iraq<br />
A. >125,000 troops 1 0 0 0 1 0 1 0.30 21 0.58<br />
B. 50,000 to 125,000 troops 0 0 1 1 0 0 0 0.45 9 0.25<br />
C.
state. American <strong>for</strong>eign policy would shift to a focus primarily on oil and economic issues. The<br />
Saudis would continue to support Sunni tribes and militias, while <strong>the</strong> Iranian government would<br />
have little or no direct influence over <strong>the</strong> Iraqis.<br />
At least five o<strong>the</strong>r scenarios, although less likely, should also be considered.<br />
The scenarios can be interpreted in at least two different ways: anticipatory and normative.<br />
Anticipatory. If <strong>the</strong>se scenarios are taken at face value, <strong>the</strong> most likely scenario to occur, if all<br />
trends were correctly identified and turned out in 2012 as expected in May 2008, is <strong>the</strong> first<br />
scenario, which we might characterize as “Long-Term U.S. Military Presence in Iraq.” It is a<br />
scenario <strong>of</strong> instability in Iraq and <strong>the</strong> entire Middle East. This scenario would be likely to occur<br />
if <strong>the</strong> U.S. did nothing differently than it was doing in May 2008.<br />
Normative. On <strong>the</strong> o<strong>the</strong>r hand, one can also ask which scenario is <strong>the</strong> preferred scenario. This<br />
normative approach results in guidance <strong>for</strong> future planning and action. If one would like to see<br />
Scenario 2 occur, and if <strong>the</strong> scenario is indeed internally consistent (as is likely because <strong>of</strong> <strong>the</strong><br />
cross-impact model), <strong>the</strong>n Scenario 2 indicates what conditions, as identified in <strong>the</strong> model, will<br />
need to occur in order <strong>for</strong> U.S. troop levels to fall below 50,000 (or even lower).<br />
These scenarios can be interpreted as “baseline” scenarios because <strong>the</strong>y are <strong>the</strong> results <strong>of</strong> a<br />
closed system and a fixed set <strong>of</strong> descriptors. Extensive sensitivity analysis can be per<strong>for</strong>med on<br />
<strong>the</strong>se scenarios by redefining descriptors and <strong>the</strong>ir states and by changing a priori probabilities.<br />
Cross-impact values could also be changed in <strong>the</strong> matrix. The most popular type <strong>of</strong> sensitivity<br />
analysis entails changing a priori probabilities. Disruptive events can also be introduced to<br />
generate completely different scenarios from <strong>the</strong> baseline.<br />
Addressing now <strong>the</strong> inadequacies <strong>of</strong> a closed system or a fixed set, new descriptors can be added<br />
as potential disruptive events, also called “wild cards” and “black swans.” They are essentially<br />
exogenous variables. The disruptive event descriptor is given a title, and one state with 1.00<br />
probability <strong>of</strong> occurrence. It is <strong>the</strong>n impacted upon <strong>the</strong> o<strong>the</strong>r descriptors in <strong>the</strong> model, but none <strong>of</strong><br />
<strong>the</strong> o<strong>the</strong>r descriptors impact it, as it is <strong>the</strong> most certain and most important descriptor in <strong>the</strong><br />
simulation. Dozens, even hundreds <strong>of</strong> such disruptive event simulations can be run, with each<br />
one taking only minutes to run.<br />
One major difference between cross-impact analysis (especially IFS) and systems dynamics is<br />
that cross-impact analysis can be used <strong>for</strong> both sensitivity analysis and <strong>the</strong> generation <strong>of</strong><br />
substantially different scenarios. The different scenarios give us different stories about <strong>the</strong> future<br />
and show us <strong>the</strong> conditionality associated with different outcomes, both most likely and most<br />
desirable. It can also be argued that <strong>the</strong> construction <strong>of</strong> a cross-impact matrix as a model is<br />
typically easier, quicker, and less expensive to complete than systems dynamics. Of course, <strong>the</strong><br />
two approaches are complementary and may be done in parallel, especially in cases where crossimpact<br />
analysis could be used <strong>for</strong> very broad questions, while <strong>the</strong> systems dynamics analysis<br />
could be used <strong>for</strong> much finer grain <strong>for</strong>ecasts.<br />
Ideally, an organization or agency would draw up plans to meet <strong>the</strong> challenges <strong>of</strong> each scenario.<br />
Practically, one should develop strategies and plans that are sufficiently robust to be responsive<br />
to most if not all scenarios. Certainly, one should look at <strong>the</strong> most desirable scenario and<br />
determine what would be required to make that one happen. In addition to planning, one must<br />
also monitor trends and collect new in<strong>for</strong>mation that might be needed to update and potentially<br />
revise <strong>the</strong> cross-impact matrix and its resulting scenarios.<br />
274
It is highly recommended that <strong>the</strong> use <strong>of</strong> cross-impact analysis be fur<strong>the</strong>r explored as a<br />
supplementary approach to systems dynamics as well as o<strong>the</strong>r modeling, simulation, and<br />
<strong>for</strong>ecasting methods.<br />
In conclusion, cross impact analysis is an alternative approach to systems dynamics that one may<br />
argue is easier to construct and to understand. It provides a matrix organization <strong>for</strong> modeling and<br />
simulation <strong>of</strong> alternative futures. It is also provides an analytical alternative to intuitive, or<br />
strictly qualitative, scenarios. Cross impact analysis relies heavily upon trend analysis and expert<br />
judgment, but in ways that such in<strong>for</strong>mation and judgments must be made explicitly and subject<br />
to peer review and revisions over time. In <strong>the</strong> IFS approach to cross impact analysis and scenario<br />
generation, scenarios are structures <strong>of</strong> alternative sets <strong>of</strong> different likely outcomes <strong>for</strong> a fixed set<br />
<strong>of</strong> descriptors. The prescient value <strong>of</strong> IFS scenarios rests upon <strong>the</strong> boundary conditions <strong>of</strong> a<br />
designed closed system or fixed set <strong>of</strong> variable <strong>for</strong> a defined <strong>for</strong>ecasting topic and <strong>the</strong> use <strong>of</strong><br />
Bayesian probabilities. The learning value <strong>of</strong> <strong>the</strong> IFS method rests upon <strong>the</strong> generation <strong>of</strong> both<br />
anticipatory and preferred scenarios, creating a framework <strong>for</strong> simulating events and strategies<br />
that are likely to produce desired results in <strong>the</strong> future.<br />
↑ Back to <strong>the</strong> top<br />
1 Jay Forrester, Industrial Dynamics. New York: John Wiley & Sons, 1961.<br />
2 Jay Forrester, Principles <strong>of</strong> Systems. Cambridge, Ma: Pegasus Communications, 1990 (1968).<br />
3 Donella Meadows, Jorgen Randers, and Dennis Meadows, Limits to Growth. The 30-Year Update.<br />
White River Junction, VT: Chelsea Green Publishing, 2004.<br />
4 Donella H. Meadows, Thinking in Systems. A Primer. Edited by Diana Wright. White River Junction,<br />
VT: Chelsea Green Publishing, 2008.<br />
5 Peter M. Senge, The Fifth Discipline. The Art & Practice <strong>of</strong> <strong>the</strong> Learning Organization. New York:<br />
Currency Doubleday, 2006 (1990).<br />
6 John G. Stover and Theodore J. Gordon, “Cross-Impact Analysis,” in Jib Fowles, ed., Handbook <strong>of</strong><br />
Futures Research. Westport, CT: Greenwood Press, 1978, pp. 301-328.<br />
7 Harold A. Linstone, The Delphi Method. Techniques and Applications. Reading, MA: Addison-Wesley,<br />
1975.<br />
8 Wendell Bell, Foundations <strong>of</strong> Future Studies. Volume 1, History, Purpose, and Knowledge. 2 vols. New<br />
Brunswick, NJ: Transaction Publishers, 1997, pp. 265-269.<br />
9 The Futures Group, “TIA. Trend Impact Analysis.” Version 5.0. Report 654-01-64R. Glastonbury, CT:<br />
The Futures Group, 1985.<br />
10 William R. Huss and Edward J. Honton, “Scenario Planning – What Style Should You Use?” Long<br />
Range Planning, 20, 1987, pp. 21-29.<br />
11 Theodore Jay Gordon, “Cross-Impact Method.” A publication <strong>of</strong> <strong>the</strong> United Nations Development<br />
Program’s African Futures Project in collaboration with <strong>the</strong> United Nations University’s Millennium<br />
Project Feasibility Study-Phase II (1994). Retrieved on August 20, 1998, from<br />
www.epa.gov/docs/futures/millenni/methodologies/cross-im.txt.htm.<br />
12 Huss and Honton, “Scenario Planning.”<br />
13 A. Duval, E. Fontela and A. Gabus, “Cross-Impact Analysis: A Handbook on Concepts and<br />
Applications” in Maynard M. Baldwin, ed., Portraits <strong>of</strong> Complexity. Applications <strong>of</strong> Systems<br />
Methodologies to Societal Problems. Columbus, OH: Battelle Memorial Institute, 1975, pp. 202-222.<br />
275
14 E. J. Honton, G. S. Stacey, and S. M. Millett, “FUTURE SCENARIOS: <strong>the</strong> BASICS Computational<br />
Method.” Economics and Policy Analysis Occasional Paper Number 44, October 1984 (Revised July<br />
1985)<br />
15 “Interactive Future Simulations (IFS) Theory and Computational Method” (Dec. 2008), retrieved on<br />
August 3, 2009, from www.futuringassociates.com/thoughts.html.<br />
16 Stephen M. Millett, “The future <strong>of</strong> scenarios: challenges and opportunities,” Strategy & Leadership, 31<br />
(2003), pp. 16-24.<br />
17 The IFS method, including <strong>the</strong> internal <strong>for</strong>mulas used <strong>for</strong> calculations, was never held proprietary by<br />
Battelle. Battelle owned <strong>the</strong> intellectual property rights to <strong>the</strong> IFS s<strong>of</strong>tware program and licensed it to<br />
assignees until December 2008, when Battelle sold its intellectual rights to <strong>the</strong> IFS s<strong>of</strong>tware program to<br />
Futuring Association LLC. This example <strong>of</strong> <strong>the</strong> use <strong>of</strong> IFS was per<strong>for</strong>med by <strong>the</strong> author under license<br />
from Battelle. Battelle did not participate in it and assumes no responsibility or liability <strong>for</strong> this case<br />
study.<br />
276
3.10. Development <strong>of</strong> a Framework <strong>for</strong> Action: Community Resiliency as a<br />
Means <strong>of</strong> Achieving Stability (Ame Stormer, Jessica Wambach, Lt Gen<br />
(Ret) John Goodman)<br />
Authors and Organizations: Lt Gen (Ret) John F. Goodman, Ame Stormer, Jessica Wambach,<br />
The Center <strong>for</strong> Excellence in Disaster Management and Humanitarian Assistance<br />
Contact In<strong>for</strong>mation: ame.stormer@coe-dmha.org; Jessica.wambach@coe-dmha.org;<br />
john.goodman@coe-dmha.org<br />
Introduction<br />
The Center <strong>for</strong> Excellence in Disaster Management and Humanitarian Assistance supports <strong>the</strong><br />
United States Geographic Combatant Commands in <strong>the</strong> achievement <strong>of</strong> <strong>the</strong>ir regional enduring<br />
outcomes, such as protecting <strong>the</strong> homeland. This is accomplished by shaping <strong>the</strong> security<br />
continuum through <strong>the</strong> fostering <strong>of</strong> resilient communities and societies in order to enhance<br />
stability. Healthy and vibrant communities that are able to resist disruption, to quickly recover<br />
from disruption and to more rapidly revitalize following natural and man-made disasters are <strong>the</strong><br />
most secure and stable. Stable and vibrant communities are better able to resist extreme<br />
ideologies and are more likely to contribute meaningfully to <strong>the</strong> community <strong>of</strong> nations and to<br />
global society. The Department <strong>of</strong> Defense (DoD) receives significant annual funding <strong>for</strong> <strong>the</strong><br />
conduct <strong>of</strong> humanitarian assistance and civic action projects. However, <strong>the</strong> DoD lacks a common<br />
aim and applied methodology to create synergy and guide <strong>the</strong> application <strong>of</strong> ef<strong>for</strong>ts. By utilizing<br />
<strong>the</strong> concept <strong>of</strong> fostering community and society resiliency, <strong>the</strong> Geographic Combatant<br />
Commands will shape <strong>the</strong> security continuum by directly enhancing community resilience and<br />
stability.<br />
With <strong>the</strong> concept <strong>of</strong> fostering community and society resiliency in mind, earlier this year The<br />
Center identified <strong>the</strong> requirement to (1) determine what makes an individual household,<br />
community, and society resilient be<strong>for</strong>e, during, and after disasters, and (2) to identify or design<br />
a common framework. This ef<strong>for</strong>t would in<strong>for</strong>m <strong>the</strong> DoD’s thoughtful investment in civic action<br />
programs around <strong>the</strong> world as a strategic means <strong>of</strong> protecting our homeland while achieving<br />
regional stability. Such a framework must be general in nature to ensure applicability across <strong>the</strong><br />
vast spectrum <strong>of</strong> communities, yet it must provide sufficient application methodology that<br />
accommodates <strong>the</strong> variation in geography, culture, and socio-economic features among regions.<br />
Background<br />
The Center is <strong>the</strong> principal United States organization that promotes disaster preparedness and<br />
community resiliency. The Center’s mission is to facilitate education and training, to conduct<br />
research, and to assist in international disaster preparedness, disaster mitigation, disaster<br />
management, disaster response, health security, humanitarian assistance and societal resiliency.<br />
The Center’s study team embarked on <strong>the</strong> Fostering Resiliency Project by identifying existing<br />
frameworks or guidelines that would clearly define how to achieve resiliency across <strong>the</strong><br />
spectrum <strong>of</strong> communal and societal functioning. The project team found that <strong>the</strong>re is no single<br />
source <strong>of</strong> in<strong>for</strong>mation that captures a method <strong>of</strong> achieving overall community resiliency in <strong>the</strong><br />
face <strong>of</strong> disaster. Several resources captured tactical means <strong>of</strong> achieving individual aspects <strong>of</strong><br />
277
community preparedness, but no document or available framework described mechanisms across<br />
<strong>the</strong> range <strong>of</strong> community functioning to <strong>the</strong> level <strong>of</strong> specificity required by <strong>the</strong> DoD. The Hyogo<br />
Framework <strong>for</strong> Action, <strong>the</strong> U.S. State Department’s Post-Conflict Reconstruction Essential<br />
Tasks, and <strong>the</strong> United Kingdom Department <strong>for</strong> International Development’s Characteristics <strong>of</strong> a<br />
Disaster-resilient Community served as <strong>the</strong> starting points <strong>for</strong> The Center’s ef<strong>for</strong>ts to construct<br />
<strong>the</strong> necessary framework beginning at <strong>the</strong> community level. 1<br />
Process<br />
Syn<strong>the</strong>sizing <strong>the</strong> extensive in<strong>for</strong>mation available on what constitutes resiliency, <strong>the</strong> project team<br />
divided community functioning into five categories to create <strong>the</strong> pillars <strong>of</strong> <strong>the</strong> framework <strong>of</strong> a<br />
resilient community:<br />
Enhance Social Capacity – In order to adequately confront <strong>the</strong> challenges posed by<br />
disasters, a community must have a developed public health system, diverse<br />
infrastructure, humanitarian assistance capabilities, and robust disaster preparation.<br />
Streng<strong>the</strong>n Knowledge Assets – An equitable education system, hardened<br />
communication and in<strong>for</strong>mation exchange mechanisms, and an inviting environment <strong>for</strong><br />
research and innovation are critical to developing <strong>the</strong> intellectual capital to ensure<br />
resilience.<br />
Enable Resource Independence – A robust economy and established sustainable<br />
development and resource management practices enable a community to withstand and<br />
recover from <strong>the</strong> financial and environmental threats <strong>of</strong> disasters.<br />
Create Community Cohesion – A community that shares some common values and<br />
objectives while respecting diversity and striving <strong>for</strong> social parity can thwart disasters or<br />
come toge<strong>the</strong>r to successfully rebuild in <strong>the</strong> aftermath.<br />
Foster Good Governance – A resilient community requires accountable leadership, just<br />
legal and regulatory codes, appropriate security and social protection mechanisms, and<br />
<strong>the</strong> ability to assess its risks.<br />
278
Resilient Community Framework<br />
Enhance Social<br />
Capacity<br />
Streng<strong>the</strong>n<br />
Knowledge<br />
Assets<br />
Enable<br />
Resource<br />
Independence<br />
Create<br />
Community<br />
Cohesion<br />
Foster Good<br />
Governance<br />
Humanitarian<br />
Assistance<br />
Education<br />
Economy<br />
Cultures, Attitudes<br />
& Motivations<br />
Leadership<br />
Public Health<br />
Communication<br />
& In<strong>for</strong>mation<br />
Sustainable<br />
Development<br />
Social Parity<br />
Security<br />
Strategic Outcomes<br />
Enhance<br />
Societal Safety &<br />
Durability<br />
Foster Individual<br />
Social<br />
Responsibility<br />
Nurture Strong<br />
& Stable<br />
Families<br />
Respect Human<br />
Dignity<br />
Empower and<br />
Inspire Youth<br />
Figure 3.10-1. Resilient Community Framework.<br />
Following this step, <strong>the</strong> project team listed <strong>the</strong> components that comprised each pillar and<br />
mapped <strong>the</strong>m across three broad phases <strong>of</strong> Resistance, Recovery, and Revitalization creating a<br />
matrix listing <strong>the</strong> requirements necessary to achieve resilient community functioning within <strong>the</strong><br />
continuum.<br />
Once <strong>the</strong> pillars and <strong>the</strong> components were established, <strong>the</strong>y were plotted against <strong>the</strong> x-axis that<br />
contained <strong>the</strong> three phases <strong>of</strong> community and societal resiliency: Resistance, Recovery, and<br />
Revitalization. In <strong>the</strong> first phase <strong>of</strong> The Center’s model, Resistance, <strong>the</strong> community predicts and<br />
anticipates <strong>the</strong> most likely destructive events and identifies <strong>the</strong> desired level <strong>of</strong> community<br />
functioning when <strong>the</strong> destructive event occurs. In <strong>the</strong> second phase, Recovery, <strong>the</strong> intent is to<br />
allow <strong>the</strong> community to absorb <strong>the</strong> shock <strong>of</strong> impact with <strong>the</strong> goal <strong>of</strong> minimizing <strong>the</strong> disruption in<br />
community functioning allowing <strong>for</strong> rapid response and quick transition to recovery. In<br />
Revitalization, <strong>the</strong> final phase, <strong>the</strong> community is postured to capitalize on <strong>the</strong> opportunity to<br />
improvise and innovate to enhance community functioning. 2<br />
279
Societal and Community Resiliency:<br />
Characteristics <strong>of</strong> Success<br />
Resistance<br />
Recovery<br />
Revitalization<br />
Predict<br />
Absorb<br />
Improvise<br />
Anticipate<br />
Recover<br />
Innovate<br />
“Revive, not just Restore.”<br />
Level <strong>of</strong><br />
functioning<br />
Goal<br />
Level <strong>of</strong><br />
functioning<br />
Goal<br />
Level <strong>of</strong><br />
functioning<br />
threshold<br />
Time<br />
Time<br />
Time<br />
Figure 3.10-2. Societal and Community Resiliency: Characteristics <strong>of</strong> Success<br />
Outcomes<br />
Populating <strong>the</strong> requirements within <strong>the</strong> matrix demanded weeks <strong>of</strong> extensive research and<br />
internal review. The Center’s project team scoured existing frameworks and hundreds <strong>of</strong> <strong>the</strong><br />
available sources on resilience. Documents such as <strong>the</strong> Millennium Villages Handbook,<br />
published by a partnership led by The Earth Institute at Columbia University, were essential in<br />
developing <strong>the</strong> content. 3 The Center’s strategic partnerships with <strong>the</strong> Defense Advanced<br />
Research Projects Agency (DARPA), <strong>the</strong> U.S. Army Corps <strong>of</strong> Engineers (USACE), Micros<strong>of</strong>t,<br />
and o<strong>the</strong>r organizations were consulted. Representatives <strong>of</strong> those and o<strong>the</strong>r organizations<br />
attended a workshop in San Diego, Cali<strong>for</strong>nia, conducted in <strong>the</strong> summer <strong>of</strong> 2009 by The Center.<br />
Experts in areas across <strong>the</strong> five pillars provided feedback and validated <strong>the</strong> content <strong>of</strong> <strong>the</strong> matrix,<br />
resulting in enhancement <strong>of</strong> <strong>the</strong> framework. The workshop drew <strong>the</strong> attention <strong>of</strong> additional<br />
United States government agencies and o<strong>the</strong>r key stakeholders in <strong>the</strong> international development<br />
community. The feedback The Center has received confirms <strong>the</strong> assertion that <strong>the</strong>re is a<br />
significant need in both <strong>the</strong> domestic and <strong>the</strong> international disaster preparedness arenas <strong>for</strong> a<br />
comprehensive resiliency framework to guide disaster recovery, as well as international<br />
development ef<strong>for</strong>ts.<br />
Next Steps<br />
As a result <strong>of</strong> <strong>the</strong> San Diego workshop and through additional review and revision <strong>of</strong> <strong>the</strong> original<br />
matrix, several follow-on steps have been determined <strong>for</strong> <strong>the</strong> Fostering Resiliency Project. The<br />
first is <strong>the</strong> development <strong>of</strong> a separate response framework to complete <strong>the</strong> spectrum <strong>of</strong> phases<br />
from disaster prevention through revitalization. Response was not included in <strong>the</strong> original<br />
framework, as <strong>the</strong> requirements <strong>for</strong> this phase are in many ways distinct from <strong>the</strong> long-term<br />
prevention and recovery phases from a disaster. The matrix that divides response into several<br />
sub-phases is currently under development at The Center.<br />
280
Second, The Center is also initiating <strong>the</strong> development a societal resiliency framework that<br />
outlines <strong>the</strong> components and requirements <strong>for</strong> regional or national resiliency. The linkages<br />
between <strong>the</strong> community and society frameworks will be highlighted to emphasize <strong>the</strong><br />
interconnections within development at both levels and ensure planners cross-walk community<br />
level ef<strong>for</strong>ts with societal ef<strong>for</strong>ts to ensure policy agreement with desired functioning.<br />
Third, <strong>the</strong> Resiliency Project will identify sequencing and prioritization <strong>of</strong> ef<strong>for</strong>ts <strong>for</strong> <strong>the</strong><br />
planning, implementation, and assessment processes. Sequencing provides <strong>the</strong> order in which<br />
activities could be conducted to optimize recovery and development <strong>for</strong> governmental and<br />
program planners and decision-makers.<br />
These three steps will result in <strong>the</strong> creation <strong>of</strong> a “how-to” guide <strong>for</strong> Geographic Combatant<br />
Commands and o<strong>the</strong>r USG users which will provide guidance on <strong>the</strong> activities and <strong>the</strong> timing <strong>of</strong><br />
activities <strong>for</strong> investment in civic action and humanitarian assistance ef<strong>for</strong>ts. When combined<br />
with a Common Operational Picture, <strong>the</strong> guide will assist <strong>the</strong> DoD to better support<br />
Humanitarian Assistance and Disaster Management planning, implementation and assessment<br />
activities.<br />
Host Nation<br />
DOD<br />
Do No Harm<br />
Host Nation<br />
Coordination Mechanism<br />
DOD<br />
Coordination<br />
Mechanism<br />
Resilient<br />
Community<br />
Framework<br />
O<strong>the</strong>r USG<br />
and<br />
International<br />
Agencies<br />
Messages &<br />
Outcomes<br />
Figure 3.10-3. Coordination Mechanisms.<br />
Conclusions<br />
While a variety <strong>of</strong> existing frameworks and sources have identified some elements <strong>of</strong> resiliency,<br />
none have comprehensively addressed <strong>the</strong> community and societal requirements and created an<br />
actionable methodology to support functioning, development, recovery, and revitalization. The<br />
Center is creating this framework as a means to support DoD initiatives in humanitarian<br />
assistance, civic action, and disaster response mission areas. This framework provides <strong>the</strong><br />
solutions and sequencing <strong>of</strong> ef<strong>for</strong>ts in disaster mitigation and management investments. By<br />
fostering resiliency in communities and societies, <strong>the</strong> application <strong>of</strong> <strong>the</strong> framework will enhance<br />
regional stability, will promote <strong>the</strong> United States’ long-term interests, and will achieve <strong>the</strong><br />
desired enduring strategic outcomes to protect our homeland.<br />
↑ Back to <strong>the</strong> top<br />
281
1 World Conference on Disaster Risk Reduction. (2005). Hyogo Framework <strong>for</strong> Action 2005-2015.<br />
United States Department <strong>of</strong> State. (2005). Post-Conflict Reconstruction Essential Tasks.<br />
2 Maguire, B., Hagan, P. (2007) “Disasters and communities: understanding social resilience.”<br />
Australian Journal <strong>of</strong> Emergency Management. Vol. 22, No. 2. P.16-20.<br />
3 The Earth Institute at Columbia University. (2008). Millennium Villages Handbook: A Practitioner’s<br />
Guide to <strong>the</strong> Millennium Villages Approach.<br />
282
4. Case Studies<br />
4.1. Sudan Strategic Assessment: A Case Study <strong>of</strong> Social Science Modeling<br />
(Robert Popp)<br />
Author and Organization: Robert Popp, PhD; NSI, Inc.<br />
Contact In<strong>for</strong>mation: rpopp@NSIteam.com; 781.864.1347<br />
Background<br />
The Sudan Strategic Assessment Project was a 180-day ef<strong>for</strong>t (January – June 2007) conducted<br />
<strong>for</strong> USCENTCOM and funded by <strong>the</strong> USTRATCOM GISC and OSD DDR&E as part <strong>of</strong> <strong>the</strong><br />
Strategic Multilayer Analysis (SMA) project. This was a strategic level pro<strong>of</strong>-<strong>of</strong>-concept study in<br />
which a combination <strong>of</strong> quantitative and computational social science modeling and analysis<br />
approaches were developed and applied to better understand a complex “state” lacking true<br />
borders and encompassing many competing interests and complexities (e.g., corruption in <strong>the</strong><br />
government, desertification, ethnic and religious disputes, border clashes, genocide, starvation,<br />
HIV/AIDs, etc). The focus <strong>of</strong> <strong>the</strong> ef<strong>for</strong>t was to emphasize an evidence-based, empirically-driven<br />
approach that would develop recommendation that span <strong>the</strong> spectrum <strong>of</strong> <strong>the</strong> instruments <strong>of</strong><br />
national power.<br />
Overall Project Objectives<br />
The primary operational objectives <strong>for</strong> this project, as defined by USCENTCOM, were to<br />
develop actionable recommendations to (1) reduce human suffering, (2) promote regional peace<br />
and stability, and (3) deny safe haven <strong>for</strong> international terrorists and criminals, based on applying<br />
multiple evidence-based, empirically driven quantitative and computational social science<br />
modeling and analysis approaches. The project was also to recommend a set <strong>of</strong> actionable<br />
diplomatic, in<strong>for</strong>mation, military, and economic (DIME) actions to USCENTCOM in support <strong>of</strong><br />
<strong>the</strong>ir operational and strategic objectives. The project was also to develop a repeatable process<br />
<strong>for</strong> conducting such assessments.<br />
Team<br />
This project assembled a significant team including over 80 different people actively engaged in<br />
Sudan ef<strong>for</strong>ts across 27 different organizations (see Figure 4.1-1).<br />
283
Figure 4.1-1. The Multi-organizational, Multidisciplinary Project Team.<br />
Assessment and Analysis Process<br />
Figure 4.1-2 illustrates <strong>the</strong> overall assessment and analysis process developed <strong>for</strong> <strong>the</strong> Sudan<br />
Strategic Assessment project. The process started with a set <strong>of</strong> specific operational objectives<br />
that framed <strong>the</strong> problem, as defined by USCENTCOM. A variety <strong>of</strong> relevant data were collected,<br />
and knowledge and expertise from a group <strong>of</strong> subject matter experts (SMEs) on Sudanese<br />
matters was elicited. A suite <strong>of</strong> multi-level (micro-to-macro) quantitative/computational social<br />
science models was developed based on <strong>the</strong> three operational objectives (i.e., to reduce human<br />
suffering, promote regional peace and stability, and deny safe haven <strong>for</strong> international terrorists<br />
and criminals). The three operational objectives were <strong>the</strong>n decomposed into seven separate<br />
hypo<strong>the</strong>ses to which <strong>the</strong> suite <strong>of</strong> models was <strong>the</strong>n applied to produce a set <strong>of</strong> high-level<br />
assessments and <strong>for</strong>ecasts.<br />
Figure 4.1-2. The Overall Project Assessment and Analysis Process.<br />
These seven hypo<strong>the</strong>ses considered were as follows:<br />
1. The government <strong>of</strong> Sudan (GoS) is in collusion with <strong>the</strong> Janjaweed, causing turmoil.<br />
2. Natural resources are not evenly distributed within Sudan, causing turmoil.<br />
284
3. The GoS is perceived as legitimate by its people.<br />
4. Ecological problems are a root cause <strong>of</strong> <strong>the</strong> turmoil in Sudan.<br />
5. Cultural and ethnic intolerance is a root cause <strong>of</strong> <strong>the</strong> turmoil in Sudan.<br />
6. The Sudanese people support partitioning <strong>of</strong> <strong>the</strong> Sudan.<br />
7. Forces from outside countries are influencing Sudan.<br />
Once <strong>the</strong> above hypo<strong>the</strong>ses were assessed by <strong>the</strong> models, <strong>for</strong>ecasts emerged which were <strong>the</strong>n<br />
converted into seventeen DIME actions. These DIME actions were integrated and assessed<br />
within <strong>the</strong> overall analytical process (feedback loop), engaging <strong>the</strong> models and SMEs and<br />
consulting additional data and expertise as needed. These DIME actions were as follows:<br />
1. Deploy a UN-led multinational protection <strong>for</strong>ce to take over from <strong>the</strong> under- resourced<br />
AMIS.<br />
2. Deploy a hybrid UN-AU multinational protection <strong>for</strong>ce to take over from <strong>the</strong> underresourced<br />
AMIS.<br />
3. Deploy a US-led protection <strong>for</strong>ce to take over from <strong>the</strong> under-resourced AMIS.<br />
4. Influence debt assistance provided to Sudan by international financial institutions to be<br />
dependent on <strong>the</strong> GoS ceasing atrocities.<br />
5. Encourage a major divestment campaign targeting companies that are complicit in <strong>the</strong><br />
genocide in Darfur.<br />
6. En<strong>for</strong>ce and enhance a set <strong>of</strong> targeted economic sanctions.<br />
7. Provide economic assistance to Sou<strong>the</strong>rn Sudan specifically <strong>for</strong> infrastructure<br />
development and investment in human capital.<br />
8. Pressure <strong>the</strong> North to more equitably share resources and wealth with <strong>the</strong> South (i.e.,<br />
en<strong>for</strong>cing <strong>the</strong> CPA).<br />
9. Do nothing.<br />
10. Support a coup whereby <strong>the</strong> GoS is taken over by African-centric vs. Islamic-centric<br />
leaders.<br />
11. Pay <strong>the</strong> GoS to stop <strong>the</strong> humanitarian crises in Sudan.<br />
12. Institute programs in <strong>the</strong> HOA that streng<strong>the</strong>n and stabilize <strong>the</strong> area surrounding Sudan.<br />
13. Actively remove key GoS/Janjaweed personnel that play a role in <strong>the</strong> violence in Sudan.<br />
14. Unite Darfur rebel groups to develop unity militarily, collective bargaining,<br />
diplomatically, and economically.<br />
15. Lift US and western sanctions against <strong>the</strong> GoS, enabling market <strong>for</strong>ces to modify<br />
behavior and to provide an influx <strong>of</strong> Western human rights values to <strong>the</strong> region.<br />
16. Engage GCC countries to politically influence <strong>the</strong> GoS to take responsibility <strong>for</strong> <strong>the</strong><br />
humanitarian crises within its borders.<br />
17. En<strong>for</strong>ce <strong>the</strong> 2005 UN Security Council Resolution demanding that <strong>the</strong> GoS cease<br />
<strong>of</strong>fensive military flights by establishing a "no fly zone.”<br />
Social Science Models<br />
Table 4.1-1 provides a brief summary <strong>of</strong> <strong>the</strong> various social science models utilized in this<br />
project. These models were selected based on <strong>the</strong>ir relevance to one or more <strong>of</strong> <strong>the</strong> three<br />
operational objectives as well as <strong>the</strong>ir availability <strong>for</strong> this project given <strong>the</strong> aggressive timeline.<br />
For more details on each <strong>of</strong> <strong>the</strong>se models, two compendium documents should be consulted 1 .<br />
285
Table 4.1-1. Summary Social Science Models Developed <strong>for</strong> This Project.<br />
Model Model type Model Class Model Metric Defining Characteristics<br />
Model #1<br />
(regional/<br />
national)<br />
Keyword-based<br />
text filter and<br />
categorizer<br />
Qualitative Political,<br />
economic, social<br />
indicator trends time<br />
Model #2<br />
(national)<br />
Model #3<br />
(national/<br />
sub-national)<br />
Model #4<br />
(national/<br />
sub-national)<br />
Model #5<br />
(sub-national/<br />
group)<br />
Model #6<br />
(group/<br />
individual)<br />
Model #7<br />
(group/<br />
individual)<br />
Model #8<br />
(group/<br />
individual)<br />
Economic (logit<br />
regressive)<br />
model<br />
Regressive<br />
dynamic system<br />
<strong>of</strong> equations<br />
Dynamic system<br />
<strong>of</strong> eqs; Agentbased<br />
model<br />
State stability<br />
system dynamics<br />
model<br />
Socio-cultural<br />
agent simulation<br />
model<br />
POMDP agent<br />
simulation model<br />
Game and<br />
decision <strong>the</strong>ory<br />
model<br />
Quantitative<br />
Quantitative<br />
Computational<br />
Computational<br />
Quantitative;<br />
Computational<br />
Quantitative;<br />
Computational<br />
Quantitative;<br />
Computational<br />
Probability civil<br />
war<br />
Relative political<br />
capacity (RPC)<br />
Likelihood <strong>of</strong><br />
conflict and<br />
conflict intensity<br />
Violent dissident<br />
level and antiregime<br />
acts<br />
Individual/group<br />
social identities,<br />
attitudes<br />
Individual/group<br />
actions, believes<br />
and behaviors<br />
Individual/group<br />
position and<br />
support <strong>for</strong> issues<br />
Sets indicators <strong>for</strong> Sudan hypo<strong>the</strong>ses,<br />
scores and graphs trends in text over<br />
Model focuses on greed (opportunistic)<br />
and grievance (rebellion) hypo<strong>the</strong>ses<br />
Politico-economic macro-structural<br />
model at regional and (sub)national<br />
levels<br />
Simulates structural preconditions <strong>of</strong><br />
interstate conflict residing in notions <strong>of</strong><br />
power and policy dissatisfaction<br />
Nonlinear dynamics; feedback loops,<br />
state capacities and loads, tipping point<br />
5 th order system; >140 Eqs, >100 loops<br />
Simulate effect that events have on<br />
group opinions, attitudes, identities<br />
Models interactions and influence<br />
among and between different<br />
groups/individuals<br />
Simulate stakeholder and decisionmaker<br />
influence, relationships and<br />
negotiations<br />
Key Findings<br />
Figure 4.1-3 provides a summary <strong>of</strong> <strong>the</strong> key findings <strong>of</strong> <strong>the</strong> various modeling and analyses<br />
ef<strong>for</strong>ts. While some <strong>of</strong> <strong>the</strong> findings may appear to contradict one ano<strong>the</strong>r, note that each<br />
operational objective was modeled and analyzed using a different mix <strong>of</strong> approaches at different<br />
levels <strong>of</strong> analysis (regional/national, sub-national/group, group/individual). Because <strong>of</strong> this<br />
approach, findings and recommendations <strong>for</strong> one operational objective may not necessarily be<br />
<strong>the</strong> findings and recommendations to address ano<strong>the</strong>r objective.<br />
With respect to <strong>the</strong> seven different hypo<strong>the</strong>ses (listed above), <strong>the</strong> models and <strong>the</strong> analyses mostly<br />
agreed that <strong>the</strong> GoS is in collusion with <strong>the</strong> Janjaweed and that natural resources are not evenly<br />
distributed and are <strong>the</strong>re<strong>for</strong>e a root cause <strong>of</strong> <strong>the</strong> problem observed by <strong>the</strong> international<br />
community. The findings are mixed with regard to <strong>the</strong> GoS being considered legitimate by its<br />
peoples. Some models found <strong>the</strong> government to possess legitimacy but little to no capacity, while<br />
o<strong>the</strong>rs found <strong>the</strong> government to be illegitimate. There are a number <strong>of</strong> reasons <strong>for</strong> <strong>the</strong>se<br />
conflicting findings. One is that <strong>the</strong>y may very well depend on <strong>the</strong> location <strong>of</strong> <strong>the</strong> peoples and<br />
whe<strong>the</strong>r <strong>the</strong>y believe <strong>the</strong> GoS to be legitimate. Sou<strong>the</strong>rn and western Sudanese may have a very<br />
different view than Sudanese from <strong>the</strong> North and East. Also, <strong>the</strong>re was some confusion in <strong>the</strong><br />
study as to what <strong>the</strong> term “legitimate” meant with regard to a government. While this was<br />
addressed at <strong>the</strong> first Summit, <strong>the</strong>re may have been remnants <strong>of</strong> ambiguity.<br />
286
Figure 4.1-3: A summary <strong>of</strong> <strong>the</strong> key findings <strong>for</strong> <strong>the</strong> project.<br />
The hypo<strong>the</strong>sis that ecological problems are a cause <strong>of</strong> unrest in Sudan was generally not<br />
supported by <strong>the</strong> analyses, but ra<strong>the</strong>r it appeared that <strong>the</strong> ecological problems were more a<br />
symptom <strong>of</strong> <strong>the</strong> instability and humanitarian crises. While <strong>the</strong>re was not much disagreement that<br />
cultural and ethnic intolerance is a problem in Sudan, intolerance was not considered to be a<br />
cause but ra<strong>the</strong>r a symptom. Surprisingly, <strong>the</strong> hypo<strong>the</strong>sis that <strong>the</strong> Sudanese people support<br />
partition was disconfirmed by most <strong>of</strong> <strong>the</strong> models. Based on some <strong>of</strong> <strong>the</strong> interviews and SME<br />
input, it is perhaps more likely that this may be viewed by many in Sudan as <strong>the</strong> only way to<br />
solve <strong>the</strong> current problems in <strong>the</strong> country as opposed to being a desirable option. Lastly, <strong>the</strong><br />
hypo<strong>the</strong>sis that <strong>for</strong>ces outside <strong>the</strong> country <strong>of</strong> Sudan (China, Egypt, and o<strong>the</strong>rs) are influencing<br />
Sudan was not confirmed by <strong>the</strong> models, SMEs, or analyses. Although it was found that any<br />
action that is taken in <strong>the</strong> region (e.g., a protection <strong>for</strong>ce) should consider <strong>the</strong> dominant actor,<br />
Egypt in this case, as a participant.<br />
Conclusions<br />
The Sudan Strategic Assessment “pro<strong>of</strong> <strong>of</strong> concept” project demonstrated how multiple<br />
quantitative and computational social science models, in conjunction with SMEs and o<strong>the</strong>r<br />
analyses, are an effective, evolutionary step in <strong>the</strong> analyst toolkit, especially when <strong>the</strong> need is to<br />
provide additional lenses to look at highly complex and ambiguous problems (like <strong>the</strong> Sudan) to<br />
in<strong>for</strong>m <strong>the</strong> decision-making process. The project also demonstrated <strong>the</strong> dangers <strong>of</strong> expecting “pin<br />
point predictions” from models <strong>for</strong> problems such as <strong>the</strong> Sudan. Instead, <strong>the</strong>se models sought to<br />
move <strong>the</strong> decision maker fur<strong>the</strong>r from unaided intuition, which is <strong>of</strong>tentimes <strong>the</strong> norm. Lastly,<br />
this project showed <strong>the</strong> critical need <strong>for</strong> (1) an inter-agency assessment group, (2) reach-back<br />
capability to a cadre <strong>of</strong> social science experts and domain SMEs not readily available in <strong>the</strong> US<br />
government, and (3) <strong>the</strong> need to manage in<strong>for</strong>mation and experts at multiple classification levels.<br />
↑ Back to <strong>the</strong> top<br />
287
1 U Sudan Strategic Assessment TTPs.doc; U Sudan Strategic Assessment Key Findings.doc<br />
288
4.2. Analyzing Stability Challenges in Africa: Case Study <strong>of</strong> an Approach<br />
(Tom Mullen)<br />
Author and Organiztion: Tom Mullen, PA Consulting Group<br />
Contact In<strong>for</strong>mation: tom.mullen@paconsulting.com<br />
“Afghanistan is not Iraq.” This phrase is being used with increasing frequency and urgency in<br />
briefing rooms in <strong>the</strong> Pentagon, in Theater as a greeting to newcomers, and almost every place in<br />
between. The phrase is used to counter <strong>the</strong> classic human tendency to over-generalize, to take<br />
lessons learned in one context and rush to apply <strong>the</strong>m in very different circumstances. In some<br />
cases, <strong>the</strong> lessons still hold up very well, while in o<strong>the</strong>r cases <strong>the</strong>y can have mixed results, but in<br />
o<strong>the</strong>rs <strong>the</strong> application <strong>of</strong> <strong>the</strong>se ”lessons” actually may have dangerous unintended consequences<br />
when applied in a different setting. Assessing <strong>the</strong> specific context <strong>of</strong> a new situation and<br />
understanding <strong>the</strong> reasons why particular lessons worked well is important to avoid unintended<br />
consequences, ra<strong>the</strong>r than reflexively applying lessons that worked in one setting to every<br />
situation. Time pressure naturally limits <strong>the</strong> amount <strong>of</strong> analysis that can be done be<strong>for</strong>e decisions<br />
need to be made and actions taken, but even a rapid, high-level assessment be<strong>for</strong>e acting can pay<br />
tremendous dividends, especially in <strong>the</strong> relatively new and uncharted terrain <strong>of</strong> stability.<br />
With resources spread thin and contingencies likely to continue, better methods are needed to<br />
rapidly understand key issues in each new situation and to better understand why particular<br />
actions worked (and why o<strong>the</strong>rs did not). Better methods are also needed to aid in determining<br />
where and how those lessons might be more likely to work well. Continual improvement is<br />
needed in our ability to assess highly complex situations quickly and to improve our ability to<br />
take rapid, effective action. This case study attempts to provide a few lessons drawn from<br />
analyzing a number <strong>of</strong> stability situations on <strong>the</strong> continent <strong>of</strong> Africa over <strong>the</strong> past 3 years. The<br />
focus <strong>of</strong> this paper is on lessons in analyzing complex stability situations ra<strong>the</strong>r than on specific<br />
actions to apply in a wide range <strong>of</strong> situations. Broadly applicable lessons <strong>for</strong> stability remain a<br />
work in progress, though certainly <strong>the</strong>re is a growing understanding <strong>of</strong> <strong>the</strong> reasons why some<br />
actions have helped, which aids in determining where <strong>the</strong>y can best be re-applied.<br />
Background – Four Different Situations and Questions<br />
While various approaches have been used to analyze stability situations in regional hotspots<br />
around <strong>the</strong> world, this paper focuses on four different African stability situations examined in a<br />
3-year period, in which a systems approach was refined <strong>for</strong> application to stability analysis. The<br />
regions covered include <strong>the</strong> Horn <strong>of</strong> Africa, Mozambique (retrospective study 1 ), and two<br />
overlapping regions examined <strong>for</strong> different confidential purposes. While <strong>the</strong>re are many similar<br />
conditions across <strong>the</strong> four situations (e.g., all had unstable governments, at least a moderate<br />
degree <strong>of</strong> corruption, low GDP per capita, a poorly developed industrial base, and multiple<br />
factions vying <strong>for</strong> power), <strong>the</strong>re are important variations (e.g., degree <strong>of</strong> religious tension,<br />
primary drivers <strong>of</strong> conflict, amount <strong>of</strong> high value natural resources). The questions being<br />
examined in <strong>the</strong> regions also had similarities (which potential military and non-military actions<br />
would have greatest positive effect on long-term stability) and differences (e.g., some had a<br />
greater focus on military action than o<strong>the</strong>rs, and <strong>the</strong> US/coalition presence and involvement<br />
varied widely).<br />
289
Approach – Analyzing a Region as a System<br />
The approach <strong>for</strong> <strong>the</strong>se studies was adapted from an approach (PA’s Strategic Issue Analysis<br />
methodology) that has been used <strong>for</strong> decades to analyze corporate strategy issues (e.g., strategies<br />
to raise pr<strong>of</strong>itability, enter new markets, adapt to regulatory changes), and a few applications to<br />
government strategic issues (e.g., trans<strong>for</strong>mation <strong>of</strong> a major government organization, strategic<br />
planning, privatization <strong>of</strong> a European transport system). Using this approach, researchers worked<br />
with DoD to examine <strong>the</strong> challenges <strong>of</strong> counter-insurgency, and <strong>the</strong>n broadened with <strong>the</strong>se four<br />
studies to examine <strong>the</strong> larger issues <strong>of</strong> country and regional stability: how to help an unstable<br />
region move towards durable stability without <strong>the</strong> many unintended negative side-effects or<br />
resistance to change that so <strong>of</strong>ten result from ef<strong>for</strong>ts to improve stability. The goal <strong>of</strong> this<br />
approach is not only to identify effective actions, but also to understand why and how <strong>the</strong>se<br />
actions aid in learning and decision-making <strong>for</strong> o<strong>the</strong>r situations.<br />
The systems approach developed and used <strong>for</strong> <strong>the</strong>se studies has seven major steps:<br />
1. Background research with a wide range <strong>of</strong> overlapping sources.<br />
Critical to this step is to consult a wide range <strong>of</strong> sources from many different perspectives<br />
(e.g., non-military as well as military, indigenous sources, experienced on-<strong>the</strong>-ground<br />
operators, experts in particular domains such as cultural studies and social science, and<br />
o<strong>the</strong>rs who have spent significant time in <strong>the</strong> area), with many types <strong>of</strong> in<strong>for</strong>mation (e.g.,<br />
papers and studies, press reports, structured interviews, unstructured interviews,<br />
quantitative data), and over a broad period <strong>of</strong> time (e.g., historical as well as current).<br />
When searching this broadly with overlapping sources, many areas <strong>of</strong> agreement <strong>of</strong>ten<br />
result, but some key areas <strong>of</strong> disagreement must be sorted through. During <strong>the</strong> research, a<br />
hypo<strong>the</strong>sis is developed <strong>of</strong> <strong>the</strong> key drivers and inter-relationships.<br />
2. Identify key players and relevant ‘boundary’ <strong>of</strong> system.<br />
During <strong>the</strong> research, key players are identified who are ei<strong>the</strong>r currently strong actors or<br />
relevant parties or could play key roles in <strong>the</strong> future. These groups are maintained as<br />
aggregated as possible (e.g., large groups instead <strong>of</strong> small groups or individuals). The<br />
challenge is to keep <strong>the</strong> view as simple as possible without oversimplifying to <strong>the</strong> point<br />
<strong>of</strong> gross distortion. Similarly, in establishing <strong>the</strong> relevant boundary <strong>of</strong> <strong>the</strong> region <strong>for</strong><br />
analysis, it helps to define as small a view as possible <strong>for</strong> <strong>the</strong> issue at hand without<br />
omitting critical factors (e.g., not <strong>the</strong> whole world or continent, but usually more than a<br />
single nation or a region in a nation). There is a lot <strong>of</strong> judgment to such determinations,<br />
and <strong>the</strong> best approach is to (1) conduct thorough, broad research, (2) have several<br />
experienced analysts provide input on <strong>the</strong> trade<strong>of</strong>fs, (3) review <strong>the</strong> logic with o<strong>the</strong>rs, and<br />
(4) be prepared to revise iteratively.<br />
3. Map <strong>the</strong> high-level interconnections.<br />
The systems approach used <strong>for</strong> this research builds on <strong>the</strong> System Dynamics method.<br />
Mapping high-level interconnections involves establishing <strong>the</strong> key links between<br />
different actors and conditions (e.g., influence <strong>of</strong> insurgent factions on security<br />
conditions). Hypo<strong>the</strong>ses about key connections emerge during <strong>the</strong> first stage <strong>of</strong><br />
background research and as a result <strong>of</strong> reviewing and comparing analyses <strong>of</strong> o<strong>the</strong>r<br />
regions. This step is particularly expert-intensive, balancing art and science, and also<br />
establishing and testing causal hypo<strong>the</strong>ses iteratively to develop a causal map. An<br />
example <strong>of</strong> a resulting high-level causal map is shown below as Figure 4.2-1. In many<br />
290
cases, <strong>the</strong> causal map has been a useful tool <strong>for</strong> facilitating discussion with o<strong>the</strong>r analysts<br />
and decision-makers. 2<br />
Perceived HN<br />
Gov’t Ideology<br />
HN Physical Environment<br />
& Legitimacy<br />
• HN Size and Border Length<br />
Local<br />
• Terrain Complexity & Features<br />
(north / south regions)<br />
HN Gov’t (FRELIMO)<br />
Central<br />
• Arable Land and Wea<strong>the</strong>r<br />
O<strong>the</strong>r Foreign Aid<br />
Develop /<br />
• Ideological Stance<br />
• Natural Resources<br />
Rein<strong>for</strong>ce HNSF<br />
Outside Aid<br />
NGO’s<br />
• Alignment with Civilian Values<br />
Perceived Security<br />
• Transparency/Corruption<br />
Famine/ Disaster Relief Aid<br />
• Institutional Capacity<br />
Natural<br />
Insurgent<br />
Develop /<br />
• Communications (Diplomatic<br />
Resource<br />
Ability to<br />
Development Funding<br />
Attacks on HN<br />
Improve HN<br />
Evade<br />
Effectiveness & Local Message)<br />
& Wea<strong>the</strong>r<br />
Gov’t & Allies<br />
Gov’t<br />
Impact<br />
Military<br />
Policy<br />
Develop<br />
Economic &<br />
Infrastructure &<br />
Social Policy<br />
Economy<br />
Impact Social Policy<br />
Impact<br />
HN Security Forces (FAM)<br />
IMF<br />
• Leadership, Corruption & Morale<br />
UN<br />
• Resource & Manpower Levels<br />
HN Infr, Economy, & Services<br />
Western<br />
• Skills, Capability & Learning<br />
USSR/Eastern Bloc<br />
• Aid Dependence vs. Self Sufficiency<br />
• Strategy & Tactics / Use <strong>of</strong> Force<br />
• Work<strong>for</strong>ce (Skilled / Unskilled) Avail<br />
Tanzania<br />
• Ability to Locate Insurgents<br />
• GDP & PPP per Capita<br />
Zimbabwe<br />
•Wealth Distribution<br />
Outside Support <strong>for</strong> HN Gov’t<br />
• Transport, SWET, Healthcare<br />
• Political Alignment w/ HN Gov’t<br />
Recruits &<br />
Provide Goods<br />
• Economic & Social Interconnectedness<br />
Material Support<br />
Policing &<br />
• Intervention Resources & Capability<br />
& Services<br />
Labor Force<br />
Security Ops<br />
• Local Knowledge <strong>of</strong> HN<br />
• Homeland Support <strong>for</strong> Intervention<br />
Humanitarian<br />
• Strategic Emphasis & Tactics<br />
Need<br />
HN Civilians<br />
Attacks / Kinetic<br />
Exploitation &<br />
• Perceived Security<br />
COIN Ops<br />
Recruitment<br />
• Ability to Meet Basic Needs<br />
• Adherence to Traditional Beliefs<br />
Western/Capitalist<br />
(Tribal Chiefs & Spirit Mediums)<br />
Rhodesia<br />
• Education Levels & Employment<br />
Recruits &<br />
S. Africa • War Weariness<br />
Material<br />
Former Portuguese Supporters<br />
• Forced Relocation and Refugees<br />
Outside Support <strong>for</strong> Insurgents<br />
Support<br />
Criminal Element<br />
• Trust in HN Gov’t and SF<br />
• Political Alignment w/ HN Govt (Retaliation<br />
Ideological<br />
<strong>for</strong> Revolution Support)<br />
• Perception <strong>of</strong> Outside Intervention<br />
• Economic & Social Interconnectedness<br />
Insurgents (RENAMO)<br />
Exploitation &<br />
• Intervention Resources & Capability<br />
• Leadership, Motivations & Recruiting<br />
Recruitment<br />
• Local Knowledge <strong>of</strong> HN<br />
• Skills, Capability & Learning<br />
• Homeland Support <strong>for</strong> Intervention<br />
• Forced Ability to Recruitment<br />
Operate/ Hide<br />
• Strategic Emphasis & Tactics<br />
• Resource & Manpower Levels<br />
Military<br />
Rein<strong>for</strong>cement &<br />
• Communications (Diplomatic<br />
Effectiveness & Local Message)<br />
Material Support<br />
Perceived<br />
Insurgent<br />
• Strategy & Tactics / Use <strong>of</strong> Force<br />
Insurgent<br />
Attacks on<br />
• Alignment with Civilian Values<br />
Ideology &<br />
Civilians & Infr<br />
Legitimacy<br />
Figure 4.2-1 – An Example High-level Causal Map. 3<br />
4. Consider key scenarios and externalities, and highlight major assumptions.<br />
While this step <strong>of</strong>ten overlaps with <strong>the</strong> earlier stages, it is important to begin <strong>for</strong>ming a<br />
view as to likely scenarios that may be relevant, to help in guiding both analyses and<br />
fur<strong>the</strong>r research. Given real world sources <strong>of</strong> uncertainty and <strong>the</strong> limits in our ability to<br />
predict behavior, it is helpful to explicitly consider multiple possible scenarios to<br />
investigate <strong>the</strong> robustness <strong>of</strong> potential actions under a range <strong>of</strong> plausible futures.<br />
Similarly when <strong>the</strong> boundary <strong>of</strong> <strong>the</strong> analysis is established, it is important to consider <strong>the</strong><br />
impact points <strong>of</strong> actors outside <strong>of</strong> <strong>the</strong> system and potential types <strong>of</strong> actions <strong>the</strong>y might<br />
take. The assumed actions and o<strong>the</strong>r key assumptions are <strong>of</strong>ten important factors to test in<br />
later stages, and it is important to be explicit about <strong>the</strong>m so that assumptions can be<br />
refined as more in<strong>for</strong>mation emerges. 4<br />
5. Assess leverage points under different conditions and key sensitivities.<br />
The primary purpose <strong>for</strong> developing <strong>the</strong> system-level view is to examine <strong>the</strong> potential<br />
impacts (including secondary and tertiary impacts) <strong>of</strong> contemplated actions, and also to<br />
highlight areas where <strong>the</strong> results <strong>of</strong> potential actions are particularly uncertain due to <strong>the</strong>ir<br />
triggering both positive and negative impacts. It is also possible to identify some<br />
especially high leverage actions where <strong>the</strong> direct impacts help produce desired results and<br />
also trigger secondary impacts that set in motion fur<strong>the</strong>r positive benefits. In some<br />
291
situations, this analysis is per<strong>for</strong>med on a purely qualitative level using <strong>the</strong> diagram and a<br />
structured approach, and at o<strong>the</strong>r times, quantitative models with equations are created to<br />
simulate <strong>the</strong> system under different conditions. A key challenge with such models is to<br />
establish confidence levels. In some cases <strong>the</strong> situation is so uncertain and <strong>the</strong> data so<br />
sparse that a quantitative model adds little additional value and is not worth <strong>the</strong> time and<br />
cost, while in o<strong>the</strong>r situations, quantitative models can be an important, useful addition.<br />
Determining whe<strong>the</strong>r to stay qualitative or to progress to quantitative results depends on<br />
many factors. If a quantitative approach is used, it is especially important to remind users<br />
<strong>of</strong> <strong>the</strong> subjectivity and range <strong>of</strong> uncertainty. There are widely varying views to <strong>the</strong> use <strong>of</strong><br />
quantitative models. They may be viewed as completely reliable, <strong>the</strong>y may be rejected<br />
out <strong>of</strong> hand due to <strong>the</strong>ir inability to be validated in <strong>the</strong> same way that physical models are<br />
validated, or <strong>the</strong>y may be used in a balanced manner, where <strong>the</strong> findings are considered<br />
and weighted accordingly. It is vital <strong>for</strong> <strong>the</strong> analyst to take charge <strong>of</strong> <strong>the</strong> use <strong>of</strong> a model<br />
and provide clear guidance on appropriate uses <strong>of</strong> a model and its findings to avoid<br />
misapplication.<br />
6. Identify high priority areas <strong>for</strong> fur<strong>the</strong>r research.<br />
Conducting <strong>the</strong> leverage and sensitivity analysis <strong>of</strong> potential actions <strong>of</strong>ten will surface<br />
issues where fur<strong>the</strong>r research and/or o<strong>the</strong>r analysis methods and approaches could shed<br />
important additional light. For example, if <strong>the</strong> actions <strong>of</strong> external players are particularly<br />
highly leveraged, conducting a classic war game may help to understand <strong>the</strong> likely<br />
actions <strong>of</strong> external players. Alternately, if <strong>the</strong> response <strong>of</strong> one set <strong>of</strong> actors to o<strong>the</strong>rs is<br />
particularly highly leveraged, an agent-based modeling exercise can help to examine<br />
some <strong>of</strong> <strong>the</strong> more likely outcomes. A fur<strong>the</strong>r possibility is that a particular type <strong>of</strong> data or<br />
input from experts is needed to assess and refine certain aspects <strong>of</strong> <strong>the</strong> analysis.<br />
7. Iterate and refine.<br />
Rapid assessment is <strong>of</strong>ten carried out through this whole process in three months. Such a<br />
quick review can be very useful in providing some early observations and supporting<br />
near-term decisions, but in most cases, <strong>the</strong> rapid review also identifies a number <strong>of</strong><br />
important ways <strong>the</strong> analysis should be refined and improved (such as when <strong>the</strong> rapid<br />
review uses only pre-existing data and in<strong>for</strong>mation and o<strong>the</strong>r studies become available, or<br />
via review with additional parties, or with <strong>the</strong> addition <strong>of</strong> findings from o<strong>the</strong>r more<br />
detailed studies or newly available data). Even if <strong>the</strong> results <strong>of</strong> <strong>the</strong> initial analyses are<br />
well received, if <strong>the</strong> situation is important, it behooves <strong>the</strong> analyst to continue refining<br />
and challenging all aspects <strong>of</strong> <strong>the</strong> analysis. There are undoubtedly many ways that <strong>the</strong><br />
process can be improved as stability situations are both complex and constantly evolving.<br />
Lessons -- Insights on Analyzing Stability Situations<br />
Through <strong>the</strong>se studies, a number <strong>of</strong> lessons have been identified on analyzing complex stability<br />
situations.<br />
1. Determine which stratifications <strong>of</strong> society are most important.<br />
These can be tribal, religious, language, regional, or o<strong>the</strong>r dimensions. Determining what<br />
is important in this region is one <strong>of</strong> <strong>the</strong> most important steps.<br />
2. Define <strong>the</strong> system based on real drivers ra<strong>the</strong>r than on geo-political boundaries<br />
O<strong>the</strong>r nations with historical connections, shared ethnic or religious connections, trade,<br />
292
proximity, or o<strong>the</strong>r interests, and/or transnational groups (terrorist or o<strong>the</strong>rwise) can have<br />
a significant influence and understanding <strong>the</strong>se at <strong>the</strong> outset is critical.<br />
3. Review history as well as current conditions<br />
At least a cursory understanding <strong>of</strong> <strong>the</strong> region over multiple decades is helpful to<br />
understand origins <strong>of</strong> tensions. In many cases, a longer view also sheds important light.<br />
4. Look <strong>for</strong> drivers, not just conditions.<br />
While <strong>the</strong>re is a necessary focus on important conditions in a region—levels <strong>of</strong> violence,<br />
troop levels, balance <strong>of</strong> power, economic conditions—<strong>the</strong>se are <strong>of</strong>ten indicators, and it is<br />
important to determine which factors drive <strong>the</strong>se indicators so that <strong>the</strong> focus can be on <strong>the</strong><br />
actions that will produce <strong>the</strong> greatest net positive impact on <strong>the</strong> key issues <strong>of</strong> interest.<br />
5. Simplify, but stay rigorous and iterate.<br />
Simplifying as much as possible (favoring breadth ra<strong>the</strong>r than depth at <strong>the</strong> outset) is<br />
important to make rapid headway in an analysis and to be able to provide insight in a<br />
timeframe to support <strong>the</strong> needs <strong>of</strong> decision-makers. While simplification and speed are<br />
necessary, it is also important to maintain rigor and push to keep testing and refining<br />
hypo<strong>the</strong>ses against available in<strong>for</strong>mation, actively challenging conclusions and<br />
assumptions, adding complexity where it proves important, and iteratively improving <strong>the</strong><br />
analysis. Speed cannot be an excuse <strong>for</strong> sloppiness.<br />
6. Acknowledge uncertainty, but do not be paralyzed by it.<br />
It is natural <strong>for</strong> analysts to be enamored <strong>of</strong> <strong>the</strong>ir own analysis and to overlook or<br />
minimize aspects not covered. It is important to recognize how complex and uncertain<br />
stability situations are and to be explicit about <strong>the</strong> issues that are not well-covered by an<br />
analysis or that are implicit or explicit assumptions. Ra<strong>the</strong>r than giving up in <strong>the</strong> face <strong>of</strong><br />
<strong>the</strong> complexity and uncertainty, it is important to persevere to analyze possible<br />
implications <strong>of</strong> actions while acknowledging that specific <strong>for</strong>ecasts are generally not<br />
possible.<br />
7. Syn<strong>the</strong>sis is challenging and ‘s<strong>of</strong>t,’ but critical to making <strong>the</strong> analysis useful.<br />
Stability situations tend to be so complex that syn<strong>the</strong>sis <strong>of</strong> <strong>the</strong> many factors considered<br />
and studies analyzed is important to make <strong>the</strong> work accessible to decision-makers.<br />
Syn<strong>the</strong>sis involves some degree <strong>of</strong> judgment and must be accomplished by experienced,<br />
trusted analysts to be helpful to decision-makers. Done poorly, syn<strong>the</strong>sis can be badly<br />
misleading and can destroy <strong>the</strong> value <strong>of</strong> a good assessment. Done well, it can make a vast<br />
quantity <strong>of</strong> analysis digestible and useful to a decision-maker so that <strong>the</strong> analysis is used<br />
ra<strong>the</strong>r than ignored. However, if a decision-maker does not trust <strong>the</strong> syn<strong>the</strong>sis, he or she<br />
will understandably discount <strong>the</strong> assessment, even if it is in fact excellent. In <strong>the</strong> end,<br />
analysis <strong>of</strong> complex human situations is difficult to divorce from <strong>the</strong> people per<strong>for</strong>ming<br />
<strong>the</strong> analysis and syn<strong>the</strong>sis.<br />
8. Hard data and local perspective are some <strong>of</strong> <strong>the</strong> greatest challenges.<br />
A consistent <strong>the</strong>me in analyzing stability situations is a very limited amount <strong>of</strong> hard data<br />
available to support analyses. Data on population, economic conditions, and violence<br />
levels can be difficult to pin down with confidence. These are some <strong>of</strong> <strong>the</strong> easier factors<br />
to measure, and o<strong>the</strong>r in<strong>for</strong>mation such as popular sentiment, balance <strong>of</strong> power, influence<br />
by different parties, etc., is <strong>of</strong>ten speculative at best. Polling and expert elicitation are <strong>the</strong><br />
best ways <strong>of</strong> filling such gaps but typically analysts will find data well short <strong>of</strong> desires in<br />
293
a rapid assessment. Gaining access to those with a truly indigenous perspective can also<br />
be difficult, especially <strong>for</strong> adversaries whose background varies widely from a typical<br />
western perspective and whose motivations are difficult to understand coming from a<br />
western viewpoint.<br />
9. Quantification has a role, but it is not always better.<br />
In some highly uncertain situations, quantified analyses would need to be caveated with<br />
such a wide range <strong>of</strong> uncertainty that <strong>the</strong>y add very limited value. In o<strong>the</strong>r situations,<br />
even if quantification is more feasible, it may be important first to provide a rapid<br />
qualitative framework that helps o<strong>the</strong>rs have constructive discussions and debates.<br />
Quantification <strong>of</strong>ten helps enough to be worth per<strong>for</strong>ming, but <strong>the</strong> value <strong>of</strong> qualitative<br />
assessments and frameworks should not be underestimated.<br />
10. There are common insights, but <strong>the</strong>re is no universally applicable action plan <strong>for</strong><br />
stability.<br />
Many insights recur in analysis <strong>of</strong> multiple stability situations: time delays are <strong>of</strong>ten<br />
frustratingly long (decades when we would prefer months and years); knowing what to<br />
do is easier than actually doing it when facing pressure to achieve results or stressful<br />
situations in <strong>the</strong>ater; corruption is an insidious condition that changes many leverage<br />
points and is extremely difficult to overcome in a durable way; and COIN principles<br />
broadly hold up in many situations, though <strong>the</strong> emphasis varies. However <strong>the</strong>re are<br />
undoubtedly some situations in which <strong>the</strong>se insights do not apply and o<strong>the</strong>rs where <strong>the</strong>y<br />
are less important than o<strong>the</strong>r factors. The set <strong>of</strong> actions to improve stability must be<br />
tailored to a specific situation.<br />
“Simplify as much as possible, but not fur<strong>the</strong>r,” a suggestion by Albert Einstein, is especially apt<br />
<strong>for</strong> stability situations. Without some simplification, it is easy to be paralyzed by <strong>the</strong> complexity<br />
<strong>of</strong> rich histories, many players, and issues at every level <strong>of</strong> abstraction, from individuals on up.<br />
Many assessments fall into this trap and never see <strong>the</strong> light <strong>of</strong> day. O<strong>the</strong>r assessments simplify<br />
too much, leading to potentially dangerous conclusions. The work highlighted in <strong>the</strong>se case<br />
studies has attempted to make progress in establishing a workable middle ground, capturing<br />
important complexities and drivers and creating an analysis plat<strong>for</strong>m that can be used to support<br />
decision-making and lesson analysis in a useful timescale. With vital decisions on stabilityrelated<br />
actions facing decision-makers <strong>for</strong> <strong>the</strong> <strong>for</strong>eseeable future, it is critical <strong>for</strong> us to provide<br />
rigorous and actionable advice so that <strong>the</strong>se decisions can be as in<strong>for</strong>med as possible.<br />
Acknowledgements: Many thanks to our clients <strong>for</strong> <strong>the</strong>se studies, <strong>for</strong> having <strong>the</strong> wisdom and<br />
boldness to try a new approach to analyze <strong>the</strong>se issues, recognizing <strong>the</strong> importance <strong>of</strong> <strong>the</strong><br />
problem and <strong>the</strong> limitations <strong>of</strong> more traditional methods. Sponsoring organizations included<br />
DARPA, J-8, OUSD(P) FT&R, DDR&E, PA&E, OPNAV, and Northrop Grumman. Thank you<br />
also to my colleagues at PA Consulting who played key roles in refining this approach and<br />
conducting <strong>the</strong>se analyses, especially Tamara Greenlaw, Donna Mayo, Ritu Sharma, Alan<br />
Graham, Tamara Kett, Beth Farrelly, Whitney Pickels, Erik Waldron, and Alma Rico.<br />
↑ Back to <strong>the</strong> top<br />
1 Reports <strong>of</strong> <strong>the</strong> DARPA-sponsored regional stability study (historical Mozambique situation used as<br />
example - conducted in 2008) and a predecessor DARPA study examining insurgency dynamics in Iraq<br />
294
(conducted in 2006) are available to US Government audiences upon request. Contact Dr. Brian Pierce,<br />
Deputy Director Strategic Technology Office, DARPA, <strong>for</strong> fur<strong>the</strong>r in<strong>for</strong>mation.<br />
2 A description <strong>of</strong> <strong>the</strong> System Dynamics methodology is covered in <strong>the</strong> classic book by <strong>the</strong> founder <strong>of</strong> <strong>the</strong><br />
field: Jay Forrester, Industrial Dynamics, Waltham, MA: Pegasus Communications, 1961.<br />
3 From “Understanding <strong>the</strong> dynamics <strong>of</strong> low intensity operations in developing nations – identifying key<br />
strategic challenges”, PA Consulting Final Technical Report <strong>for</strong> DARPA Strategic Technology Office,<br />
April 2008, ARPA Order No. X225/00, Program Code: 7P30<br />
4 A description <strong>of</strong> <strong>the</strong> Scenario Planning approach is covered in <strong>the</strong> classic work: Peter Schwartz, The art<br />
<strong>of</strong> <strong>the</strong> long view: Planning <strong>for</strong> <strong>the</strong> future in an uncertain world. New York, Doubleday, 1996.<br />
295
Appendix A. Acronyms<br />
A2C2<br />
ACH<br />
ACM<br />
AI<br />
AKO<br />
ASW<br />
C2<br />
CCT<br />
CDC<br />
CEO<br />
CIA<br />
COCOM<br />
COI<br />
COTS<br />
CPU<br />
CRM<br />
DDNI<br />
DDR&E<br />
DHCP<br />
DHS<br />
DIME<br />
DIMEFIL<br />
DISA<br />
DKO<br />
DNI<br />
DoD<br />
DOS<br />
DPI<br />
DTI<br />
EUCOM<br />
FBI<br />
FC<br />
FEMA<br />
GMU<br />
GWU<br />
HHS<br />
HIPAA<br />
HPLT<br />
HRO<br />
IC<br />
ICES<br />
Adaptive Architectures <strong>for</strong> Command and Control (program at Office <strong>of</strong> Naval<br />
Research)<br />
Analysis <strong>of</strong> Competing Hypo<strong>the</strong>ses<br />
Association <strong>for</strong> Computing Machinery<br />
Artificial Intelligence<br />
Army Knowledge Online<br />
Anti-Submarine Warfare<br />
Command and Control<br />
Collaboration Consulting Team<br />
Centers <strong>for</strong> Disease Control and Prevention<br />
Chief Executive Officer<br />
Central Intelligence Agency<br />
Combatant Command<br />
Community Of Interest<br />
Commercial-Off-The Shelf<br />
Central Processing Unit<br />
Crew Resource Management<br />
Deputy DNI<br />
Director, Defense Research and Engineering (in OSD)<br />
Dynamic Host Configuration Protocol<br />
Department <strong>of</strong> Homeland Security<br />
Diplomacy, In<strong>for</strong>mation, Military, Economic - The four instruments <strong>of</strong> national<br />
power<br />
DIME + Finance, Intelligence and Law En<strong>for</strong>cement<br />
Defense In<strong>for</strong>mation Systems Agency<br />
Defense Knowledge Online<br />
Director <strong>of</strong> <strong>National</strong> Intelligence<br />
Department <strong>of</strong> Defense<br />
Department <strong>of</strong> State<br />
Deep Packet Inspection<br />
Directed Technologies, Inc.<br />
US European Command<br />
Federal Bureau <strong>of</strong> Investigation<br />
Fiber Channel<br />
Federal Emergency Management Agency<br />
George Mason University<br />
George Washington University<br />
Health and Human Services<br />
Health In<strong>for</strong>mation Portability and Accountability Act<br />
High Per<strong>for</strong>ming Leader Teams<br />
High Reliability Organizations<br />
Intelligence Community<br />
Intelligence Community Enterprise Services<br />
296
ICS<br />
ICT<br />
IED<br />
IM<br />
INR<br />
IP<br />
IT<br />
JIATF<br />
JIIM<br />
JTF<br />
KM<br />
LOE<br />
LSU<br />
LTX<br />
MBA<br />
MSEHP<br />
NAD<br />
NAS<br />
NASIC<br />
NCES<br />
NDU<br />
NFCE<br />
NGA<br />
NJOIC<br />
NRF<br />
NSI<br />
NTI<br />
NVOAD<br />
ODNI<br />
OLPC<br />
OODA<br />
OSC<br />
OSD<br />
OSS<br />
P4CMI<br />
PNNL<br />
RRTO<br />
RSS<br />
SARS<br />
SATCOM<br />
SBU<br />
SIS<br />
SKA<br />
SMA<br />
SOP<br />
Incident Command Structure<br />
In<strong>for</strong>mation, Computers, Telecommunications<br />
Improvised Explosive Device<br />
In<strong>for</strong>mation Management<br />
Bureau <strong>of</strong> Intelligence and Research (DOS)<br />
Internet Protocols<br />
In<strong>for</strong>mation Technology<br />
Joint Inter-Agency Task Force<br />
Joint Interagency, International, Multinational<br />
Joint Task Force<br />
Knowledge Management<br />
Limited Objective Experiment<br />
Louisiana State University<br />
Leader Team Exercises<br />
Master <strong>of</strong> Business Administration<br />
Model State Emergency Health Powers (Act)<br />
natural or anthropogenic disaster<br />
<strong>National</strong> Air Space<br />
<strong>National</strong> Air and Space Intelligence Center (USAF)<br />
network-centric enterprise services<br />
<strong>National</strong> Defense University<br />
Nexus Federated Collaboration Environment<br />
<strong>National</strong> Geospatial-Intelligence Agency<br />
<strong>National</strong> Joint Operations Intelligence Center<br />
<strong>National</strong> Response Framework<br />
<strong>National</strong> Security Innovations, Inc.<br />
<strong>National</strong>-to-Tactical Integration<br />
<strong>National</strong> Voluntary Organizations Active in Disaster<br />
Office <strong>of</strong> <strong>the</strong> Director <strong>of</strong> <strong>National</strong> Intelligence<br />
One Laptop Per Child<br />
Observe, Orient, Decide, and Act<br />
Open Source Center<br />
Office <strong>of</strong> Secretary <strong>of</strong> Defense<br />
Open Source S<strong>of</strong>tware<br />
Patterns <strong>for</strong> Computer-Mediated Interaction<br />
Pacific Northwest <strong>National</strong> Laboratory (Department <strong>of</strong> Energy)<br />
Rapid Reaction Technology Office (OSD/DDR&E)<br />
Really Simple Syndication - a family <strong>of</strong> Web feed <strong>for</strong>mats used to publish<br />
frequently updated works<br />
Severe Acute Respiratory Syndrome<br />
Satellite Communications<br />
Sensitive But Unclassified<br />
Strategic In<strong>for</strong>mation System<br />
Skills, Knowledge, and Attitudes<br />
Strategic Multilayer Assessment<br />
Standard Operating Procedures<br />
297
TCS<br />
ToL<br />
TRADOC<br />
TTPs<br />
UNO<br />
USAFA<br />
WHO<br />
WMD<br />
WoG<br />
WREN<br />
Task, Condition, and Standard<br />
Teams <strong>of</strong> Leaders<br />
Training and Doctrine Command (US Army)<br />
tactics, techniques and procedures<br />
University <strong>of</strong> Nebraska Omaha<br />
US Air Force Academy<br />
World Health Organization<br />
Weapons <strong>of</strong> Mass Destruction<br />
Whole <strong>of</strong> Government<br />
Worldwide Rare Event Network<br />
↑ Back to <strong>the</strong> top<br />
298