Linear Regression
Linear Regression
Linear Regression

Create successful ePaper yourself
Turn your PDF publications into a flip-book with our unique Google optimized e-Paper software.
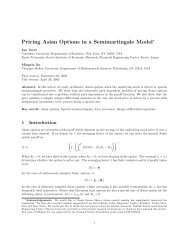
The command above tells STATA to create a scatterplot of fat against waist and<br />
superimpose the line given by yhat created in the previous command. This<br />
command gives the following plot:<br />
fat/<strong>Linear</strong> prediction<br />
0 10 20 30 40<br />
30 35 40 45<br />
waist<br />
fat<br />
<strong>Linear</strong> prediction<br />
The line appears to fit the data well. However, it is important to make residual<br />
plots when performing regression. We can calculate the residuals by typing the<br />
command:<br />
predict r, resid<br />
Again, note that other than creating a new variable, r, there will be no additional<br />
output. The new variable consists of the set of residuals, and a residual plot can<br />
be created by typing:<br />
scatter r waist<br />
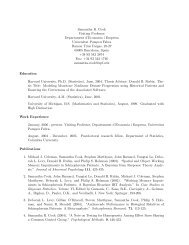
This gives rise to the following plot:<br />
Residuals<br />
-10 -5 0 5 10<br />
30 35 40 45<br />
waist<br />
The residual plot shows no apparent pattern. The residual plot and the relatively<br />
2<br />
high value of R indicate that the linear model we fit is appropriate.