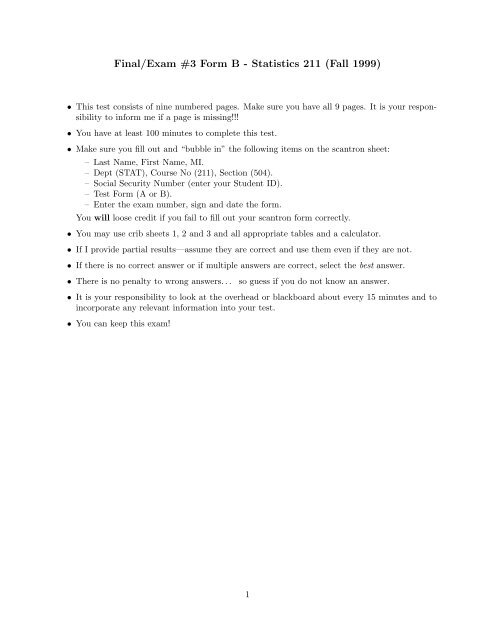
Final/Exam #3 Form B - Statistics 211 (Fall 1999)
Final/Exam #3 Form B - Statistics 211 (Fall 1999)
Final/Exam #3 Form B - Statistics 211 (Fall 1999)

You also want an ePaper? Increase the reach of your titles
YUMPU automatically turns print PDFs into web optimized ePapers that Google loves.
<strong>Final</strong>/<strong>Exam</strong> <strong>#3</strong> <strong>Form</strong> B - <strong>Statistics</strong> <strong>211</strong> (<strong>Fall</strong> <strong>1999</strong>)<br />
• This test consists of nine numbered pages. Make sure you have all 9 pages. It is your responsibility<br />
to inform me if a page is missing!!!<br />
• You have at least 100 minutes to complete this test.<br />
• Make sure you fill out and “bubble in” the following items on the scantron sheet:<br />
– Last Name, First Name, MI.<br />
– Dept (STAT), Course No (<strong>211</strong>), Section (504).<br />
– Social Security Number (enter your Student ID).<br />
– Test <strong>Form</strong> (A or B).<br />
– Enter the exam number, sign and date the form.<br />
You will loose credit if you fail to fill out your scantron form correctly.<br />
• You may use crib sheets 1, 2 and 3 and all appropriate tables and a calculator.<br />
• If I provide partial results—assume they are correct and use them even if they are not.<br />
• If there is no correct answer or if multiple answers are correct, select the best answer.<br />
• There is no penalty to wrong answers. . .<br />
so guess if you do not know an answer.<br />
• It is your responsibility to look at the overhead or blackboard about every 15 minutes and to<br />
incorporate any relevant information into your test.<br />
• You can keep this exam!<br />
1
Fill out your scantron sheet properly. See the header page of this exam for instructions.<br />
Chapter 8<br />
[1] A type I error is:<br />
a) Reject H 0 when H 0 is false.<br />
b) Reject H 0 when H 0 is true.<br />
c) Fail to reject H 0 when H 0 is false.<br />
d) Fail to reject H 0 when H 0 is true.<br />
e) not relevant to a test.<br />
[2] A statistical hypothesis is a claim about the value of one or more. . .<br />
a) statistics.<br />
b) parameter estimates.<br />
c) tests.<br />
d) confidence intervals.<br />
e) population parameters.<br />
[3] For a test α = .05 and β = .10. What is the probability we reject H 0 ?<br />
a) .05<br />
b) .1<br />
c) .9<br />
d) .95<br />
e) We cannot know this without the data!<br />
[4] The desired percentage of SiO 2 in a certain type of aluminous cement is 5.5. We want to test<br />
whether the true average percentage is 5.5 for a particular production facility. Suppose the<br />
percentage of SiO 2 in a sample is normally distributed with σ = .3. What sample size n is<br />
required to satisfy α = .01 and β(5.6) = .01?<br />
a) n = 15<br />
b) n = 20<br />
c) n = 194<br />
d) n = 217<br />
e) n = 721<br />
[5] The one sample test for µ when data is Normal and σ is known is: Z = ¯x−µ 0<br />
s/ √ . When our<br />
n<br />
sample size is large enough (say n ≥ 30) we say it is no longer necessary that the data is<br />
Normal. Why?<br />
a) When we have large samples, ¯x is a better estimate if µ!<br />
b) As the sample size increases, the variance of ¯x decreases!<br />
c) When we have a large sample size, s is an accurate estimate of σ!<br />
d) When n ≥ 30 the CLT no longer holds allowing us to ignore with the Normality assumption.<br />
e) The CLT guarantees that ¯x is Normal, even if the data is not.<br />
[6] Suppose a manufacturer claims their VHS tapes can hold 120 minutes of programming at SP<br />
mode. You believe they are shorter, so you test:<br />
In this example a type II error would be:<br />
H 0 : µ = 120 H A : µ < 120<br />
a) You claim the tapes are shorter than 120 minutes when in reality they are not.<br />
2
) You claim the tapes are longer than 120 minutes when in reality they are not.<br />
c) We do not conclude the tapes are shorter than 120 minutes when in reality they are.<br />
d) We do not conclude the tapes are longer than 120 minutes when in reality they are.<br />
e) α.<br />
[7] For the above example, we measure the length of 10 video tapes to find that the average length<br />
is 119 minutes. Why do we need to test if µ < 120 is we know that the average length of the<br />
10 tapes is 119? Clearly 119 < 120. . . right?<br />
a) It is not necessary to test since the average of 119 is less than 120!<br />
b) It is not necessary to test because a test deals with statistics — not parameters.<br />
c) It is not necessary to test because a test deals with parameters — not statistics.<br />
d) Knowing ¯x = 119 does not guarantee that µ < 120.<br />
e) Knowing µ = 119 does not guarantee that µ < 120.<br />
[8] Many consumers are turning to generics as a way of reducing the cost f prescription medications.<br />
A paper gives the results of a survey of 102 doctors. Only 47 of those surveyed knew the generic<br />
name for the drug methadone. Does this provide strong evidence for concluding that fewer<br />
than half the physicians know the generic name of methadone? The appropriate hypothesis<br />
test is:<br />
a) H 0 : p = .5 vs. H a : p < .5<br />
b) H 0 : p = .5 vs. H a : p > .5<br />
c) H 0 : µ = .5 vs. H a : µ < .5<br />
d) H 0 : µ = .5 vs. H a : µ > .5<br />
e) H 0 : µ = .5 vs. H a : µ ≠ .5<br />
[9] Statistical significance<br />
a) does imply practical significance.<br />
b) is the same as practical significance.<br />
c) does not imply practical significance.<br />
d) happens when α < p−value.<br />
e) only matters if the variance is very small.<br />
[10] Our hypothesis test results in a p-value of .01234. In this case we would:<br />
a) Reject H 0 at α = .05, but fail to reject H 0 at α = .01.<br />
b) Reject H 0 at α = .01, but fail to reject H 0 at α = .05.<br />
c) Reject H 0 at α = .05, and reject H 0 at α = .01.<br />
d) Fail to reject H 0 at α = .05, and fail to reject H 0 at α = .01.<br />
e) Can’t say — it depends on the actual test statistics.<br />
[11] The city council in a large city has become concerned about the trend toward exclusion of<br />
renters with children in apartments within the city. The housing coordinator has decided to<br />
select a random sample of 125 apartments and determine for each whether children would be<br />
permitted. let p = the true proportion of apartments that prohibit children. If at α = .05<br />
p > .75, the council will consider appropriate legislation. What is the probability of a type II<br />
error when p = .8?<br />
a) .7642<br />
b) .4129<br />
c) .6480<br />
d) .9515<br />
e) .5596<br />
3
[12] In the above “city council” problem a formal test of H 0 : p = .75 vs. H a : p > .75 results in a<br />
Z statistic of 1.70. The p-value of this test is:<br />
a) .9554<br />
b) .0446<br />
c) .0892<br />
d) .0500<br />
e) .5000<br />
Chapter 9<br />
[13] Researchers concluded in 1979, that the ferritin concentration in elderly has a smaller variance<br />
than in younger adults. For a sample of 28 elderly men, the sample standard deviation of<br />
serum ferritin (mg/L) was s 1 = 52.6. For 26 young men, the sample standard deviation was<br />
s 2 = 84.2. Does this data support at α = .01 the conclusion of the researchers in 1979 as<br />
applied to men?<br />
a) We fail to reject H 0 and we cannot conclude variability of ferritin to be greater in young men<br />
then in elderly men.<br />
b) We reject H 0 and we cannot conclude variability of ferritin to be greater in young men then<br />
in elderly men.<br />
c) We fail to reject H 0 and we conclude variability of ferritin to be greater in young men then in<br />
elderly men.<br />
d) We reject H 0 and conclude variability of ferritin to be greater in young men then in elderly<br />
men.<br />
e) f = .394 therefore neither the null or alternative hypothesis apply.<br />
[14] Consider the accompanying data on breaking load (kg/25 mm width) for various fabrics in<br />
both and unabraded condition and an abraded condition. Eight different fabric types where<br />
tests. We are interested if knowing if the breaking load of fabrics in unabraded condition is<br />
larger than then breaking load of fabrics in abraded condition. That is, we are interested in:<br />
H 0 : µ D = 0 vs H a : µ d > 0 where µ d = µ 1 − µ 2 .<br />
Fabric 1 2 3 4 5 6 7 8<br />
1) Unabraded 36.4 55.0 51.5 38.7 43.2 48.8 25.6 49.8<br />
2) Abraded 28.5 20.0 46.0 34.5 36.5 52.5 26.5 46.5<br />
Summary statistics: ¯d = 7.25 sD = 11.8628 At α = .01 what is our conclusion?<br />
a) We reject H 0 and conclude the data does not indicate differences in breaking load for the two<br />
fabric conditions.<br />
b) We reject H 0 and conclude the data does indicate differences in breaking load for the two<br />
fabric conditions.<br />
c) We fail to reject H 0 and conclude the data does not indicate differences in breaking load for<br />
the two fabric conditions.<br />
d) We fail to reject H 0 and conclude the data does indicate differences in breaking load for the<br />
two fabric conditions.<br />
e) Irrelevant — the data is not practically significant.<br />
[15] Tennis elbow is thought to be aggravated by the impact experienced when hitting the ball.<br />
A paper reports the force on the hand just after impact on a one-handed backhand drive for<br />
six advanced players and for eight intermediate players. Summary data appears below. We<br />
4
are interested if force after impact is greater for advanced players than it is for intermediate<br />
players.<br />
1) Advanced n = 6 ¯x = 40.3 s = 11.3<br />
2) Intermediate n = 8 ¯x = 21.4 s = 8.3<br />
The appropriate hypothesis for the above test is:<br />
a) H 0 : µ 1 = µ 2 vs H a : µ 1 − µ 2 < 0<br />
b) H 0 : µ 1 = µ 2 vs H a : µ 1 − µ 2 > 0<br />
c) H 0 : µ 1 = µ 2 vs H a : µ 1 − µ 2 ≠ 0<br />
d) H 0 : µ d = 0 vs H a : µ d < 0 where µ d = µ 1 − µ 2<br />
e) H 0 : µ d = 0 vs H a : µ d > 0 where µ d = µ 1 − µ 2<br />
[16] The appropriate test for the above “Tennis elbow” problem is:<br />
a) The pooled t-test.<br />
b) The Smith-Satterthwaite test.<br />
c) The paired t-test.<br />
d) Test for two population proportions.<br />
e) Test for two population variances.<br />
[17] At the beginning of the semester we talked about the Salk Polio vaccine. In a large 1954<br />
experiment 401,974 children where vaccinated. 201,229 where given the vaccine and 200,745<br />
where given a placebo. 110 of the children who received a placebo got polio and 33 of those<br />
given the vaccine got polio. Was the vaccine effective?<br />
H 0 : p 1 − p 2 = 0 H A : p 1 − p 2 < 0<br />
Vaccine: m = 201229 x = 33 ˆp 1 = .000164<br />
Placebo: n = 200745 y = 110 ˆp 2 = .000548<br />
The test statistic is Z = −6.46. What is the p-value of this test? What is the conclusion?<br />
a) less than .0001 — the vaccine is not effective!<br />
b) less than .0001 — the vaccine is effective!<br />
c) greater than .9999 — the vaccine is not effective<br />
d) p-value cannot be calculated, but the vaccine is effective.<br />
e) p-value=.0228 — the vaccine is effective!<br />
Chapter 10/12<br />
[18] A builder is interested in whether location has an effect on the selling price of a new threebedroom<br />
home in the 2000 square foot range. To keep matters simple, let suppose there are<br />
only three areas in which new homes are being built and thus only three treatment levels. The<br />
builder samples the price of 3 houses for each area (treatment level) and conducts the test:<br />
H 0 : µ 1 = µ 2 = µ 3 H a : notH 0<br />
Here is the partial ANOVA. What is the f statistic for this test?<br />
Source DF Sum of Squares Mean Square f<br />
Treatment 235.67<br />
Error —<br />
Total 469.67 — —<br />
5
a) f = 1.68<br />
b) f = 0.33<br />
c) f = 4.03<br />
d) f = 3.02<br />
e) f = 234.00<br />
[19] In the above “builder example” the three different average house prices are (for the three<br />
different areas) are:<br />
¯x 1 = 90 ¯x 2 = 100 ¯x 3 = 105<br />
We conduct a Tukey multiple comparison test where w = 7. Which conclusion below is the<br />
correct one?<br />
a) Areas 1 & 2 are the same, but they are significantly different from area 3.<br />
b) Areas 1 & 3 are the same, but they are significantly different from area 2.<br />
c) Areas 2 & 3 are the same, but they are significantly different from area 1.<br />
d) Areas 1 & 2 & 3 are all significantly different from each other.<br />
e) None of the areas 1 & 2 & 3 are significantly different from each other.<br />
Chapter 3-6 (selected sections)<br />
[20] Two desirable properties of a point estimate ˆθ are:<br />
a) Small bias and large variance.<br />
b) Large bias and large variance.<br />
c) Small bias and small variance.<br />
d) Large bias and small variance.<br />
e) Only the bias matters! Not the variance.<br />
[21] If GPA at Texas A&M is distributed X ∼ N(µ = 2, σ = 0.8) then what GPA must you have<br />
to be in the 75th percentile (select the closest answer)?<br />
a) 0.675<br />
b) 1.28<br />
c) 2.54<br />
d) 3.00<br />
e) 3.75<br />
[22] The average number of hurricanes that hit the west cost is 0.5 per year. What is the probability<br />
more than 3 years pass without a hurricane?<br />
a) P (X ≥ 3) where X ∼ Poisson(λ = 0.5).<br />
b) P (X ≥ 3) where X ∼ Gamma(α = 1.5, β = 0.5).<br />
c) P (X ≥ 3) where X ∼ Gamma(α = 1.0, β = 1.0).<br />
d) P (X ≥ 3) where X ∼ Exponential(λ = 0.5).<br />
e) P (X ≥ 3) where X ∼ N(µ = 0.5, σ = 1).<br />
[23] If two variables X and Y are positively correlated this might mean:<br />
a) X causes Y .<br />
b) X and Y cause each other.<br />
c) X and Y could be caused by a third lurking variable.<br />
d) X and Y are related by chance.<br />
e) All of the above.<br />
[24] The Central Limit Theorem is important because it:<br />
6
a) tells us the distribution of the data even if the distribution of the average is not known.<br />
b) tells us the distribution of the data even if the mean and variance of the data are not known.<br />
c) tells us the distribution of the average even if the distribution of the data is not known.<br />
d) allows us to solve probability questions about X (an individual data point).<br />
e) says that ¯X has a binomial distribution if n is large.<br />
[25] The average number of rabits per acre in a 7 acre forest is estimated to be 4. Find the<br />
probability that 2 or fewer rabits are found on any given acre.<br />
a) P (X ≤ 2) where X ∼ Negative Binomial(r = 4, p = 2 7 ).<br />
b) P (X ≤ 1) where X ∼ Binomial(n = 4, p = 2 7 ).<br />
c) .238<br />
d) .146<br />
e) .092<br />
[26] When a baseball player hits .300, he gets a hit 30% of the times at bat. Typical major leaguers<br />
bat about 500 times a season and hit about .260. Assuming a hitter’s successive tries are<br />
independent, what is the probability that a “typical” .260 player bats .200 or better?<br />
a) P (X ≥ .20) when X ∼ Binomial(n = 500, p = .26).<br />
b) P (X ≥ 100) when X ∼ Binomial(n = 500, p = .26).<br />
c) P (X ≥ .20) when X ∼ Binomial(n = 500, p = .20).<br />
d) P (X ≥ 100) when X ∼ Binomial(n = 500, p = .20).<br />
e) P (X ≥ 200) when X ∼ Negative Binomial(n = 500, p = .30).<br />
[27] The probability a student passes a class is 85%. The average class size is 90 students and the<br />
avergae GPA is 2.0. Assuming successive attempts are independent, and assuming 20% of the<br />
students hate the class, we want to know how many times a student needs to take class before<br />
she passes. The relevant distribution to answer this question is?<br />
a) X ∼ Negative Binomial(r = 2, p = .85).<br />
b) X ∼ Negative Binomial(r = 2, p = .20).<br />
c) X ∼ Geometric(p = .85).<br />
d) X ∼ Geometric(p = .20).<br />
e) X ∼ Binomial(n = 90, p = .85).<br />
Chapter 7<br />
[28] You desire to construct a confidence interval of your estimate of average price of a six pack<br />
of Diet Coke in Bryan/College Station. How many store prices must you sample so that your<br />
90% confidence interval is equal to or smaller than ±10 cents? You estimate that σ is 30 cents.<br />
a) 24<br />
b) 25<br />
c) 35<br />
d) 97<br />
e) 98<br />
[29] Which of the following will not affect the width of the confidence interval?<br />
a) Alpha.<br />
b) Standard Deviation.<br />
c) Sample size.<br />
d) All of the above will affect the width.<br />
e) None of the above will affect the width.<br />
7
[30] Which of the following properties is not part of the t distribution:<br />
a) Each t v curve is bell-shaped and centered on 0.<br />
b) Each t v curve is more spread out than the standard normal (Z) curve.<br />
c) As v increases , the spread of the corresponding t v curve decreases.<br />
d) As v → ∞, the sequence of t v curves approaches the standard normal curve (ie. t ∞ = Z).<br />
e) All of the above hold for the t distribution.<br />
[31] You need to know sigma to calculate the sample size required to construct the confidence<br />
interval of a given width. You do not know sigma, but you do know that the approximate minimum<br />
and maximum observations are 2 and 10 and that the data comes from an approximately<br />
Normal distribution. You rough estimate of σ is:<br />
a) 1<br />
b) 2<br />
c) 3<br />
d) 4<br />
e) 8<br />
[32] The 1983 Tylenol poisoning episode and other similar incidents have focused attention on the<br />
desirability of packaging various commodities in a tamper-resistant manner. An 1983 article<br />
reports the results of a survey of consumer attitudes toward such packaging. Of the 270<br />
consumers surveyed, 189 indicated that they would be willing to pay extra for the tamperresistant<br />
packaging. Construct a 95% confidence interval on the proportion of consumers<br />
willing to pay extra for the tamper-resistant packaging.<br />
a) .7 ± .055<br />
b) .7 ± .065<br />
c) .7 ± .075<br />
d) .7 ± .085<br />
e) .7 ± .095<br />
[33] The proportion of registered voters that would need to be sampled for a poll that desires an<br />
accuracy (margin of error) of ±1% is:<br />
a) 193<br />
b) 1068<br />
c) 4900<br />
d) 9604<br />
e) 38416<br />
[34] Consider the following sample of fat content (in percentage) of n = 10 randomly selected hot<br />
dogs:<br />
25.2, 21.3, 22.8, 17.0, 29.8, 21.0, 25.5, 16.0, 20.9, 19.5<br />
¯x = 21.90 s = 4.134<br />
Assuming Normality, construct a 95% prediction interval for the fat content of a single hot<br />
dog.<br />
a) 21.90 ± 2.56<br />
b) 21.90 ± 2.96<br />
c) 21.90 ± 4.82<br />
d) 21.90 ± 8.50<br />
e) 21.90 ± 9.81<br />
8
[35] Consider the hot dog example above. If you ask: “I wonder what the fat content of this hot<br />
dog I am eating is?” the interval ypu need to construct is:<br />
a) a confidence interval on µ.<br />
b) a confidence interval on p.<br />
c) a prediction interval on µ.<br />
d) a prediction interval on p.<br />
e) a confidence interval on σ.<br />
[36] In the hot dog example above, we want to construct a 90% confidence interval on σ. The<br />
appropriate distribution critical value(s) (eg. Z, t, χ, F , etc.) are:<br />
a) 4.168, 14.648<br />
b) 3.325, 16.919<br />
c) 1.833<br />
d) 1.645<br />
e) 1.812<br />
[37] Given a Normal distribution N(µ, σ 2 ), if ˆµ = 100 can we reasonably rule out µ = 100.1?<br />
a) Yes.<br />
b) No.<br />
c) Probably yes.<br />
d) Probably no.<br />
e) Can’t say — depends on the variance σ 2 .<br />
[38] In this course, σ most often referred to:<br />
a) population standard deviation.<br />
b) population variance.<br />
c) sample variance.<br />
d) sample standard deviation.<br />
e) sample correlation.<br />
[39] What is the confidence level for the following confidence interval for µ from a Normal distribution:<br />
¯x ± 2.576 σ √ n<br />
a) 1%<br />
b) 0.5%<br />
c) 99%<br />
d) 99.5%<br />
e) 0.005<br />
[40] A 95% confidence level for a given interval (for Normal data) means that<br />
a) there is a 95% chance this interval contains µ.<br />
b) there is a approximate 95% chance this interval contains µ.<br />
c) on the average, 95 out of 100 times we cannot know if the interval contains µ.<br />
d) on the average, 95% of all confidence intervals we construct will contains the true value of µ.<br />
e) the interval is a random interval with unknown fixed endpoints.<br />
9
Solutions to <strong>Exam</strong> <strong>#3</strong>B <strong>Fall</strong> <strong>1999</strong><br />
1.) b, e, c, d, e<br />
6.) c, d, a, c, a<br />
11.) c, b, d, c, b<br />
16.) a, b, d, c, c<br />
21.) c, d, e, c, c<br />
26.) b, c, b, d, e<br />
31.) b, a, d, e, c<br />
36.) b, e, a, c, d<br />
10