Solutions
Solutions
Solutions

You also want an ePaper? Increase the reach of your titles
YUMPU automatically turns print PDFs into web optimized ePapers that Google loves.
STAT 235 PRACTICE LAB EXAM 1 SOLUTIONS<br />
Instructions<br />
1. This is a closed book exam. You are not allowed to use a hand calculator.<br />
2. This is a multiple-choice exam. It consists of 19 single questions. For each question, carry out the<br />
appropriate analysis using Excel and circle the correct answer. All answers are rounded to four<br />
digits. Detailed solutions for the version of the exam are provided below. Some questions require<br />
using the template template.xls to calculate the binomial, Poisson, and normal probabilities.<br />
Questions<br />
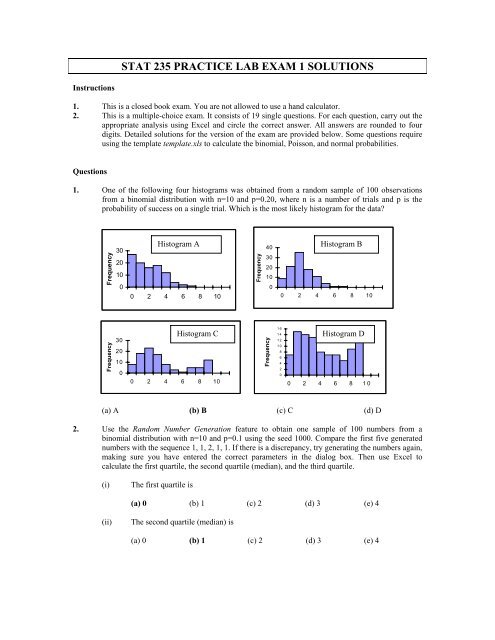
1. One of the following four histograms was obtained from a random sample of 100 observations<br />
from a binomial distribution with n=10 and p=0.20, where n is a number of trials and p is the<br />
probability of success on a single trial. Which is the most likely histogram for the data?<br />
Frequency<br />
30<br />
20<br />
10<br />
0<br />
Histogram A<br />
0 2 4 6 8 10<br />
Frequency<br />
40<br />
30<br />
20<br />
10<br />
0<br />
Histogram B<br />
0 2 4 6 8 10<br />
Frequency<br />
30<br />
20<br />
10<br />
0<br />
Histogram C<br />
0 2 4 6 8 10<br />
Frequency<br />
16<br />
14<br />
12<br />
10<br />
8<br />
6<br />
4<br />
2<br />
0<br />
Histogram D<br />
0 2 4 6 8 10<br />
(a) A (b) B (c) C (d) D<br />
2. Use the Random Number Generation feature to obtain one sample of 100 numbers from a<br />
binomial distribution with n=10 and p=0.1 using the seed 1000. Compare the first five generated<br />
numbers with the sequence 1, 1, 2, 1, 1. If there is a discrepancy, try generating the numbers again,<br />
making sure you have entered the correct parameters in the dialog box. Then use Excel to<br />
calculate the first quartile, the second quartile (median), and the third quartile.<br />
(i)<br />
The first quartile is<br />
(a) 0 (b) 1 (c) 2 (d) 3 (e) 4<br />
(ii)<br />
The second quartile (median) is<br />
(a) 0 (b) 1 (c) 2 (d) 3 (e) 4
(iii)<br />
The third quartile is<br />
(a) 0<br />
(b) 1 (c) 2 (d) 3 (e) 4<br />
3.<br />
We refer to the data in Question 2. It is possible to find that the number of zeros in the sample of<br />
100 observations is 39. What is the probability that a random variable following the binomial<br />
distribution with n=10 and p=0.1 takes on the value of zero? The probability is<br />
(a) .3185 (b) .3285 (c) .3305 (d) .3487 (e) .3615<br />
4. 10,000 random observations are taken from a population having a standard normal distribution.<br />
Use the Normal Probabilities worksheet to complete the following sentence: The expected<br />
number of observations exceeding 3 is<br />
(a) 11 (b) 13.5 (c) 21.5 (d) 31 (e) 68<br />
5.<br />
The distribution of heights of human males is normal with a mean of 175 cm, and a standard<br />
deviation of 8 cm. Use the Normal Probabilities worksheet to complete the following sentence:<br />
The fraction of males with height less than 160 cm is<br />
(a) 0.0214 (b) 0.0254 (c) 0.0304 (d) 0.0521 (e) 0.0634<br />
6. Refer to the data in the previous problem. Use the Normal Probabilities worksheet to complete the<br />
following sentence: The height exceeded by eighty percent of males is<br />
(a) 166.3287 (b) 168.2670 (c) 169.7324 (d) 170.3264 (e) 171.0734<br />
7. Suppose you have generated 200 random samples of a given size n=30 from a normal population.<br />
For each sample you have obtained a 90% confidence interval for the population mean. The<br />
expected number of intervals to cover the mean is<br />
(a) 30 (b) 90 (c) 110 (d) 180 (e) 200<br />
8.<br />
Suppose you have generated 200 random samples of a given size n=30 from a standard normal<br />
population. For each sample you test H 0 : μ= 0 against H a :μ > 0 at the 0.05 level of significance.<br />
On the average how many times out of 200 would you expect to make the correct decision (that is<br />
ot to reject H )?<br />
n 0<br />
(a) 30 (b) 10 (c) 180 (d) 190 (e) 200<br />
9.<br />
An insurance company is attempting to see if two different chains of autobody repair shops give<br />
significantly different estimates of repair costs. They take seven cars to one chain, seven cars to<br />
another chain, and obtain estimates. These estimates, in hundreds of dollars, are:<br />
Estimates (in hundreds of dollars)<br />
Chain 1 2 3 4 5 5 5 4<br />
Chain 2 1 4 5 7 6 7 1<br />
Enter the data in an Excel worksheet. Which of the following tests available in Data Analysis tool<br />
should be used to carry out the analysis?
(a)<br />
(b)<br />
(c)<br />
(d)<br />
(e)<br />
t-Test: Paired Two Sample for Mean<br />
t-Test: Two Sample Assuming Equal Variances<br />
t-Test: Two Sample Assuming Unequal Variances<br />
z-Test: Two Sample for Mean<br />
None of the above<br />
10.<br />
Refer to the data and the test specified in the previous problem. Carry out the test with the<br />
estimates for Chain 1 as Variable 1, and the estimates for Chain 2 as Variable 2. Use the computer<br />
output to complete the following sentence: The absolute value of the test statistic is<br />
(a) 0.4021 (b) 0.1705 (c) 0.3409 (d) 1.3333 (e) 2.2281<br />
11. The p-value of the test in Question 10 is<br />
(a) 0.05 (b) 0.1705 (c) 0.3491 (d) 0.6981 (e) 1.8595<br />
12. Refer to the p-value obtained in the previous question. What decision is reached about the null<br />
hypothesis?<br />
(a) the null hypothesis would be rejected both at level 0.1 and 0.05<br />
(b) the null hypothesis would be rejected at α = 0.1 but not 0.05<br />
(c) the null hypothesis would be rejected at α = 0.05 but not 0.1<br />
(d) the null hypothesis would be rejected neither at α = 0.05 nor α = 0.10<br />
(e) None of these.<br />
13.<br />
Refer to the data in Problem 9. Suppose now that you are told that there were only seven cars and<br />
the estimate for each of them was obtain for the chain 1 and chain 2. An appropriate test available<br />
in Excel to test the claim in Question 9 is<br />
(a) t-Test: Paired Two Sample for Mean<br />
(b) t-Test: Two Sample Assuming Equal Variances<br />
(c) t-Test: Two Sample Assuming Unequal Variances<br />
(d) z-Test: Two Sample for Means<br />
(e) None of the above<br />
The table displayed below gives data on the lean body mass (kilograms) and resting metabolic rate<br />
for 7 women who are subjects in a study of obesity. The researchers suspect that lean body mass<br />
(that is, the subject's weight leaving out all fat) is an important influence on metabolic rate.<br />
Mass 36 55 49 42 51 42 40<br />
Rate 995 1425 1396 1418 1502 1256 1189<br />
Enter the data in an Excel worksheet. Double-check to make sure that you have entered the correct<br />
data. Then use the Regression output for the data to complete the sentences in Questions 14-17.<br />
14. The value of the correlation coefficient between the lean body mass and metabolic rate is<br />
(a)<br />
0.5327 (b) 0.6839 (c) 0.8270 (d) 0.8942 (e) 0.9131
15. The equation of the least-squares regression line is<br />
(a) Rate = 345.7019 + 21.46377*Mass<br />
(b) Rate = 296.4899 + 6.525444*Mass<br />
(c) Rate = 4.689608 + 38.23793*Mass<br />
(d) Rate = 45.76491 + 21.46377*Mass<br />
(e) Rate = 215.7019 + 21.46377*Mass<br />
16. A 95% confidence interval for the average change in the metabolic rate as the body mass increases<br />
by 1 kilogram is<br />
(a) [3.4523, 13.3526] (b) [4.6896, 38.2379]<br />
(d) [7.5375, 445.7649] (e) [8.3595, 45.7649]<br />
(c) [6.5254, 45.7649]<br />
17. The fraction of the variation in the values of metabolic rate that is explained by the regression of<br />
metabolic rate on lean body mass is<br />
(a) 53.27% (b) 59.43% (c) 62.50% (d) 68.39% (e) 82.70%<br />
DETAILED SOLUTIONS<br />
Question 1<br />
The binomial distribution with n=10 and p=0.20 is skewed to the right. Its mean is np=2. The most likely<br />
observed values of the distribution are small integer numbers, 0, 1, 2, the values very unlikely to appear are<br />
integer numbers close to 10. Thus the histograms C and D should be excluded. However, as the number of<br />
observations is large (100), we expect the right tail of the distribution not to be very long and the shape of<br />
the distribution resembling that of a normal distribution. Only the histogram B satisfies the condition. The<br />
answer (b) is correct.<br />
Question 2<br />
It is possible to use the Insert Function to obtain the values of all five statistics. You will find them all in<br />
Statistical category. It is also possible to use the Descriptive Statistics feature to produce the values of the<br />
first three statistics and to obtain the remaining two from the Insert Function feature.<br />
The correct values are:<br />
(a) The first quartile is 0<br />
(b) The second quartile is<br />
1<br />
(e) The third quartile is 2<br />
Question 3<br />
The probability displayed in the Binomial template is 0.3487.<br />
Question 4<br />
The value returned by the worksheet is 0.00135. The expected number of observations exceeding 3 in a<br />
random sample<br />
of 10,000 observations is 10,000*0.00135=13.5. The answer (b) is correct.
Question 5<br />
The value returned by the worksheet is 0.030396 (about 3%). The answer (c) is correct.<br />
Question 6<br />
The height exceeded by 80% of males is equal to the height not exceeded by 20% of males. The value<br />
returned by the worksheet is 168.26703. The answer (b) is correct.<br />
Question 7<br />
The expected number of intervals to cover the mean is 200*0.90 = 180. The answer (d) is correct.<br />
Question 8<br />
The level of significance is the fraction of time the null hypothesis is rejected when in fact it is true.<br />
Therefore we reject the null hypothesis 200*0.05=10 tomes (out of 200) on the average. This will not be a<br />
correct decision because the true mean is zero (standard normal distribution). Thus the correct decision is<br />
made 200 -10 = 190 times on the average. The answer (d) is correct.<br />
Question 9<br />
Given the small sample size (n=7), the two-sample test assuming unequal variances should be used (see the<br />
instructions in lab 4).<br />
Question 10<br />
The numerical value of the test statistic is -0.4021 (or 0.4021).<br />
Question 11<br />
The p-value of the two-sided test is 0.6981. The decision about the null hypothesis is not to reject the null<br />
hypothesis.<br />
Question 12<br />
P-value is the smallest level of significance at which the null hypothesis can be rejected. As the p-value is<br />
0.6981, the null hypothesis would be rejected neither at α = 0.05 nor α = 0.10.<br />
Question 13<br />
The<br />
paired two sample t-test should be used. The answer (a) is correct.
Question 14<br />
SUMMARY OUTPUT<br />
Regression Statistics<br />
Multiple R 0.82699864<br />
R Square 0.68392675<br />
Adjusted R Square<br />
0.6207121<br />
Standard Error<br />
108.408811<br />
Observations 7<br />
ANOVA<br />
Df<br />
SS MS F Significance F<br />
Regression 1 127151.3623 127151.4 10.81912 0.02173166<br />
Residual 5 58762.35197 11752.47<br />
Total 6 185913.7143<br />
Coefficients Standard Error t Stat P-value Lower 95% Upper 95%<br />
Intercept 345.701863 296.4899469 1.165982 0.29621 -416.448563 1107.8523<br />
Mass 21.4637681 6.525443622 3.289243 0.021732 4.68960868 38.237928<br />
Thus the correlation coefficient is 0.82699864.<br />
Question 15<br />
The equation of the least-squares regression line is Rate = 345.701863 + 21.4637681*Mass. The answer (a)<br />
is correct.<br />
Question 16<br />
A 95% confidence interval for the slope of the population regression line is [4.6896, 38.2379]. The answer<br />
(b) is correct.<br />
Question 17<br />
According to the output the value of the r 2 is 0.6839. Thus 68.39% of the variation in metabolic rate is<br />
explained by the linear regression.