Practice Exam Questions and Solutions: Final Exam
Practice Exam Questions and Solutions: Final Exam
Practice Exam Questions and Solutions: Final Exam

You also want an ePaper? Increase the reach of your titles
YUMPU automatically turns print PDFs into web optimized ePapers that Google loves.
<strong>Practice</strong> <strong>Exam</strong> <strong>Questions</strong> <strong>and</strong> <strong>Solutions</strong><br />
for the <strong>Final</strong> <strong>Exam</strong><br />
Statistics 301, Professor Wardrop<br />
Chapter 12<br />
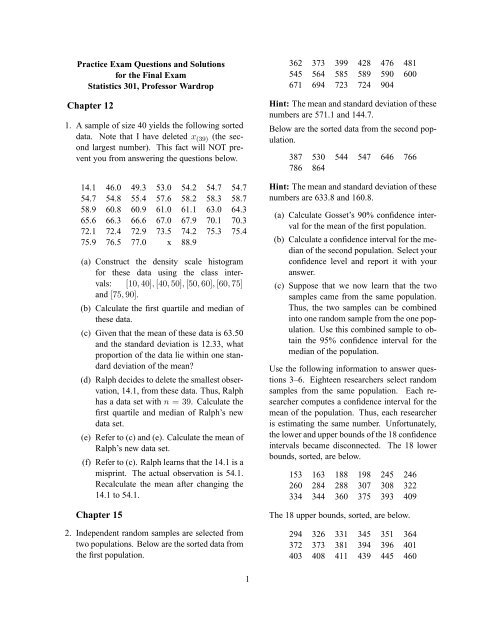
1. A sample of size 40 yields the following sorted<br />
data. Note that I have deleted x (39) (the second<br />
largest number). This fact will NOT prevent<br />
you from answering the questions below.<br />
14.1 46.0 49.3 53.0 54.2 54.7 54.7<br />
54.7 54.8 55.4 57.6 58.2 58.3 58.7<br />
58.9 60.8 60.9 61.0 61.1 63.0 64.3<br />
65.6 66.3 66.6 67.0 67.9 70.1 70.3<br />
72.1 72.4 72.9 73.5 74.2 75.3 75.4<br />
75.9 76.5 77.0 x 88.9<br />
(a) Construct the density scale histogram<br />
for these data using the class intervals:<br />
[10,40],[40,50], [50,60], [60,75]<br />
<strong>and</strong> [75,90].<br />
(b) Calculate the first quartile <strong>and</strong> median of<br />
these data.<br />
(c) Given that the mean of these data is 63.50<br />
<strong>and</strong> the st<strong>and</strong>ard deviation is 12.33, what<br />
proportion of the data lie within one st<strong>and</strong>ard<br />
deviation of the mean?<br />
(d) Ralph decides to delete the smallest observation,<br />
14.1, from these data. Thus, Ralph<br />
has a data set with n = 39. Calculate the<br />
first quartile <strong>and</strong> median of Ralph’s new<br />
data set.<br />
(e) Refer to (c) <strong>and</strong> (e). Calculate the mean of<br />
Ralph’s new data set.<br />
(f) Refer to (c). Ralph learns that the 14.1 is a<br />
misprint. The actual observation is 54.1.<br />
Recalculate the mean after changing the<br />
14.1 to 54.1.<br />
Chapter 15<br />
2. Independent r<strong>and</strong>om samples are selected from<br />
two populations. Below are the sorted data from<br />
the first population.<br />
362 373 399 428 476 481<br />
545 564 585 589 590 600<br />
671 694 723 724 904<br />
Hint: The mean <strong>and</strong> st<strong>and</strong>ard deviation of these<br />
numbers are 571.1 <strong>and</strong> 144.7.<br />
Below are the sorted data from the second population.<br />
387 530 544 547 646 766<br />
786 864<br />
Hint: The mean <strong>and</strong> st<strong>and</strong>ard deviation of these<br />
numbers are 633.8 <strong>and</strong> 160.8.<br />
(a) Calculate Gosset’s 90% confidence interval<br />
for the mean of the first population.<br />
(b) Calculate a confidence interval for the median<br />
of the second population. Select your<br />
confidence level <strong>and</strong> report it with your<br />
answer.<br />
(c) Suppose that we now learn that the two<br />
samples came from the same population.<br />
Thus, the two samples can be combined<br />
into one r<strong>and</strong>om sample from the one population.<br />
Use this combined sample to obtain<br />
the 95% confidence interval for the<br />
median of the population.<br />
Use the following information to answer questions<br />
3–6. Eighteen researchers select r<strong>and</strong>om<br />
samples from the same population. Each researcher<br />
computes a confidence interval for the<br />
mean of the population. Thus, each researcher<br />
is estimating the same number. Unfortunately,<br />
the lower <strong>and</strong> upper bounds of the 18 confidence<br />
intervals became disconnected. The 18 lower<br />
bounds, sorted, are below.<br />
153 163 188 198 245 246<br />
260 284 288 307 308 322<br />
334 344 360 375 393 409<br />
The 18 upper bounds, sorted, are below.<br />
294 326 331 345 351 364<br />
372 373 381 394 396 401<br />
403 408 411 439 445 460<br />
1
If you don’t remember what it means for a confidence<br />
interval to be ‘too small’ or ‘too large,’<br />
see question 7.<br />
3. Given that µ = 300, how many of the confidence<br />
intervals are correct?<br />
4. Suppose we are told that exactly two of the intervals<br />
are too large. Determine all possible values<br />
of µ.<br />
5. Suppose we are told that at least five of the intervals<br />
are too small. Determine all possible values<br />
of µ.<br />
6. It could happen that all of the confidence intervals<br />
are incorrect; for example, if µ = 0 then<br />
one can conclude that all of the intervals are too<br />
large. It can also be shown that it is impossible<br />
for all 18 intervals to be correct. Here is the two<br />
part question for you:<br />
What is the largest number of these<br />
intervals that could possibly be correct?<br />
Which values of µ will achieve<br />
this maximum number of correct intervals?<br />
7. Recall that a confidence interval is too small if<br />
the number being estimated is larger than every<br />
number in the confidence interval. Similarly, a<br />
confidence interval is too large if the number<br />
being estimated is smaller than every number<br />
in the confidence interval.<br />
Each of four researchers selects a r<strong>and</strong>om sample<br />
from the same population. Each researcher<br />
calculates a confidence interval for the mean of<br />
the population. The intervals are below.<br />
[10,52],[24,69], [37,62] <strong>and</strong> [58,81].<br />
(a) Nature announces, “Two of the intervals<br />
are correct, one interval is too small <strong>and</strong><br />
one interval is too large.” Given this information,<br />
determine all possible values of<br />
the mean. Do not explain.<br />
(b) Nature announces, “Exactly three of the<br />
intervals are correct.” Given this information,<br />
determine all possible values of the<br />
mean. Do not explain.<br />
Chapter 16<br />
8. Independent r<strong>and</strong>om samples are selected from<br />
two populations. Below are selected summary<br />
statistics.<br />
Pop. Mean St<strong>and</strong>. Dev. Sample size<br />
1 62.00 10.00 17<br />
2 54.00 6.00 10<br />
Calculate s p .<br />
9. The null hypothesis is µ X = µ Y . Use Case 1<br />
from Section 16.2 to obtain the P-value for each<br />
of the situations described below.<br />
(a) The alternative is µ X > µ Y ; the value of<br />
the test statistic is 1.840; the sample sizes<br />
are 5 <strong>and</strong> 5.<br />
(b) The alternative is µ X < µ Y ; the value<br />
of the test statistic is −3.150; the sample<br />
sizes are 6 <strong>and</strong> 7.<br />
(c) The alternative is µ X ≠ µ Y ; the value of<br />
the test statistic is 1.341; the sample sizes<br />
are 5 <strong>and</strong> 12.<br />
Chapter 8<br />
10. Below is the table of population counts for a disease<br />
<strong>and</strong> its screening test. (Recall that A means<br />
the disease is present <strong>and</strong> B means the screening<br />
test is positive.) On parts (a)–(e) below, report<br />
your answers as either: a ratio, like 72/312<br />
or as a decimal to three digits of precision, for<br />
example 0.231.<br />
B B c Total<br />
A 108 12 120<br />
A c 42 698 740<br />
Total 150 710 860<br />
(a) What proportion of the population is free<br />
of the disease?<br />
2
(b) What proportion of the population has the<br />
disease <strong>and</strong> would test positive?<br />
(c) Of those who have the disease, what proportion<br />
would test negative?<br />
(d) What proportion of the population would<br />
receive an incorrect screening test result?<br />
(e) Of those who would receive a correct<br />
screening test result, what proportion<br />
would receive a correct negative?<br />
11. (Hypothetical data.) A company has 1,500 employees.<br />
You are given the following information:<br />
• Sixty-four percent of the employees are<br />
female.<br />
• Eighty percent of the female employees<br />
are parents.<br />
• Forty percent of the male employees are<br />
parents.<br />
(a) Create the table of population counts for<br />
this ‘disease’ <strong>and</strong> ‘screening test.’ Be sure<br />
to label the rows <strong>and</strong> columns of your table.<br />
(b) An employee is selected at r<strong>and</strong>om from<br />
the company. Given that the employee is<br />
a parent, calculate the probability that the<br />
employee is female.<br />
Chapter 13<br />
12. A regression analysis yields the line<br />
ŷ = 32 + 0.4x.<br />
One of the subjects, Racheal, has x = 60 <strong>and</strong><br />
y = 52. Another subject, Ralph, has ŷ = 56.<br />
(a) Calculate Racheal’s predicted value, ŷ.<br />
(b) Calculate Racheal’s residual.<br />
(c) Calculate Ralph’s x.<br />
13. Fifty students take midterm <strong>and</strong> final exams.<br />
On the midterm exam, the mean score is 45.0<br />
<strong>and</strong> the st<strong>and</strong>ard deviation is 7.00. On the final<br />
exam, the mean score is 85.0 with a st<strong>and</strong>ard<br />
deviation of 14.00. The correlation coefficient<br />
of the two scores is 0.64.<br />
Obtain the least squares regression line for using<br />
the final exam score to predict the midterm<br />
exam score.<br />
14. Children in grade six take two exams each: one<br />
on math <strong>and</strong> one on vocabulary. For each exam,<br />
larger scores are better.<br />
One child, Eric, scores 40 on the math test <strong>and</strong><br />
60 on the vocabulary test.<br />
• Eric scored 5 points below the mean on the<br />
math exam.<br />
• Eric scored 10 points above the mean on<br />
the vocabulary exam.<br />
• Diane obtains the regression line for using<br />
the math score to predict the vocabulary<br />
score. According to her line, Eric scored<br />
10 points lower than predicted.<br />
Use the above information to obtain Diane’s regression<br />
line.<br />
15. A regression analysis is performed with n = 4<br />
observations. You are given the following information.<br />
x e<br />
0 e 0<br />
2 e 2<br />
3 +3<br />
5 −2<br />
Calculate the values of e 0 <strong>and</strong> e 2 . Be sure to<br />
label your answers so that I can tell which is<br />
which. (Hint: Remember that ∑ e = 0 <strong>and</strong><br />
∑ (xe) = 0.)<br />
16. A regression analysis yields the following regression<br />
line:<br />
ŷ = 20 + 6x.<br />
Which one or more of the following five sets of<br />
statistics can be for these data?<br />
3
(a) s Y = 20, s X = 5, ȳ = 110 <strong>and</strong> ¯x = 15.<br />
(b) s Y = 40, s X = 5, ȳ = 110 <strong>and</strong> ¯x = 15.<br />
(c) s Y = 40, s X = 5, ȳ = 110 <strong>and</strong> ¯x = 25.<br />
(d) s Y = 20, s X = 5, ȳ = 110 <strong>and</strong> ¯x = 25.<br />
(e) s Y = 50, s X = 3, ȳ = 110 <strong>and</strong> ¯x = 15.<br />
<strong>Solutions</strong><br />
1. (a) First, we create the following table.<br />
Class<br />
Density<br />
Interval Freq. Rel. Fr. (rounded)<br />
10–40 1 0.025 0.001<br />
40–50 2 0.050 0.005<br />
50–60 12 0.300 0.030<br />
60–75 18 0.450 0.030<br />
75–90 7 0.175 0.012<br />
The density scale histogram is below.<br />
0.001<br />
0.005<br />
0.030<br />
0.012<br />
10 20 30 40 50 60 70 80 90<br />
(b) The median is the mean of the numbers in<br />
positions 20 <strong>and</strong> 21; i.e. 63.0 <strong>and</strong> 64.3—<br />
the median is 63.65. The lower half of the<br />
data has 20 observations. The first quartile<br />
is the mean of 55.4 <strong>and</strong> 57.6; i.e. 56.5.<br />
(c) The one sd interval ranges from<br />
63.50 − 12.33 = 51.17, to<br />
63.50 + 12.33 = 75.83.<br />
This interval contains 32 observations;<br />
thus, the proportion within it is 32/40 =<br />
0.80.<br />
(d) The median is the number in position 20;<br />
i.e. 64.3. The lower half of the data has 19<br />
observations. The first quartile is 57.6.<br />
(e) The total of the 40 numbers is 40 times<br />
the mean, or 40(63.50) = 2540. After<br />
deleting 14.1, the total of the 39 remaining<br />
numbers is 2540 − 14.1 = 2525.9.<br />
The mean of the 39 remaining numbers is<br />
2525.9/39 = 64.77.<br />
(f) Changing 14.1 to 54.1 increases the total<br />
of the 40 numbers by 40. Thus, the mean<br />
grows by 40/n = 40/40 = 1. The new<br />
mean is 64.50.<br />
2. (a) First, n = 17; thus, there are 16 degrees<br />
of freedom making t = 1.746. The CI is<br />
571.1 ± 1.746(144.7)/ √ 17 =<br />
571.1 ± 61.3 = [509.8,632.4].<br />
(b) B/c n = 8 is smaller than 21, we can use<br />
the exact CI. From Table A.7 the possible<br />
answers are:<br />
• 99.2%: [387,864], <strong>and</strong><br />
• 93.0%: [530,786].<br />
(c) B/c n = 25 is larger than 20, we must use<br />
the approximate CI. First,<br />
k ′ = 25 + 1<br />
2<br />
− 1.96√ 25<br />
2<br />
13 − 4.9 = 8.1.<br />
=<br />
Thus, k = 8 <strong>and</strong> the CI is [530,671].<br />
3. Nine lower bounds are larger than 300, making<br />
nine intervals too large. One upper bound is<br />
smaller than 300, making one interval too small.<br />
Thus, 18 − 9 − 1 = 8 intervals are correct.<br />
4
4. This means that exactly two of the lower bounds<br />
are too large. The two are 393 <strong>and</strong> 409. Thus,<br />
µ < 393. But the ‘exactly’ tells us that the<br />
lower bound 375 is not too large, so µ ≥ 375.<br />
Putting these together, we get<br />
8. First,<br />
s 2 p =<br />
Thus, s p = 8.773.<br />
16(100) + 9(36)<br />
16 + 9<br />
= 76.96.<br />
375 ≤ µ < 393.<br />
5. This means that at least five of the upper bounds<br />
are too small. Thus, 351 is too small; the answer<br />
is<br />
µ > 351.<br />
6. By trial <strong>and</strong> error, the largest possible number<br />
of correct intervals is 11. This will happen if:<br />
322 ≤ µ ≤ 326 or 344 ≤ µ ≤ 345.<br />
(Yes, this is a difficult question.)<br />
7. (a) The key is to save the correct intervals for<br />
the last. One interval too large means that<br />
one lower bound is too large; this must be<br />
the 58. Thus, µ < 58. The one interval too<br />
small means that one upper bound is too<br />
small; this must be the 52. Thus, µ > 52.<br />
The remaining intervals must be correct.<br />
Thus, 37 ≤ µ ≤ 62.<br />
All three of these conditions must be met,<br />
so<br />
52 < µ < 58.<br />
(b) Note that the first <strong>and</strong> last intervals in the<br />
list do not overlap, so they cannot both be<br />
correct. Thus, the three correct intervals<br />
nature refers to are either: the first three or<br />
the last three. If the first three:<br />
if the last three:<br />
37 ≤ µ ≤ 52;<br />
58 ≤ µ ≤ 62.<br />
So the answer is that µ is in the interval<br />
[37,52] or the interval [58,62].<br />
9. (a) 0.05 < P-value < 0.10.<br />
(b) P-value < 0.005.<br />
(c) P-value = 0.20.<br />
10. (a) 740/860 = 0.860.<br />
(b) 108/860 = 0.126.<br />
(c) 12/120 = 0.100.<br />
(d) (12 + 42)/860 = 54/860 = 0.063.<br />
(e) 698/(698 + 108) = 698/806 = 0.866.<br />
11. Let A denote female <strong>and</strong> B denote a parent.<br />
(a) We get the following table:<br />
B B c Total<br />
A 768 192 960<br />
A c 216 324 540<br />
Total 984 516 1500<br />
(This table is acceptable only b/c I previously<br />
defined A <strong>and</strong> B; without those definitions,<br />
this table would lose points.)<br />
(b) 768/984 = 0.780.<br />
12. (a) Her predicted value is<br />
(b) Her residual is<br />
(c) His x satisfies<br />
ŷ = 32 + 0.4(60) = 56.<br />
e = 52 − 56 = −4.<br />
56 = 32 + 0.4x,<br />
which yields x = 60.<br />
13. The final is X <strong>and</strong> the midterm is Y . Thus,<br />
¯x = 85.0,s X = 14.00,ȳ = 45.0,<br />
s Y = 7.00, <strong>and</strong> r = 0.64.<br />
5
Thus,<br />
b 1 = 0.64(7/14) = 0.32, <strong>and</strong><br />
b 0 = 45 − 0.32(85) = 17.8.<br />
The regression line is<br />
ŷ = 17.8 + 0.32x.<br />
14. Math is X <strong>and</strong> vocabulary is Y . For Eric, x =<br />
40 <strong>and</strong> y = 60. Also, ¯x = 45 <strong>and</strong> ȳ = 50.<br />
<strong>Final</strong>ly, Eric’s residual for Diane’s line is e =<br />
−10. The regression equation is<br />
16. There are no r’s in this list, so that should alert<br />
you how to do the problem. The slope, 6, must<br />
equal<br />
rs Y /s X .<br />
In (a) <strong>and</strong> (d), s Y /s X = 4. Thus, remembering<br />
−1 ≤ r ≤ +1, the slope must be between −4<br />
<strong>and</strong> +4. Thus, (a) <strong>and</strong> (d) are wrong.<br />
Next,<br />
b 0 = ȳ − b 1¯x = 20.<br />
This is true for (b) <strong>and</strong> (e), but not (c). Thus, (b)<br />
<strong>and</strong> (e) could be for this regression line.<br />
ŷ = b 0 + b 1 x.<br />
We need to solve this for the two unknowns, b 0<br />
<strong>and</strong> b 1 . Using the law of the preservation of<br />
mediocrity,<br />
50 = b 0 + 45b 1 .<br />
Using information on Eric,<br />
70 = b 0 + 40b 1 .<br />
Subtracting these, we get<br />
5b 1 = −20, or b 1 = −4.<br />
Thus,<br />
50 = b 0 − 180, or b 0 = 230.<br />
Thus, the regression line is<br />
ŷ = 230 − 4x.<br />
15. The fact that the e’s sum to zero implies:<br />
e 0 + e 2 = −1.<br />
The fact that the xe’s sum to zero implies:<br />
2e 2 = 1.<br />
Thus, e 2 = 0.5 <strong>and</strong> e 0 = −1.5.<br />
6