Download as a PDF - CiteSeerX
Download as a PDF - CiteSeerX
Download as a PDF - CiteSeerX

You also want an ePaper? Increase the reach of your titles
YUMPU automatically turns print PDFs into web optimized ePapers that Google loves.
D11206<br />
HALTHORE ET AL.: SHORTWAVE MODEL INTERCOMPARISON<br />
D11206<br />
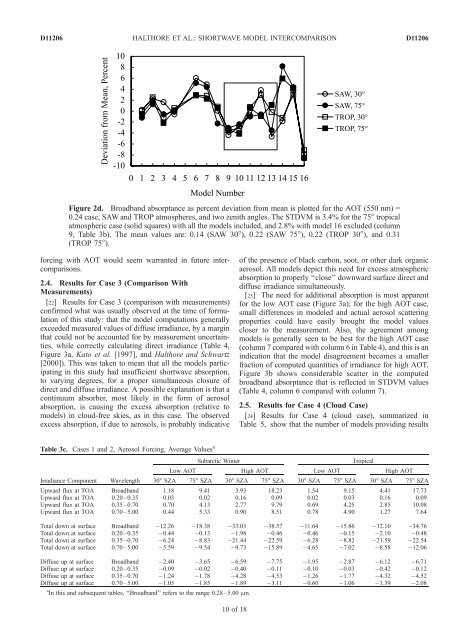
Figure 2d. Broadband absorptance <strong>as</strong> percent deviation from mean is plotted for the AOT (550 nm) =<br />
0.24 c<strong>as</strong>e, SAW and TROP atmospheres, and two zenith angles. The STDVM is 3.4% for the 75° tropical<br />
atmospheric c<strong>as</strong>e (solid squares) with all the models included, and 2.8% with model 16 excluded (column<br />
9, Table 3b). The mean values are: 0.14 (SAW 30°), 0.22 (SAW 75°), 0.22 (TROP 30°), and 0.31<br />
(TROP 75°).<br />
forcing with AOT would seem warranted in future intercomparisons.<br />
2.4. Results for C<strong>as</strong>e 3 (Comparison With<br />
Me<strong>as</strong>urements)<br />
[22] Results for C<strong>as</strong>e 3 (comparison with me<strong>as</strong>urements)<br />
confirmed what w<strong>as</strong> usually observed at the time of formulation<br />
of this study: that the model computations generally<br />
exceeded me<strong>as</strong>ured values of diffuse irradiance, by a margin<br />
that could not be accounted for by me<strong>as</strong>urement uncertainties,<br />
while correctly calculating direct irradiance (Table 4,<br />
Figure 3a, Kato et al. [1997], and Halthore and Schwartz<br />
[2000]). This w<strong>as</strong> taken to mean that all the models participating<br />
in this study had insufficient shortwave absorption,<br />
to varying degrees, for a proper simultaneous closure of<br />
direct and diffuse irradiance. A possible explanation is that a<br />
continuum absorber, most likely in the form of aerosol<br />
absorption, is causing the excess absorption (relative to<br />
models) in cloud-free skies, <strong>as</strong> in this c<strong>as</strong>e. The observed<br />
excess absorption, if due to aerosols, is probably indicative<br />
of the presence of black carbon, soot, or other dark organic<br />
aerosol. All models depict this need for excess atmospheric<br />
absorption to properly ‘‘close’’ downward surface direct and<br />
diffuse irradiance simultaneously.<br />
[23] The need for additional absorption is most apparent<br />
for the low AOT c<strong>as</strong>e (Figure 3a); for the high AOT c<strong>as</strong>e,<br />
small differences in modeled and actual aerosol scattering<br />
properties could have e<strong>as</strong>ily brought the model values<br />
closer to the me<strong>as</strong>urement. Also, the agreement among<br />
models is generally seen to be best for the high AOT c<strong>as</strong>e<br />
(column 7 compared with column 6 in Table 4), and this is an<br />
indication that the model disagreement becomes a smaller<br />
fraction of computed quantities of irradiance for high AOT.<br />
Figure 3b shows considerable scatter in the computed<br />
broadband absorptance that is reflected in STDVM values<br />
(Table 4, column 6 compared with column 7).<br />
2.5. Results for C<strong>as</strong>e 4 (Cloud C<strong>as</strong>e)<br />
[24] Results for C<strong>as</strong>e 4 (cloud c<strong>as</strong>e), summarized in<br />
Table 5, show that the number of models providing results<br />
Table 3c. C<strong>as</strong>es 1 and 2, Aerosol Forcing, Average Values a<br />
Subarctic Winter<br />
Tropical<br />
Low AOT High AOT Low AOT High AOT<br />
Irradiance Component Wavelength 30° SZA 75° SZA 30° SZA 75° SZA 30° SZA 75° SZA 30° SZA 75° SZA<br />
Upward flux at TOA Broadband 1.18 9.41 3.93 18.23 1.54 9.15 4.41 17.73<br />
Upward flux at TOA 0.20–0.35 0.03 0.02 0.16 0.09 0.02 0.03 0.16 0.09<br />
Upward flux at TOA 0.35–0.70 0.70 4.13 2.77 9.79 0.69 4.25 2.85 10.08<br />
Upward flux at TOA 0.70–5.00 0.44 5.33 0.90 8.51 0.78 4.90 1.27 7.64<br />
Total down at surface Broadband 12.26 18.38 33.03 38.57 11.64 15.86 32.10 34.76<br />
Total down at surface 0.20–0.35 0.44 0.13 1.98 0.46 0.46 0.15 2.10 0.48<br />
Total down at surface 0.35–0.70 6.24 8.83 21.44 22.59 6.28 8.82 21.59 22.54<br />
Total down at surface 0.70–5.00 5.59 9.54 9.73 15.89 4.65 7.02 8.58 12.06<br />
Diffuse up at surface Broadband 2.40 3.65 6.59 7.75 1.95 2.87 6.12 6.71<br />
Diffuse up at surface 0.20–0.35 0.09 0.02 0.40 0.11 0.10 0.03 0.42 0.12<br />
Diffuse up at surface 0.35–0.70 1.24 1.78 4.28 4.53 1.26 1.77 4.32 4.52<br />
Diffuse up at surface 0.70–5.00 1.05 1.85 1.89 3.11 0.60 1.06 1.39 2.08<br />
a In this and subsequent tables, ‘‘Broadband’’ refers to the range 0.28–5.00 mm.<br />
10 of 18