

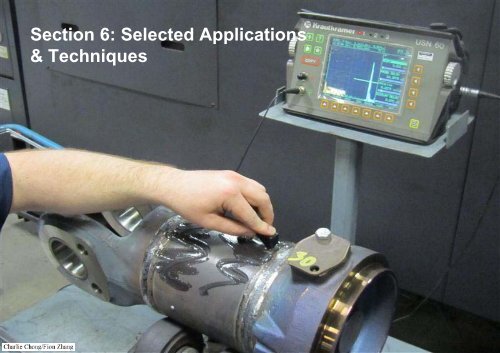
Section 6: Selected Applications & Techniques
UT testing self study notes
UT testing self study notes

Create successful ePaper yourself
Turn your PDF publications into a flip-book with our unique Google optimized e-Paper software.
<strong>Section</strong> 6: <strong>Selected</strong> <strong>Applications</strong><br />
& <strong>Techniques</strong>
Content: <strong>Section</strong> 6: <strong>Selected</strong> <strong>Applications</strong> & <strong>Techniques</strong><br />
6.1: Defects & Discontinuities<br />
6.2: Rail Inspection<br />
6.3: Weldments (Welded Joints)<br />
6.4: Pipe & Tube<br />
6.5: Echo Dynamic<br />
6.6: Technique Sheets<br />
6.7: Material Properties-Elastic Modulus Measurements<br />
6.8: High Temperature Ultrasonic Testing<br />
6.9: Thickness Gauging<br />
6.10: In-Service Inspection<br />
Continues next page….
6.11: Casting<br />
6.12: Inspection of bonded Joints<br />
6.13: Corrosion Monitoring<br />
6.14: Crack Monitoring<br />
6.15: Residual Stress Measurements<br />
6.16: Bond Testing<br />
Appendix: (Non-exam)<br />
6.App-1: TOFD Introduction
6.1: Defects & Discontinuities
6.1.1 Casting Defects & Discontinuities
Casting Defects & Discontinuities
Casting Defects & Discontinuities- A Cold Shut is caused when a molten<br />
metal is poured over solidified metal without fusing.
Casting Defects & Discontinuities – Hot tear or shrinkage crack forms<br />
when the molten section of unequal thickness solidified and the shrinkage<br />
stress tear the partially molten apart.
Casting Defects & Discontinuities
Micro-shrinkage is usually many small subsurface holes that appear at the<br />
gate of casting / can also occur when molten metal must flow from a thin<br />
section into thicker section of casting.<br />
Blow hole are small hole at the surface of the casting caused by gas which<br />
comes from the mold itself. (wet sand mould forming steam resulting in blowhole)<br />
Porosity is caused by entrapped gas. It is usually subsurface or surface<br />
depending on the mold design.
Casting Defects & Discontinuities
Casting Defects & Discontinuities- Hot Tear
Casting Defects & Discontinuities- Blister
Casting Defects & Discontinuities- Porosity
Casting Defects & Discontinuities- Porosity
Casting Defects & Discontinuities- Porosity
Casting Defects & Discontinuities- Porosity
Casting Defects & Discontinuities - Mismatch
Casting Defects & Discontinuities- Cold Shut
Casting Defects & Discontinuities- Missrun
Casting Defects & Discontinuities- Misrun
Casting Defects & Discontinuities- Blow Hole
Casting Defects & Discontinuities- Gas Porosity
Casting Defects & Discontinuities- Porosity
Casting Defects & Discontinuities- Cold Shut
Casting Defects & Discontinuities- Shrinkage Cavity
Casting Defects & Discontinuities- Assorted
6.1.2 Processing Defects & Discontinuities
Processing Defects & Discontinuities
Salute to the Steel Workers!
Processing Defects & Discontinuities- Lamination formed when the<br />
casting defects are flatten during rolling, forging, extrusion or other<br />
mechanical working processes.
Processing Defects & Discontinuities- Stringers formed when the billet is<br />
rolled into shape the casting non metallic inclusions are squeezed into long<br />
and thinner inclusions.
Processing Defects & Discontinuities- Forging lap is caused by folding of<br />
metal on the surface, usually when some of the metal is squuaed ot between<br />
the two dies.
Processing Defects & Discontinuities- Forging burst is a rupture causes<br />
by forging at improper temperature. The burst may be internal or external.
Processing Defects & Discontinuities
Q9: The preferred method of ultrasonically inspecting a complex-shape<br />
forging:<br />
A. Is an automated immersion test of the finished forging using instrument<br />
containing a calibrated attenuator in conjunction with a C-scan recorder<br />
B. Combined thorough inspection of the billet prior to forging with a<br />
careful inspection of the finished part in all areas where shape permit<br />
C. Is a manual contact test of the finished part<br />
D. Is an automated immersion test of the billet prior to forging
6.1.3 Welding Defects & Discontinuities
Welding Defects & Discontinuities
Welding Defects & Discontinuities
Welding Defects & Discontinuities
Welding Defects & Discontinuities
Welding Defects & Discontinuities
Welding Defects & Discontinuities
Welding Defects & Discontinuities- Incomplete Penetration
Welding Defects & Discontinuities- Slag Inclusion
Welding Defects & Discontinuities- Cluster Porosity
Welding Defects & Discontinuities- Lack of Sidewall Fusion (with Slag<br />
entrapped)
Welding Defects & Discontinuities- Wagon Track<br />
(slag inclusion at hot pass)
Welding Defects & Discontinuities- Burn Thru
Welding Defects & Discontinuities- Offset with LOP
Welding Defects & Discontinuities- Excessive Penetration
Welding Defects & Discontinuities- Internal (Root) Under Cut
Welding Defects & Discontinuities- Transverse Crack
Welding Defects & Discontinuities- Tungsten Inclusion
Welding Defects & Discontinuities- Root Pass Porosity
6.1.4 Service Induced Defects & Discontinuities
Service Induced Defects & Discontinuities<br />
http://failure-analysis.info/2010/05/analyzing-material-fatigue/
Service Induced Defects & Discontinuities- Fatigue Cracks
Figure 4-24 – In a carbon steel sample, metallographic section through a<br />
thermal fatigue crack indicates origin at the toe of an attachment weld. Mag.<br />
50X, etched.
Figure 4-26 – Metallographic cross-section of a superheated steam outlet that<br />
failed from thermal fatigue. Unetched.
Figure 4-36 – Weld detail used to join a carbon steel elbow (bottom) to a weld<br />
overlaid pipe section (top) in high pressure wet H2S service. Sulfide stress<br />
cracking (SSC) occurred along the toe of the weld (arrow), in a narrow zone<br />
of high hardness.
Figure 4-37 – High magnification photomicrograph of SSC in pipe section<br />
shown in Figure 4-36.
Figure 4-38 – Failure of DMW joining 1.25Cr-0.5Mo to Alloy 800H in a Hydrodealkylation<br />
(HAD) Reactor Effluent Exchanger. Crack propagation due to<br />
stresses driven at high temperature of 875°F (468°C) and a hydrogen<br />
partial pressure of 280 psig (1.93 MPa).
Figure 4-57 – Vibration induced fatigue of a 1-inch socket weld flange in a<br />
thermal relief system shortly after startup.
Figure 4-58 – Cross-sectional view of the crack in the socket weld in Figure 4-<br />
57.
Figure 5-1 – Localized amine corrosion at the weld found in piping from<br />
reboiler to regenerator tower in an MEA unit. Many other similar cases found,<br />
some going as deep as half thickness. They were originally found and<br />
mistaken as cracks with shear wave UT inspection.
Figure 5-2 – Hot Lean Amine Corrosion of Carbon Steel:
Figure 5-3 – Preferential weld corrosion in lean amine (Reference 5)
Figure 5-46 – Overhead interstage knockout drum vapor outlet nozzle.
Figure 5-47 – Carbonate cracking adjacent to a weld (Reference 6).
Figure 5-48 – Metallographic sample showing intergranular carbonate<br />
cracking developed after 6 months service (Reference 6).lean amine<br />
(Reference 5)
Figure 5-49 – Most cracks originate in base metal but this weldment<br />
contained a crack that originated at the root and propagated through the weld<br />
metal. Other cracks appear to have initiated in the HAZ (Reference 7).
6.2: Rail Inspection
Rail Inspection<br />
One of the major problems that railroads have faced since the earliest days is<br />
the prevention of service failures in track. As is the case with all modes of<br />
high-speed travel, failures of an essential component can have serious<br />
consequences. The North American railroads have been inspecting their<br />
most costly infrastructure asset, the rail, since the late 1920's. With increased<br />
traffic at higher speed, and with heavier axle loads in the 1990's, rail<br />
inspection is more important today than it has ever been. Although the focus<br />
of the inspection seems like a fairly well-defined piece of steel, the testing<br />
variables present are significant and make the inspection process challenging.<br />
Rail inspections were initially performed solely by visual means. Of course,<br />
visual inspections will only detect external defects and sometimes the subtle<br />
signs of large internal problems.
The need for a better inspection method became a high priority because of a<br />
derailment at Manchester, NY in 1911, in which 29 people were killed and 60<br />
were seriously injured. In the U.S. Bureau of Safety's (now the National<br />
Transportation Safety Board) investigation of the accident, a broken rail was<br />
determined to be the cause of the derailment. The bureau established that the<br />
rail failure was caused by a defect that was entirely internal and probably<br />
could not have been detected by visual means. The defect was called a<br />
transverse fissure (example shown on the bottom). The railroads began<br />
investigating the prevalence of this defect and found transverse fissures were<br />
widespread.
Transverse Fissure
Transverse Fissure
Transverse Fissure
One of the methods used to inspect rail is ultrasonic inspection. Both<br />
normal- and angle-beam techniques are used, as are both pulse-echo and<br />
pitch-catch techniques. The different transducer arrangements offer different<br />
inspection capabilities. Manual contact testing is done to evaluate small<br />
sections of rail but the ultrasonic inspection has been automated to allow<br />
inspection of large amounts of rail.<br />
Fluid filled wheels or sleds are often used to couple the transducers to the<br />
rail. Sperry Rail Services, which is one of the companies that perform rail<br />
inspection, uses Roller Search Units (RSU's) comprising a combination of<br />
different transducer angles to achieve the best inspection possible. A<br />
schematic of an RSU is shown below.
<strong>Techniques</strong>: Wheel Probe
<strong>Techniques</strong>: Examples of axles with outside bearings of the Deutsche<br />
Bundesbahn. (a) Of goods truck; (b) axle with roller bearing, bearing ring not<br />
removed; c same with additional brake disc
<strong>Techniques</strong>: (c) same with additional brake disc
6.3: Weldments (Welded Joints)
6.3.1: UT of Weldments (Welded Joints)<br />
The most commonly occurring defects in welded joints are porosity, slag<br />
inclusions, lack of side-wall fusion, lack of inter-run fusion, lack of root<br />
penetration, undercutting, and longitudinal or transverse cracks.<br />
With the exception of single gas pores all the defects listed are usually well<br />
detectable by ultrasonics. Most applications are on low-alloy construction<br />
quality steels, however, welds in aluminum can also be tested. Ultrasonic flaw<br />
detection has long been the preferred method for nondestructive testing in<br />
welding applications. This safe, accurate, and simple technique has pushed<br />
ultrasonics to the forefront of inspection technology.<br />
Ultrasonic weld inspections are typically performed using a straight beam<br />
transducer in conjunction with an angle beam transducer and wedge. A<br />
straight beam transducer, producing a longitudinal wave at normal incidence<br />
into the test piece, is first used to locate any laminations in or near the heataffected<br />
zone. This is important because an angle beam transducer may not<br />
be able to provide a return signal from a laminar flaw.
UT of Weldments (Welded Joints)<br />
F<br />
s<br />
0 20 40 60 80 100<br />
x<br />
a = s sinß<br />
a' = a - x<br />
d' = s cosß<br />
d = 2T - t'<br />
a<br />
a'<br />
ß = probe angle<br />
s = sound path<br />
a = surface distance<br />
a‘ = reduced surface distance<br />
d‘ = virtual depth<br />
d = actual depth<br />
T = material thickness<br />
ß<br />
Work piece with welding<br />
s<br />
Lack of fusion<br />
d
UT Calculator
Flaw Detection- Depth Determination
The second step in the inspection involves using an angle beam transducer<br />
to inspect the actual weld. Angle beam transducers use the principles of<br />
refraction and mode conversion to produce refracted shear or longitudinal<br />
waves in the test material. [Note: Many AWS inspections are performed using<br />
refracted shear waves. However, material having a large grain structure, such<br />
as stainless steel may require refracted longitudinal waves for successful<br />
inspections.] This inspection may include the root, sidewall, crown, and heataffected<br />
zones of a weld. The process involves scanning the surface of the<br />
material around the weldment with the transducer. This refracted sound wave<br />
will bounce off a reflector (discontinuity) in the path of the sound beam. With<br />
proper angle beam techniques, echoes returned from the weld zone may<br />
allow the operator to determine the location and type of discontinuity.
T = Plate Thickness<br />
ϴ = Shear wave angle<br />
LEG = T/Cos ϴ, V path= 2 x LEG.<br />
Skip = 2.T Tan ϴ
https://www.mandinasndt.com/index.php?option=com_content&view=article&id=32%253A<br />
ut-angle-beam-calculator&catid=12%253Atools&Itemid=18<br />
https://www.nde-ed.org/GeneralResources/Formula/AngleBeamFormula/AngleBeamTrig.htm
Flaw Detection- Triangulations of reflector<br />
ϴ = Refracted angle T= Thickness LEG1=LEG2= T/Cos ϴ<br />
V PATH= 2x LEG= 2T/Cos ϴ<br />
SKIP= 2.T Tan ϴ<br />
ϴ
Flaw Detection- Triangulations of reflector<br />
ϴ = Refracted angle T= Thickness Surface Distance= S.Sin ϴ<br />
Depth= S.Cos ϴ<br />
ϴ
To determine the proper scanning area for the weld, the inspector must first<br />
calculate the location of the sound beam in the test material. Using the<br />
refracted angle, beam index point and material thickness, the V-path and skip<br />
distance of the sound beam is found. Once they have been calculated, the<br />
inspector can identify the transducer locations on the surface of the material<br />
corresponding to the crown, sidewall, and root of the weld.
6.3.2 Weld Scanning
Expert at works
Typical Scanning Patterns:<br />
Typically the weld should be inspected in the 1 st or 2 nd leg (1 st Skip).
Typically scanning patterns
Weld Scanning
Weld Scanning
Weld Scanning
Weld Scanning
Echo Dynamic- Position of Defects<br />
Sometimes it will be possible to differentiate between these 2 defects simply<br />
by plotting their position within the weld zone:
Echo Dynamic- Position of Defects
Plate Weld Scanning
Plate Weld Scanning
Plate Weld Scanning
Plate Weld Scanning
Plate Weld Scanning
Practice Makes Perfect<br />
52. One of the most apparent characteristics of a discontinuity echo, as<br />
opposed to a non-relevant indication is:<br />
(a) Lack of repeatability<br />
(b) Sharp, distinct signal<br />
(c) Stable position with fixed transducer position<br />
(d) High noise level<br />
58. What useful purpose may be served by maintaining grass on the baseline?<br />
(a) To estimate casting grain size<br />
(b) To provide a reference for estimating signal to noise ratio<br />
(c) To verify adequate coupling to the test piece<br />
(d) All of the above
Practice Makes Perfect<br />
62. Which of the following conditions would be most likely to cause strong,<br />
interfering surface waves?<br />
(a) High frequency transducers<br />
(b) Testing on a small diameter surface<br />
(c) Testing on a flat surface<br />
(d) Testing on a curved surface with a contoured wedge and transducer
6.4: Pipe & Tube
Pipe & Tube
Pipe & Tube
Experts at work
Pipe Scanning
Pipe Scanning
Pipe Scanning<br />
48.59 o max<br />
30 o max
Pipe Scanning
Pipe Scanning
Pipe Scanning- thickness/OD ratio
Pipe Scanning- thickness/OD ratio<br />
When the t/OD ratio = .2 , t=.2OD, ID=OD-2t= OD-.4OD= .6OD<br />
ϴ max = Sin -1 (ID/OD), ϴ max = Sin -1 (0.6), ϴ max = 37° Max.<br />
For the sound path to scans the inner face the maximum shear angle shall be<br />
37° Max. Therefore 45° /60° /70° probe can not scan the pipe inner face.
Pipe Scanning- Contact Methods
Pipe Scanning- Contact Methods
Pipe Scanning- Contact Methods
Q: Calculate the maximum shear wave angle and the range for 360°<br />
revolution scanning when the shear wave angle is 45°.<br />
Given that the OD=6” Thickness=3/4”<br />
Answer:<br />
(a)<br />
The maximum shear wave angle ϴ = Sin -1 (ID/OD) = Sin -1 (2.25/3)<br />
ϴ = 48.6° Max.<br />
(b) ?
Answer part B<br />
c<br />
a<br />
b<br />
a/Sin A = b/Sin B<br />
2.25/ Sin 45 = b / Sin B, 3.182= b/ Sin B,<br />
c = a.Sin B, Sin B= c/a<br />
3.182= b/c x 2.25, b/c= 1.414
Q35: During immersion testing of pipe or tubing the incident longitudinal wave<br />
angle must be limited to a narrow range. The reason for the upper limit is:<br />
(a) To avoid complete reflection of ultrasound from the test piece<br />
(b) To prevent formation of Rayleigh waves<br />
(c) To prevent formation of shear waves<br />
(d) To avoid saturating the test piece with ultrasound
Q35: Which of the following may result in a narrow rod if the beam<br />
divergence results in a reflection from a side of the test piece before the<br />
sound wave reaches the back surface:<br />
A. Multiple indications before the first back reflection<br />
B. Indications from multiple surface reflections<br />
C. Conversion from longitudinal mode to shear mode<br />
D. Loss of front surface indications
6.5: Echo Dynamic
Expert at works
6.5.1 Basic echodynamic pattern of reflectors<br />
Echo Dynamic of Discontinuity- Non-destructive testing of welds -<br />
Ultrasonic testing - Characterization of indications in welds; German version<br />
EN 1713:1998 + A1:2002
Basic echodynamic pattern of reflectors<br />
C.1 Pattern 1<br />
Point-like reflector response, figure C.1. At any probe position the A-scan<br />
show a single sharp echo. As the probe is moved this rises in amplitude<br />
smoothly to a single maximum before falling smoothly to noise level.<br />
4<br />
5<br />
2<br />
3<br />
6<br />
1<br />
7
C.1 Pattern 1 Point-like reflector
C.1 Pattern 1 Point-like reflector
C.2 Pattern 2<br />
Extended (elongated) smooth reflector respond, figure C.2. At any probe<br />
position the A-scan shows a single sharp echo. When the ultrasound beam is<br />
moved over the reflector the echo rises smoothly to a plateau and is<br />
maintained with minor variation in magnitude up to 4 dB, until the beam<br />
moves off the reflector, when the echo fall smoothly to noise level.
C.2 Pattern 2<br />
Extended (elongated) smooth reflector
C.2 Pattern 2<br />
Extended (elongated) smooth reflector
C.2 Pattern 2<br />
Extended (elongated) smooth reflector<br />
(figure modified to depict obliquely oriented planar face)<br />
Extended (elongated)<br />
smooth reflector-planar<br />
face obliquely oriented
C.3 Pattern 3<br />
Extended (elongated) rough reflector response. There are two variants of this<br />
pattern, depending upon the angle of incident of the probe beam on the<br />
reflector.
C.3 Pattern 3a<br />
Extended (elongated) rough reflector response. Near normal incidence, figure<br />
C.3a At any probe position the A-scan shows a single but rugged echo. As<br />
the probe moved this may undergo large (>+/- 6dB) random fluctuation in<br />
amplitude. The fluctuation are caused by reflection from the different facets of<br />
the reflector and by interference of waves scattered from the groups of facets.
C.3 Pattern 3a<br />
Extended (elongated) rough reflector response.
C.3 Pattern 3a<br />
Extended (elongated) rough reflector response.
C.3 Pattern 3b<br />
Oblique incidence, travelling echo pattern, figure C.3 b At any probe position,<br />
the A-scan shows an extended train of signals (subsidiary peaks) within a<br />
bell-shaped pulse envelope. As the probe is moved each subsidiary peak<br />
travels through the pulse envelop, rising to its own maximum toward the<br />
center envelop and then falling. The overall signal may shown large (>+/-6dB)<br />
random fluctuation in amplitude.
C.3 Pattern 3b<br />
Oblique incidence, travelling echo pattern
C.3 Pattern 3b<br />
Oblique incidence, travelling echo pattern
C.4 Pattern 4<br />
Multiple reflector respond, figure C.4. At any probe position the A-scan shows<br />
a cluster of signal which may or may not be well resolved in range. As the<br />
probe is moved the signals rise and fall at random but the signal from each<br />
separate reflector element ,if resolved, shows pattern 1 respond.
C.4 Pattern 4<br />
Multiple reflector respond
C.4 Pattern 4<br />
Multiple reflector respond
Echodynamic- Change of echo height and echo shape when the direction of<br />
irradiation is changed. (a) On flat or linear flaw; (b) on rounded flaw
Echodynamic- Differences between the indications of inclusions and cracks,<br />
drawn schematically and exaggerated for greater clarity. a Inclusions; b flake<br />
cracks. The echoes of the more distantflaws, because of divergence and<br />
attenuation of the sound beam, are rather weak
Break Time
Echo Dynamic of Discontinuity- Flaw detection
Echo Dynamic of Discontinuity- Flaw Detection
Echo Dynamic of Discontinuity- Flaw detections
Echo Dynamic of Discontinuity- Improper flaw orientation
Echo Dynamic of Discontinuity- Improper flaw orientation
Echo Dynamic of Discontinuity- Reflection angle
Echo Dynamic of Discontinuity- Angles of reflection
Echo Dynamic of Discontinuity- Improper flaw orientation
Echo Dynamic of Discontinuity- Perfect flaw orientation
Echo Dynamic of Discontinuity- Improper flaw orientation
Echo Dynamic of Discontinuity- Vertical near surface flaw
Echo Dynamic of Discontinuity- Tandem <strong>Techniques</strong>
Echo Dynamic of Discontinuity- Tandem <strong>Techniques</strong>
Echo Dynamic of Discontinuity- Tandem <strong>Techniques</strong>
Echo Dynamic
Echo Dynamic- Root Concavity
Echo Dynamic
Echo Dynamic
Echo Dynamic
Echo Dynamic
Echo Dynamic<br />
Crack
Echo Dynamic- Broad indication with low amplitude
Echo Dynamic- Shaper indication and higher amplitude than porosity
Echo Dynamic
Echo Dynamic<br />
Threadlike defects, point defects and flat planar defects orientated nearnormal<br />
to the beam axis all produce an echo response which has a single<br />
peak
Echo Dynamic<br />
The echo response from a large slag inclusion or a rough crack is likely to<br />
have multiple peaks:
Echo Dynamic<br />
In case “a” it will be difficult to determine whether the defect is slag or a crack.<br />
“Rotational- Swivel” or “orbital” probe movements may help:
Echo Dynamic<br />
Typical Echo Dynamic Patterns
Echo Dynamic<br />
Typical Echo Dynamic Patterns
Echo Dynamic<br />
Typical Echo Dynamic Patterns
Q. A smooth flat discontinuity whose major plane is not perpendicular to the<br />
direction of sound propagation may be indicated by:<br />
A. An echo amplitude comparable in magnitude to the back surface reflection<br />
B. A complete loss of back surface reflection<br />
C. An echo amplitude larger in magnitude than the back surface reflection<br />
D. All of the above
Q183. In immersion testing, irrelevant or false indications caused by<br />
contoured surfaces are likely to result in a:<br />
A. Broad base indication<br />
B. Peaked indication<br />
C. Hashy signal<br />
D. Narrow based indication
Q24. During inspection of a parallel sided machined forging using straight<br />
beam immersion techniques, a diminishing back reflection in a localized<br />
area in the absence of a defect indication would least likely represent:<br />
A. A course grain structures<br />
B. A small non-metallic stringer<br />
C. A defect oriented at a severe angle to the entry surface<br />
D. A large inclusion.
Q46. Which best describes a typical display of a crack whose major surface is<br />
perpendicular to the ultrasound beam?<br />
A. A broad indication<br />
B. A sharp indication<br />
C. A indication will not show due to improper orientation<br />
D. A broad indication with high amplitude
Q46. A smooth flat discontinuities whose major plane is not perpendicular to<br />
the direction of sound propagation may be indicated by:<br />
A. An echo amplitude comparable in magnitude to the back surface reflection<br />
B. A complete loss of back surface reflection<br />
C. An echo amplitude larger in magnitude than the back surface reflection<br />
D. All of the above
6.6: Technique Sheets
Expert at works
Hanger Pin Testing using Shear Wave<br />
http://www.fhwa.dot.gov/publications/research/infrastructure/structures/04042/index.cfm#toc
Physical Dimension
Physical Dimension
Physical Dimension
Physical Dimension
Reporting: Basic Pin Information
Reporting: Scanning Report – Top of Pin
Reporting: Scanning Report – Bottom of Pin
Mock-Up
Mock-Up
Mock-Up
Mock-Up
Mock-Up
Reporting: Basic Pin Information
Hanger Pin Testing using Shear Wave
Pitch and Catch Methods- Echo Dynamic
Pitch and Catch Methods- Set-up
Pitch and Catch Methods- Echo Dynamic
6.7: Material Properties-<br />
Elastic Modulus Measurements
6.7.1 Determination of Microstructural Differences<br />
Ultrasonic methods can be used to determine microstructural differences in<br />
metals. For this, contact testing with the pulse-echo technique is used. The<br />
testing can be either the measurement of (1) ultrasonic attenuation or the (2)<br />
measurement of bulk sound velocity.
6.7.2 The attenuation method<br />
The attenuation method is based on the decay of multiple echoes from test<br />
piece surfaces. Once a standard is established, other test pieces can be<br />
compared to it by comparing the decay of these echoes to an exponential<br />
curve. This test is especially suited for the microstructural control of<br />
production parts, in which all that is necessary is to determine whether or not<br />
the parts conform to a standard. An example of the use of ultrasonic<br />
attenuation in the determination of differences in microstructure is the control<br />
of graphite-flake size in gray iron castings, which in turn controls tensile<br />
strength. In one application, a water-column search unit that produced a<br />
pulsed beam with a frequency of 2.25 MHz was used to test each casting<br />
across an area of the casting wall having uniform thickness and parallel front<br />
and back surfaces.
A test program had been first carried out to determine the maximum size of<br />
graphite flakes that could be permitted in the casting and still maintain a<br />
minimum tensile strength of 200 MPa (30 ksi). Then, ultrasonic tests were<br />
made on sample castings to determine to what intensity level the second<br />
back reflection was lowered by the attenuation effects of graphite flakes larger<br />
than permitted. Next, a gate was set on the ultrasonic instrument in the region<br />
of the second back reflection, and an alarm was set to signal whenever the<br />
intensity of this reflection was below the allowable level. The testing<br />
equipment was then integrated into an automatic loading conveyor, where the<br />
castings were 100% inspected and passed or rejected before any machining<br />
operation.
6.7.3 Velocity Measurements<br />
Velocity Measurements When considering the compressional and shear<br />
wave velocities given in Table 1, there may be small deviations for crystalline<br />
materials because of elastic anisotropy. This is important and particularly<br />
evident in copper, brass, and austenitic steels. The following example<br />
illustrates the variation of sound velocity with changes in the microstructure of<br />
leaded free-cutting brass.
6.7.4 Elastic Modulus Measurement<br />
Application:<br />
Measurement on Young's Modulus and Shear Modulus of Elasticity, and<br />
Poisson's ratio, in non-dispersive isotropic engineering materials.<br />
Background:<br />
1. Young's Modulus of Elasticity is defined as the ratio of stress (force per<br />
unit area) to corresponding strain (deformation) in a material under tension<br />
or compression.<br />
2. Shear Modulus of Elasticity is similar to the ratio of stress to strain in a<br />
material subjected to shear stress.<br />
3. Poisson's Ratio is the ratio of transverse strain to corresponding axial<br />
strain on a material stressed along one axis.<br />
http://www.olympus-ims.com/en/applications/elastic-modulus-measurement/<br />
http://www.olympus-ims.com/en/applications/?347[search][sCategoryId][1166017122]=1166017163&347[search][submit]=Search
Elastic Modulus Measurement – Young’s Modulus & Shear Modulus<br />
http://en.wikipedia.org/wiki/Shear_modulus
Elastic Modulus Measurement- Poisson Ratio
These basic material properties, which are of interest in many manufacturing<br />
and research applications, can be determined through computations based<br />
on measured sound velocities and material density.<br />
Sound velocity can be easily measured using ultrasonic pulse-echo<br />
techniques with appropriate equipment. The general procedure outlined<br />
below is valid for any (1) homogeneous, (2) isotropic, (3) non-dispersive<br />
material (velocity does not change with frequency).<br />
This includes most common metals, industrial ceramics, and glasses as long<br />
as cross sectional dimensions are not close to the test frequency wavelength.<br />
Rigid plastics such as polystyrene and acrylic can also be measured,<br />
although they are more challenging due to higher sound attenuation.<br />
Keyword:<br />
non-dispersive material (velocity does not change with frequency).
Rubber cannot be characterized ultrasonically because of its high dispersion<br />
and nonlinear elastic properties. Soft plastics similarly exhibit very high<br />
attenuation in shear mode and as a practical matter usually cannot be tested.<br />
In the case of anisotropic materials, elastic properties vary with direction, and<br />
so do longitudinal and/or shear wave sound velocity. Generation of a full<br />
matrix of elastic moduli in anisotropic specimens typically requires six<br />
different sets of ultrasonic measurements.<br />
Porosity or coarse granularity in a material can affect the accuracy of<br />
ultrasonic modulus measurement since these conditions can cause variations<br />
in sound velocity based on grain size and orientation or porosity size and<br />
distribution, independent of material elasticity.<br />
Keyword:<br />
anisotropic materials, elastic properties vary with direction
Equipment:<br />
The velocity measurements for modulus calculation are most commonly<br />
made with precision thickness gages such as models 38DL PLUS and 45MG<br />
with Single Element software, or a flaw detector with velocity measurement<br />
capability such as the EPOCH series instruments. Pulser/receivers such as<br />
the Model 5072PR or 5077PR can also be used with an oscilloscope or<br />
waveform digitizer for transit time measurements.<br />
This test also requires two transducers appropriate to the material being<br />
tested, for pulse-echo sound velocity measurement in longitudinal and shear<br />
modes. Commonly used transducers include an M112 or V112 broadband<br />
longitudinal wave transducer (10 MHz) and a V156 normal incidence shear<br />
wave transducer (5 MHz). These work well for many common metal and fired<br />
ceramic samples. Different transducers will be required for very thick, very<br />
thin, or highly attenuating samples. Some cases may also require use of<br />
through transmission techniques, with pairs of transducers positioned on<br />
opposite sides of the part. It is recommended that in all cases the user consult<br />
Olympus for specific transducer recommendations and assistance with<br />
instrument setup.
The test sample may be of any geometry that permits clean pulse/echo<br />
measurement of sound transit time through a section on thickness. Ideally<br />
this would be a sample at least 0.5 in. (12.5 mm) thick, with smooth<br />
parallel surfaces and a width or diameter greater than the diameter of the<br />
transducer being used. Caution must be used when testing narrow<br />
specimens due to possible edge effects that can affect measured pulse<br />
transit time. Resolution will be limited when very thin samples are used<br />
due to the small changes in pulse transit time across short sound paths.<br />
For that reason we recommend that samples should be at least 0.2 in. (5<br />
mm) thick, preferably thicker. In all cases the thickness of the test sample<br />
must be precisely known.<br />
Keywords:<br />
1. Caution must be used when testing narrow specimens due to possible<br />
edge effects that can affect measured pulse transit time.<br />
2. Resolution will be limited when very thin samples are used due to the<br />
small changes in pulse transit time across short sound paths.
Testing Procedure: Equipment Used.<br />
Measure the (1) longitudinal and (2) shear wave sound velocity of the test<br />
piece using the appropriate transducers and instrument setup.<br />
The shear wave measurement will require use of a specialized high viscosity<br />
couplant such as our SWC. A Model 38DL PLUS a 45MG thickness gage<br />
can provide a direct readout of material velocity based on an entered sample<br />
thickness, and an EPOCH series flaw detector can measure velocity through<br />
a velocity calibration procedure. In either case, follow the recommended<br />
procedure for velocity measurement as described in the instrument's<br />
operating manual. If using a pulser/receiver, simply record the round-trip<br />
transit time through an area of known thickness with both longitudinal and<br />
shear wave transducers, and compute:<br />
Question: For measurement of shear wave velocity is normal incident<br />
transverse wave used? (hint by the used of highly viscous couplant<br />
requirement)
Testing Procedure: Velocity Measurements & Calculations<br />
Velocity= Distance / ( ½ Round trip traverse time)<br />
Convert units as necessary to obtain velocities expressed as inches per<br />
second or centimeters per second. (Time will usually have been measured in<br />
microseconds, so multiply in/uS or cm/uS by 10 6 to obtain in/S or cm/S.) The<br />
velocities thus obtained may be inserted into the following equations.<br />
Poisson Ratio (v) =<br />
Young’s Modulus =<br />
Shear Modulus =
Velocity & Equations<br />
Poisson Ratio (v) =<br />
Young’s Modulus (E) =<br />
Shear Modulus (G) = ,<br />
V L , V S<br />
v<br />
p<br />
= Longitudinal and Shear Velocity<br />
= Poisson ratio<br />
= Material density
Note on units: If sound velocity is expressed in cm/S and density in g/cm 3 ,<br />
then Young's modulus will be expressed in units of dynes/cm 2 . If English units<br />
of in/S and lbs/in 3 are used to compute modulus in pounds per square inch<br />
(PSI), remember the distinction between "pound" as a unit of force versus a<br />
unit of mass. Since modulus is expressed as a force per unit area, when<br />
calculating in English units it is necessary to multiply the solution of the above<br />
equation by a mass/force conversion constant of (1 / Acceleration of Gravity)<br />
to obtain modulus in PSI. Alternately, if the initial calculation is done in metric<br />
units, use the conversion factor 1 psi = 6.89 x 10⁴ dynes/cm 2 . Another<br />
alternative is to enter velocity in in/S, density in g/cm 3, and divide by a<br />
conversion constant of 1.07 x 10⁴ to obtain modulus in PSI.
6.8: High Temperature Ultrasonic Testing
Experts at work
1.0 Background:<br />
Although most ultrasonic flaw detection and thickness gauging is performed<br />
at normal environmental temperatures, there are many situations where it is<br />
necessary to test a material that is hot. This most commonly happens in<br />
process industries, where hot metal pipes or tanks must be tested without<br />
shutting them down for cooling, but also includes manufacturing situations<br />
involving hot materials, such as extruded plastic pipe or thermally molded<br />
plastic immediately after fabrication, or testing of metal ingots or castings<br />
before they have fully cooled. Conventional ultrasonic transducers will<br />
tolerate temperatures up to approximately 50° C or 125° F. At higher<br />
temperatures, they will eventually suffer permanent damage due to internal<br />
disbonding caused by thermal expansion. If the material being tested is hotter<br />
than approximately 50° C or 125° F, then high temperature transducers and<br />
special test techniques should be employed.<br />
http://www.olympus-ims.com/en/applications/high-temperature-ultrasonic-testing/
This application note contains quick reference information regarding selection<br />
of high temperature transducers and couplants, and important factors<br />
regarding their use. It covers conventional ultrasonic testing of materials at<br />
temperatures up to approximately 500°C or 1000°F. In research applications<br />
involving temperatures higher than that, highly specialized waveguide<br />
techniques are used. They fall outside the scope of this note.<br />
Testing Methods used:<br />
Methods used to increase the useful range for high temperature application<br />
are:<br />
■<br />
■<br />
■<br />
Delay Line<br />
High temperature Couplants<br />
Testing <strong>Techniques</strong> & Equipment Requirements
Temperature Limitation:<br />
Conventional ultrasonic<br />
transducers 50°C
Temperature Limitation:<br />
Conventional ultrasonic<br />
transducers 50°C
Temperature Limitation:<br />
Conventional ultrasonic<br />
transducers 50°C<br />
http://amazingunseentravel.blogspot.com/2011_08_28_archive.html
Temperature Limitation:<br />
Conventional ultrasonic<br />
transducers 50°C
Temperature Limitation:<br />
Conventional ultrasonic<br />
transducers 50°C<br />
http://www.wisdompetals.com/index.php/photos/138-wonder-of-the-world-crescent-lake-in-gopi-deser
Temperature Limitation:<br />
Conventional ultrasonic<br />
transducers 50°C<br />
http://www.wisdompetals.com/index.php/photos/138-wonder-of-the-world-crescent-lake-in-gopi-deser
敦 煌 大 漠 美 食 -50 度 火 锅 双 塔 鱼<br />
http://www.cc6uu.com/science/article/raiders/2407
High Temperature Conventional UT-<br />
Good Till & No-More.
2.0 Methods used for H.Temperature Scanning<br />
2.1 Transducers- H.Temperature Delay Line Material<br />
Panametrics-NDT high temperature transducers fall into two categories,<br />
■<br />
■<br />
dual element transducers and<br />
delay line transducers.<br />
In both cases, the delay line material (which is internal in the case of duals)<br />
serves as thermal insulation between the active transducer element and the<br />
hot test surface.<br />
For design reasons, there are no high temperature contact or immersion<br />
transducers in the standard product line. High temperature duals and delay<br />
line transducers are available for both thickness gaging and flaw detection<br />
applications. As with all ultrasonic tests, the best transducer for a given<br />
application will be determined by specific test requirements, including the<br />
material, the thickness range, the temperature, and in the case of flaw<br />
detection, the type and size of the relevant flaws.
(1a) Thickness gaging<br />
The most common application for high temperature thickness gaging is<br />
corrosion survey work, the measurement of remaining metal thickness of hot<br />
pipes and tanks with corrosion gages such as Models 38DL PLUS and 45MG.<br />
Most of the transducers that are designed for use with Olympus corrosion<br />
gages are suitable for high temperature use. The commonly used D790<br />
series transducers can be used on surfaces as hot as 500° C or 930° F. For a<br />
complete list of available corrosion gauging duals that includes temperature<br />
specifications, see this link: Corrosion Gage Duals.
For precision thickness gauging applications using the Models 38DL PLUS or<br />
Model 45MG with Single Element software ,such as hot plastics, any of the<br />
standard Micro-scan delay line transducers in the M200 series (including<br />
gage default transducers M202, M206, M207, and M208) can be equipped<br />
with high temperature delay lines. DLHT-1, -2, and -3 delay lines may be<br />
used on surfaces up to 260° C or 500° F. DLHT-101, -201, and -301 delay<br />
lines may be used on surfaces up to 175° C or 350° F. These delay lines are<br />
listed in the Delay Line Option Chart.
In challenging applications requiring low frequency transducers for increased<br />
penetration, the Videoscan Replaceable Face Transducers and appropriate<br />
high temperature delay lines can also be used with 38DL PLUS and 45MG<br />
thickness gages incorporating the HP (high penetration) software option.<br />
Custom transducer setups will be required. Standard delay lines for this<br />
family of transducers can be used in contact with surfaces as hot as 480° C<br />
or 900° F. For a full list of transducers and delay lines, see this link:<br />
Replaceable Face Transducers.
(1b) Flaw detection<br />
As in high temperature thickness gaging applications, high temperature flaw<br />
detection most commonly uses dual element or delay line transducers. All<br />
standard Panametrics-NDT flaw detection duals offer high temperature<br />
capability. Fingertip, Flush Case, and Extended Range duals whose<br />
frequency is 5 MHz or below may be used up to approximately 425° C or<br />
800° F, and higher frequency duals (7.5 and 10 MHz) may be used up to<br />
approximately 175° C or 350° F. For a full list of transducers in this category,<br />
see this link: Flaw Detection Duals.<br />
All of the Videoscan Replaceable Face Transducers can be used with<br />
appropriate high temperature delay lines in flaw detection applications. The<br />
available delay lines for this family of transducers can be used in contact with<br />
surfaces as hot as 480° C or 900° F. For a full list of transducers and delay<br />
lines suitable for various maximum temperatures, see this link: Replaceable<br />
Face Transducers.
<strong>Applications</strong> involving thin materials are often best handled by the delay line<br />
transducers in the V200 series (most commonly the V202, V206, V207, and<br />
V208), any of which can be equipped with high temperature delay lines.<br />
DLHT-1, -2, and -3 delay lines may be used on surfaces up to 260° C or 500°<br />
F. DLHT-101, -201, and -301 delay lines may be used on surfaces up to 175°<br />
C or 350° F. These transducers and delay lines are listed on the Delay Line<br />
Transducer List.<br />
We also offers special high temperature wedges for use with angle beam<br />
transducers, the ABWHT series for use up to 260° C or 500° F and the<br />
ABWVHT series for use up to 480° C or 900° F. Detailed information on<br />
available sizes is available from the Sales Department.
2.2 High Temperature Couplants<br />
Most common ultrasonic couplants such as propylene glycol, glycerin, and<br />
ultrasonic gels will quickly vaporize if used on surfaces hotter than<br />
approximately 100° C or 200° F. Thus, ultrasonic testing at high temperatures<br />
requires specially formulated couplants that will remain in a stable liquid or<br />
paste form without boiling off, burning, or releasing toxic fumes. It is important<br />
to be aware of the specified temperature range for their use, and use them<br />
only within that range. Poor acoustic performance and/or safety hazards may<br />
result from using high temperature couplants beyond their intended range.<br />
At very high temperatures, even specialized high temperature couplants must<br />
be used quickly since they will tend to dry out or solidify and no longer<br />
transmit ultrasonic energy. Dried couplant residue should be removed from<br />
the test surface and the transducer before the next measurement.
Note that normal incidence shear wave coupling is generally not possible at<br />
elevated temperatures because commercial shear wave couplants will liquify<br />
and lose the very high viscosity that is necessary for transmission of shear<br />
waves.<br />
We offer two types of high temperature couplant:<br />
■ Couplant E - Ultratherm Recommended for use between 500° and<br />
970° F (260° to 520° C)<br />
■ Couplant G - Medium Temperature Couplant Recommended for use at<br />
temperatures up to 600° F (315° C).<br />
For a complete list of couplants available from Olympus, along with further<br />
notes on each, please refer to the application note on Ultrasonic Couplants.
Keyword:<br />
Note that normal incidence shear wave coupling is generally not possible at<br />
elevated temperatures because commercial shear wave couplants will liquify<br />
and lose the very high viscosity that is necessary for transmission of shear<br />
waves.<br />
http://www.olympus-ims.com/en/applications/normal-incidence-shear-wave-transducers/<br />
http://static5.olympus-ims.com/data/Flash/shear_wave.swf?rev=3970<br />
http://www.olympus-ims.com/en/ultrasonic-transducers/shear-wave/
2.3 Test <strong>Techniques</strong><br />
The following factors should always be taken into consideration in<br />
establishing a test procedure for any high temperature application:<br />
Transducer Time of Contacts<br />
All standard high temperature transducers are designed with a duty cycle in<br />
mind. Although the delay line insulates the interior of the transducer, lengthy<br />
contact with very hot surfaces will cause significant heat buildup, and<br />
eventually permanent damage to the transducer if the interior temperature<br />
becomes hot enough. For most dual element and delay line transducers, the<br />
recommended duty cycle for surface temperatures between approximately<br />
90° C and 425° C (200° F to 800° F) is no more than ten seconds of contact<br />
with the hot surface (five seconds is recomended), followed by a minimum of<br />
one minute of air cooling. Note that this is guideline only; the ratio of contact<br />
time to cooling time becomes more critical at the upper end of a given<br />
transducer's specified temperature range.
As a general rule, if the outer case of the transducer becomes too hot to<br />
comfortably hold with bare fingers, then the interior temperature of the<br />
transducer is reaching a potentially damaging temperature and the transducer<br />
must be allowed to cool down before testing continues.<br />
Some users have employed water cooling to accelerate the cooling process,<br />
however Olympus publishes no official guidelines for water cooling and its<br />
appropriateness must be determined by the individual user<br />
Keyword:<br />
■<br />
■<br />
10 second contact follows by 60 second air cooling<br />
Water cooling is not guarantee by Olympus NDT
Coupling Technique: The combination of transducer duty cycle<br />
requirements and the tendency of couplants to solidify or boil off at the upper<br />
end of their usable thickness range requires quick work on the part of the<br />
operator. Many users have found the best technique to be to apply a drop of<br />
couplant to the face of the transducer and then press the transducer firmly to<br />
the test surface, without twisting or grinding it (which can cause transducer<br />
wear). Any dried couplant residue should be removed from the transducer tip<br />
between measurements.
2.4 Equipment Functions<br />
Freeze Function<br />
Olympus Epoch series flaw detectors and all thickness gages have freeze<br />
functions that can be used to freeze the displayed waveform and reading. The<br />
freeze function is very useful in high temperature measurements because it<br />
allows the operator to capture a reading and quickly remove the transducer<br />
from the hot surface. With gages, the fast screen update mode should be<br />
used to help minimize contact time.<br />
High Gain Boost<br />
Gain Boost: The 38DL PLUS and 45MG gages have user adjustable gain<br />
boost functions, as do all Epoch series flaw detectors. Because of the higher<br />
attenuation levels associated with high temperature measurements, it is often<br />
useful to increase gain before making measurements.
3.0 High Temperature Testing and Variability<br />
3.1 Velocity Variation:<br />
Sound velocity in all materials changes with temperature, slowing down as<br />
the material heats up. Accurate thickness gaging of hot materials always<br />
requires velocity recalibration. In steel, this velocity change is approximately<br />
1% per 55°C or 100°F change in temperature. (The exact value varies<br />
depending on the alloy.) In plastics and other polymers, this change is much<br />
greater, and can approach 50% per 55°C or 100°F change in temperature up<br />
to the melting point. If a temperature/velocity plot for the material is not<br />
available, then a velocity calibration should be performed on a sample of the<br />
test material at the actual test temperature. The temperature compensation<br />
software function in the 38DL PLUS gage can be used to automatically adjust<br />
velocity for known elevated temperatures based on a programmed<br />
temperature/velocity constant.<br />
Keyword:<br />
■ Velocity change of -1% (minus) per 55°C or 100°F change in temperature<br />
■ Temperature versus velocity plot
Keyword:<br />
■<br />
■<br />
Velocity change of -1% (minus) per 55°C or 100°F change in temperature<br />
Temperature versus velocity plot
3.2 Zero Recalibration:<br />
When performing thickness gaging with dual element transducers, remember<br />
that the zero offset value for a given transducer will change as it heats up due<br />
to changes in transit time through the delay line. Thus, periodic re-zeroing is<br />
necessary to maintain measurement accuracy. With Olympus corrosion<br />
gages this can be quickly and easily done through the gage's auto-zero<br />
function; simply press the 2nd Function > DO ZERO keys.
3.3 Increased Attenuation:<br />
Sound attenuation in all materials increases with temperature, and the effect<br />
is much more pronounced in plastics than in metals or ceramics. In typical<br />
fine grain carbon steel alloys, attenuation at 5 MHz at room temperature is<br />
approximately 2 dB per 100 mm one-way sound path (equivalent to a round<br />
trip path of 50 mm each way). At 500°C or 930°C, attenuation increases to<br />
approximately 15 dB per 100 mm of sound path. This effect can require use<br />
of significantly increased instrument gain when testing over long sound paths<br />
at high temperature, and can also require adjustment to distance/amplitude<br />
correction (DAC) curves or TVG (Time Varied Gain) programs that were<br />
established at room temperature.<br />
Temperature/attenuation effects in polymers are highly material dependent,<br />
but will be typically be several times greater than the above numbers for steel.<br />
In particular, long high temperature delay lines that have heated up may<br />
represent a significant source of total attenuation in a test.
Keyword:<br />
• In typical fine grain carbon steel alloys, attenuation at 5 MHz at room<br />
temperature is approximately 2 dB per 100 mm one-way sound path<br />
(equivalent to a round trip path of 50 mm each way).<br />
• At 500°C or 930°C, attenuation increases to approximately 15 dB per 100<br />
mm of sound path.
3.4 Angular Variation in Wedges:<br />
With any high temperature wedge, sound velocity in the wedge material will<br />
decrease as it heats up, and thus the refracted angle in metals will increase<br />
as the wedge heats up. If this is of concern in a given test, refracted angle<br />
should be verified at actual operating temperature. As a practical matter,<br />
thermal variations during testing will often make precise determination of the<br />
actual refracted angle difficult.<br />
Keyword:<br />
As a practical matter, thermal variations during testing will often make precise<br />
determination of the actual refracted angle difficult.
Discussion: An offshore installation of Topside to Jacket Legs, hot<br />
conventional Ultrasonic Testing at elevated temperature below 500 C was<br />
proposed. What are the critical information to be reviewed?<br />
Hints:<br />
High temperature testing methods used & limitations<br />
Variability due to high temperature & concerns
6.9: Dimension-Measurement <strong>Applications</strong>
6.9.1 Dimension-Measurement <strong>Applications</strong><br />
Ultrasonic inspection methods can be used for measurement of metal<br />
thickness. These same methods can also be used to monitor the deterioration<br />
of a surface and subsequent thinning of a part due to wear or corrosion and to<br />
determine the position of a solid object or liquid material in a closed metallic<br />
cavity.
6.9.2 Thickness measurements<br />
are made using pulse-echo techniques. Resonance techniques were also<br />
used in the past, but have become obsolete. The results can be read on an<br />
oscilloscope screen or on a meter, or they can be printed out. Also, the same<br />
data signals can be fed through gates to operate sorting or marking devices<br />
or to sound alarms. Resonance thickness testing was most often applied to<br />
process control inspection where opposite sides of the test pieces are smooth<br />
and parallel, such as in the inspection of hollow extrusions, drawn tubes, tube<br />
bends, flat sheet and plate, or electroplated parts.<br />
The maximum frequency that can be used for the test determines the<br />
minimum thickness that can be measured. The maximum thickness that can<br />
be measured depends on such test conditions as couplant characteristics,<br />
test frequency, and instrument design and on material type, metallurgical<br />
condition, and surface roughness.
Pulse-echo thickness gages with a digital readout are widely used for<br />
thickness measurement. Pulse-echo testing can measure such great<br />
thickness that it can determine the length of a steel reinforcing rod in a<br />
concrete structure, provided one end of the rod is accessible for contact by<br />
the search unit. Although pulse-echo testing is capable of measuring<br />
considerable thicknesses, near-field effects make the use of pulse-echo<br />
testing ineffective on very thin materials.
6.9.3 Position measurements<br />
Position measurements of solid parts or liquid materials in closed metallic<br />
cavities are usually made with pulse echo type equipment. One technique is<br />
to look for changes in back reflection intensity as the position of the search<br />
unit is changed. In one variation of this technique, the oil level in differential<br />
housings was checked to see if the automated equipment used to put the oil<br />
in the housing on an-assembly line had malfunctioned. The test developed for<br />
this application utilized a dual-gated pulse-echo system that employed a 1.6-<br />
MHz immersion-type search unit with a thin, oil filled rubber gland over its<br />
face. The search unit was automatically placed against the outside surface of<br />
the housing just below the proper oil level, as shown in Fig. 60(a).
With oil at the correct level, sufficient beam energy was transmitted across<br />
the boundary between the housing wall and the oil to attenuate the reflected<br />
beam so that multiple back reflections were all contained in the first gate (Fig.<br />
60b). The lack of oil at the correct level allowed the multiple back reflections<br />
to spill over into the second gate (Fig. 60c). Thus, the test was a fail-safe test<br />
that signaled "no test" (no signal in the first gate), "go" (signals in the first gate<br />
only), and "no go" (signals in both gates).
Fig. 60 Method of determining correct oil level in on automobile differential<br />
housing by use of an ultrasonic pulse-echo system. See text.
In another position measurement system, a set of two contact-type 4-MHz<br />
search units was utilized in a through transmission pitch-catch arrangement to<br />
determine the movement of a piston in a hydraulic oil accumulator as both<br />
precharge nitrogen-gas pressure and standby oil pressure varied (Fig. 61).<br />
The two search units were placed 180° apart on the outside surface of the<br />
accumulator wall at a position on the oil side of the piston, as shown in Fig.<br />
61.<br />
When a high energy pulse was sent from the transmitting unit, the beam was<br />
able to travel straight through the oil, and a strong signal was picked up by<br />
the receiving unit. However, as the search units were moved toward the<br />
piston (see locations drawn in phantom in Fig. 61), the sloping sides of the<br />
recess in the piston bottom deflected the beam so that very little signal was<br />
detected by the receiving unit.
Fig. 61 Setup for determining the position of a piston in a hydraulic oil<br />
accumulator by use of two contact search units utilizing a through<br />
transmission arrangement
Q144. A thin sheet may be inspected with the ultrasonic wavw direction<br />
normal to the surface by observing:<br />
A. The amplitude of the front surface reflection<br />
B. The multiple reflection pattern<br />
C. All front surface reflection<br />
D. None of the above
6.10: In-Service Inspection
In-Service Inspection<br />
The methods described above are applied in the course of and immediately<br />
after the production process and are therefore called production tests. To<br />
survey highly stressed parts, especially in power plants, repeated tests or inservice<br />
inspections are becoming more and more important. In these<br />
inspections any defects identified earlier but not being a cause for rejection<br />
can be observed for any changes caused by the service conditions. In<br />
addition service-produced defects must be detected, these being mainly<br />
cracks caused by thermal shock, fatigue or creep, or by corrosion attack.
In-Service Inspection- Testing for fatigue cracks on crankshafts and<br />
crankpins. a Without bore; b with bore
In-Service Inspection- Oblique or skewed fatigue cracks on crankpins
In-Service Inspection- (a) Crack test on press columns, pump rods, etc.<br />
(b) Crack test on thread in the shadow of a sound beam; schematic screen<br />
picture above
In-Service Inspection- (a) Probe for detecting fatigue cracks in turbine discs<br />
(design Krautkriimer-Branson) (b) Detection of cracks in riveted turbine<br />
blades
In-Service Inspection- (a) Testing methods for conical defects in a bolt<br />
(b) Testing for fatigue cracks in bolts
In-Service Inspection- (a) Cross-section through a leaf spring for railway<br />
cars with quenching crack showing testing with small angle probe or normal<br />
probe. The use of surface waves is unfavorable due to roughness<br />
(b)Testing a helical spring for quenching cracks, using surface waves
6.11: Casting
Casting<br />
In castings flaw detection is almost exclusively concerned with manufacturing<br />
defects and only rarely as in-service inspection. Suitable testing techniques<br />
and the subsequent evaluation of indications in castings is very different from<br />
the testing of forged and worked material so that the differences must not be<br />
forgotten or difficulties can occur. In-service inspection, as in the case of<br />
forgings, depends on the local stresses and the piece geometry so it is not<br />
necessary to treat it specially in this section.
Casting- Typical casting defects and their detection methods
Casting
Casting- Detection of shrinkage cavities with normal and angle probes
6.12: Bonded Joint
Inspection of Bonded Joints<br />
If the shape of a joint is favorable, ultrasonic inspection can be used to<br />
determine the soundness of joints bonded either adhesively or by any of the<br />
various metallurgical methods, including brazing and soldering. Both pulseecho<br />
and resonance techniques have been used to evaluate bond quality in<br />
brazed joints.<br />
A babbitted sleeve bearing is a typical part having a metallurgical bond that is<br />
ultrasonically inspected for flaws. The bond between babbitt and backing<br />
shell is inspected with a straight-beam pulse-echo technique, using a contacttype<br />
search unit applied to the outside of the steel shell. A small-diameter<br />
search unit is used to ensure adequate contact with the shell through the<br />
couplant. Before inspection, the outside of the steel shell and the inside of the<br />
cast babbitt liner are machined to a maximum surface roughness of 3.20 μm<br />
(125 μ in.) (but the liner is not machined to final thickness).
During inspection, the oscilloscope screen normally shows three indications:<br />
the initial pulse, a small echo from the bond line (due to differences in<br />
acoustical impedance of steel and babbitt), and the back reflection from the<br />
inside surface of the liner. Regions where the bond line indication is minimum<br />
are assumed to have an acceptable bond. Where the bond line signal<br />
increases, the bond is questionable. Where there is no back reflection at all<br />
from the inside surface of the liner (babbitt), there is no bond.<br />
Inspection of other types of bonded joints is often done in a manner similar to<br />
that described above for babbitted bearings. An extensive discussion of the<br />
ultrasonic inspection of various types of adhesive-bonded joints (including<br />
two-component lap joints, three component sandwich structures, and<br />
multiple-component laminated structures) is available in the article "Adhesive-<br />
Bonded Joints" in this Volume.
6.13: Corrosion Monitoring
Corrosion Monitoring<br />
Ultrasonic inspection can be used for the in situ monitoring of corrosion by<br />
measuring the thickness of vessel walls with ultrasonic thickness gages. The<br />
advantage of this method is that internal corrosion of a vessel can be<br />
monitored without penetration.<br />
There are, however, some disadvantages. Serious problems may exist in<br />
equipment that has a metallurgically bonded internal lining, because it is not<br />
obvious from which surface the returning signal will originate. A poor surface<br />
finish, paint, or a vessel at high or low temperature may also complicate the<br />
use of contact piezoelectric transducers (although this difficulty might be<br />
addressed by noncontact in situ inspection with an EMA transducer).
Despite these drawbacks, ultrasonic thickness measurements are widely<br />
used to determine corrosion rates. To obtain a corrosion rate, a series of<br />
thickness measurements is made over an interval of time, and the metal loss<br />
per unit time is determined from the measurement samples. Hand-held<br />
ultrasonic thickness gages are suitable for these measurements and are<br />
relatively easy to use.<br />
However, depending on the type of transducer used, the ultrasonic thickness<br />
method can overestimate metal thicknesses when the remaining thickness is<br />
under approximately 1.3 mm (0.05 in.). Another corrosion inspection method<br />
consists of monitoring back-surface roughness with ultrasonic techniques.<br />
The following example describes an application of this method in the<br />
monitoring of nuclear waste containers.
6.14: Crack Monitoring
Crack Monitoring<br />
Laboratory and in-service monitoring of the initiation and propagation of<br />
cracks that are relatively slow growing (such as fatigue cracks, stress-rupture<br />
cracks, and stress-corrosion cracks) has been accomplished with ultrasonic<br />
techniques. An example of the ultrasonic detection of stress-rupture cracks<br />
resulting from creep in reformer-furnace headers is given in the article<br />
"Boilers and Pressure Vessels" in this Volume. A relatively new and improved<br />
approach for monitoring the growth of cracks is done with ultrasonic imaging<br />
techniques.
Monitoring of fatigue cracks in parts during laboratory tests and while in<br />
service in the field has been extensively done using ultrasonic techniques.<br />
Reference 13 describes the use of surface waves to detect the initiation of<br />
cracks in cylindrical compression-fatigue test pieces having a circumferential<br />
notch. The surface waves, which were produced by four angle-beam search<br />
units on the circumference of each test piece, were able to follow the contour<br />
of the notch and detect the cracks at the notch root.<br />
Monitoring the crack-growth rate was accomplished by periodically removing<br />
the cracked test piece from the stressing rig and measuring the crack size by<br />
straight-beam, pulse-echo immersion inspection. It was found necessary to<br />
break open some of the cracked test pieces (using impact at low temperature)<br />
and visually measure the crack to establish an accurate calibration curve of<br />
indication height versus crack size.
The use of pulse-echo techniques for monitoring fatigue cracks in pressure<br />
vessels in laboratory tests is described in Ref 14. These techniques use<br />
several overlapping angle-beam (shear wave) search units, which are glued<br />
in place to ensure reproducible results as fatigue testing proceeded. The inservice<br />
monitoring of fatigue cracking of machine components is often<br />
accomplished without removing the component from its assembly.
For example, 150 mm (6 in.) diam, 8100 mm (320 in.) long shafts used in<br />
pressure rolls in papermaking machinery developed fatigue cracks in their<br />
500 mm (20 in.) long threaded end sections after long and severe service.<br />
These cracks were detected and measured at 3-month intervals, using a<br />
contact-type straight-beam search unit placed on the end of each shaft,<br />
without removing the shaft from the machine.<br />
When the cracks were found to cover over 25% of the cross section of a shaft,<br />
the shaft was removed and replaced. In another case, fatigue cracking in a<br />
weld joining components of the shell of a ball mill 4.3 m (14 ft) in diameter by<br />
9.1 m (30 ft) long was monitored using contact type angle-beam search units.<br />
The testing was done at 3-month intervals until a crack was detected; then it<br />
was monitored more frequently. When a crack reached a length of 150 mm (6<br />
in.), milling was halted and the crack repaired.
6.15: Stress Measurements
Stress Measurements<br />
With ultrasonic techniques, the velocity of ultrasonic waves in materials can<br />
be measured and related to stress (Ref 16). These techniques rely on the<br />
small velocity changes caused by the presence of stress, which is known as<br />
an acousto-elastic effect. The technique is difficult to apply because of the<br />
very small changes in velocity with changes in stress and because of the<br />
difficulty in distinguishing stress effects from material variations (such as<br />
texture; see Ref 17). However, with the increased ability to time the arrival of<br />
ultrasonic pulses accurately (±1 ns), the technique has become feasible for a<br />
few practical applications, such as the measurement of axial loads in steel<br />
bolts and the measurement of residual stress (Ref 5).<br />
.
The real limitation of this technique is that in many materials the ultrasonic<br />
pulse becomes distorted, which can reduce the accuracy of the measurement.<br />
One way to avoid this problem is to measure the phase difference between<br />
two-tone bursts by changing the frequency to keep the phase difference<br />
constant (Ref 5). Small specimens are used in a water bath, and the pulses<br />
received from the front and back surfaces overlap. The presence of stress<br />
also rotates the plane of polarization of polarized shear waves, and there is<br />
some correlation between the angle of rotation and the magnitude of the<br />
stress. Measurement of this rotation can be used to measure the internal<br />
stress averaged over the volume of material traversed by the ultrasonic beam.
6.16: Bond Testing
The real limitation of
The real limitation of
The real limitation of
The real limitation of
The real limitation of
The real limitation of
6.App-1: TOFD Introduction<br />
NOTE: Not in the exam syllabus or BOK
6.App-1.1 TOFD Basic Theory<br />
TOFD is usually performed using longitudinal waves as the primary detection<br />
method. Ultrasonic sensors are placed on each side of the weld. One sensor<br />
sends the ultrasonic beam into the material and the other sensor receives<br />
reflected and diffracted ultrasound from anomalies and geometric reflectors.
TOFD provides a wide area of coverage with a single beam by exploiting<br />
ultrasonic beam spread theory inside the wedge and the inspected material.<br />
When the beam comes in contact with the tip of a flaw, or crack, diffracted<br />
energy is cast in all directions. Measuring the time of flight of the diffracted<br />
beams enables accurate and reliable flaw detection and sizing, even if the<br />
crack is off-oriented to the initial beam direction.<br />
During typical TOFD inspections, A-scans are collected and used to create B-<br />
scan (side view) images of the weld. Analysis is done on the acquisition unit<br />
or in post-analysis software, positioning cursors to measure the length and<br />
through-wall height of flaws.<br />
Keywords:<br />
■<br />
■<br />
■<br />
■<br />
■<br />
Tip Diffraction<br />
Off-oriented to the initial beam direction<br />
Time of Flight<br />
A-scan / B-scan<br />
Post analysis software
6.App-1.2<br />
Main Benefits of TOFD for Weld Inspection<br />
• Based on diffraction, so relatively indifferent to weld bevel angles and flaw<br />
orientation<br />
• Uses time of arrival of signals received from crack tips for accurate defect<br />
positioning and sizing<br />
• Precise sizing capability makes it an ideal flaw monitoring method<br />
• Quick to set up and perform an inspection, as a single beam offers a large<br />
area of coverage<br />
• Rapid scanning with imaging and full data recording<br />
• Can also be used for corrosion inspections<br />
• Required equipment is more economical than phased array, due to<br />
conventional nature (single pulser and receiver) and use of conventional<br />
probes<br />
• Highly sensitive to all weld flaw types
TOFD offers rapid weld inspection with excellent flaw detection and sizing<br />
capacities. The diffraction technique provides critical sizing capability with<br />
relative indifference to bevel angle or flaw orientation. TOFD can be utilized<br />
on its own or in conjunction with other NDT techniques.
6.App-1.3<br />
6.App-1.3.1 The Theory<br />
More Reading on Time of Flight Diffraction (TOFD)<br />
Time of flight diffraction (TOFD) detects flaws using the signals diffracted from<br />
the flaw’s extremities. Two angled compression wave probes are used in<br />
transmit-receive mode, one each side of the weld. The beam divergence is<br />
such that the majority of the thickness is inspected, although, for thicker<br />
components, more than one probe separation may be required. When the<br />
sound strikes the tip of a crack, this acts as a secondary emitter which<br />
scatters sound out in all directions, some in the direction of the receiving<br />
probe. A ‘lateral wave’ travelling at the same velocity as the compression<br />
waves, travels directly from the transmitter to the receiver. The time difference<br />
between the lateral wave and the diffracted signal from the flaw<br />
provides a measure of its distance from the scanned surface.<br />
If the flaw is large enough in the through wall dimension, it may<br />
be possible to resolve the tip diffracted signals from its top and<br />
bottom, thereby allowing the through wall height of the flaw to be<br />
measured.<br />
http://www.iteglobal.com/services/advanced-ndt/time-of-flight-diffraction-tofd/
Due to the low amplitude of the diffracted signals, TOFD is usually carried out<br />
using a preamplifier and hardware designed to improve signal-to-noise<br />
performance. As the probes are scanned along the weld, the RF A-Scan<br />
signals are digitised and displayed in the form of a grey-scale image showing<br />
flaws as alternating white and black fringes.<br />
Depending on which direction the probes are moved over the component<br />
surface, it is possible to construct ‘end-view’; (B-scan TOFD) or ‘side-view’<br />
(D-scan TOFD) cross-sectional slices. TOFD can also utilise Synthetic<br />
Aperture focusing or beam modelling software to minimise the effects of<br />
beam divergence, thereby providing more accurate location and sizing<br />
information.
TOFD is generally recognised as the most accurate ultrasonic technique for<br />
measuring the through-wall height of planar flaws that lie perpendicular to the<br />
surface and as a method for detecting and quantifying crevice corrosion at the<br />
weld root. At present, national standards for the application of TOFD exist,<br />
however, no acceptance criteria have been agreed upon.<br />
The TOFD technique is suited for the detection and sizing of all types of<br />
embedded flaws, especially those planar in nature. However, the detection of<br />
small near the scan surface flaws can be more difficult due to the presence of<br />
the lateral wave response which often occupies several millimeters of the<br />
depth axis on images.
Tips Diffractions
TOFD<br />
Transmitter<br />
Receiver<br />
Crack<br />
Back-wall echo<br />
Diffracted wave from upper end of crack<br />
Diffracted wave from lower end of crack<br />
Crack height can be calculate by measuring propagation<br />
delayed time of diffraction wave<br />
Diffracted<br />
wave from<br />
upper end of<br />
crack<br />
Lateral wave<br />
Diffracted wave from lower end of crack
TOFD
6.App-1.2 Application Examples<br />
■<br />
TOFD for Weld Root Corrosion and Erosion<br />
For piping and other flow systems, certain conditions exist that lead to<br />
corrosion and erosion in the weld root and the heat-affected zone (HAZ) of<br />
the weld. The contributing factors are often metallurgical, chemical, or flow<br />
related, and the resulting metal loss can lead to failure of the weld/base metal.<br />
The shape of the corroded or eroded weld or base metal can make ultrasonic<br />
inspection extremely difficult to apply, thus impeding accurate detection and<br />
measurement of anomalies.<br />
The time-of-flight diffraction (TOFD) technique proves to be a valid option for<br />
evaluating weld root corrosion and erosion, as well as similar conditions such<br />
as FAC (flow-accelerated corrosion). The goal of any of these inspections is<br />
to accurately measure the wall thickness, the weld, and the HAZ. The<br />
unpredictable shape of the remaining material often makes pulse-echo<br />
ultrasonic inspection ineffective.<br />
http://www.olympus-ims.com/en/applications/tofd-for-weld-root-corrosion-and-erosion/
TOFD has been used for some time for general weld inspections. It has<br />
proven to be a rapid and easily deployable method with an excellent capacity<br />
for sizing. One of the inherent strengths of TOFD for detection and sizing<br />
purposes is its relative indifference to the orientation of defects because of its<br />
primary use of diffracted versus reflected energy.<br />
The TOFD technique utilizes two transducers: a transmitter transducer floods<br />
the inspected region with sound in the forward direction; on the opposite side<br />
of the weld, a receiver transducer is positioned to receive diffracted and<br />
reflected energy from the back wall or from anomalies present in the region.<br />
Common pulse-echo techniques can be misdirected by the shape of the<br />
region, resulting in imprecise measurement and assessment.
Figure 5-3 – Preferential weld corrosion in lean amine (Reference 5)
Figure 5-2 – Hot Lean Amine Corrosion of Carbon Steel:
Weld Root Corrosion and Erosion<br />
Pulse-echo shear wave beam being reflected at an off angle.<br />
Illustration of diffracted energy reflecting off weld root/HAZ in all directions.
For these types of weld inspections, TOFD is typically performed from three<br />
positions for each weld: (1) centered on the weld, (2) offset to the left, and (3)<br />
offset to the right.<br />
Scanning from these particular positions helps to achieve the best results.<br />
This method ensures detection of the highest point of material loss,<br />
determines from which side of the weld the erosion/corrosion indications are<br />
originating, and eliminates any masking caused by the back wall signal.<br />
Depending on the instrument, these scans can be run concurrently or in<br />
separate acquisitions.
TOFD is deployed by scanning the weld with a semiautomatic or fully<br />
automatic scanner. Scan settings are set to determine scan resolution. The<br />
resulting data file can be saved indefinitely for review and comparison to<br />
future scans. After data is acquired, it is analyzed to identify any areas of<br />
concern, either directly on the instrument or in post-analysis software. Shifts<br />
in data (time/depth) are measured in order to assess the severity of metal<br />
loss. The cursors can then be positioned to define areas for depth or<br />
thickness measurement readings. Weld defects such as porosity, lack of<br />
fusion, and cracking can also be detected when scanning for corrosion and<br />
erosion.
Scan of weld with cursor positioned on an uncorroded area; A-scan shows<br />
good lateral wave and back wall signal with no indications in between.
Scan of weld with cursor positioned on a corroded area; A-scan shows shift in<br />
time of back wall signal from material loss.
Measurement of good area shows thickness as 7.39 mm; TOFD (m-r) reading<br />
shows the distance between the positioned cursors.
Measurement of corroded area shows thickness as 5.28 mm; cursors are<br />
positioned at top of plate (0) and highest point of material loss. In this<br />
example, there is 2.11 mm of material loss due to corrosion.
6.11.3.3TOFD for Corrosion Measurement Equipment (Typical)<br />
• OmniScan SX or MX2 (PA or UT models, depending on the number of<br />
channels desired and if phased array capability is needed).<br />
• TOFD circumferential scanner (HST-Lite or similar, depending on the<br />
desired number of probe holders and other application specifics; for<br />
example, pipe versus plate).<br />
• TOFD probe and wedges (various frequencies, angles, and materials).<br />
• Couplant delivery system, WTR-SPRAYER-8L or similar.<br />
• TomoView Analysis or OmniPC post-analysis software (optional).
6.App-1.3.4<br />
TOFD Benefits for Corrosion/Erosion Measurement<br />
• Rapid scanning.<br />
• Cost effective.<br />
• Auditable and retrievable permanent data sets.<br />
• Accurate sizing capability.<br />
• Excellent detection, even on irregularly shaped areas of metal loss.<br />
• Fast post-acquisition analysis results.<br />
• Portable and user-friendly TOFD scanning packages.
TOFD for Weld- TOFD Parallel Scanning
6.App-1.3.5<br />
Overview on Scanning Direction<br />
Most typical TOFD inspections are performed with the send and receive<br />
transducers on opposite sides of the weld and scanning movement parallel to<br />
the weld axis. The main purpose of this “perpendicular” (defined by beam to<br />
weld relationship) scanning is to quickly perform weld inspection with the weld<br />
cap or re-enforcement in place. This technique can give location in the scan<br />
axis, the indication length, height of indication and flaw characterization<br />
information. One of the weaknesses of this technique is the lack of index<br />
positioning (or where between the probes) the indication is located. This<br />
information is usually obtained with complimentary pulse echo ultrasonics<br />
when the weld is left in place.
■<br />
Perpendicular Scanning<br />
Scanning direction “parallel” to the weld axis. Beam direction “perpendicular”<br />
to the weld axis.<br />
? Carriage movement<br />
direction<br />
One of the weaknesses of this technique is the lack of index positioning (or<br />
where between the probes) the indication is located.
■<br />
Parallel TOFD scanning:<br />
Where the scan direction and beam direction are the same is less used, for<br />
obvious reasons of not being able to cover the entire length of weld rapidly,<br />
more complex movement pattern required of scanner mechanisms, and<br />
complexity of the data output of an entire weld inspected. This technique does<br />
have advantages when it is possible to be performed.
Typical “Perpendicular” Weld Scanning Setup and Data Collected. Data is<br />
side view of weld from scan start to scan finish down the weld. Position of<br />
encoder and scanning direction are highlighted.
Typical “Parallel” Weld Scanning Setup and Data Collected. Data is side view<br />
of weld from scan start to scan finish across the weld. Position of encoder and<br />
scanning direction are highlighted.
■<br />
Benefit of TOFD Parallel Scanning<br />
Although perpendicular TOFD scanning down the weld can give highly<br />
accurate depth measurement, generally speaking a parallel scan will give<br />
more accurate depth information as well as flaw information, and location in<br />
the index position in the weld. With perpendicular scanning, no index position<br />
is possible without multiple offset scans being performed or complimentary<br />
NDT techniques to position the flaw. In parallel scanning Index position is<br />
ascertained by locating the minimum time peak, which corresponds to when<br />
the indication is centered between the two probes. For these reasons this<br />
technique is often used in critical crack sizing inspections, as well as change<br />
monitoring, in other words, monitoring a crack or other defect for growth until<br />
it reaches a critical level at which time it is repaired or replaced. For these<br />
reasons the technique is often performed on critical components that are<br />
costly to shut down for repair, often in the Power Generation industry. More<br />
information is often gathered from the flaw as diffraction occurs across the<br />
flaw instead of just down the flaw.
6.App-1.3.6 Further Reading- Introduction to Phased Array<br />
• http://www.olympus-ims.com/en/ndt-tutorials/intro/ut/
The Experts at work.
Break Time<br />
mms://a588.l3944020587.c39440.g.lm.akamaistream.net/D/588/39440/v0001/reflector:20587?BBC-<br />
UID=e5203c9d59fef1a79c12d8c601e839f58db16f7d5d6448f55674c540f1856834<strong>&</strong>;SSO2-UID
Break Time<br />
mms://a588.l3944020587.c39440.g.lm.akamaistream.net/D/588/39440/v0001/reflector:20587?BBC-<br />
UID=e5203c9d59fef1a79c12d8c601e839f58db16f7d5d6448f55674c540f1856834<strong>&</strong>;SSO2-UID
Break Time<br />
mms://a588.l3944020587.c39440.g.lm.akamaistream.net/D/588/39440/v0001/reflector:20587?BBC-<br />
UID=e5203c9d59fef1a79c12d8c601e839f58db16f7d5d6448f55674c540f1856834<strong>&</strong>;SSO2-UID
Break Time
Sail Off


