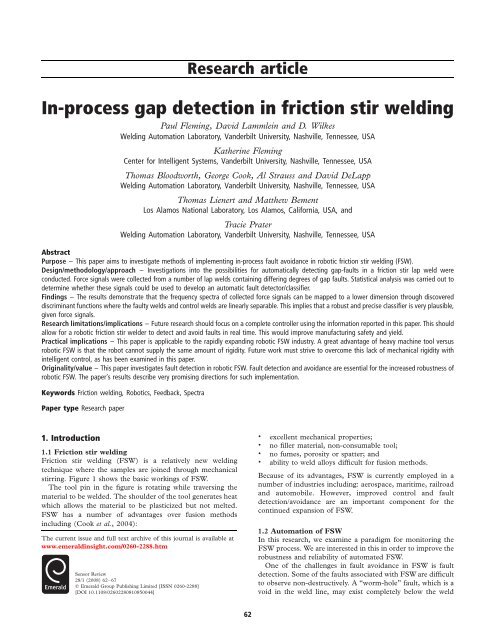
In-process gap detection in friction stir welding - Emerald
In-process gap detection in friction stir welding - Emerald
In-process gap detection in friction stir welding - Emerald

Create successful ePaper yourself
Turn your PDF publications into a flip-book with our unique Google optimized e-Paper software.
Research article<br />
<strong>In</strong>-<strong>process</strong> <strong>gap</strong> <strong>detection</strong> <strong>in</strong> <strong>friction</strong> <strong>stir</strong> weld<strong>in</strong>g<br />
Paul Flem<strong>in</strong>g, David Lammle<strong>in</strong> and D. Wilkes<br />
Weld<strong>in</strong>g Automation Laboratory, Vanderbilt University, Nashville, Tennessee, USA<br />
Kather<strong>in</strong>e Flem<strong>in</strong>g<br />
Center for <strong>In</strong>telligent Systems, Vanderbilt University, Nashville, Tennessee, USA<br />
Thomas Bloodworth, George Cook, Al Strauss and David DeLapp<br />
Weld<strong>in</strong>g Automation Laboratory, Vanderbilt University, Nashville, Tennessee, USA<br />
Thomas Lienert and Matthew Bement<br />
Los Alamos National Laboratory, Los Alamos, California, USA, and<br />
Tracie Prater<br />
Weld<strong>in</strong>g Automation Laboratory, Vanderbilt University, Nashville, Tennessee, USA<br />
Abstract<br />
Purpose – This paper aims to <strong>in</strong>vestigate methods of implement<strong>in</strong>g <strong>in</strong>-<strong>process</strong> fault avoidance <strong>in</strong> robotic <strong>friction</strong> <strong>stir</strong> weld<strong>in</strong>g (FSW).<br />
Design/methodology/approach – <strong>In</strong>vestigations <strong>in</strong>to the possibilities for automatically detect<strong>in</strong>g <strong>gap</strong>-faults <strong>in</strong> a <strong>friction</strong> <strong>stir</strong> lap weld were<br />
conducted. Force signals were collected from a number of lap welds conta<strong>in</strong><strong>in</strong>g differ<strong>in</strong>g degrees of <strong>gap</strong> faults. Statistical analysis was carried out to<br />
determ<strong>in</strong>e whether these signals could be used to develop an automatic fault detector/classifier.<br />
F<strong>in</strong>d<strong>in</strong>gs – The results demonstrate that the frequency spectra of collected force signals can be mapped to a lower dimension through discovered<br />
discrim<strong>in</strong>ant functions where the faulty welds and control welds are l<strong>in</strong>early separable. This implies that a robust and precise classifier is very plausible,<br />
given force signals.<br />
Research limitations/implications – Future research should focus on a complete controller us<strong>in</strong>g the <strong>in</strong>formation reported <strong>in</strong> this paper. This should<br />
allow for a robotic <strong>friction</strong> <strong>stir</strong> welder to detect and avoid faults <strong>in</strong> real time. This would improve manufactur<strong>in</strong>g safety and yield.<br />
Practical implications – This paper is applicable to the rapidly expand<strong>in</strong>g robotic FSW <strong>in</strong>dustry. A great advantage of heavy mach<strong>in</strong>e tool versus<br />
robotic FSW is that the robot cannot supply the same amount of rigidity. Future work must strive to overcome this lack of mechanical rigidity with<br />
<strong>in</strong>telligent control, as has been exam<strong>in</strong>ed <strong>in</strong> this paper.<br />
Orig<strong>in</strong>ality/value – This paper <strong>in</strong>vestigates fault <strong>detection</strong> <strong>in</strong> robotic FSW. Fault <strong>detection</strong> and avoidance are essential for the <strong>in</strong>creased robustness of<br />
robotic FSW. The paper’s results describe very promis<strong>in</strong>g directions for such implementation.<br />
Keywords Friction weld<strong>in</strong>g, Robotics, Feedback, Spectra<br />
Paper type Research paper<br />
1. <strong>In</strong>troduction<br />
1.1 Friction <strong>stir</strong> weld<strong>in</strong>g<br />
Friction <strong>stir</strong> weld<strong>in</strong>g (FSW) is a relatively new weld<strong>in</strong>g<br />
technique where the samples are jo<strong>in</strong>ed through mechanical<br />
<strong>stir</strong>r<strong>in</strong>g. Figure 1 shows the basic work<strong>in</strong>gs of FSW.<br />
The tool p<strong>in</strong> <strong>in</strong> the figure is rotat<strong>in</strong>g while travers<strong>in</strong>g the<br />
material to be welded. The shoulder of the tool generates heat<br />
which allows the material to be plasticized but not melted.<br />
FSW has a number of advantages over fusion methods<br />
<strong>in</strong>clud<strong>in</strong>g (Cook et al., 2004):<br />
The current issue and full text archive of this journal is available at<br />
www.emerald<strong>in</strong>sight.com/0260-2288.htm<br />
Sensor Review<br />
28/1 (2008) 62–67<br />
q <strong>Emerald</strong> Group Publish<strong>in</strong>g Limited [ISSN 0260-2288]<br />
[DOI 10.1108/02602280810850044]<br />
.<br />
excellent mechanical properties;<br />
.<br />
no filler material, non-consumable tool;<br />
.<br />
no fumes, porosity or spatter; and<br />
.<br />
ability to weld alloys difficult for fusion methods.<br />
Because of its advantages, FSW is currently employed <strong>in</strong> a<br />
number of <strong>in</strong>dustries <strong>in</strong>clud<strong>in</strong>g: aerospace, maritime, railroad<br />
and automobile. However, improved control and fault<br />
<strong>detection</strong>/avoidance are an important component for the<br />
cont<strong>in</strong>ued expansion of FSW.<br />
1.2 Automation of FSW<br />
<strong>In</strong> this research, we exam<strong>in</strong>e a paradigm for monitor<strong>in</strong>g the<br />
FSW <strong>process</strong>. We are <strong>in</strong>terested <strong>in</strong> this <strong>in</strong> order to improve the<br />
robustness and reliability of automated FSW.<br />
One of the challenges <strong>in</strong> fault avoidance <strong>in</strong> FSW is fault<br />
<strong>detection</strong>. Some of the faults associated with FSW are difficult<br />
to observe non-destructively. A “worm-hole” fault, which is a<br />
void <strong>in</strong> the weld l<strong>in</strong>e, may exist completely below the weld<br />
62
Figure 1 Outl<strong>in</strong>e of <strong>friction</strong> <strong>stir</strong> weld<strong>in</strong>g<br />
Sufficient downword<br />
force to ma<strong>in</strong>ta<strong>in</strong><br />
registered contact<br />
Shoulder<br />
Advanc<strong>in</strong>g<br />
side of weld<br />
Retreat<strong>in</strong>g side<br />
of weld<br />
Source: Cook et al. (2004)<br />
Lead<strong>in</strong>g edge<br />
of the<br />
rotat<strong>in</strong>g tool<br />
surface and therefore be unobservable to a human <strong>in</strong>spector.<br />
These faults can severely weaken the <strong>in</strong>tegrity of the weld. For<br />
this reason, the development of an <strong>in</strong>-<strong>process</strong> monitor<strong>in</strong>g<br />
system is essential for both quality control and <strong>process</strong> yield.<br />
<strong>In</strong>-<strong>process</strong> <strong>detection</strong> of faults <strong>in</strong> FSW is not trivial. A<br />
number of techniques for detect<strong>in</strong>g weld quality and faults<br />
have been published, and many <strong>in</strong>volve high-quality sensors<br />
and advanced mach<strong>in</strong>e learn<strong>in</strong>g techniques (Boldsaikhan et al.,<br />
2006, Chen et al., 2003). “First-order” sens<strong>in</strong>g, the<br />
observation of the weld visually or direct observation of<br />
<strong>process</strong> signals, often does not provide evidence of fault<br />
occurrence. However, if the signals are first <strong>process</strong>ed us<strong>in</strong>g<br />
modern signal <strong>process</strong><strong>in</strong>g and mach<strong>in</strong>e learn<strong>in</strong>g techniques,<br />
fault <strong>detection</strong> can be achieved. This means that feedback<br />
control for FSW is a two-step <strong>process</strong>. The raw signal data<br />
obta<strong>in</strong>ed from either dynamometers, acoustic emission<br />
sensors or accelerometers must first be applied to a<br />
computational unit which can quickly detect faults, or rank<br />
fault likelihood, and this <strong>in</strong>formation can <strong>in</strong> turn be<br />
accounted for by a <strong>process</strong> controller. <strong>In</strong> FSW, the<br />
controller can attempt to affect change by adjust<strong>in</strong>g the tool<br />
rotation speed, sample traversal speed or plunge depth if it is<br />
possible to correct the for the detected fault, or else alert the<br />
operator of fault occurrence. This scheme is represented <strong>in</strong><br />
the control loop shown <strong>in</strong> Figure 2.<br />
<strong>In</strong> order for a successful feedback loop, fault <strong>detection</strong><br />
schemes must be developed for all faults, and for all weld<br />
<strong>process</strong>es. <strong>In</strong> this paper, an <strong>in</strong>vestigation <strong>in</strong>to the possibility of<br />
us<strong>in</strong>g force read<strong>in</strong>gs as a signal for the <strong>detection</strong> of <strong>gap</strong>s is<br />
presented. Gaps, caused by poor fit-up between samples to be<br />
welded, are spaces <strong>in</strong> the weld jo<strong>in</strong>t prior to weld<strong>in</strong>g. The<br />
Figure 2 Control loop <strong>in</strong> FSW<br />
Gap <strong>detection</strong> <strong>in</strong> <strong>friction</strong> <strong>stir</strong> weld<strong>in</strong>g<br />
Paul Flem<strong>in</strong>g et al.<br />
Actuation/<br />
Decision<br />
Traill<strong>in</strong>g edge of<br />
the rotat<strong>in</strong>g tool<br />
Direction of<br />
Travel<br />
P<strong>in</strong><br />
Motor Commands<br />
Jo<strong>in</strong>t<br />
presence of poor fit-up, like poor weld parameter selection, is<br />
not a fault <strong>in</strong> and of itself, but rather a fault caus<strong>in</strong>g condition.<br />
<strong>In</strong> Leonard and Lockyer (2003), <strong>gap</strong>s are listed as a potential<br />
cause of void (worm-hole) formation.<br />
2. Experiment setup<br />
2.1 Friction <strong>stir</strong> lap weld<strong>in</strong>g<br />
As an experimental test bed, <strong>friction</strong> <strong>stir</strong> lap weld<strong>in</strong>g (FSLW),<br />
which is the jo<strong>in</strong><strong>in</strong>g of two metal sheets placed one on the<br />
other by FSW is used. Current applications of FSLW <strong>in</strong>clude<br />
hermetically closed boxes, wheel rims and car back supports<br />
(Ericsson et al., 2007). A problem-caus<strong>in</strong>g condition could be<br />
the existence of a <strong>gap</strong> between the weld samples. Kawasaki<br />
et al. (2004) discuss the difficulties of FSW overlap welds with<br />
<strong>gap</strong>s. <strong>In</strong> this work, this sample problem is used to <strong>in</strong>vestigate<br />
the previously discussed control system. Specifically, the<br />
application of signal <strong>process</strong><strong>in</strong>g and mach<strong>in</strong>e learn<strong>in</strong>g<br />
techniques provides the ability to detect these faults.<br />
2.2 Material and equipment<br />
The samples used were 1/8 <strong>in</strong> thick 6061 Alum<strong>in</strong>um. Two<br />
samples were mounted and clamped directly one on the other<br />
as shown <strong>in</strong> Figure 3. All welds were run with a sp<strong>in</strong>dle speed<br />
of 2,000 rpm, and a traversal speed of 16 ipm. These values<br />
were shown to be effective FSLW parameters <strong>in</strong> the paper<br />
“Lap Jo<strong>in</strong>ts produced by FSW on flat alum<strong>in</strong>um EN AW-6082<br />
profiles” and worked well for this research (Mish<strong>in</strong>a and<br />
Norl<strong>in</strong>, 2003). The tool used was a 01 steel tool, with a 5/8 <strong>in</strong>.<br />
shoulder and threaded cyl<strong>in</strong>drical 0.16 <strong>in</strong>. long p<strong>in</strong>.<br />
Gaps were created <strong>in</strong> the samples us<strong>in</strong>g a mill<strong>in</strong>g mach<strong>in</strong>e.<br />
The <strong>gap</strong> depths used are: no <strong>gap</strong>, 0.0004 <strong>in</strong>. 0.0008<strong>in</strong>.<br />
0.0012 <strong>in</strong>., 0.0016 <strong>in</strong>., 0.0020 <strong>in</strong>., 0.0030 <strong>in</strong>., 0.0040 <strong>in</strong>. and<br />
0.0050 <strong>in</strong>. The <strong>gap</strong>s were applied to one plate and a normal<br />
plate was placed and clamped on top for experimental welds.<br />
The plates are shown <strong>in</strong> Figure 4.<br />
Force signals were collected with a Kistler Dynamometer at<br />
1,000 Hz.<br />
3. Results<br />
Sensor Review<br />
Volume 28 · Number 1 · 2008 · 62–67<br />
3.1 <strong>In</strong>itial results<br />
After welds were completed, a visual <strong>in</strong>spection of the weld<br />
surface was carried out to determ<strong>in</strong>e if there were clear visual<br />
Figure 3 Samples clamped <strong>in</strong> position<br />
Detected<br />
Faults<br />
FSW<br />
Process<strong>in</strong>g<br />
Raw Signals<br />
63
Gap <strong>detection</strong> <strong>in</strong> <strong>friction</strong> <strong>stir</strong> weld<strong>in</strong>g<br />
Paul Flem<strong>in</strong>g et al.<br />
Figure 4 <strong>In</strong>serted <strong>gap</strong> of 0.0008 <strong>in</strong><br />
Figure 6 (a) Axial forces; (b) Axial forces (zoomed)<br />
Force (Newtons)<br />
10,000<br />
8,000<br />
6,000<br />
4,000<br />
2,000<br />
Sensor Review<br />
Volume 28 · Number 1 · 2008 · 62–67<br />
Control<br />
.0002"<br />
.0004"<br />
.0008"<br />
.0012"<br />
.0016"<br />
.0020"<br />
.0030"<br />
.0040"<br />
.0050"<br />
Start of weld<br />
Tool dwells<br />
1 st <strong>gap</strong><br />
2 nd <strong>gap</strong><br />
0<br />
Tool enters material<br />
–2,000<br />
0 10 20 30 40 50 60 70 80 90<br />
Time (Seconds)<br />
(a)<br />
cues of the <strong>in</strong>serted <strong>gap</strong>s. <strong>In</strong> Figure 5, the surface of the weld<br />
with 0.0050 <strong>in</strong>. <strong>gap</strong>s <strong>in</strong>serted is shown to look normal, with no<br />
obvious trenches, flash or other surface features. The close up<br />
<strong>in</strong> Figure 5(b) is look<strong>in</strong>g at the surface over the <strong>gap</strong> at close<br />
range to illustrate the lack of any clear signs of defects on the<br />
surface.<br />
3.2 Collected force signals<br />
A graph show<strong>in</strong>g typical axial forces for the different <strong>gap</strong><br />
depths is shown <strong>in</strong> Figure 6(a).<br />
One can see that for <strong>gap</strong>s of depth 0.002 <strong>in</strong>. or greater a<br />
large noticeable drop <strong>in</strong> axial force can be expected, while the<br />
drop is negligible for 0.001 <strong>in</strong>. and below. This can be further<br />
emphasized by exam<strong>in</strong><strong>in</strong>g the <strong>gap</strong> section <strong>in</strong> greater detail <strong>in</strong><br />
Figure 6(b). From this we observe that the <strong>gap</strong> produces a<br />
1,000 N reduction <strong>in</strong> force when the <strong>gap</strong> is larger than<br />
0.002 <strong>in</strong>. There are smaller but still noticeable reductions up<br />
until 0.0012 <strong>in</strong>. These sudden drops <strong>in</strong> force are a good cue<br />
for an automated weld<strong>in</strong>g system that it is weld<strong>in</strong>g over a <strong>gap</strong><br />
<strong>in</strong> the material, with the amount of force proportional to the<br />
severity of the <strong>gap</strong>. However, it is also possible that this<br />
<strong>in</strong>formation, left un<strong>process</strong>ed, may be <strong>in</strong>sufficient for accurate<br />
<strong>detection</strong> of <strong>gap</strong>s. Forces can vary from other causes. Also,<br />
when the <strong>gap</strong>s are smaller, the change <strong>in</strong> force appears<br />
<strong>in</strong>sufficient for discrim<strong>in</strong>ation.<br />
3.3 Feature extraction<br />
<strong>In</strong> order for an automatic robotic weld<strong>in</strong>g system to detect<br />
faults given these force signals, the <strong>process</strong><strong>in</strong>g block <strong>in</strong> the<br />
control loop must extract mean<strong>in</strong>gful <strong>in</strong>formation from the<br />
data. Simply provid<strong>in</strong>g the force signals may not give a robotic<br />
controller an <strong>in</strong>dication of how to proceed. Feature<br />
extraction, which means represent<strong>in</strong>g the larger data set by<br />
a smaller representation which more effectively and<br />
purposefully describes the data helps a classifier develop a<br />
Figure 5 Surface of weld with 0.0050 <strong>in</strong>. <strong>gap</strong><br />
Weld surface<br />
(a)<br />
Zoomed <strong>in</strong><br />
(b)<br />
Force (Newtons)<br />
10,000<br />
9,500<br />
9,000<br />
8,500<br />
8,000<br />
7,500<br />
7,000<br />
6,500<br />
Control<br />
.0002"<br />
.0004"<br />
.0008"<br />
.0012"<br />
.0016"<br />
.0020"<br />
.0030"<br />
.0040"<br />
.0050"<br />
6,000 48 50 52 54 56 58 60 62 64 66<br />
Time (Seconds)<br />
decision-mak<strong>in</strong>g <strong>process</strong> (Fukunaga, 1972). <strong>In</strong> the case of this<br />
experiment, by convert<strong>in</strong>g the data <strong>in</strong>to the frequency doma<strong>in</strong><br />
and then apply<strong>in</strong>g techniques such as pr<strong>in</strong>cipal component<br />
analysis (PCA) and l<strong>in</strong>ear discrim<strong>in</strong>ant analysis, lowdimensional<br />
subspaces are found <strong>in</strong> which the data were<br />
nearly l<strong>in</strong>early separable, mak<strong>in</strong>g categorization<br />
straightforward.<br />
3.4 Frequency analysis<br />
The frequency doma<strong>in</strong> provides a rich source of <strong>in</strong>formation<br />
for analysis. It is quite possible that <strong>gap</strong>s will create “chatter”<br />
or amplify exist<strong>in</strong>g frequencies with <strong>in</strong>creased oscillation. The<br />
Fourier transform can be used to determ<strong>in</strong>e the spectral<br />
density of the force signals. This allows for comparison of the<br />
frequency components of the collected force signals. S<strong>in</strong>ce,<br />
the forces are sampled, a good method for the computation of<br />
the Fourier transform is the Fast Fourier Transform, a<br />
computational method, which is implemented <strong>in</strong> Matlab<br />
(Lathi, 1998). One issue with the Fourier Transform is that<br />
either the frequency spectra for the entire signal must be<br />
computed, or else the signal must be w<strong>in</strong>dowed. W<strong>in</strong>dow<strong>in</strong>g<br />
<strong>in</strong>volves select<strong>in</strong>g portions of the time signal <strong>in</strong> order to get a<br />
perspective of what the frequency spectra is at a given<br />
moment <strong>in</strong> time. For this experiment, the force signals are<br />
each w<strong>in</strong>dowed over the <strong>gap</strong> regions, to exam<strong>in</strong>e differences<br />
(b)<br />
64
Gap <strong>detection</strong> <strong>in</strong> <strong>friction</strong> <strong>stir</strong> weld<strong>in</strong>g<br />
Paul Flem<strong>in</strong>g et al.<br />
<strong>in</strong> spectra over <strong>gap</strong>s, rather than over the whole weld. The<br />
only exceptions are the control welds, which have no <strong>gap</strong>s, so<br />
more of the weld is used. However, the w<strong>in</strong>dow size is<br />
constant <strong>in</strong> all cases, approximately 2 s long.<br />
3.5 Pr<strong>in</strong>cipal component analysis<br />
As stated earlier, it is important to f<strong>in</strong>d a compact, or lowdimensional<br />
representation of the data. <strong>In</strong> this experiment,<br />
the collected data were represented by frequency spectra of<br />
welds run with and without vary<strong>in</strong>g <strong>gap</strong>s <strong>in</strong>serted. If we<br />
consider spectra with 100 frequency b<strong>in</strong>s which implies that<br />
each sample is described by a po<strong>in</strong>t <strong>in</strong> a 100-dimensional<br />
space. PCA attempts to project these po<strong>in</strong>ts on to a lower<br />
dimensional space, chosen accord<strong>in</strong>g to which dimensions<br />
ma<strong>in</strong>ta<strong>in</strong> the highest variance (Figure 7). This is<br />
accomplished by diagonaliz<strong>in</strong>g the covariance matrix of the<br />
data. This operation reduces the redundancy found <strong>in</strong> data,<br />
result<strong>in</strong>g <strong>in</strong> a new, and more mean<strong>in</strong>gful low-dimensional<br />
data-set (Shlens, 2005). Although it is not necessarily the best<br />
representation from a statistical perspective, PCA is used to<br />
project all the samples on to a 2D space. The results of this<br />
are <strong>in</strong>formative.<br />
Shown <strong>in</strong> Figure 8(a)-(c), are the result<strong>in</strong>g 2D<br />
representations of the weld samples after PCA with the<br />
projections of the control welds represented by red x’s and<br />
the <strong>gap</strong> welds by black circles The figures are split to show the<br />
results when the pr<strong>in</strong>cipal components are computed with a<br />
vary<strong>in</strong>g amount of <strong>gap</strong> sizes <strong>in</strong>cluded. Notice that after<br />
0.004 <strong>in</strong>. <strong>gap</strong>s the representations become l<strong>in</strong>early separable.<br />
This is actually a very good result consider<strong>in</strong>g the fact that<br />
PCA is an unsupervised technique, mean<strong>in</strong>g that no<br />
<strong>in</strong>formation about the classes of the data were provided to<br />
the algorithm to encourage this separation. It occurred<br />
naturally due to the fundamental differences of the data be<strong>in</strong>g<br />
analyzed by PCA.<br />
3.6 L<strong>in</strong>ear discrim<strong>in</strong>ant analysis<br />
L<strong>in</strong>ear discrim<strong>in</strong>ant analysis, or Fisher’s l<strong>in</strong>ear discrim<strong>in</strong>ant, is<br />
also a dimensionality reduction technique. However, unlike<br />
PCA, it is given a priori knowledge of the classes of the<br />
samples and then f<strong>in</strong>ds a lower-dimensional projection that<br />
maximizes the class separability. This is accomplished by<br />
solv<strong>in</strong>g equations which maximize between-class scatter and<br />
m<strong>in</strong>imize with<strong>in</strong> class scatter (Well<strong>in</strong>g, 2007). The results of<br />
apply<strong>in</strong>g this are shown <strong>in</strong> Figure 8.<br />
From Figure 8, it can be seen that even if the <strong>gap</strong> is<br />
0.0002 <strong>in</strong>., LDA provides a 2D representation of the data<br />
where control welds and <strong>gap</strong> welds are l<strong>in</strong>early separable.<br />
4. Conclusions and future work<br />
This research demonstrates two methods which could be<br />
used <strong>in</strong> design<strong>in</strong>g an automatic fault <strong>detection</strong>/avoidance<br />
system for FSW. Statistical methods can be used as a prestep<br />
to derive representations of force data which provide<br />
good <strong>in</strong>sight <strong>in</strong>to the state of the current weld. Deriv<strong>in</strong>g<br />
these representations may take some time off-l<strong>in</strong>e, but the<br />
projections can be then done quickly onl<strong>in</strong>e. This can<br />
<strong>in</strong> turn be used to devise a complete real time fault<br />
avoidance control which would allow reliable and robust<br />
robotic FSW.<br />
Figure 7 (a) PCA with only <strong>gap</strong>s greater than 0.001 <strong>in</strong>.; (b) PCA with<br />
only <strong>gap</strong>s greater than 0.002 <strong>in</strong>.; (c) PCA with only <strong>gap</strong>s greater that<br />
0.004 <strong>in</strong><br />
2nd Component<br />
2nd Component<br />
2nd Component<br />
0.08<br />
0.06<br />
0.04<br />
0.02<br />
0<br />
– 0.02<br />
– 0.04<br />
0.08<br />
0.06<br />
0.04<br />
0.02<br />
0<br />
– 0.02<br />
– 0.04<br />
– 0.06 – 0.1 – 0.08 – 0.06 – 0.04 – 0.02 0 0.02 0.04<br />
0.05<br />
0.04<br />
0.03<br />
0.02<br />
0.01<br />
0<br />
– 0.01<br />
– 0.02<br />
– 0.03<br />
– 0.04<br />
Sensor Review<br />
Volume 28 · Number 1 · 2008 · 62–67<br />
– 0.06 – 0.1 – 0.08 – 0.06 – 0.04 – 0.02 0 0.02 0.04 0.06<br />
1 st Component<br />
1st Component<br />
Control Welds<br />
Gap Welds<br />
– 0.05 – 0.08 – 0.06 – 0.04 – 0.02 0 0.02 0.04 0.06<br />
(a)<br />
(b)<br />
1st Component<br />
(c)<br />
Control Welds<br />
Gap Welds<br />
Control Welds<br />
Gap Welds<br />
65
Gap <strong>detection</strong> <strong>in</strong> <strong>friction</strong> <strong>stir</strong> weld<strong>in</strong>g<br />
Paul Flem<strong>in</strong>g et al.<br />
Figure 8 L<strong>in</strong>ear discrim<strong>in</strong>ant analysis<br />
×10<br />
2.5<br />
–4 ×10<br />
–0.95<br />
–3<br />
Control Welds<br />
Gap Welds<br />
2<br />
–1<br />
Sensor Review<br />
Volume 28 · Number 1 · 2008 · 62–67<br />
Control Welds<br />
Gap Welds<br />
2nd Component<br />
1.5<br />
1<br />
0.5<br />
2nd Component<br />
–1.05<br />
–1.1<br />
–1.15<br />
0<br />
–1.2<br />
–0.5<br />
–4<br />
–1.25<br />
–2 0 2 4 6 8 0.8<br />
1st Component<br />
(a) Gaps larger than 0.0002"<br />
0.9 1 1.1<br />
1st Component<br />
(b) Gaps larger than 0.0004"<br />
×10 –3<br />
Control Welds<br />
Gap Welds<br />
×10 –3<br />
–1.85<br />
–1.9<br />
Control Welds<br />
Gap Welds<br />
2nd Component<br />
3<br />
2<br />
1<br />
–1.95<br />
–2<br />
–2.05<br />
–2.1<br />
–2.15<br />
0<br />
–8<br />
×10 –4 ×10 –4 ×10 –4<br />
–7 –6 –5 –4 –3 –2<br />
1st Component<br />
(c) Gaps larger than 0.002"<br />
–2.2<br />
6.5<br />
×10 –5 (d) Gaps larger than 0.003"<br />
2nd Component<br />
7 7.5 8 8.5 9 9.5<br />
1st Component<br />
12<br />
11<br />
×10 –4 ×10 –4 ×10 –4<br />
Control Welds<br />
Gap Welds<br />
2.8<br />
×10 –3<br />
2.7<br />
Control Welds<br />
Gap Welds<br />
2nd Component<br />
10<br />
9<br />
8<br />
7<br />
2nd Component<br />
2.6<br />
2.5<br />
2.4<br />
2.3<br />
2.2<br />
6<br />
5<br />
0 1 2 3 4 5 6 7 8<br />
1st Component<br />
(e) Gaps larger than 0.004"<br />
2.1<br />
2<br />
1 2 2 2 5 6 7 8 9<br />
1st Component<br />
(f) Gaps larger than 0.005"<br />
66
References<br />
Gap <strong>detection</strong> <strong>in</strong> <strong>friction</strong> <strong>stir</strong> weld<strong>in</strong>g<br />
Paul Flem<strong>in</strong>g et al.<br />
Boldsaikhan, E., Corw<strong>in</strong>, E., Logar, A. and Arbegast, W.<br />
(2006), “Neural network evaluation of weld quality us<strong>in</strong>g<br />
FSW feedback data”, paper presented at 6th <strong>In</strong>ternational<br />
Symposium on Friction Stir Weld<strong>in</strong>g.<br />
Chen, C., Kovacevic, R. and Jandgric, D. (2003), “Wavelet<br />
transform analysis of acoustic emission <strong>in</strong> monitor<strong>in</strong>g<br />
<strong>friction</strong> <strong>stir</strong> weld<strong>in</strong>g of 6061 alum<strong>in</strong>um”, <strong>In</strong>ternational<br />
Journal of Mach<strong>in</strong>e Tools & Manufacture, Vol. 43,<br />
pp. 1383-90.<br />
Cook, G.E., Crawford, R., Clark, D.E. and Strauss, A.M.<br />
(2004), “Robotic <strong>friction</strong> <strong>stir</strong> weld<strong>in</strong>g”, <strong>In</strong>dustrial Robot,<br />
Vol. 31 No. 1, pp. 55-63.<br />
Ericsson, M., J<strong>in</strong>, L-Z. and Sandstrom, R. (2007), “Fatigue<br />
properties of <strong>friction</strong> <strong>stir</strong> overlap welds”, <strong>In</strong>ternational<br />
Journal of Fatigue, Vol. 29, pp. 57-68.<br />
Fukunaga, K. (1972), <strong>In</strong>troduction to Statistical Pattern<br />
Recognition, Academic, New York, NY.<br />
Kawasaki, T., Mak<strong>in</strong>o, T., Masai, K., Ohba, H., <strong>In</strong>a, Y. and<br />
Ezumi, M. (2004), “Application of <strong>friction</strong> <strong>stir</strong> weld<strong>in</strong>g to<br />
construction of railway vehicles”, JSME <strong>In</strong>ternational<br />
Journal, Vol. 47, pp. 502-11.<br />
Lathi, B.P. (1998), Signal Process<strong>in</strong>g & L<strong>in</strong>ear Systems,<br />
Cambridge Press, Berkeley.<br />
Leonard, A.J. and Lockyer, S.A. (2003), “Flaws <strong>in</strong> <strong>friction</strong> <strong>stir</strong><br />
welds”, paper presented at 4th <strong>In</strong>ternational Symposium on<br />
Friction Stir Weld<strong>in</strong>g.<br />
Mish<strong>in</strong>a, O.K. and Norl<strong>in</strong>, A. (2003), “Lap jo<strong>in</strong>ts produced<br />
by FSW on flat alum<strong>in</strong>um EN AW-6082 profiles”, paper<br />
presented at 4th <strong>In</strong>ternational Symposium on Friction Stir<br />
Weld<strong>in</strong>g.<br />
Shlens, J. (2005), “A tutorial on pr<strong>in</strong>cipal component<br />
analysis”, Technical Report, Systems Neurobiology<br />
Laboratory, University of California, San Diego, CA.<br />
Well<strong>in</strong>g, M. (2007), Fisher L<strong>in</strong>ear Discrim<strong>in</strong>ant Analysis,<br />
Department of Computer Science, University of Toronto,<br />
Toronto, available at: www.cs.huji.ac.il/ , csip/Fisher-<br />
LDA.pdf<br />
Correspond<strong>in</strong>g author<br />
Sensor Review<br />
Volume 28 · Number 1 · 2008 · 62–67<br />
Paul Flem<strong>in</strong>g can be contacted at: paul.a.flem<strong>in</strong>g@<br />
vanderbilt.edu<br />
To purchase repr<strong>in</strong>ts of this article please e-mail: repr<strong>in</strong>ts@emerald<strong>in</strong>sight.com<br />
Or visit our web site for further details: www.emerald<strong>in</strong>sight.com/repr<strong>in</strong>ts<br />
67