Webinar Transcript Template - Stratis Health
Webinar Transcript Template - Stratis Health
Webinar Transcript Template - Stratis Health

Create successful ePaper yourself
Turn your PDF publications into a flip-book with our unique Google optimized e-Paper software.
need to talk with some others in my group.‖ Then if you go down the page you can see<br />
they’ve done that.<br />
The third one is LDL no LDL for patients with cardio vascular disease and hypertension.<br />
You can see that organization-wise 22% of the people had no LDL and again, clinic one<br />
was 25%, two was 34%, three is 23%, and again, clinic four seem to be doing better with<br />
6% where there was no LDL on file. Obviously, you want your LDL on file with patients<br />
having cardio vascular disease and high blood pressure.<br />
So, again, this is an example of how you can look across the clinics and prepare the two.<br />
Let me draw your attention to just one more. The very last one: no aspirin documented.<br />
Again, most people seem to have either the fact that they’re on aspirin or they aren’t or<br />
they have a reason for not being on aspirin. We have 6% for those (organization-wise),<br />
2% for clinic one, 7% for two, 14% for three, and 4% for four.<br />
Just looking at these numbers briefly you can see there’s a bit of a difference between<br />
clinics three and four, and given this analysis there is some good opportunity for clinic<br />
three to potentially learn from clinic four. How could you do this without the data?<br />
The next line is, over time for the first three quarters for the 2010, and this is patients who<br />
are tracked with their PF29 (their depression screens). If you look, the bottom line is the<br />
total patients who have depression, and you can see, organization-wise, it’s 484, 479,<br />
423, declining a little bit. Depression declines a little through the summer and into fall,<br />
which is good. But by fourth quarter it’s back up again.<br />
If you look at the percentages of PF29s that were accomplished, again you see 36, 42,<br />
49 organization-wide, so maybe just by looking at it they’re actually beginning to pay<br />
attention to it and do it more. You see the trend and clinic one goes from 34 to 44 and 54,<br />
clinic two 19 to 31 and 36, clinic three had a little bump 52, 63 and 47, and clinic four 40<br />
to 56 and 72. Again, you can see a trend going in an upward direction by and large,<br />
except for the blip on clinic three. So again if you begin measuring things and pay<br />
attention to things, you can begin to achieve your goals and objectives, consequently<br />
improving the care for the patients you’re seeing.<br />
The other thing that quality reports allow you to do is it allows you to drill down to find<br />
those people who have fallen through the cracks. As a provider, before an EHR, before<br />
running reports you could say I ordered A1Cs on every one of my diabetics that come to<br />
see me. The question is, what about the ones that don’t come to see you? Those are the<br />
people that sometimes may forget or miss their appointments. They need a reminder to<br />
come back in.<br />
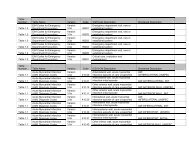
So if you look at the next slide you can see these are diabetic patients with a diabetic<br />
report for a particular physician, and if you look at the fourth line is someone who hasn’t<br />
had an LDL done in a while, they haven’t had an A1C and their blood pressure is 164/82,<br />
not good. That would be someone you might want to call to say ―Hey, we’d like you to<br />
come in for appointment. You haven’t been in for a while and we want to make sure<br />
you’re doing okay.‖<br />
You can also see that there are some here doing very well and I’m surprised to see an<br />
LDL at 42. That’s awesome! There are a couple others very similar, so by and large this<br />
Page 8