geographia - Studia
geographia - Studia
geographia - Studia
Create successful ePaper yourself
Turn your PDF publications into a flip-book with our unique Google optimized e-Paper software.
M. PĂTROESCU, CR. IOJĂ, D. ONOSE, G. VANAU, A. CUCU, R. CĂRCĂLE, C. CIOCĂNEA<br />
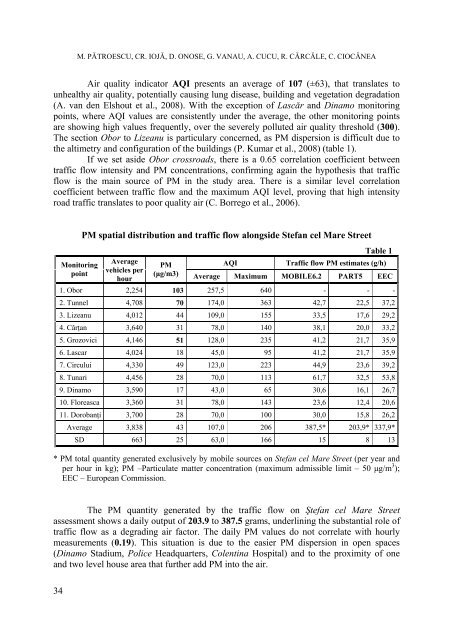
Air quality indicator AQI presents an average of 107 (±63), that translates to<br />
unhealthy air quality, potentially causing lung disease, building and vegetation degradation<br />
(A. van den Elshout et al., 2008). With the exception of Lascăr and Dinamo monitoring<br />
points, where AQI values are consistently under the average, the other monitoring points<br />
are showing high values frequently, over the severely polluted air quality threshold (300).<br />
The section Obor to Lizeanu is particulary concerned, as PM dispersion is difficult due to<br />
the altimetry and configuration of the buildings (P. Kumar et al., 2008) (table 1).<br />
If we set aside Obor crossroads, there is a 0.65 correlation coefficient between<br />
traffic flow intensity and PM concentrations, confirming again the hypothesis that traffic<br />
flow is the main source of PM in the study area. There is a similar level correlation<br />
coefficient between traffic flow and the maximum AQI level, proving that high intensity<br />
road traffic translates to poor quality air (C. Borrego et al., 2006).<br />
Monitoring<br />
point<br />
PM spatial distribution and traffic flow alongside Stefan cel Mare Street<br />
Average<br />
vehicles per<br />
hour<br />
Table 1<br />
PM<br />
AQI<br />
Traffic flow PM estimates (g/h)<br />
(μg/m3) Average Maximum MOBILE6.2 PART5 EEC<br />
1. Obor 2,254 103 257,5 640 - - -<br />
2. Tunnel 4,708 70 174,0 363 42,7 22,5 37,2<br />
3. Lizeanu 4,012 44 109,0 155 33,5 17,6 29,2<br />
4. Cârţan 3,640 31 78,0 140 38,1 20,0 33,2<br />
5. Grozovici 4,146 51 128,0 235 41,2 21,7 35,9<br />
6. Lascar 4,024 18 45,0 95 41,2 21,7 35,9<br />
7. Circului 4,330 49 123,0 223 44,9 23,6 39,2<br />
8. Tunari 4,456 28 70,0 113 61,7 32,5 53,8<br />
9. Dinamo 3,590 17 43,0 65 30,6 16,1 26,7<br />
10. Floreasca 3,360 31 78,0 143 23,6 12,4 20,6<br />
11. Dorobanţi 3,700 28 70,0 100 30,0 15,8 26,2<br />
Average 3,838 43 107,0 206 387,5* 203,9* 337,9*<br />
SD 663 25 63,0 166 15 8 13<br />
* PM total quantity generated exclusively by mobile sources on Stefan cel Mare Street (per year and<br />
per hour in kg); PM –Particulate matter concentration (maximum admissible limit – 50 μg/m 3 );<br />
EEC – European Commission.<br />
The PM quantity generated by the traffic flow on Ştefan cel Mare Street<br />
assessment shows a daily output of 203.9 to 387.5 grams, underlining the substantial role of<br />
traffic flow as a degrading air factor. The daily PM values do not correlate with hourly<br />
measurements (0.19). This situation is due to the easier PM dispersion in open spaces<br />
(Dinamo Stadium, Police Headquarters, Colentina Hospital) and to the proximity of one<br />
and two level house area that further add PM into the air.<br />
34


