Understanding Frontogenesis and its Application to Winter Weather ...
Understanding Frontogenesis and its Application to Winter Weather ...
Understanding Frontogenesis and its Application to Winter Weather ...

You also want an ePaper? Increase the reach of your titles
YUMPU automatically turns print PDFs into web optimized ePapers that Google loves.
<strong>Underst<strong>and</strong>ing</strong> <strong>Fron<strong>to</strong>genesis</strong> <strong>and</strong><br />
<strong>its</strong> <strong>Application</strong> <strong>to</strong><br />
<strong>Winter</strong> <strong>Weather</strong> Forecasting<br />
Ted Funk<br />
WFO Louisville, KY<br />
January 2004<br />
with contributing graphics from<br />
Peter Banacos<br />
S<strong>to</strong>rm Prediction Center<br />
Ron Przybylinski<br />
WFO St. Louis, MO
General Outline<br />
‣ <strong>Fron<strong>to</strong>genesis</strong> defined<br />
‣ Components of fron<strong>to</strong>genesis<br />
‣ What causes fron<strong>to</strong>genesis?:<br />
‣ Horizontal divergence/difluence<br />
‣ Horizontal deformation<br />
‣ Vorticity<br />
‣ Tilting effects<br />
‣ Diabatic heating<br />
‣ Development of the fron<strong>to</strong>genetical circulation<br />
‣ Use of fron<strong>to</strong>genesis in forecasting<br />
‣ Common synoptic patterns: strong sfc low; weak or no sfc low<br />
‣ Strong low case: Jan 6, 2002<br />
‣ Weak low case: Oct 15, 2001<br />
‣ Weak low case: Jan 7, 1999<br />
‣ Role of deep-layered wind shear<br />
‣ Deep-layered wind shear examples<br />
‣ Non-b<strong>and</strong>ed, multiple b<strong>and</strong>ed, <strong>and</strong> warm season b<strong>and</strong>ed precipitation<br />
‣ Spectrum of mesoscale instabilities; use of EPV <strong>and</strong> CSI<br />
‣ Stability versus b<strong>and</strong>ing comparison<br />
‣ Numerical model considerations: Feb 7, 2003<br />
‣ Suggested snow b<strong>and</strong> checklist
<strong>Fron<strong>to</strong>genesis</strong> Defined<br />
<strong>Fron<strong>to</strong>genesis</strong> (in general terms) refers <strong>to</strong> the change in the<br />
magnitude <strong>and</strong> orientation of the temperature gradient at a level or in<br />
a layer (e.g., 850-700 mb) due <strong>to</strong> directional <strong>and</strong> speed changes in<br />
the wind field.<br />
<strong>Fron<strong>to</strong>genesis</strong> (in specific terms) refers <strong>to</strong> an increase in the<br />
horizontal thermal gradient with time.<br />
Fron<strong>to</strong>lysis refers <strong>to</strong> a decrease in the horizontal thermal gradient<br />
with time.<br />
QG fron<strong>to</strong>genesis (using geostrophic winds) allows for diagnosis of<br />
forcing <strong>and</strong> vertical motion on the synoptic-scale (e.g., extratropical<br />
cyclones/large troughs <strong>and</strong> ridges) which may or may not support<br />
mesoscale processes.<br />
Petterssen’s 2-D 2 D fron<strong>to</strong>genesis uses the <strong>to</strong>tal wind which can help<br />
diagnose features on the mesoscale (100-500 km) such as b<strong>and</strong>ed<br />
precipitation structure.
<strong>Fron<strong>to</strong>genesis</strong> Defined (cont.)<br />
F<br />
=<br />
D<br />
Dt<br />
∇<br />
pθ<br />
(Petterssen 1936)<br />
The 2-D scalar fron<strong>to</strong>genesis function (F ) (i.e., F vec<strong>to</strong>r)<br />
quantifies the change in the horizontal (potential) temperature<br />
gradient following air parcel motion, where:<br />
F > 0 is fron<strong>to</strong>genesis, F < 0 is fron<strong>to</strong>lysis<br />
Conceptually, fron<strong>to</strong>genesis is the local change in the<br />
horizontal temperature gradient near an existing front,<br />
baroclinic zone, or feature as it moves.
Components of the <strong>Fron<strong>to</strong>genesis</strong> Function<br />
(F Vec<strong>to</strong>r)<br />
(Keyser et al. 1988, 1992)<br />
F<br />
=<br />
F n +<br />
n<br />
F<br />
s<br />
s<br />
D<br />
F n = − ∇ θ<br />
Dt<br />
p<br />
D<br />
F s = n⋅( k × ∇pθ<br />
)<br />
Dt<br />
The F vec<strong>to</strong>r is the full wind version of the quasigeostrophic<br />
Q vec<strong>to</strong>r. It can be broken down in<strong>to</strong> 2<br />
components (natural coordinates): Fn <strong>and</strong> Fs.<br />
Fn:<br />
-Fron<strong>to</strong>genetical (dominant) component of F<br />
-Directed perpendicular <strong>to</strong> temperature lines<br />
-Refers <strong>to</strong> changes in magnitude of thermal gradient<br />
-Corresponds <strong>to</strong> vertical motion on the frontal scale<br />
(mesoscale b<strong>and</strong>s)<br />
Fs:<br />
-Rotational component of F<br />
-Directed parallel <strong>to</strong> isotherms/thicknesses<br />
-Refers <strong>to</strong> changes in direction (orientation) of<br />
thermal gradient with no magnitude change<br />
-Corresponds <strong>to</strong> synoptic-scale vertical motion<br />
on the scale of the baroclinic wave <strong>its</strong>elf
Fn <strong>and</strong> Fs Vec<strong>to</strong>rs<br />
When F vec<strong>to</strong>rs point from cold-<strong>to</strong>-warm (warm-<strong>to</strong>-cold) air in the low-<strong>to</strong>-mid<br />
levels of the atmosphere, fron<strong>to</strong>genesis (fron<strong>to</strong>lysis) is occurring.<br />
Fn vec<strong>to</strong>rs can be very important (the dominant term), <strong>and</strong> force vertical<br />
motion on the mesoscale/frontal scale. Fn describes how the magnitude of<br />
the thermal gradient is changing, i.e., the gradient is becoming stronger<br />
(fron<strong>to</strong>genesis) via confluence or deformation or weaker (fron<strong>to</strong>lysis) via<br />
difluence. Fn vec<strong>to</strong>rs are longest where the thermal gradient is changing the<br />
most, not necessarily where the tightest thermal gradient exists. Fn vec<strong>to</strong>rs<br />
are available in AWIPS.<br />
Fs vec<strong>to</strong>rs describe temperature advection patterns, <strong>and</strong> force vertical<br />
motion on the synoptic scale. Fs describes how the orientation of the<br />
isotherms/thicknesses is changing with time due <strong>to</strong> horizontal changes in<br />
the wind. Fs vec<strong>to</strong>rs are most pronounced in areas where the wind is<br />
tending <strong>to</strong> rotate isotherms significantly, i.e., in areas of strong warm <strong>and</strong><br />
cold advection. The longer the Fs vec<strong>to</strong>rs, the greater the temperature<br />
advection pattern <strong>and</strong> forcing for synoptic scale vertical motion.
What Causes <strong>Fron<strong>to</strong>genesis</strong>?<br />
The geometry of the horizontal flow has a strong<br />
influence on fron<strong>to</strong>genesis in most situations.<br />
Two main processes (parameters) make<br />
significant separate contributions <strong>to</strong><br />
the field of fron<strong>to</strong>genesis:<br />
Divergence<br />
Deformation<br />
The focus here is exclusively on Petterssen’s 2-D<br />
scalar fron<strong>to</strong>genesis (Fn)
Horizontal Divergence/Difluence<br />
Regardless of isotherm orientation, divergence (convergence)<br />
acts fron<strong>to</strong>lytically (fron<strong>to</strong>genetically).<br />
<strong>Fron<strong>to</strong>genesis</strong><br />
(F>0; right) due<br />
<strong>to</strong> convergence<br />
oriented nearly<br />
perpendicular <strong>to</strong><br />
a thermal<br />
gradient.<br />
F
Horizontal Divergence/Difluence<br />
Left 2 diagrams: Confluent wind field applied <strong>to</strong> the thermal gradient.<br />
At a later time (T+1), the wind acts <strong>to</strong> increase the thermal gradient,<br />
thus a fron<strong>to</strong>genetical situation.<br />
Right 2 diagrams: Difluent wind field applied <strong>to</strong> the thermal gradient.<br />
At a later time (T+1), the wind acts <strong>to</strong> decrease the thermal gradient,<br />
thus a fron<strong>to</strong>lytical situation.
Horizontal Divergence/Difluence<br />
850-700 mb winds (kts) <strong>and</strong> temps, <strong>and</strong> 1000-500 mb RH image from AWIPS on Feb 15, 2003.<br />
A rough qualitative assessment of 2-D fron<strong>to</strong>genesis can be made by viewing level or layeraverage<br />
temperatures <strong>and</strong> isotherms. In the image above, fron<strong>to</strong>genesis in the 850-700 mb<br />
layer is implied over central <strong>and</strong> southern IN <strong>and</strong> OH, northern KY, <strong>and</strong> central IL where the<br />
winds indicate convergence superimposed on <strong>and</strong> directed nearly perpendicular <strong>to</strong> an<br />
existing tight thermal gradient. The fron<strong>to</strong>genesis can be quantified by viewing 2-D<br />
fron<strong>to</strong>genesis <strong>and</strong> Fn vec<strong>to</strong>rs in AWIPS (see next slide) . The convergence of the Fn vec<strong>to</strong>rs<br />
represents forcing for ascent.
Horizontal Divergence/Difluence<br />
850-700 mb Petterssen's 2-D fron<strong>to</strong>genesis (con<strong>to</strong>urs), Fn vec<strong>to</strong>rs (blue arrows),<br />
<strong>and</strong> 1000-500 mb RH image (purple=highest RH) from AWIPS on Feb 15, 2003.<br />
The con<strong>to</strong>ured fron<strong>to</strong>genesis above quantifies the implied fron<strong>to</strong>genesis from observing<br />
winds <strong>and</strong> isotherms from the previous slide. Fn vec<strong>to</strong>rs are longest where<br />
fron<strong>to</strong>genesis is greatest. The length of a vec<strong>to</strong>r is valid at <strong>its</strong> origin point (not <strong>its</strong><br />
arrowhead). The vec<strong>to</strong>rs point from cold-<strong>to</strong>-warm air, thus a fron<strong>to</strong>genetical situation is<br />
shown over the Ohio Valley.
Horizontal Deformation<br />
F>0<br />
Flow fields involving deformation acting fron<strong>to</strong>genetically are prominent in the<br />
majority of b<strong>and</strong>ed precipitation cases.<br />
Axis of dilatation: axis along which flow is being stretched (deformed) due <strong>to</strong> convergence<br />
in the flow; oriented parallel <strong>to</strong> the stretching due <strong>to</strong> the deformation field<br />
Axis of contraction: axis along which flow is being compacted within the deformation<br />
field; oriented perpendicular <strong>to</strong> the dilatation axis
Horizontal Deformation<br />
F 45º (near left),<br />
the wind field is acting fron<strong>to</strong>lytically<br />
(decrease in thermal gradient).<br />
Streamline analysis is a good <strong>to</strong>ol for<br />
detecting deformation zones. Normally,<br />
the axis of dilatation is associated with<br />
a fron<strong>to</strong>genetical situation.
Other Contributing Fac<strong>to</strong>rs <strong>to</strong> <strong>Fron<strong>to</strong>genesis</strong><br />
Deformation <strong>and</strong> divergence fields play the most<br />
prominent role in 2-D fron<strong>to</strong>genesis aloft.<br />
However, other processes can contribute <strong>to</strong><br />
fron<strong>to</strong>genesis, including:<br />
Vorticity<br />
Tilting effects<br />
Diabatic heating
Vorticity/Shear<br />
Pure vorticity acts<br />
<strong>to</strong> rotate isotherms,<br />
it cannot tighten or<br />
weaken the<br />
gradient.<br />
Fn=0<br />
If a sheared wind field (containing<br />
vorticity) is applied <strong>to</strong> an initially<br />
uniform thermal gradient (warm –<br />
left side; cold – right side), the wind<br />
field will act <strong>to</strong> rotate the thermal<br />
gradient at a later time.
Tilting Effects<br />
In these cases, the<br />
temperature gradient is in<br />
the vertical as opposed <strong>to</strong><br />
the horizontal in the<br />
preceding examples. The<br />
temperature gradient is<br />
being tilting by the vertical<br />
motion field.<br />
Above (left 2 images), differential vertical motion acts <strong>to</strong> increase the<br />
thermal gradient, i.e., fron<strong>to</strong>genetically.<br />
Above (right 2 images), differential vertical motion acts <strong>to</strong> decrease the<br />
thermal gradient, i.e., fron<strong>to</strong>lytically.
Diabatic Heating<br />
Diabatic Heating can act<br />
fron<strong>to</strong>genetically (<strong>to</strong>p image) or<br />
fron<strong>to</strong>lytically (bot<strong>to</strong>m image).<br />
Top (cold air on left; warm air on right):<br />
cloud cover is limiting radiational warming<br />
on colder left side, while cloud-free warm<br />
area on right heats up. Thus, thermal<br />
gradient strengthens (fron<strong>to</strong>genetical).<br />
Bot<strong>to</strong>m (cold air on left; warm air on right):<br />
the sun warms the cloud-free cold air while<br />
cloud cover lim<strong>its</strong> radiational warming in<br />
the warm air mass. Thus, thermal gradient<br />
weakens (fron<strong>to</strong>lytic).<br />
Small-scale low-level fron<strong>to</strong>genesis due <strong>to</strong> diabatic heating can be<br />
important in unstable environments, where the resulting small-scale<br />
frontal lift causes convective development.
Development of the Fron<strong>to</strong>genetical Circulation<br />
-When the temperature gradient<br />
strengthens, geostrophic <strong>and</strong><br />
hydrostatic balance are disturbed.<br />
-Thus, QG theory states that the<br />
atmosphere responds <strong>to</strong> the<br />
disturbance (fron<strong>to</strong>genetical<br />
forcing) through ageostrophic<br />
vertical circulations which attempt<br />
<strong>to</strong> res<strong>to</strong>re thermal wind balance<br />
(the response). This is<br />
accomplished as the geostrophic<br />
winds aloft <strong>and</strong> at low-levels<br />
respond <strong>to</strong> maintain balance.<br />
-Winds aloft cut <strong>to</strong> the north (<strong>to</strong>p image), while winds below cut <strong>to</strong> the south<br />
(bot<strong>to</strong>m image) creating regions of divergence/convergence. Upward (downward)<br />
motions develop across the southern (northern) part of the plane, respectively.<br />
The upward motion field occurs on the southern edge of the axis of maximum<br />
fron<strong>to</strong>genesis, <strong>and</strong> slopes <strong>to</strong>ward cold air with height.
Development of the Fron<strong>to</strong>genetical Circulation<br />
-<strong>Fron<strong>to</strong>genesis</strong> produces a mesoscale direct<br />
thermal circulation that is sloped with height<br />
<strong>to</strong>ward cold air.<br />
-Fn vec<strong>to</strong>rs are longest where fron<strong>to</strong>genesis is<br />
the greatest.<br />
-Fn vec<strong>to</strong>r convergence (forcing for lift) occurs<br />
on southern/eastern periphery of maximum<br />
fron<strong>to</strong>genesis area (as shown above).<br />
-A steeply sloped fron<strong>to</strong>genetical zone in low<strong>to</strong>-mid<br />
levels can produce a definitive b<strong>and</strong><br />
of heavy precipitation (rain or snow).<br />
-The direct thermal circulation acts <strong>to</strong><br />
weaken the temperature gradient (<strong>and</strong><br />
res<strong>to</strong>re balance) by producing lift <strong>and</strong><br />
adiabatic cooling on the warm side,<br />
<strong>and</strong> weaker decent <strong>and</strong> adiabatic<br />
warming on the cold side of the<br />
maximum fron<strong>to</strong>genetical area. Thus,<br />
the vertical motion response <strong>to</strong><br />
fron<strong>to</strong>genesis actually is fron<strong>to</strong>lytic.
Development of the Fron<strong>to</strong>genetical Circulation<br />
Fron<strong>to</strong>genetical Circulation<br />
Cold<br />
Warm<br />
Fron<strong>to</strong>genetical Circulation + WSS/CSI<br />
Cold<br />
Warm<br />
Top: Simplified, general fron<strong>to</strong>genetical circulation associated with a stable environment.<br />
Bot<strong>to</strong>m: In the presence of weak symmetric stability (WSS) or especially CSI (i.e., the coexistence<br />
of fron<strong>to</strong>genesis <strong>and</strong> small or negative values of EPV), the updrafts of the<br />
fron<strong>to</strong>genetical circulation become stronger <strong>and</strong> more concentrated than in a stable<br />
environment. Thus, one MUST assess stability when considering forcing <strong>and</strong> subsequent lift.
Development of the Fron<strong>to</strong>genetical Circulation<br />
Above left: 850-700 mb Fn vec<strong>to</strong>rs (blue arrows) <strong>and</strong> Fn vec<strong>to</strong>r<br />
divergence (green lines; dashed lines = convergence), 1000-500 mb<br />
RH image from AWIPS at 06 utc Feb 15, 2003. Above right: KLVX<br />
radar 0.5 deg reflectivity image over central KY at 06 utc Feb 15. At<br />
right: 850-700 mb winds, temps, fron<strong>to</strong>genesis, <strong>and</strong> Fn vec<strong>to</strong>rs<br />
(shown earlier) from which above left image was derived.<br />
A concentrated axis of Fn vec<strong>to</strong>r convergence represented<br />
forcing for strong ascent over central KY. Given air mass<br />
saturation (purple RH), b<strong>and</strong>ed heavy rainfall resulted, which<br />
matched up very well with fron<strong>to</strong>genetical forcing/circulation.
Development of the Fron<strong>to</strong>genetical Circulation<br />
(An Alternative Depiction)<br />
Flow field<br />
dominated by<br />
convergence<br />
<strong>and</strong> subsequent<br />
deformation<br />
along <strong>and</strong> near<br />
the axis of<br />
dilatation.
Development of the Fron<strong>to</strong>genetical Circulation<br />
(An Alternative Depiction)<br />
PGF=Pressure<br />
Gradient Force<br />
In response <strong>to</strong> increasing temperature gradient,<br />
ageostrophic vertical circulation develops with<br />
convergence/ascent on warm side of maximum<br />
fron<strong>to</strong>genesis, <strong>and</strong> divergence aloft.
Development of the Fron<strong>to</strong>genetical Circulation<br />
(An Alternative Depiction)<br />
The fron<strong>to</strong>genetical zone <strong>and</strong> thus responsive vertical circulation usually slopes with<br />
height <strong>to</strong>ward cold air. Thus, ascent aloft can still occur above the area of low-level<br />
maximum fron<strong>to</strong>genesis or even Fn vec<strong>to</strong>r divergence. The steeper the slope, the better<br />
the potential for heavy precipitation. When evaluating fron<strong>to</strong>genetical forcing, it’s the<br />
resulting ageostrophic circulation that is most important for precipitation forecasting.
Use of <strong>Fron<strong>to</strong>genesis</strong> in Forecasting<br />
- <strong>Fron<strong>to</strong>genesis</strong> (usually in 850-500 mb layer) can occur with a variety of<br />
environments, including deep meridional flow, zonal flow, deep surface low<br />
systems, <strong>and</strong> non-surface low systems.<br />
- Fron<strong>to</strong>genetical circulations within stable environments typically result in<br />
one primary b<strong>and</strong> of heavy precipitation which is nearly parallel <strong>to</strong> the frontal<br />
zone. The potential for b<strong>and</strong>ing can be assessed easily using numerical<br />
models, even though model QPF fields likely will not reflect the b<strong>and</strong>ing<br />
potential.<br />
- The strength of the circulation is affected by the ambient static stability.<br />
- As stability decreases, the horizontal scale (width) of the b<strong>and</strong> often<br />
decreases while the intensity of the b<strong>and</strong> (reflectivity) increases.<br />
- Greater instability results in classic CSI multiple b<strong>and</strong>s of heavy<br />
precipitation.
Common Synoptic Patterns<br />
Forecast premise for mesoscale precipitation b<strong>and</strong>ing:<br />
- Requires a strengthening baroclinic zone in the presence of<br />
sufficient moisture for precipitation (AND the proper thermal<br />
stratification for snow).<br />
- Deformation zones are the most common means of manifesting<br />
areas of fron<strong>to</strong>genesis within the 850-500mb layer.<br />
- The presence of fron<strong>to</strong>genesis does NOT require a strong<br />
surface cyclone, only a low-mid tropospheric baroclinic zone.<br />
TWO CLASSES (TYPES) OF BANDS:<br />
I. B<strong>and</strong>s associated with significant surface lows<br />
II.<br />
B<strong>and</strong>s associated with weak/no surface lows
Type I: Significant Surface Low Pattern<br />
<strong>Fron<strong>to</strong>genesis</strong> is common in the developing <strong>and</strong> mature stages of a low<br />
pressure system, but not in the dissipating stage when precipitation rates<br />
decrease. In mature systems, fron<strong>to</strong>genesis <strong>and</strong> potentially heavy “wrap<br />
around precipitation” can occur <strong>to</strong> the northwest of the surface cyclone.<br />
Mature Stage<br />
Precipitation<br />
b<strong>and</strong><br />
Decaying<br />
Stage
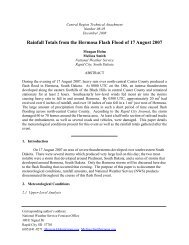
Type I Example: Jan 06, 2002<br />
With a strong surface low, heavy b<strong>and</strong>ed precipitation often is <strong>to</strong> the north or northwest<br />
of the low near a deformation zone (comma head). Animated radar imagery in this event<br />
(not available) showed this snow b<strong>and</strong> became very pronounced with time <strong>and</strong> shifted<br />
northeast across southeastern New York, southern Vermont, <strong>and</strong> New Hampshire.
Snowfall Accumulations<br />
The deformation axis/fron<strong>to</strong>genetically-induced snow b<strong>and</strong> produced a well-defined<br />
axis of very heavy snowfall accumulations in the s<strong>to</strong>rm.
II. Frontal / Weak Surface Low Pattern<br />
Precipitation b<strong>and</strong><br />
In these situations, look for:<br />
-Confluent flow around 700mb in advance of a positively tilted trough.<br />
-Weak or non-existent surface wave cyclone along the surface front.<br />
-Deformation <strong>and</strong> convergence creating fron<strong>to</strong>genetical forcing north of the front,<br />
resulting in a b<strong>and</strong> of precipitation.<br />
-Most common given sufficient low-mid-level baroclinicity <strong>and</strong> adequate moisture.
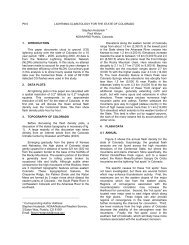
Type II Example: Oct 15, 2001<br />
700 mb 00 utc 15 Oct: A weak trough was located over New Mexico <strong>and</strong> eastern<br />
Colorado, with confluent flow over eastern Kansas.
Type II Example: Oct 15, 2001<br />
Sfc map 00 utc 15 Oct: A weak low was<br />
over Colorado, with warm air <strong>to</strong> the south<br />
<strong>and</strong> cooler air <strong>to</strong> the northeast.<br />
Sfc map 12 utc 15 Oct: A weak low moved<br />
or reformed over OK, with a weak front<br />
extending through eastern KS <strong>and</strong> MO.
Type II Example: Oct 15, 2001<br />
925 mb 12 utc 15 Oct: Above the surface, note that the wind fields suggested<br />
a tightening thermal gradient across eastern Kansas <strong>and</strong> western Missouri<br />
where convergence was resulting in a stretching deformation field.
Type II Example: Oct 15, 2001<br />
18 utc 15 Oct mosaic base<br />
reflectivity <strong>and</strong> surface<br />
observations (cold front<br />
shown in blue; dashed line<br />
denotes main precipitation<br />
b<strong>and</strong> associated with<br />
deformation)<br />
18 utc 15 Oct 600mb fron<strong>to</strong>genesis<br />
(solid red lines); significant forcing<br />
existed aloft despite the weak sfc low<br />
A narrow b<strong>and</strong> (1-2 counties wide) of<br />
moderate-<strong>to</strong>-heavy rainfall occurred<br />
from eastern KS <strong>to</strong> central IL. Kirksville,<br />
MO reported 0.25 inches per hour as the<br />
b<strong>and</strong> passed through, with lower rates<br />
outside of the b<strong>and</strong>.
Type II Example: Oct 15, 2001<br />
0 hr ETA 12z 6 hr ETA 18z<br />
1150z<br />
1805z<br />
700 mb fron<strong>to</strong>genesis (<strong>to</strong>p) <strong>and</strong> base reflectivity (bot<strong>to</strong>m): Organization of precipitation<br />
in<strong>to</strong> a b<strong>and</strong>ed structure increases as the fron<strong>to</strong>genesis orientation becomes aligned with<br />
the isotherm orientation at low-<strong>to</strong>-mid levels.
Sloped Continuity of <strong>Fron<strong>to</strong>genesis</strong><br />
600 mb<br />
6-hr ETA forecast valid<br />
18 utc 15 Oct 01<br />
700 mb<br />
The use of a spatialheight<br />
cross-section,<br />
allows excellent<br />
visualization of sloping<br />
fron<strong>to</strong>genetical zones.<br />
850 mb<br />
The presence of quasi-parallel axes of<br />
positive fron<strong>to</strong>genesis at individual levels<br />
sloping upward <strong>to</strong>ward colder air is a<br />
common aspect of heavy b<strong>and</strong>ed precipitation<br />
areas. The degree of slope is important;<br />
a steeper slope implies greater lift.
Type II Example: Jan 7, 1999<br />
At 500 mb, the mean long-wave<br />
trough extended from the eastern<br />
Great Lakes through TN, with a<br />
500 mb jet streak (100 kts) from<br />
southern PA through IN. Moisture<br />
was noted over MO near the broad<br />
right entrance region of the 500<br />
mb jet.<br />
At 850 mb, warm advection was noted<br />
across the central <strong>and</strong> southern<br />
Plains. Weak warm advection <strong>to</strong><br />
neutral advection prevailed over MO<br />
<strong>and</strong> IL. A large area of low-level<br />
moisture extended from CO through<br />
southern IL <strong>to</strong> the East Coast.
Type II Example: Jan 7, 1999<br />
At the surface, cold high pressure<br />
was along the IA-IL border at 12 utc<br />
Jan 7 with a light northeast flow<br />
(weak cold conveyer belt) over MO.<br />
There was no discernible surface<br />
low, just an inverted surface trough<br />
over MO. This was a reflection of<br />
divergence <strong>and</strong> fron<strong>to</strong>genetical<br />
forcing aloft.<br />
SGF sounding (12 utc Jan 7) showed a cold<br />
boundary layer with a warmer frontal zone<br />
above 950 mb. Sounding exhibited good speed<br />
shear, <strong>and</strong> was conditionally unstable above<br />
690 mb, suggesting organized b<strong>and</strong>ed precip<br />
was possible. The elevated warmer, dry layer<br />
would cool <strong>and</strong> moisten due <strong>to</strong> seeder-feeder<br />
processes from moisture above.
Type II Example: Jan 7, 1999<br />
2-D Petterssen’s <strong>Fron<strong>to</strong>genesis</strong> at 700 mb (left) <strong>and</strong> 500 mb (right) at 1200 utc Jan 7<br />
At 700 mb, fron<strong>to</strong>genesis extended from southern Minnesota <strong>to</strong> western Kentucky. The<br />
region of implied lift (i.e., convergence of Fn vec<strong>to</strong>rs) stretched from southwest Iowa <strong>to</strong><br />
south-central/southeast Missouri. At this time, snow was occurring over northwest <strong>and</strong><br />
central Missouri, nearly coincident with fron<strong>to</strong>genetical forcing aloft.<br />
At 500 mb, fron<strong>to</strong>genesis extended from eastern South Dakota <strong>to</strong> southern Lake<br />
Michigan. Implied mid-level lift extended along the southern part of this axis across<br />
southern Iowa/northern Missouri in<strong>to</strong> central Illinois.
Type II Example: Jan 7, 1999<br />
Spatial-height cross-sections at 1200 utc Jan 7 extending from 75 nm southeast of MSP, MN<br />
(left side of images) <strong>to</strong> 100 nm west of JAN, MS (right side)<br />
Above left, 2e surfaces are parallel <strong>to</strong> or more steeply sloped than the absolute geostrophic<br />
momentum (Mg) surfaces aloft within the blue line (mid <strong>to</strong> upper Mississippi Valley). This<br />
area suggests the presence of CSI which could result in multiple b<strong>and</strong>ing of precipitation<br />
given existing fron<strong>to</strong>genetical forcing. EPV (above right) is 0 or negative, i.e., CSI is present,<br />
in nearly the same area as shown by Mg <strong>and</strong> 2e. The use of spatial-height cross-sections is<br />
imperative <strong>to</strong> assess CSI, EPV, <strong>and</strong> sloped fron<strong>to</strong>genesis, <strong>and</strong> their affect on precipitation.
Type II Example: Jan 7, 1999<br />
0629z 1/7/99<br />
1317z 1/7/99<br />
1428z 1/7/99 1603z 1/7/99<br />
This sequence of 0.5<br />
deg reflectivity images<br />
shows evolution of<br />
b<strong>and</strong>ed snowfall in<br />
this case (upper left<br />
image in radar clear<br />
air mode). For most of<br />
the event, a primary<br />
mesoscale b<strong>and</strong> was<br />
evident with a sharp<br />
reflectivity gradient on<br />
the southern edge,<br />
suggesting focused<br />
fron<strong>to</strong>genetical<br />
forcing was dominant.<br />
However, there was<br />
evidence of smaller<br />
scale sub-b<strong>and</strong>s <strong>and</strong><br />
multiple b<strong>and</strong>s (e.g.,<br />
1317z) suggesting the<br />
presence of low EPV<br />
values/release of CSI.
Type II Example: Jan 7, 1999<br />
The primary snow b<strong>and</strong> resulted in a narrow axis of 5 inch amounts over eastern MO<br />
<strong>and</strong> west-central IL, north of St. Louis. The b<strong>and</strong> moved slowly northward with time,<br />
thus the south-<strong>to</strong>-north gradient in amounts was not as tight as suggested by the<br />
tight reflectivity gradient in radar.<br />
Bot<strong>to</strong>m Line: Even within a weak system with only a weak or no surface low,<br />
fron<strong>to</strong>genetical forcing <strong>and</strong> elevated CSI can still exist resulting in b<strong>and</strong>ed<br />
precipitation <strong>and</strong> significant precipitation rates.
Role of Deep-Layered Wind Shear<br />
Fron<strong>to</strong>genetically-forced precipitation b<strong>and</strong>ing is most common given a strong vertical<br />
wind shear (especially speed shear) <strong>and</strong> a straight-line hodograph aloft.
Role of Deep-Layered Wind Shear<br />
Martin (1998)<br />
In this case, deep-layer speed shear was significant. Note that the heavy precipitation<br />
b<strong>and</strong>s were oriented parallel <strong>to</strong> the isentropes/isotherms. Given multiple b<strong>and</strong>s, it is<br />
likely these are associated with the release of CSI in addition <strong>to</strong> fron<strong>to</strong>genesis.
Deep-Layer Shear Example: 12/29/02<br />
RUC 2-hr fron<strong>to</strong>genesis forecast at 850 mb (red<br />
lines; 700 mb fron<strong>to</strong>genesis was <strong>to</strong> northwest of<br />
850 mb area). Note definitive b<strong>and</strong> of precipitation.<br />
This occurred in an environment with significant<br />
vertical speed shear (image at right) <strong>and</strong> a quasistraight-line<br />
hodograph (not shown).
Deep-Layer Shear Example: 01/26/03<br />
This example shows b<strong>and</strong>ed precipitation<br />
along the southern/western edge of<br />
700 mb fron<strong>to</strong>genesis. The b<strong>and</strong>ing was<br />
associated with vertical wind shear <strong>and</strong><br />
a straight-line hodograph aloft. Heavy<br />
precipitation did not occur due <strong>to</strong><br />
limited moisture <strong>and</strong> fast movement.<br />
Radar reflectivity image (clear air mode) in<br />
North Dakota <strong>and</strong> RUC-forecasted 700 mb<br />
fron<strong>to</strong>genesis (thin red lines).
Non-B<strong>and</strong>ed Precipitation Example: 12/25/02<br />
RUC 700 mb heights (orange) <strong>and</strong> fron<strong>to</strong>genesis (red) over the Ohio Valley.<br />
Note that the heaviest precipitation is along the southern gradient of the maximum<br />
700 mb fron<strong>to</strong>genesis, although definitive b<strong>and</strong>ing was not present. The nature of the<br />
vertical wind profile <strong>and</strong> hodograph (next slide) apparently played a role in this.
Non-B<strong>and</strong>ed Precipitation Example: 12/25/02<br />
In this case, note the strong curvature in<br />
the shear vec<strong>to</strong>r with height<br />
(hodograph). This may preclude<br />
coherent b<strong>and</strong>ing, even in the presence<br />
of fron<strong>to</strong>genesis. Nevertheless, the<br />
presence of significant fron<strong>to</strong>genetical<br />
forcing <strong>and</strong> moisture still could well lead<br />
<strong>to</strong> an area of heavy precipitation.
Multiple B<strong>and</strong>ed Precipitation Example: 11/09/00<br />
Montgomery Co. <br />
INX 0903Z<br />
In this case, multiple narrow b<strong>and</strong>s of precipitation occurred, due <strong>to</strong> lower stability<br />
(i.e., the release of elevated CSI) combined with fron<strong>to</strong>genetical forcing.
700-500mb Lapse Rate Comparison<br />
SGF 12z<br />
TOP 12z<br />
11/09/00<br />
10/15/01<br />
7.8 C/km 4.5 C/km<br />
Note the steep lapse rates from 700-500 mb at SGF (corresponding <strong>to</strong> radar image on<br />
previous slide). Near neutral or unstable lapse rates (with respect <strong>to</strong> a moist adiabat) implies<br />
multiple narrow <strong>and</strong> intense b<strong>and</strong>s (maybe 5-10 km or so in width). This resulted in 2-3”/hr<br />
snowfall rates on Nov 9, 2000. The TOP lapse rate was not as steep from 700-500 mb, <strong>and</strong><br />
was associated with a more general single b<strong>and</strong> of precipitation (see earlier slides).
Modulation of B<strong>and</strong> Intensity by Instability<br />
for a Constant Value of <strong>Fron<strong>to</strong>genesis</strong><br />
As gravitational or<br />
symmetric stability<br />
decreases, the<br />
horizontal scale (width)<br />
of a precipitation b<strong>and</strong><br />
decreases while the<br />
intensity (reflectivity) of<br />
the b<strong>and</strong> increases.<br />
Multiple b<strong>and</strong>s become<br />
established in an<br />
unstable regime. Thus,<br />
it is very important <strong>to</strong><br />
look for CSI <strong>and</strong><br />
convectively unstable<br />
areas aloft besides just<br />
fron<strong>to</strong>genesis.
Warm Season B<strong>and</strong>ed Precip Example: 6/27/01<br />
While most important during the cool season when<br />
baroclinicity is greatest, low-level <strong>and</strong> surface<br />
fron<strong>to</strong>genesis also can be important in the convective<br />
season. The forcing produced by the fron<strong>to</strong>genesis<br />
may be enough <strong>to</strong> initiate deep convection given<br />
adequate instability. Convergence, deformation, <strong>and</strong><br />
diabatic heating contribute <strong>to</strong> the fron<strong>to</strong>genesis.<br />
VIS 1500Z<br />
TLX 1459Z
Spectrum of Mesoscale Instabilities; EPV<br />
From Moore <strong>and</strong><br />
Lambert (1993)<br />
Many heavy precipitation events display different types of mesoscale instabilities including:<br />
- Convective Instability: CI; 2 e decreasing with height<br />
- Conditional Symmetric Instability: CSI; lines of 2 e are more vertical than lines of<br />
constant absolute geostrophic momentum or M g<br />
- Weak Symmetric Stability: WSS; lines of 2 e are nearly parallel <strong>to</strong> lines of constant<br />
absolute geostrophic momentum or M g , but still can result in b<strong>and</strong>ed heavy<br />
precipitation in the presence of sufficient fron<strong>to</strong>genetical forcing
Spectrum of Mesoscale Instabilities; EPV<br />
- Equivalent Potential Vorticity (EPV) is a parameter that can be used <strong>to</strong> diagnose<br />
areas of CSI simply <strong>and</strong> effectively.<br />
- Look for areas of negative or small positive EPV.<br />
- Consider the terms of the EPV equation (Moore <strong>and</strong> Lambert 1993):<br />
EPV<br />
=<br />
g<br />
⎡⎛<br />
⎢⎜<br />
⎣⎝<br />
∂M<br />
∂p<br />
g<br />
∂θ<br />
∂x<br />
e<br />
⎞<br />
⎟<br />
⎠<br />
−<br />
⎛<br />
⎜<br />
⎝<br />
∂M<br />
∂x<br />
g<br />
∂θ<br />
∂p<br />
e<br />
⎞⎤<br />
⎟⎥<br />
⎠⎦<br />
- The closer EPV is <strong>to</strong> zero, the more responsive the atmosphere will be <strong>to</strong> a given<br />
amount of forcing.<br />
- EPV will be smallest (near zero or negative) given a strong south-<strong>to</strong>-north<br />
horizontal 2e gradient, significant vertical wind speed shear, near entrance regions<br />
of jet streaks, <strong>and</strong> where 2e decreases with height (although convective instability<br />
also will be present).<br />
- If EPV < 0 , then CSI is present. Overlaying geostrophic momentum (Mg) with 2e<br />
on a spatial-height cross-section is an effective way <strong>to</strong> determine if CSI or convective<br />
(gravitational) instability exists.
Spectrum of Mesoscale Instabilities; EPV<br />
Example from Moore <strong>and</strong> Lambert (1993) showing elevated CSI (within<br />
dashed area) where the dashed 2e lines are more vertical than the solid Mg<br />
lines (left). In this same area, EPV values are around or below zero<br />
(shaded areas on right diagram).
Spectrum of Mesoscale Instabilities; EPV<br />
Spatial-height cross-section from central GA (left) through central KY <strong>to</strong> west-central IN on Feb 15,<br />
2003. Shown are 2e (blue lines), Mg (green lines), <strong>and</strong> RH image (purple=high RH).<br />
The cross-section shows a very stable boundary layer (tight 2e packing <strong>and</strong> increasing with<br />
height). Aloft, an area of convective instability (2e decreasing with height) is outlined in red. An<br />
area of CSI (given saturation) is within the yellow area (2e sloped steeper than Mg). Finally, an area<br />
of weak symmetric stability is outlined in dark blue where 2e is sloped about the same as Mg.
Stability vs. B<strong>and</strong>ing Comparison<br />
2-D 750mb<br />
fron<strong>to</strong>genesis<br />
700 mb EPV = thick dashed lines<br />
600 mb EPV = thin dashed lines<br />
EPV valid 00z Oct 22<br />
3-hr RUC forecast<br />
valid 00z<br />
0018z 22 Oct 02<br />
ND<br />
MT<br />
750 mb fron<strong>to</strong>genesis is noted over Montana <strong>and</strong> North Dakota. Meanwhile, negative<br />
EPVs existed over the southern half of Montana (on southward), with more stable<br />
EPVs over North Dakota. Note the difference in b<strong>and</strong>ing structure at 0018 utc:<br />
fron<strong>to</strong>genesis produced b<strong>and</strong>ing, but multiple b<strong>and</strong>ing existed near the area of<br />
negative EPVs, with a single b<strong>and</strong> in the more stable environment over North Dakota.
Stability vs. B<strong>and</strong>ing Comparison<br />
700-500mb lapse rate: 6.7 C/km<br />
700-500mb lapse rate: 5.1 C/km<br />
850-500mb lapse rate: 3.5 C/km<br />
Great Falls, MT<br />
Bismarck, ND<br />
The Great Falls sounding at 00 utc Oct 22 showed steeper mid-level lapse rates than at<br />
Bismarck. This compares favorably with the negative EPVs <strong>and</strong> the multiple b<strong>and</strong>ed<br />
precipitation on the previous slide. The more stable air near Bismarck was associated<br />
with a single b<strong>and</strong> within the fron<strong>to</strong>genetical regime.
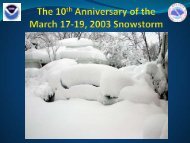
Numerical Model Considerations<br />
February 7, 2003<br />
Heavy snow b<strong>and</strong> across southern New Engl<strong>and</strong>.<br />
Model-forecasted warm advection, 700mb omega, <strong>and</strong> QPF<br />
fields indicated one thing (heaviest precipitation along/off<br />
coast), but fron<strong>to</strong>genesis <strong>and</strong> radar showed something<br />
different (well-defined, prolonged heavy snow b<strong>and</strong> inl<strong>and</strong>).<br />
In other words, the models may not tell you what you need<br />
<strong>to</strong> know, even for a “well-h<strong>and</strong>led” system:<br />
“What you see isn’t always what you get”
Feb 7, 2003: RUC-Forecasted QPF/Omega<br />
2100z<br />
The blue line is the<br />
1000-500 mb 5400m<br />
thickness line.<br />
1800z<br />
1500z<br />
The RUC showed strong, but broad upward<br />
motion (red lines) over southern New Engl<strong>and</strong> <strong>and</strong><br />
the adjacent ocean with the maximum ascent <strong>and</strong><br />
QPF (green) centered along <strong>and</strong> off the coast.
Feb 7, 2003: RUC-Forecasted Warm Advection<br />
Warm advection (red<br />
<strong>to</strong> yellow); cold<br />
advection (blue)<br />
The RUC forecasted a broad area of warm<br />
advection, with the maximum (orange/yellow) along<br />
<strong>and</strong> off the New Engl<strong>and</strong> coast. However, in comma<br />
head situations, the northern/western part of warm<br />
advection fields must be watched, as these can be<br />
locations of deformation zones.
Feb 7, 2003: Mosaic Radar 1317-2126 utc<br />
1317z 1521z 1716z<br />
1913z 2126z Radar data every 2 hours<br />
showed a large area of<br />
precip, similar <strong>to</strong> what the<br />
RUC suggested. However, a<br />
long-lasting definitive heavy<br />
snow b<strong>and</strong> developed<br />
inl<strong>and</strong> over CT <strong>and</strong> eastern<br />
MA on the northern edge of<br />
the RUC’s omega, WAA, <strong>and</strong><br />
QPF fields. What did<br />
fron<strong>to</strong>genesis show? See<br />
next slide.
Feb 7, 2003: Radar & 700 mb <strong>Fron<strong>to</strong>genesis</strong><br />
700 mb fron<strong>to</strong>genesis<br />
forecast from the RUC<br />
(red lines)<br />
RUC 700 mb fron<strong>to</strong>genesis showed a coherent,<br />
elongated axis inl<strong>and</strong> <strong>and</strong> coincident with the axis of<br />
heavy snowfall. The steeply-sloped fron<strong>to</strong>genetical<br />
zone likely was associated with a well-defined low<br />
<strong>and</strong> mid-level deformation zone; thus, snow was<br />
coincident with the fron<strong>to</strong>genetical axis.
Feb 7, 2003: Snowfall Accumulations<br />
A definitive<br />
b<strong>and</strong> of heavy<br />
snow with<br />
amounts of<br />
8-16 inches<br />
fell across<br />
CT <strong>and</strong><br />
eastern MA.<br />
Bos<strong>to</strong>n, MA Surface Observations:<br />
BOS 13 UTC 1 1/2SM –SN<br />
BOS 14 UTC 1/2 SM SN<br />
BOS 15 UTC 1/2 SM SN SNINCR 1/ 2<br />
BOS 16 UTC 1/2 SM SN SNINCR 1/ 3<br />
BOS 17 UTC 1/2 SM SN SNINCR 2/ 4<br />
BOS 18 UTC 1/4 SM +SN SNINCR 2/ 6<br />
BOS 19 UTC 1/4 SM +SN SNINCR 2/ 8<br />
BOS 20 UTC 1/4 SM +SN SNINCR 2/10<br />
BOS 21 UTC 1/4 SM SN SNINCR 1/10<br />
BOS 22 UTC 1/4 SM -SN<br />
BOS 23 UTC 2 SM –SN<br />
BOS 00 UTC 10 SM<br />
Conclusion: Model data usually possess inadequate resolution <strong>to</strong> correctly predict<br />
<strong>and</strong> refine vertical motion <strong>and</strong> QPF fields in winter s<strong>to</strong>rms. However, through<br />
assessment of fron<strong>to</strong>genesis, deformation, stability (EPV/CSI), <strong>and</strong> a<br />
other fields,<br />
forecaster situational awareness will increase leading <strong>to</strong> a better er forecast.
Suggested Snow B<strong>and</strong> Checklist<br />
Presence of 1”/hr snowfall rates:<br />
<br />
<br />
<br />
Near saturation in low-mid levels (1000-500 RH>85%)<br />
Favorable thermodynamic profile for snow: cloud <strong>to</strong>p<br />
temperatures < -10 C; no melting layers aloft<br />
Sloped region of low-mid-level 2-D fron<strong>to</strong>genesis/<br />
deformation axis in 850-500mb range<br />
Relative minimum in wind speed (< 20kt) within 850-<br />
700 mb region (col point aloft) <strong>and</strong>/or uniform deep-layer<br />
shear profile with absence of substantial hodograph<br />
curvature
Suggested Snow B<strong>and</strong> Checklist<br />
Higher snowfall rates (1-3”/hr):<br />
<br />
<br />
<br />
<br />
Same parameters as for 1”/hr snowfall rates AND:<br />
Saturation <strong>and</strong> strong ascent through the primary<br />
dendritic growth layer (-12 <strong>to</strong> -16 C), i.e., high precipitation<br />
efficiency<br />
Isothermal layer just colder than 0 C above surface:<br />
suggests higher atmospheric moisture content <strong>and</strong><br />
enhances aggregation<br />
Presence of ambient or just upstream negative EPV,<br />
steep mid-level lapse rates (along moist adiabats), <strong>and</strong><br />
elevated potential or slantwise instability: enhance<br />
convective snow potential <strong>and</strong> b<strong>and</strong> multiplicity/intensity
SUMMARY<br />
- <strong>Fron<strong>to</strong>genesis</strong> is very useful for assessing the potential for<br />
mesoscale b<strong>and</strong>ed precipitation zones.<br />
- Does not require a strong cyclone, only a baroclinic zone,<br />
often enhanced through horizontal convergence or<br />
deformation associated with a col point aloft<br />
- Col point aloft is a cue that fron<strong>to</strong>genesis may be occurring<br />
due <strong>to</strong> deformation<br />
- Precipitation b<strong>and</strong>ing is affected by wind structure <strong>and</strong><br />
stability; deep-layer vertical shear, a straight hodograph, <strong>and</strong><br />
small stability enhance b<strong>and</strong>ing<br />
- <strong>Fron<strong>to</strong>genesis</strong> in a stable atmosphere normally results in one<br />
main b<strong>and</strong>; given CSI or CI, multiple b<strong>and</strong>s with high<br />
precipitation rates can result<br />
- B<strong>and</strong>ing is not always represented by the models