Larger Contingency Table Example - Income and Job Satisfaction.pdf
Larger Contingency Table Example - Income and Job Satisfaction.pdf
Larger Contingency Table Example - Income and Job Satisfaction.pdf

Create successful ePaper yourself
Turn your PDF publications into a flip-book with our unique Google optimized e-Paper software.
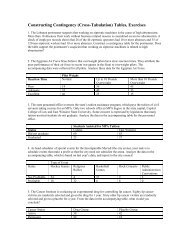
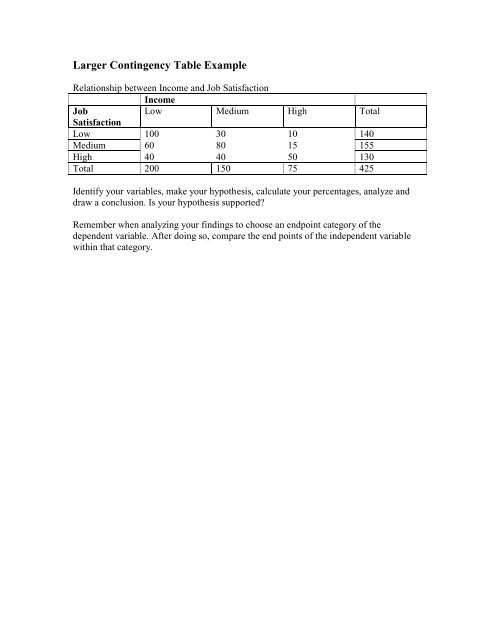
<strong>Larger</strong> <strong>Contingency</strong> <strong>Table</strong> <strong>Example</strong><br />
Relationship between <strong>Income</strong> <strong>and</strong> <strong>Job</strong> <strong>Satisfaction</strong><br />
<strong>Income</strong><br />
<strong>Job</strong><br />
Low Medium High Total<br />
<strong>Satisfaction</strong><br />
Low 100 30 10 140<br />
Medium 60 80 15 155<br />
High 40 40 50 130<br />
Total 200 150 75 425<br />
Identify your variables, make your hypothesis, calculate your percentages, analyze <strong>and</strong><br />
draw a conclusion. Is your hypothesis supported?<br />
Remember when analyzing your findings to choose an endpoint category of the<br />
dependent variable. After doing so, compare the end points of the independent variable<br />
within that category.
<strong>Income</strong><br />
<strong>Job</strong> <strong>Satisfaction</strong> Low Medium High<br />
Low 50.0% 20.0% 13.3%<br />
Medium 30.0% 53.3% 20.0%<br />
High 20.0% 26.7% 66.7%<br />
Total (n = 200) 100.0% (n = 150) 100.0% (n = 75) 100.0%<br />
Hypothesis 1: The higher the income, the higher the job satisfaction<br />
Conclusion: Those with high income indicated a “high” job satisfaction more often than<br />
those with low income (by 47%). Therefore, the hypothesis is supported.<br />
Hypothesis 2 (corollary): The lower the income, the lower the job satisfaction<br />
Conclusion: Those with low income indicated “low” job satisfaction more than those<br />
with high income (by 37%). Therefore, the hypothesis is supported.<br />
Which one should you use? Since they both confirm your hypothesis, but to a different<br />
degree, report BOTH.<br />
<strong>Income</strong> appears to make a difference of 37% to 47% in job satisfaction.<br />
What if the two disagree? Then you really can’t draw a conclusion. The problem is more<br />
complex than you thought <strong>and</strong> you’ll have to revisit what you thought the relationship<br />
was <strong>and</strong> how you have phrased the question.