Climate Change Assessments and Impacts
Climate Change Assessments and Impacts
Climate Change Assessments and Impacts

Create successful ePaper yourself
Turn your PDF publications into a flip-book with our unique Google optimized e-Paper software.
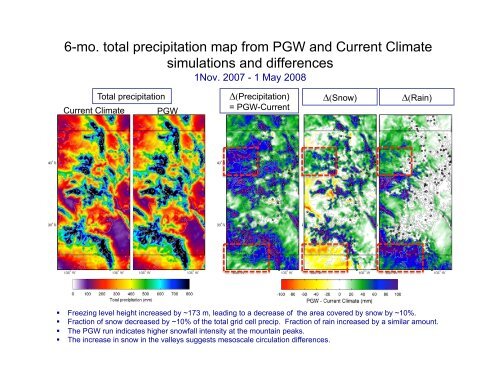
6-mo. total precipitation map from PGW <strong>and</strong> Current <strong>Climate</strong><br />
simulations <strong>and</strong> differences<br />
1Nov. 2007 - 1 May 2008<br />
Current <strong>Climate</strong><br />
Total precipitation<br />
PGW<br />
(Precipitation)<br />
= PGW-Current<br />
(Snow)<br />
(Rain)<br />
Freezing level height increased by ~173 m, leading to a decrease of the area covered by snow by ~10%.<br />
Fraction of snow decreased by ~10% of the total grid cell precip. Fraction of rain increased by a similar amount.<br />
The PGW run indicates higher snowfall intensity at the mountain peaks.<br />
The increase in snow in the valleys suggests mesoscale circulation differences.