Dynamic screening and electronâelectron scattering - Donostia ...
Dynamic screening and electronâelectron scattering - Donostia ...
Dynamic screening and electronâelectron scattering - Donostia ...

You also want an ePaper? Increase the reach of your titles
YUMPU automatically turns print PDFs into web optimized ePapers that Google loves.
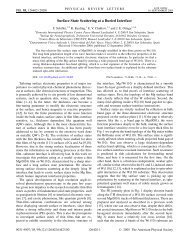
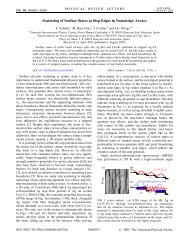
Surface Science 601 (2007) 4546–4552<br />
www.elsevier.com/locate/susc<br />
<strong>Dynamic</strong> <strong>screening</strong> <strong>and</strong> electron–electron <strong>scattering</strong><br />
in low-dimensional metallic systems<br />
V.M. Silkin a , M. Quijada a,b ,R.Díez Muiño a,c , E.V. Chulkov a,b,c , P.M. Echenique a,b,c, *<br />
a <strong>Donostia</strong> International Physics Center (DIPC), P. de Manuel Lardizabal 4, 20018 San Sebastián, Spain<br />
b Departamento de Física de Materiales, Facultad de Ciencias Químicas UPV/EHU, Apartado 1072, 20080 San Sebastián, Spain<br />
c Unidad de Física de Materiales, Centro Mixto CSIC-UPV/EHU, P. de Manuel Lardizabal 3, 20018 San Sebastián, Spain<br />
Available online 1 May 2007<br />
Abstract<br />
The modification of dynamic <strong>screening</strong> in the electron–electron interaction in systems with reduced dimensionality <strong>and</strong> tunable oneparticle<br />
electronic structure is studied. Two examples of such systems are considered, namely, the adsorbate-induced quantum well states<br />
at the Na adlayer covered Cu(111) surface, <strong>and</strong> metal clusters of sizes up to few nanometers. The dependence of the electron–electron<br />
decay rates on the Na coverage in the former case <strong>and</strong> on the cluster size in the latter is investigated. The role played by the dynamical<br />
screened interaction in such processes is addressed as well.<br />
Ó 2007 Elsevier B.V. All rights reserved.<br />
Keywords: Many-body <strong>and</strong> quasiparticle theories; Surface electronic phenomena; Noble metals; Adsorption; Quantum well states; Clusters<br />
1. Introduction<br />
* Corresponding author. Address: Departamento de Física de Materiales,<br />
Facultad de Ciencias Químicas UPV/EHU, Apartado 1072, 20080<br />
San Sebastián, Spain. Tel.: +34 943 015963; fax: +34 943 015600.<br />
E-mail address: wapetlap@sc.ehu.es (P.M. Echenique).<br />
Electronic excitations in metallic media can decay<br />
through various mechanisms, the most important of them<br />
being electron–electron (e–e) <strong>and</strong> electron–phonon (e–ph)<br />
<strong>scattering</strong>. Over the last years, a large amount of theoretical<br />
<strong>and</strong> experimental work has been devoted to underst<strong>and</strong><br />
<strong>and</strong> predict the lifetime of these excitations in solids [1–5]<br />
<strong>and</strong> at surfaces [6–10]. Focusing on the e–e <strong>scattering</strong> process,<br />
one of the key quantities that determine the rate at<br />
which the electronic excitations can decay is the dynamic<br />
<strong>screening</strong> among the medium electrons. However, the<br />
<strong>screening</strong> properties of metallic systems are profoundly affected<br />
by their dimensionality. Confinement <strong>and</strong> surface effects<br />
are, among others, two features that can drastically<br />
change the electronic <strong>screening</strong> <strong>and</strong> thus the lifetime of<br />
electronic excitations as compared with the bulk case.<br />
The modification at wish of the electronic properties of metal<br />
systems <strong>and</strong> the subsequent change in the lifetime of<br />
electronic excitations is not a question of purely academic<br />
interest, but has important implications for many technological<br />
applications.<br />
In present work, we analyze two cases in which the<br />
reduction of dimensionality leads to significant modifications<br />
in the electron–electron interaction. First, we study<br />
the case of quantum well states formed under the deposition<br />
of alkali atoms on metal surfaces [11,12]. Whereas<br />
the number of adsorbed alkali atoms is small, <strong>and</strong> they<br />
can be considered as independent, the picture of almost total<br />
transition of s valence electron from the alkali atom to<br />
the substrate is appropriate. However, when the coverage<br />
reaches rates of around 1 monolayer (ML) [13] an adsorbate-induced<br />
electron b<strong>and</strong> which forms a quasi twodimensional<br />
electron gas confined between the vacuum<br />
barrier <strong>and</strong> the metal substrate [14,15] (called a quantum<br />
well state (QWS)), unoccupied for low coverage, starts to<br />
fill [16]. A prominent example of this is the case of Na<br />
adsorption on Cu(111), for that the properties of this<br />
QWS have been intensively studied. Thus, the dynamics<br />
of holes created at wave vector k k = 0 has been studied<br />
for this system, both experimentally <strong>and</strong> theoretically<br />
0039-6028/$ - see front matter Ó 2007 Elsevier B.V. All rights reserved.<br />
doi:10.1016/j.susc.2007.04.232
V.M. Silkin et al. / Surface Science 601 (2007) 4546–4552 4547<br />
[17]. In this study it was proven that e–e <strong>and</strong> the e–ph<br />
mechanisms are equally important for the hole decay for<br />
1 ML coverage. Very recently a joint experimental <strong>and</strong> theoretical<br />
investigation of electron dynamics for Cs <strong>and</strong> Na<br />
adlayers on Cu(111) was performed as well [18]. Here,<br />
we investigate the energy dependence of the e–e contribution<br />
for several positions of the QWS b<strong>and</strong> relative to the<br />
Fermi level E F , which, in turn, depends on the Na coverage.<br />
For the sake of comparison with the experiment, a reasonable<br />
assumption could be that the e–ph contribution<br />
should not change significantly for such small variation<br />
of the QWS energy.<br />
As a second case study, we analyze dynamic <strong>screening</strong><br />
properties in metal clusters. In clusters <strong>and</strong> nanoparticles,<br />
chemical, optical, <strong>and</strong> electronic properties can be tuned<br />
by varying the size <strong>and</strong>/or the shape of the system. Besides<br />
its fundamental interest, tailoring the electronic properties<br />
can be of vast importance for many processes of technological<br />
interest, such as photochemical reactivity. Over the last<br />
years, the advent of femtosecond lasers has fueled the<br />
experimental study of electron relaxation processes. Particular<br />
attention has been paid to the dependence on size of<br />
the electron–electron interaction processes [19–21]. We will<br />
show that the interplay between <strong>screening</strong> effects <strong>and</strong> space<br />
localization of the initial excitation makes the lifetime of<br />
the excitation vary with respect to the bulk equivalent.<br />
2. Theoretical methods<br />
In very recent years, improvements in experimental<br />
methods, in particular in the field of ultrafast laser spectroscopies,<br />
are making it possible to study electronic excitations<br />
at time scales below the femtosecond [22,23]. In this<br />
time scale, the <strong>screening</strong> of excited electrons in condensed<br />
matter can be incomplete <strong>and</strong> the description of the electronic<br />
excitations as quasiparticles is questionable [24].<br />
However, most st<strong>and</strong>ard experimental techniques provide<br />
information on time scales for which the <strong>screening</strong> of excited<br />
electrons can be approximated as instantaneous in<br />
practice. In this case, the description of the many-body<br />
electronic excitation can be simplified by means of the quasiparticle<br />
picture. In the following, we focus into this<br />
situation.<br />
The <strong>scattering</strong> rate of an excited electron or hole due to<br />
inelastic e–e <strong>scattering</strong> can be evaluated by means of<br />
many-body calculations based on the electronic self-energy<br />
[25,26]. In this approach the lifetime broadening of a quasiparticle<br />
in a quantum state characterized by an energy E 0<br />
<strong>and</strong> wave function w 0 is obtained as the projection of the<br />
imaginary part of the self-energy R(r,r 0 ,E 0 ) onto the state<br />
itself (atomic units are used throughout, i.e., h = e 2 =<br />
m e = 1, unless otherwise is stated)<br />
Z Z<br />
C e–e ¼ s 1<br />
e–e ¼ 2 drdr 0 w 0 ðrÞImRðr; r0 ; E 0 Þw 0 ðr 0 Þ: ð1Þ<br />
Frequently the self-energy R is represented by the so-called<br />
GW approximation [25], which is the first term in a series<br />
expansion of R in terms of the screened Coulomb interaction<br />
W. Usually, the non-interacting Green function G 0 is<br />
used to replace the full one-electron Green function G. In<br />
the following we provide a brief description of the numerical<br />
methods used in the calculation of <strong>scattering</strong> rates in<br />
the two examples considered in this work, namely, quantum<br />
well states at metal surfaces <strong>and</strong> metal clusters. A more<br />
detailed account can be found elsewhere [26,27].<br />
2.1. Quantum well states<br />
In the case of Na adlayers on the Cu(111) surface, we<br />
assume that the charge density <strong>and</strong> the one-electron potential<br />
only vary along the z-direction perpendicular to the<br />
surface <strong>and</strong> are constant in the (x,y) plane parallel to the<br />
surface. This assumption is valid for Na induced QWS’s<br />
at coverage rates close to 1 ML, since the wave functions<br />
lie mainly in the Na layer <strong>and</strong> in the vacuum side, i.e., in<br />
a region with little potential variation in the direction parallel<br />
to the surface [28]. This leads to significant simplification<br />
of Eq. (1), which now takes a form<br />
C e–e ¼ s 1<br />
e–e ¼ 2 X 0<br />
f<br />
Z<br />
Z Z dqk<br />
ð2pÞ 2<br />
dzdz 0 / 0 ðzÞ/ f ðz0 Þ<br />
Im½ W ðz; z 0 ; q k ; E 0 E f ÞŠ/ 0 ðz 0 Þ/ f ðzÞ; ð2Þ<br />
where the summation is performed over all available final<br />
states f, W(z,z 0 ,q k ,x) is the two-dimensional Fourier transform<br />
of the screened Coulomb interaction, <strong>and</strong> / n (z) is the<br />
z-dependent component of the wave function w n (r):<br />
w n ðrÞ ¼p 1 ffiffiffi e iq kr k<br />
/ n ðzÞ<br />
ð3Þ<br />
S<br />
with S being a normalization area. To describe the Cu(111)<br />
surface covered by Na adlayers, we employ a slab containing<br />
31 atomic layers of Cu together with a region corresponding<br />
to Na <strong>and</strong> a vacuum region corresponding to 20<br />
Cu interlayer spacings. For the description of the surface<br />
electronic structure, the model potential of Ref. [17], based<br />
on the model potential of the bare Cu(111) surface [29], has<br />
been employed. This potential reproduces the QWS energy<br />
position of E QWS ¼ 0:127 eV at the surface Brillouin zone<br />
C<br />
center for 1 ML Na coverage [30]. To investigate the linewidth<br />
dependence on the QWS energy position relative to<br />
the Fermi level <strong>and</strong> demonstrate the dramatic change of<br />
the <strong>screening</strong> upon the QWS b<strong>and</strong> shrink below E F , we evaluate<br />
C e–e for the cases with QWS energies E QWS ¼ 0eV 1 <strong>and</strong><br />
E QWS<br />
C<br />
¼ 0:042 eV. We assume that the small variation of<br />
the QWS binding energy at the scale of 0.1 eV does not<br />
significantly affect the QWS wave function, <strong>and</strong> therefore<br />
use the same set of wave functions obtained for the<br />
E QWS<br />
C<br />
¼ 0:127 eV case, just shifting the QWS b<strong>and</strong> to the<br />
corresponding energy positions.We also assume here that<br />
1 As the QWS energy position at the C point is gradually moved down<br />
with increasing Na coverage [16] this energy position should roughly<br />
correspond to h 0.9.<br />
C
4548 V.M. Silkin et al. / Surface Science 601 (2007) 4546–4552<br />
the QWS wave functions do not change along the QWS<br />
energy b<strong>and</strong>, although this can have a significant effect on<br />
the excited electron linewidth in some cases [31,32]. For<br />
the QWS energy dispersion curve vs the two-dimensional<br />
wave vector k k , we use a parabolic form<br />
E QWS ðk k Þ¼E QWS þ k 2 C k =2mQWS , taking as effective mass the<br />
experimental value m QWS = 0.7 [30]. Further calculation<br />
details on the evaluation of the screened Coulomb interaction<br />
W(z,z 0 ,q k ,x) can be found in Refs. [33,34].<br />
2.2. Metal clusters<br />
The spherical jellium model [35,36] is used to represent<br />
metal clusters of variable size. The average one-electron<br />
radius r s in the cluster can be defined from r s = R/N 1/3 ,<br />
where R is the radius of the cluster <strong>and</strong> N the number of<br />
electrons in it. If the cluster is neutral, the equality<br />
1=n þ 0 ¼ 4pr3 s =3 holds as well, with nþ 0<br />
being the constant<br />
background positive charge of the cluster.<br />
We restrict our discussion to neutral clusters in closedshell<br />
configurations. The ground state properties of the<br />
cluster are described using density functional theory<br />
(DFT) <strong>and</strong> Kohn–Sham (KS) equations [37]. The exchange-correlation<br />
potential is calculated in the local density<br />
approximation (LDA) with the parametrization of<br />
Ref. [38]. The KS wave functions w(r) are calculated<br />
numerically after expansion in the spherical harmonic basis<br />
set Y lm (X r ). The set of KS equations are solved self-consistently<br />
using an iterative procedure.<br />
In real space, when the exact Green function G is replaced<br />
by the independent-electrons Green function G 0 in<br />
Eq. (1), one can show that<br />
C e–e ¼ 2 X Z<br />
0<br />
drdr 0 w 0 ðrÞw f ðr0 Þ<br />
f<br />
ImW ðr; r 0 ; xÞw 0 ðr 0 Þw f ðrÞ;<br />
where w 0 (r) is a KS wave function with eigenvalue E 0 ,<br />
x = E 0 E f , <strong>and</strong> the sum over f runs over all unoccupied<br />
KS states of eigenvalues E f < E 0 . Hence we are approximating<br />
the energy levels <strong>and</strong> wave functions in the decay<br />
by the eigenvalues <strong>and</strong> wave functions of unoccupied KS<br />
levels. This is a reasonable first-order approximation [39].<br />
In practice, the spherical symmetry of the problem simplifies<br />
the calculation [27]. All quantities in Eq. (4) are exp<strong>and</strong>ed<br />
in the spherical harmonics basis set. The screened<br />
interaction W(r,r 0 ,x) is calculated from the response function<br />
of the system v(r,r 0 ,x) obtained in the r<strong>and</strong>om phase<br />
approximation (RPA) [40,41]. The latter is built in a similar<br />
way to that of Ref. [42]: one-electron Green functions are<br />
built from the KS wave functions for every x. These Green<br />
functions are used to calculate the multipole components<br />
of the independent-electrons response function v 0 (r,r 0 ,x),<br />
<strong>and</strong> the RPA integral equation is solved in real space after<br />
matrix inversion for every polar component. Finally, the<br />
decay rate C e–e is calculated as a sum over the independent<br />
contributions of each of the available final states [27].<br />
ð4Þ<br />
3. Calculation results <strong>and</strong> discussion<br />
3.1. Quantum well states<br />
In Fig. 1, the calculated dependence of the linewidth C e–e<br />
on the excited energy is presented for three Na QWS energy<br />
positions. A large variation of the linewidth as a function of<br />
coverage is observed. A particularly strong enhancement of<br />
C e–e for small excitation energies <strong>and</strong> for the two systems<br />
with partially occupied QWS b<strong>and</strong> is observed, with respect<br />
to the case of unoccupied QWS. Additionally, one can note<br />
the different behavior between the two occupied QWS cases.<br />
For small energies, C e–e for E QWS ¼ 0:042 eV is larger than<br />
C<br />
C e–e for E QWS ¼ 0:127 eV. Indeed, the two curves cross<br />
C<br />
around E = 0.25 eV, <strong>and</strong> the linewidth for E QWS ¼ 0:127<br />
C<br />
starts to be the largest for higher energies. This finding is<br />
rather difficult to underst<strong>and</strong> in simple terms such as phase<br />
space available for the quasiparticle decay, since this phase<br />
space is the same for all three systems as is seen in Fig. 2.<br />
Note that these intrab<strong>and</strong> transitions within the QWS b<strong>and</strong><br />
itself are the main source for excited electron decay in all<br />
systems under study. Thus, for small energies this contribution<br />
accounts for almost 100% of the total decay rate. With<br />
the increase of the excitation energy the contribution from<br />
interb<strong>and</strong> transitions to the empty bulk electronic states increases<br />
faster than that from intrab<strong>and</strong> transitions. Nevertheless,<br />
even for energies around 2 eV the intrab<strong>and</strong><br />
contribution accounts for more than 90% of the total<br />
C e–e . Hence, the two-dimensional effects in Na/Cu(111) systems<br />
are much stronger than in the case of surface states at<br />
clean metal surfaces [8,43]. This fact can be explained by the<br />
larger decoupling of the QWS state wave functions from the<br />
bulk electron system [17].<br />
To underst<strong>and</strong> the behavior of C e–e as a function of the<br />
QWS energy position let us see Eq. (2), where the double<br />
integration in z <strong>and</strong> z 0 is performed. As mentioned above,<br />
Linewidth (meV)<br />
400<br />
300<br />
200<br />
100<br />
0<br />
0 0.5 1 1.5 2<br />
Energy (eV)<br />
Fig. 1. Calculated e–e contribution, C e–e , to the linewidth of a quantum<br />
well state in Na/Cu(111) for QWS energy position E QWS ¼ 0:127 eV<br />
C<br />
(solid line), E QWS ¼ 0:042 eV (dashed line), <strong>and</strong> E QWS ¼ 0 (dotted line).<br />
C<br />
C
V.M. Silkin et al. / Surface Science 601 (2007) 4546–4552 4549<br />
Fig. 2. Quantum well states energy dispersion for E QWS ¼ 0:127 eV<br />
C<br />
(solid line), E QWS ¼ 0:042 eV (dashed line), <strong>and</strong> E QWS ¼ 0 (dotted line).<br />
C<br />
C<br />
Grey area shows the regions of projected bulk electronic structure of bare<br />
Cu(111) surface being most efficient decay channel in Na/Cu(111)<br />
systems as well [18]. The two main decay channels, namely intrab<strong>and</strong> <strong>and</strong><br />
interb<strong>and</strong> transitions, are shown schematically by arrows.<br />
the QWS wave functions / 0 (z) <strong>and</strong> the bulk electronic structure<br />
for all the three different QWS energy positions have<br />
been hold the same in the present calculation. In addition<br />
to the above-mentioned similarity of the available phase<br />
space for decay, the remaining difference between these calculations<br />
is the screened Coulomb interaction W(z,z 0 ,q k ,x)<br />
originated from different QWS energy positions. We perform<br />
calculation of W(z,z 0 ,q k ,x) for all the three systems<br />
<strong>and</strong> analyze them below. First of all, we note a strong<br />
variation of ImW as a function of all its variables z, q k ,<br />
<strong>and</strong> x. To give a general idea of it in Fig. 3, we present<br />
ImW(z,z,q k ,x) as a function of z <strong>and</strong> x for the E QWS ¼<br />
C<br />
0:127 eV <strong>and</strong> E QWS ¼ 0:042 eV cases for two-dimensional<br />
momentum value q k = 0.05 a.u.<br />
1 . The use of<br />
C<br />
ImW(z,z,q k ,x) as an example is reasonable as inside the<br />
solid <strong>and</strong> near the surface ImW(z,z 0 ,q k ,x) has the maximum<br />
magnitude at z = z 0 <strong>and</strong> only far from the surface into<br />
the vacuum the maximum of this quantity occurs at z 5 z 0<br />
[44]. InFig. 3 one can observe a strong enhancement of<br />
ImW(z,z,q k ,x) for z P 0 <strong>and</strong> energies x 6 0.25 eV <strong>and</strong><br />
x 6 0.18 eV, respectively. Comparing both figures one<br />
can see that the amplitude of ImW in low left corner for<br />
the E QWS ¼ 0:042 eV case is much larger than for the<br />
C<br />
E QWS ¼ 0:127 eV case. Therefore, although the phase<br />
C<br />
space in the former case is smaller as one can appreciate<br />
in Fig. 5, this ImW enhancement leads to a larger linewidth<br />
for the E QWS ¼ 0:042 eV case for small energies. When the<br />
C<br />
energy increases, the relative role of this enhanced region<br />
of ImW decreases leading to a smaller linewidth for<br />
the E QWS ¼ 0:042 eV case, as compared to the E QWS ¼<br />
C<br />
C<br />
0:127 eV one. In Fig. 4, ImW(z,z,q k ,x) for E QWS ¼<br />
C<br />
0:127 eV <strong>and</strong> E QWS ¼ 0 are presented for two values of<br />
C<br />
q k , demonstrating that, at the surface, the amplitude of<br />
Fig. 3. Imaginary part of the screened interaction, ImW(z,z,q k ,x), for the<br />
E QWS ¼ 0:127 eV (upper panel) <strong>and</strong> E QWS ¼ 0:042 eV (lower panel)<br />
C<br />
C<br />
cases as a function of distance z <strong>and</strong> energy x for the two-dimensional<br />
momentum q k = 0.05 a.u.<br />
1 . Na adlayer is located at z = 0 <strong>and</strong> negative<br />
(positive) z values correspond to the solid (vacuum) side.<br />
ImW is two orders of magnitude larger than in the former<br />
case, whereas the latter is very similar to the clean Cu(111)<br />
case [44].<br />
Furthermore, in Fig. 3, one can see additional peaks at<br />
the maximum energy for QWS intrab<strong>and</strong> e–h excitations<br />
which correspond to the collective electronic excitations<br />
similar to the acoustic surface plasmon (ASP) at the clean<br />
metal surfaces [33,34]. Their dispersions closely follow the<br />
upper edge of regions for e–h excitations within the QWS<br />
b<strong>and</strong>s <strong>and</strong> are shown in Fig. 5. The origin of this collective<br />
mode is the coexistence at the surface of both the QWS <strong>and</strong><br />
bulk electrons. More detailed analysis of its properties will<br />
be given elsewhere. From Fig. 5, it is clear that the ASP<br />
contributes to the total linewidth C e–e . Nevertheless, it is<br />
difficult to separate this contribution from the very efficient<br />
decay channel due to intrab<strong>and</strong> QWS e–h excitations.<br />
3.2. Metal clusters<br />
One of the most appealing features of low-dimensional<br />
systems such as clusters is that their properties can often
4550 V.M. Silkin et al. / Surface Science 601 (2007) 4546–4552<br />
Fig. 5. Phase space for intrab<strong>and</strong> electron–hole excitations in the QWS<br />
b<strong>and</strong>. Grey colored area shows the region for the E QWS ¼ 0:127 eV case<br />
C<br />
<strong>and</strong> hatched area st<strong>and</strong>s for E QWS ¼ 0:042 eV. Intrab<strong>and</strong> bulk <strong>and</strong><br />
C<br />
interb<strong>and</strong> QWS-bulk electron–hole excitations are allowed everywhere.<br />
Thick solid <strong>and</strong> dashed lines on the left sides of each area show the<br />
dispersion of corresponding acoustic surface plasmons. As an example,<br />
thin dashed (dotted) line delimits the phase space region available for<br />
intrab<strong>and</strong> transitions for an excited electron of energy of 0.3 eV above E F<br />
for the E QWS ¼ 0:127 eV ðE QWS ¼ 0:042 eVÞ case.<br />
C<br />
C<br />
Fig. 4. Imaginary part of the screened interaction, ImW(z,z,q k ,x), as a<br />
function of z for q k = 0.05 a.u.<br />
1 (upper panel) <strong>and</strong> q k = 0.10 a.u.<br />
1 (lower<br />
panel). Thick (thin) lines st<strong>and</strong> for the E QWS ¼ 0:127ðE QWS ¼ 0Þ case.<br />
C<br />
C<br />
Solid, long dashed, dashed, dashed-dotted, <strong>and</strong> dotted lines show ImW<br />
for x = 0.06 eV, 0.12 eV, 0.18 eV, 0.24 eV, <strong>and</strong> 0.30 eV, respectively.<br />
be tuned by varying the size <strong>and</strong> thus they can be different<br />
from the bulk case. For this reason <strong>and</strong> in the following, we<br />
focus into clusters of variable size <strong>and</strong> fixed average electronic<br />
density (r s = 4, that represents for instance sodium<br />
clusters). In this respect, the difference between the dynamics<br />
of hot electrons in clusters <strong>and</strong> in bulk has been discussed<br />
bringing up two different effects. First, the electron<br />
lifetime can be enhanced in the cluster because of the discretization<br />
of levels that reduces the number of final states<br />
to which the electronic excitation can decay. Then again,<br />
the electron lifetime can decrease in the cluster because<br />
of the reduction of dynamic <strong>screening</strong> in the proximity of<br />
the cluster surface. We show in the following that the<br />
<strong>screening</strong> in clusters is not only modified due to the presence<br />
of the surface but also due to the different mobility<br />
of the cluster electrons with respect to those in bulk. The<br />
dynamically screened interaction between the cluster electrons<br />
is affected by this factor, in particular for low excitation<br />
energies.<br />
In Fig. 6, we show the linewidth C e–e of electron excitations<br />
with energy E 0 1 eV measured from the Fermi level<br />
of the cluster. Due to the discretization of levels in the cluster,<br />
the initial energy of the excitation cannot be fixed exactly<br />
to 1 eV, but the eigenvalue closest in energy is<br />
chosen. In any case, the variation with respect to the reference<br />
value is never larger than 10%. We come back to this<br />
Fig. 6. Linewidth (in meV) of electron excitations with energy E 0 1eV<br />
above the Fermi level of the cluster, as a function of the cluster radius (in<br />
a.u.). All systems have r s = 4. The value of C e–e obtained from an RPA<br />
calculation in an homogeneous electron gas with the same parameter r s is<br />
also shown.
V.M. Silkin et al. / Surface Science 601 (2007) 4546–4552 4551<br />
point below. C e–e is plotted as a function of the cluster radius<br />
R. For small cluster sizes, the discretization of levels is<br />
clearly observable in the large oscillations found. For clusters<br />
of nanometer size, however, these oscillations are<br />
damped <strong>and</strong> the value of the linewidth is C e–e 150 meV.<br />
Let us also mention that an RPA calculation of the electron<br />
lifetime in a homogeneous electron gas, with the same<br />
parameters that we fix in our calculation (E 0 = 1 eV <strong>and</strong><br />
r s = 4) gives a value C e–e = 60 meV [45], smaller than the<br />
ones obtained for these big clusters.<br />
One of the reasons not often discussed in the literature<br />
for the difference between the value of C e–e in bulk <strong>and</strong> in<br />
nanometer-sized clusters is the difference in the electron–<br />
electron screened interaction W(r,r 0 ,x) between an infinite<br />
electron gas <strong>and</strong> a finite jellium system, even for values of r<br />
<strong>and</strong> r 0 far from the cluster surface. In Fig. 7, we quantify<br />
this statement by showing the imaginary part of<br />
ImW(r,r 0 ,x) for a value of r nearby the cluster center<br />
(r = 0.31) <strong>and</strong> as a function of r 0 . The dimension of the<br />
chosen is sufficiently big (R = 38.8 a.u.) to consider that<br />
no surface effects are relevant. ImW is plotted for two different<br />
values of the energy, namely x = 0.815 meV <strong>and</strong><br />
x = 54.4 eV. The former is representative of actual values<br />
of x that enter the calculation of C e–e in clusters. Fig. 7<br />
shows that ImW(0, r 0 ,x = 0.815 eV) is clearly different in<br />
a cluster as compared to the bulk counterpart. The dynamic<br />
<strong>screening</strong> between electrons is thus modified due to<br />
the different mobility of electrons in a confined system.<br />
However, for higher values of x, the response of the system<br />
is similar to that calculated in the independentelectron<br />
approximation v 0 <strong>and</strong> finite-size effects are not<br />
relevant.<br />
Confinement effects are also relevant in the choice of the<br />
initial state in the decay process. The discretization of levels<br />
in the cluster makes it impossible to exactly define the same<br />
initial energy E 0 for all the cluster sizes considered. An estimate<br />
of the variation that this feature can introduce in the<br />
linewidth value is also shown in Fig. 6. For a cluster size of<br />
R = 31 a.u., the value of C e–e for two initial states very<br />
close in energy is plotted. One of them is the first l =13<br />
state with E 0 = 1 eV, <strong>and</strong> the second one is a l = 4 state<br />
with E 0 = 0.99 eV. In spite of the proximity of the two energy<br />
levels, the value of C e–e varies as much as 35%. The<br />
main reason for that is the different coupling between the<br />
initial state wave function <strong>and</strong> the available final states<br />
for the decay. In Fig. 8, we show the normalized radial distribution<br />
of the KS wave functions rR l;E0 ðrÞ, where<br />
w 0 ðrÞ ¼R l;E0 ðrÞY lm ðX r Þ, for the two cases considered. The<br />
integrated radial distributions<br />
QðrÞ ¼<br />
Z r<br />
0<br />
<br />
dr 0 r 02 R l;E0 ðr 0 2<br />
Þ<br />
ð5Þ<br />
are plotted in Fig. 8 as well. While the l = 13 wave function<br />
does not have any nodes, oscillations in the l = 4 wave<br />
function are conspicuous. A proper definition of the initial<br />
excitation in the decay process can thus be crucial when<br />
calculating the linewidth.<br />
Fig. 7. Imaginary part of the self-energy ImW(r 0 ,r 0 ,x) (in eV) for a<br />
cluster of N = 912 <strong>and</strong> r s =4(R = 38.8 a.u.), as a function of the radial<br />
coordinate r 0 (in a.u.), for two different values of the energy x = 0.815 eV<br />
<strong>and</strong> 54.4 eV. The coordinate r 0 is fixed to 0.31 a.u. The corresponding<br />
values for ImW in an homogeneous electron gas obtained from Mermin<br />
response functions are also plotted for comparison.<br />
Fig. 8. Normalized radial distribution of wave functions with l =4, 13<br />
<strong>and</strong> E 0 = 0.99, 1 eV, respectively, corresponding to a cluster with N = 440<br />
<strong>and</strong> r s =4 (R = 30.42 a.u.). E 0 is measured from the Fermi level of the<br />
cluster. The integrated value of the wave functions is plotted in the upper<br />
panel.
4552 V.M. Silkin et al. / Surface Science 601 (2007) 4546–4552<br />
4. Summary <strong>and</strong> conclusions<br />
Low-dimensional systems bear electronic properties that<br />
can be very different from those well studied in bulk systems.<br />
Here, we have shown that the modification of the dynamic<br />
<strong>screening</strong> in the electron–electron interaction <strong>and</strong><br />
the change in the structure of energy levels in these systems<br />
can combine to drastically modify the linewidth of electronic<br />
excitations as compared to the bulk reference. In<br />
particular, we have analyzed the screened interaction between<br />
electrons <strong>and</strong> the phase space availability for the decay<br />
in two different cases: quantum well states in overlayers<br />
of Na over Cu(111) <strong>and</strong> gas-phase metal clusters of sizes<br />
up to few nanometers. In the former case, the amount of<br />
alkali atoms coverage on the metal surface leads to a shift<br />
of the QWS energy b<strong>and</strong>, that produces an appreciable<br />
change in the linewidth. In the latter case, the variation<br />
in size of the cluster is responsible for modifications in<br />
the decay rate. Our detailed analysis of these properties<br />
shows that a proper choice of the system characteristics<br />
should allow to tune the excitation linewidths due to electron–electron<br />
<strong>scattering</strong> processes.<br />
Acknowledgements<br />
Financial support by the Basque Departamento de Educación,<br />
Universidades e Investigación, the University of<br />
the Basque Country UPV/EHU (Grant No. 9/UPV<br />
00206.215-13639/2001), the Spanish MEC (Grant No.<br />
FIS2004-06490-C03-00), <strong>and</strong> the EU Network of Excellence<br />
NANOQUANTA (Grant No. NMP4-CT-2004-<br />
500198) is acknowledged.<br />
References<br />
[1] M. Aeschlimann, M. Bauer, S. Pawlik, W. Weber, S. Burgermeister,<br />
D. Oberli, H.C. Siegmann, Phys. Rev. Lett. 79 (1997) 5158.<br />
[2] H. Petek, S. Ogawa, Prog. Surf. Sci. 56 (1997) 239.<br />
[3] E. Knoesel, A. Hotzel, M. Wolf, Phys. Rev. B 57 (1998) 12812.<br />
[4] R. Knorren, K.H. Bennemann, R. Burgermeister, M. Aeschlimann,<br />
Phys. Rev. B 61 (2000) 9427.<br />
[5] E.V. Chulkov, A.G. Borisov, J.P. Gauyacq, D. Sánchez-Portal, V.M.<br />
Silkin, V.P. Zhukov, P.M. Echenique, Chem. Rev. 106 (2006) 4160.<br />
[6] U. Höfer, I.L. Shumay, Ch. Reuß, U. Thomann, W. Wallauer, T.<br />
Fauster, Science 277 (1997) 1480.<br />
[7] M. Weinelt, J. Phys.: Condens. Matter 14 (2002) R1099.<br />
[8] P.M. Echenique, R. Berndt, E.V. Chulkov, Th. Fauster, A. Goldmann,<br />
U. Höfer, Surf. Sci. Rep. 52 (2004) 219.<br />
[9] J. Kröger, L. Limot, H. Jensen, R. Berndt, S. Crampin, E. Pehlke,<br />
Prog. Surf. Sci. 80 (2005) 26.<br />
[10] J. Güdde, U. Höfer, Prog. Surf. Sci. 80 (2005) 49.<br />
[11] A.M. Bradshow, H.P. Bonzel, G. Ertl, Physics <strong>and</strong> Chemistry of<br />
Alkali Metal Adsorption, Elsevier, Amsterdam, 1989.<br />
[12] R.D. Diehl, R. McGrath, Surf. Sci. Rep. 23 (1996) 43.<br />
[13] We define one Na monolayer as the most densely packed structure of<br />
the first Na layer, namely a (3/2 · 3/2) unit mesh with 4 Na atoms per<br />
9 Cu surface atoms: D. Tang, D. McIlroy, X. Shi, C. Su, D. Heskett,<br />
Surf. Sci. 255 (1991) L497;<br />
J. Kliewer, R. Berndt, Surf. Sci. 477 (2001) 250.<br />
[14] S.-Å. Lindgren, L. Walldén, Solid State Commun. 34 (1980)<br />
671.<br />
[15] S.-Å. Lindgren, L. Walldén, Phys. Rev. Lett. 59 (1987) 3003.<br />
[16] N. Fischer, S. Schuppler, Th. Fauster, W. Steinmann, Surf. Sci. 314<br />
(1994) 89.<br />
[17] E.V. Chulkov, J. Kliewer, R. Berndt, V.M. Silkin, B. Hellsing, S.<br />
Crampin, P.M. Echenique, Phys. Rev. B 68 (2003) 195422.<br />
[18] C. Corriol, V.M. Silkin, D. Sánches-Portal, A. Arnau, E.V. Chulkov,<br />
P.M. Echenique, T. von Hofe, J. Kliewer, J. Kröger, R. Berndt, Phys.<br />
Rev. Lett. 95 (2005) 176802.<br />
[19] C. Voisin, D. Christofilos, N. Del Fatti, F. Vallée, B. Prével, E.<br />
Cottancin, J. Lermé, M. Pellarin, M. Broyer, Phys. Rev. Lett. 85<br />
(2000) 2200.<br />
[20] N. Pontius, G. Lüttgens, P.S. Bechthold, M. Neeb, W. Eberhardt, J.<br />
Chem. Phys. 115 (2001) 10479.<br />
[21] P. Gerhardt, M. Niemietz, Y. Dok Kim, G. Ganteför, Chem. Phys.<br />
Lett. 382 (2003) 454.<br />
[22] M. Drescher, M. Hentschel, R. Kienberger, M. Uiberacker, V.<br />
Yakovlev, A. Scrinzi, Th. Westerwalbesloh, U. Kleineberg, U.<br />
Heinzmann, F. Krausz, Nature 419 (2002) 803.<br />
[23] A. Baltus˘ka, Th. Udem, M. Uiberacker, M. Hentschel, E. Goulielmakis,<br />
Ch. Gohle, R. Holzwarth, V.S. Yakovlev, A. Scrinzi, T.W.<br />
Hänsch, F. Krausz, Nature 421 (2003) 611.<br />
[24] A. Borisov, D. Sánchez-Portal, R. Díez Muiño, P.M. Echenique,<br />
Chem. Phys. Lett. 387 (2004) 95.<br />
[25] L. Hedin, S. Lundqvist, Solid State Phys. 23 (1969) 1.<br />
[26] P.M. Echenique, J.M. Pitarke, E.V. Chulkov, A. Rubio, Chem. Phys.<br />
251 (2000) 1.<br />
[27] M. Quijada, R. Díez Muiño, P.M. Echenique, Nanotechnology 16<br />
(2005) S176.<br />
[28] J.M. Carlsson, B. Hellsing, Phys. Rev. B 61 (2000) 13973.<br />
[29] E.V. Chulkov, V.M. Silkin, P.M. Echenique, Surf. Sci. 437 (1999)<br />
330.<br />
[30] J. Kliewer, R. Berndt, Phys. Rev. B 65 (2001) 035412.<br />
[31] L. Vitali, P. Wahl, M.A. Schneider, K. Kern, V.M. Silkin, E.V.<br />
Chulkov, P.M. Echenique, Surf. Sci. 523 (2003) L47.<br />
[32] M.G. Vergniory, J.M. Pitarke, S. Crampin, Phys. Rev. B 72 (2005)<br />
193401.<br />
[33] V.M. Silkin, A. García-Lekue, J.M. Pitarke, E.V. Chulkov, E.<br />
Zaremba, P.M. Echenique, Europhys. Lett. 66 (2004) 260.<br />
[34] V.M. Silkin, J.M. Pitarke, E.V. Chulkov, P.M. Echenique, Phys. Rev.<br />
B 72 (2005) 115435.<br />
[35] M. Brack, Rev. Mod. Phys. 65 (1993) 677.<br />
[36] J.A. Alonso, L.C. Balbás, Topics in Current Chemistry, vol. 182,<br />
Springer-Verlag, Berlin/Heidelberg, 1996, p. 119.<br />
[37] W. Kohn, L.J. Sham, Phys. Rev. 140 (1965) A1133.<br />
[38] O. Gunnarsson, B.I. Lundqvist, Phys. Rev. B 13 (1976)<br />
4274.<br />
[39] P. Fulde, Electron Correlations in Molecules <strong>and</strong> Solids, Springer-<br />
Verlag, Berlin, 1995 (Section 9.2.3).<br />
[40] W. Ekardt, Phys. Rev. B 31 (1985) 6360.<br />
[41] M.J. Puska, R.M. Nieminen, M. Manninen, Phys. Rev. B 31 (1985)<br />
3486.<br />
[42] R. Díez Muiño, A. Arnau, A. Salin, P.M. Echenique, Phys. Rev. B 68<br />
(2003) 041102(R).<br />
[43] J. Kliewer, R. Berndt, E.V. Chulkov, V.M. Silkin, P.M. Echenique, S.<br />
Crampin, Science 288 (2000) 1399.<br />
[44] P.M. Echenique, J. Osma, V.M. Silkin, E.V. Chulkov, J.M. Pitarke,<br />
Appl. Phys. A 71 (2000) 503.<br />
[45] J.M. Pitarke, Private Communication, 2004.