Time-dependent screening in a two-dimensional electron gas
Time-dependent screening in a two-dimensional electron gas
Time-dependent screening in a two-dimensional electron gas

You also want an ePaper? Increase the reach of your titles
YUMPU automatically turns print PDFs into web optimized ePapers that Google loves.
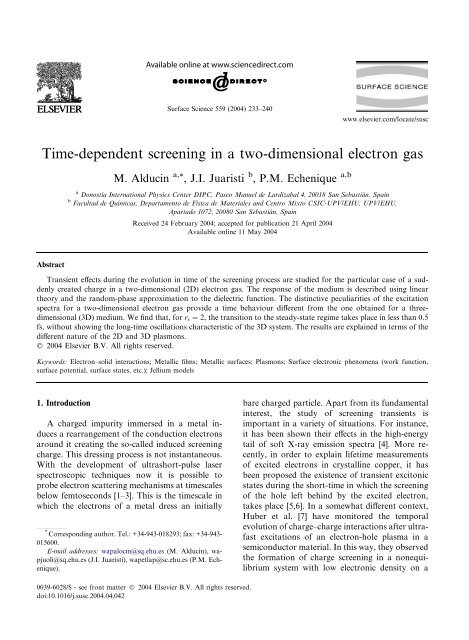
Surface Science 559 (2004) 233–240<br />
www.elsevier.com/locate/susc<br />
<strong>Time</strong>-<strong>dependent</strong> <strong>screen<strong>in</strong>g</strong> <strong>in</strong> a <strong>two</strong>-<strong>dimensional</strong> <strong>electron</strong> <strong>gas</strong><br />
M. Alduc<strong>in</strong> a, *<br />
, J.I. Juaristi b , P.M. Echenique a,b<br />
a Donostia International Physics Center DIPC, Paseo Manuel de Lardizabal 4, 20018 San Sebastian, Spa<strong>in</strong><br />
b Facultad de Quımicas, Departamento de Fısica de Materiales and Centro Mixto CSIC-UPV/EHU, UPV/EHU,<br />
Apartado 1072, 20080 San Sebastian, Spa<strong>in</strong><br />
Received 24 February 2004; accepted for publication 21 April 2004<br />
Available onl<strong>in</strong>e 11 May 2004<br />
Abstract<br />
Transient effects dur<strong>in</strong>g the evolution <strong>in</strong> time of the <strong>screen<strong>in</strong>g</strong> process are studied for the particular case of a suddenly<br />
created charge <strong>in</strong> a <strong>two</strong>-<strong>dimensional</strong> (2D) <strong>electron</strong> <strong>gas</strong>. The response of the medium is described us<strong>in</strong>g l<strong>in</strong>ear<br />
theory and the random-phase approximation to the dielectric function. The dist<strong>in</strong>ctive peculiarities of the excitation<br />
spectra for a <strong>two</strong>-<strong>dimensional</strong> <strong>electron</strong> <strong>gas</strong> provide a time behaviour different from the one obta<strong>in</strong>ed for a three<strong>dimensional</strong><br />
(3D) medium. We f<strong>in</strong>d that, for r s ¼ 2, the transition to the steady-state regime takes place <strong>in</strong> less than 0.5<br />
fs, without show<strong>in</strong>g the long-time oscillations characteristic of the 3D system. The results are expla<strong>in</strong>ed <strong>in</strong> terms of the<br />
different nature of the 2D and 3D plasmons.<br />
Ó 2004 Elsevier B.V. All rights reserved.<br />
Keywords: Electron–solid <strong>in</strong>teractions; Metallic films; Metallic surfaces; Plasmons; Surface <strong>electron</strong>ic phenomena (work function,<br />
surface potential, surface states, etc.); Jellium models<br />
1. Introduction<br />
A charged impurity immersed <strong>in</strong> a metal <strong>in</strong>duces<br />
a rearrangement of the conduction <strong>electron</strong>s<br />
around it creat<strong>in</strong>g the so-called <strong>in</strong>duced <strong>screen<strong>in</strong>g</strong><br />
charge. This dress<strong>in</strong>g process is not <strong>in</strong>stantaneous.<br />
With the development of ultrashort-pulse laser<br />
spectroscopic techniques now it is possible to<br />
probe <strong>electron</strong> scatter<strong>in</strong>g mechanisms at timescales<br />
below femtoseconds [1–3]. This is the timescale <strong>in</strong><br />
which the <strong>electron</strong>s of a metal dress an <strong>in</strong>itially<br />
* Correspond<strong>in</strong>g author. Tel.: +34-943-018293; fax: +34-943-<br />
015600.<br />
E-mail addresses: wapalocm@sq.ehu.es (M. Alduc<strong>in</strong>), wapjuoli@sq.ehu.es<br />
(J.I. Juaristi), wapetlap@sc.ehu.es (P.M. Echenique).<br />
bare charged particle. Apart from its fundamental<br />
<strong>in</strong>terest, the study of <strong>screen<strong>in</strong>g</strong> transients is<br />
important <strong>in</strong> a variety of situations. For <strong>in</strong>stance,<br />
it has been shown their effects <strong>in</strong> the high-energy<br />
tail of soft X-ray emission spectra [4]. More recently,<br />
<strong>in</strong> order to expla<strong>in</strong> lifetime measurements<br />
of excited <strong>electron</strong>s <strong>in</strong> crystall<strong>in</strong>e copper, it has<br />
been proposed the existence of transient excitonic<br />
states dur<strong>in</strong>g the short-time <strong>in</strong> which the <strong>screen<strong>in</strong>g</strong><br />
of the hole left beh<strong>in</strong>d by the excited <strong>electron</strong>,<br />
takes place [5,6]. In a somewhat different context,<br />
Huber et al. [7] have monitored the temporal<br />
evolution of charge–charge <strong>in</strong>teractions after ultrafast<br />
excitations of an <strong>electron</strong>-hole plasma <strong>in</strong> a<br />
semiconductor material. In this way, they observed<br />
the formation of charge <strong>screen<strong>in</strong>g</strong> <strong>in</strong> a nonequilibrium<br />
system with low <strong>electron</strong>ic density on a<br />
0039-6028/$ - see front matter Ó 2004 Elsevier B.V. All rights reserved.<br />
doi:10.1016/j.susc.2004.04.042
234 M. Alduc<strong>in</strong> et al. / Surface Science 559 (2004) 233–240<br />
femtosecond timescale. Their f<strong>in</strong>d<strong>in</strong>gs were consistent<br />
with calculations based on quantum k<strong>in</strong>etic<br />
theories for nonequilibrium dynamics of Coulomb<br />
<strong>in</strong>teractions [8] that predict a delayed build-up of<br />
the <strong>screen<strong>in</strong>g</strong>.<br />
In this article, we study for the first time, the<br />
build<strong>in</strong>g up of the <strong>electron</strong>ic <strong>screen<strong>in</strong>g</strong> <strong>in</strong> a <strong>two</strong><strong>dimensional</strong><br />
(2D) jellium below the femtosecond<br />
scale. Canright [9] calculated the transient<br />
<strong>screen<strong>in</strong>g</strong> response to a suddenly created po<strong>in</strong>t<br />
charge <strong>in</strong> a three-<strong>dimensional</strong> (3D) jellium. The<br />
method, based on a l<strong>in</strong>ear <strong>screen<strong>in</strong>g</strong> approximation,<br />
allowed a decomposition of the response of<br />
the system <strong>in</strong>to a part due to plasmons and a<br />
part due to <strong>electron</strong>-hole pair excitation. Here,<br />
we follow a similar approach to study transient<br />
<strong>screen<strong>in</strong>g</strong> effects <strong>in</strong> a 2D <strong>electron</strong> <strong>gas</strong>. The study<br />
of 2D systems is relevant <strong>in</strong> connection to the<br />
properties of th<strong>in</strong> films and surfaces. More precisely,<br />
quasi-2D systems are realized <strong>in</strong> the cases<br />
of <strong>electron</strong>s on the surface of liquid helium,<br />
<strong>electron</strong>s at the <strong>in</strong>terfaces of semiconductor heterojunctions,<br />
image states at metal surfaces and<br />
layered materials. Concern<strong>in</strong>g our study of <strong>screen<strong>in</strong>g</strong><br />
transients <strong>in</strong> a 2D <strong>electron</strong> <strong>gas</strong>, an <strong>in</strong>terest<strong>in</strong>g<br />
feature is the different nature of the plasmon<br />
mode as compared to that of the 3D case. In the<br />
latter, the plasmon frequency tends to a constant<br />
value x 0 with x 2 0<br />
¼ 4pn (n is the <strong>electron</strong>ic density<br />
of the 3D system) <strong>in</strong> the small wave vector limit<br />
and, as a consequence, 2p=x 0 represents a characteristic<br />
timescale of the system [9,10]. In a typical<br />
metal such as Al this time is of the order of<br />
0.1 fs. In this respect, it is worth to mention that<br />
for the evolution of the image potential when a<br />
charged particle is suddenly created <strong>in</strong> front of a<br />
metal surface this rolep<br />
is played by the surface<br />
plasmon frequency x 0 =<br />
ffiffi<br />
2 [11]. On the contrary,<br />
for a 2D <strong>electron</strong> <strong>gas</strong>, the plasmon frequency goes<br />
to zero <strong>in</strong> the small wave vector limit and shows a<br />
stronger dispersion. These properties make difficult<br />
to assign a unique frequency <strong>in</strong> order to<br />
characterize the response of the 2D system to an<br />
external perturbation. Due to this, qualitative<br />
differences between the 2D and the 3D <strong>electron</strong><br />
<strong>gas</strong> are found.<br />
Our study has application <strong>in</strong> problems <strong>in</strong> which<br />
a charge is created <strong>in</strong> a polarizable medium that<br />
can be approximated by a 2D <strong>electron</strong> <strong>gas</strong>, on a<br />
timescale much shorter than the characteristic<br />
<strong>screen<strong>in</strong>g</strong> times obta<strong>in</strong>ed here. In this respect, recent<br />
experiments performed for atomic coverage<br />
adlayers on semiconductors have revealed the 2D<br />
collective excitations of the overlayers [12,13]. The<br />
response of a well-def<strong>in</strong>ed surface state band that<br />
is not strongly coupled to the bulk modes, such as<br />
the surface state at the Be(0 0 0 1) surface [14], is<br />
also characterized by its 2D nature. In all these<br />
systems, processes such as the creation of an <strong>in</strong>nershell<br />
hole <strong>in</strong> an adsorbate located at these surfaces,<br />
or the excitation of an <strong>electron</strong> from an image or a<br />
surface state will <strong>in</strong>duce the 2D-like response of<br />
the <strong>electron</strong>s <strong>in</strong> the medium, try<strong>in</strong>g to screen the<br />
external charge created. In these cases, a natural<br />
question aris<strong>in</strong>g <strong>in</strong> view of the recent development<br />
of time-resolved techniques is which time resolution<br />
is needed to probe the transient regime or<br />
under which conditions this transient behaviour<br />
can be neglected.<br />
The paper is organized as follows. In Section 2<br />
we expla<strong>in</strong> the theoretical model to calculate the<br />
<strong>in</strong>duced density when a charge is suddenly created<br />
<strong>in</strong> a 2D <strong>electron</strong> <strong>gas</strong>. In Section 3 a comparative<br />
analysis of the transients effects occurr<strong>in</strong>g dur<strong>in</strong>g<br />
the <strong>screen<strong>in</strong>g</strong> process <strong>in</strong> a 2D and <strong>in</strong> a 3D <strong>electron</strong><br />
<strong>gas</strong> is presented. Our conclud<strong>in</strong>g remarks are<br />
summarized <strong>in</strong> Section 4. In order to avoid an<br />
extensive use of variables, we <strong>in</strong>dist<strong>in</strong>ctly refer to<br />
the space and wave vectors for the 2D and the 3D<br />
cases as r and q, although the mean<strong>in</strong>g is obviously<br />
different. Atomic units (a.u.) are used unless it is<br />
otherwise stated. In this system, the unit of time<br />
corresponds to 2.42 · 10 2 fs, the unit of energy to<br />
27.21 eV, and the unit of density to 3.57 · 10 16<br />
cm 2 <strong>in</strong> the 2D case and to 6.75 · 10 24 cm 3 <strong>in</strong> the<br />
3D case.<br />
2. Model<br />
Let us consider that a charge Z 1 is suddenly<br />
created <strong>in</strong> a 2D <strong>electron</strong> <strong>gas</strong> at time t ¼ 0. The<br />
impurity charge density is q ext ¼ Z 1 dðrÞhðtÞ, where<br />
hðtÞ is the Heaviside function. Our purpose is to<br />
model, us<strong>in</strong>g l<strong>in</strong>ear response theory (LRT), the<br />
evolution <strong>in</strong> time of the charge density fluctuation
M. Alduc<strong>in</strong> et al. / Surface Science 559 (2004) 233–240 235<br />
<strong>in</strong>duced by the impurity charge. L<strong>in</strong>ear response<br />
theory fails <strong>in</strong> reproduc<strong>in</strong>g quantitatively key features<br />
such as the absolute values of the <strong>in</strong>duced<br />
density at the orig<strong>in</strong> and the presence of a bound<br />
state for any positive charge <strong>in</strong> 2D [15]. Nevertheless,<br />
<strong>in</strong> 3D comparison between recent nonl<strong>in</strong>ear<br />
calculations [10] and the l<strong>in</strong>ear results of [9]<br />
shows that the time evolution of transients is well<br />
reproduced by LRT. The reason for this is that<br />
LRT describes correctly the plasmon frequency<br />
which def<strong>in</strong>es the characteristic timescale for<br />
transients. S<strong>in</strong>ce the same is true <strong>in</strong> 2D, our results<br />
for the time evolution are mean<strong>in</strong>gful, though they<br />
are presumably more reliable for negative charges<br />
due to the problems that may be associated with<br />
the presence of the bound state.<br />
In LRT the potential <strong>in</strong>duced by an external<br />
charge q ext can be easily obta<strong>in</strong>ed <strong>in</strong> Fourier space<br />
as<br />
/ <strong>in</strong>d ðq; xÞ ¼q ext ðq; xÞ 2p q<br />
<br />
1<br />
2D ðq; xÞ<br />
<br />
1 ; ð1Þ<br />
where 2D ðq; xÞ is the dielectric response function<br />
of the 2D <strong>electron</strong> <strong>gas</strong>; the Coulomb potential is<br />
v c ðqÞ ¼2p=q, and the Fourier transform of the<br />
suddenly created external charge density is<br />
q ext ðq; xÞ ¼ iZ 1<br />
x þ ig ;<br />
ð2Þ<br />
with g a positive <strong>in</strong>f<strong>in</strong>itesimal. The <strong>in</strong>duced density<br />
is obta<strong>in</strong>ed as q <strong>in</strong>d ðq; xÞ ¼/ <strong>in</strong>d ðq; xÞ=v c ðqÞ. Hence,<br />
<br />
q <strong>in</strong>d ðq; xÞ ¼q ext ðq; xÞ<br />
1<br />
2D ðq; xÞ<br />
<br />
1 : ð3Þ<br />
In order to describe <strong>in</strong> real space, the time<br />
evolution of the <strong>in</strong>duced density, we just substitute<br />
Eq. (2) <strong>in</strong> Eq. (3) and take the <strong>in</strong>verse Fourier<br />
transform of it. Thus, after some manipulation one<br />
gets<br />
q <strong>in</strong>d ðr; tÞ ¼ Z Z 1<br />
1<br />
dqqJ<br />
2p 2 0 ðqrÞ<br />
0<br />
Z þ1<br />
<br />
dx<br />
<br />
x Im 1<br />
2D ðq; xÞ<br />
1<br />
½1 cosðxtÞŠhðtÞ; ð4Þ<br />
where J 0 ðxÞ is the Bessel function of order zero. In<br />
deriv<strong>in</strong>g this f<strong>in</strong>al equation, we follow the same<br />
procedure applied by Canright to the 3D problem<br />
[9]. Briefly, the differences <strong>in</strong> the analytical<br />
expressions of the charge density <strong>in</strong>duced <strong>in</strong> a<br />
2D <strong>electron</strong> <strong>gas</strong> and <strong>in</strong> a 3D <strong>electron</strong> <strong>gas</strong> are<br />
the follow<strong>in</strong>g. The dependence on space is given<br />
by the Bessel function J 0 ðqrÞ <strong>in</strong> the former and<br />
by a ½s<strong>in</strong>ðqrÞŠ=r term <strong>in</strong> the latter. In both cases,<br />
the result is an oscillatory behaviour with the<br />
distance to the external charge. Formally, the time<br />
dependence is ruled <strong>in</strong> both systems by the same<br />
oscillatory term ½1 cosðxtÞŠ, which multiplies<br />
the correspond<strong>in</strong>g spectral function, Imf1= 2D;3D<br />
ðq; xÞg.<br />
In this work, we use the dielectric response<br />
function derived by Stern [16] <strong>in</strong> the random-phase<br />
approximation (RPA), RPA<br />
2D<br />
. In this approach, the<br />
excitations contribut<strong>in</strong>g to the spectral function<br />
Imf1= RPA<br />
2D<br />
g <strong>in</strong>clude <strong>two</strong> k<strong>in</strong>d of processes, s<strong>in</strong>gle<br />
particle or <strong>electron</strong>-hole (e-h) pair creation and<br />
collective or plasmon excitation. On the one hand,<br />
the e-h pair formation occurs for those ðq; xÞ–<br />
values at which Imf 2D ðq; xÞg 6¼ 0. For x > 0,<br />
that condition is verified <strong>in</strong> the region limited by<br />
the curves x ¼ qq F þ q 2 =2 and x ¼ qq F þ q 2 =2,<br />
where q F ¼ð2pnÞ 1=2 is the Fermi wave vector for a<br />
2D <strong>electron</strong> <strong>gas</strong> with <strong>electron</strong>ic density n. On the<br />
other hand, a plasmon excitation is characterized<br />
by the condition 2D ðq; xÞ ¼0, which def<strong>in</strong>es a<br />
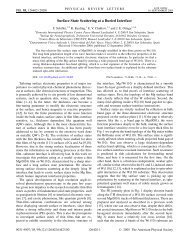
s<strong>in</strong>gle curve x p ðqÞ <strong>in</strong> the ðq; xÞ-plane. The spectrum<br />
of excitations is plotted <strong>in</strong> Fig. 1(a) for a 2D<br />
<strong>electron</strong> <strong>gas</strong> with r s ¼ 2 [def<strong>in</strong>ed as n ¼ 1=ðprs 2Þ].<br />
The shadow region corresponds to e-h pair excitations<br />
and the curve x p ðqÞ accounts for the<br />
plasmon excitation. For comparison, Fig. 1(b)<br />
shows the spectrum of excitations obta<strong>in</strong>ed <strong>in</strong> the<br />
RPA for a 3D <strong>electron</strong> <strong>gas</strong> with r s ¼ 2 [now def<strong>in</strong>ed<br />
as n ¼ 3=ð4prs 3 Þ]. Here, the plasmon excitation<br />
takes place along the curve x p ðqÞ, whereas the<br />
shadow region limited by the curves x ¼ qq F þ<br />
q 2 =2 and x ¼ qq F þ q 2 =2 <strong>in</strong>dicates the e-h pair<br />
contribution (q F ¼ð3p 2 nÞ 1=3 is the Fermi wave<br />
vector <strong>in</strong> a 3D <strong>electron</strong> <strong>gas</strong>). The plasmon curves<br />
show a different behaviour <strong>in</strong> both systems. In a<br />
3D <strong>electron</strong> <strong>gas</strong>, the plasmon mode takes a f<strong>in</strong>ite<br />
value x 2 0<br />
¼ 4pn at q ¼ 0 and shows a smooth dispersion<br />
given by<br />
x 2 p ’ x2 0 þ 3=5q2 F q2 :
236 M. Alduc<strong>in</strong> et al. / Surface Science 559 (2004) 233–240<br />
q <strong>in</strong>d ðrÞ ¼ Z Z 1<br />
<br />
<br />
1<br />
1<br />
dqqJ 0 ðqrÞRe<br />
1 ;<br />
2p 0<br />
2D ðq; 0Þ<br />
ð5Þ<br />
which correspond to the stationary expression for<br />
the density <strong>in</strong>duced by an external charge density<br />
q ext ðrÞ ¼Z 1 dðrÞ. We checked that the results obta<strong>in</strong>ed<br />
by omitt<strong>in</strong>g the cos<strong>in</strong>e term <strong>in</strong> Eq. (4)<br />
reproduce well those obta<strong>in</strong>ed with Eq. (5). Notice,<br />
however, that <strong>in</strong> order to achieve this agreement it<br />
was necessary to use the exact x p ðqÞ <strong>in</strong>stead of the<br />
analytical approximations.<br />
3. Results and discussion<br />
Fig. 1. Spectrum of excitations for (a) 2D <strong>electron</strong> <strong>gas</strong> (upper<br />
panel) and (b) 3D <strong>electron</strong> <strong>gas</strong> (lower panel). In both cases<br />
r s ¼ 2. The shadow areas <strong>in</strong>dicate the ðq; xÞ-values at which the<br />
e-h pair excitations can take place. The curves x p ðqÞ <strong>in</strong>dicate<br />
the plasmon excitations.<br />
In the 2D case however, the plasmon frequency<br />
behaves as<br />
x 2 p ’ q2 F q<br />
for small values of q<br />
and as<br />
x 2 p ’ q2 F q þ 3=4q2 F q2 for larger values of q:<br />
There are <strong>two</strong> dist<strong>in</strong>ctive features for the 2Dplasmon<br />
frequency as compared to the 3D one: x p<br />
is zero for q ¼ 0 and the q-dispersion is stronger.<br />
Let us make a f<strong>in</strong>al comment on the expression<br />
we derived for the <strong>in</strong>duced density <strong>in</strong> Eq. (4). In<br />
the limit t !1, s<strong>in</strong>ce the cosðxtÞ term <strong>in</strong>tegrates<br />
to zero, the x-<strong>in</strong>tegral can be analytically evaluated<br />
us<strong>in</strong>g the Kramers–Kron<strong>in</strong>g relations. Hence,<br />
one gets<br />
In this section we show results for an external<br />
charge created <strong>in</strong> an <strong>electron</strong> <strong>gas</strong> with r s ¼ 2.<br />
Calculations were also carried out for different<br />
metallic densities (r s ¼ 3, 4). In general, we observe<br />
that for lower densities, the response of the medium<br />
to screen the external impurity is slower. Except<br />
for this fact, the comparative analysis between<br />
the 2D and the 3D <strong>electron</strong> <strong>gas</strong> presented <strong>in</strong> this<br />
section can be qualitatively generalized to those<br />
densities.<br />
In Fig. 2 we plot the <strong>electron</strong>ic density n <strong>in</strong>d ¼<br />
q <strong>in</strong>d <strong>in</strong>duced at the position of the suddenly created<br />
charge as a function of time t for a 2D (Fig.<br />
2(a), upper panel) and a 3D (Fig. 2(b), lower<br />
panel) <strong>electron</strong> <strong>gas</strong>. S<strong>in</strong>ce the spectral functions<br />
Imf1= RPA<br />
2D;3D<br />
g consist of a cont<strong>in</strong>uum part (e-h<br />
pair) and a plasmon mode, we calculate the <strong>in</strong>duced<br />
density as q <strong>in</strong>d ¼ q eh þ q pl , where q eh and q pl<br />
take <strong>in</strong>to account the contribution to the <strong>screen<strong>in</strong>g</strong><br />
process com<strong>in</strong>g from e-h and plasmon excitation,<br />
respectively. Accord<strong>in</strong>gly <strong>in</strong> Fig. 2, n <strong>in</strong>d (bold-solid<br />
l<strong>in</strong>e) is the sum of n eh (long-dashed l<strong>in</strong>e) and n pl<br />
(dotted l<strong>in</strong>e). The stationary value (t !1) is<br />
<strong>in</strong>dicated by a th<strong>in</strong>-solid l<strong>in</strong>e. As it may be seen<br />
from the figure, n <strong>in</strong>d ð0; tÞ is dom<strong>in</strong>ated by the e-h<br />
part that rises quite fast with<strong>in</strong> the first 2–3 a.u. of<br />
time. This behaviour is observed for both the 2D<br />
and the 3D medium. Nevertheless, an important<br />
difference arises between both cases. Whereas <strong>in</strong> a<br />
2D <strong>electron</strong> <strong>gas</strong> n <strong>in</strong>d reaches the stationary value at<br />
t 8–9 a.u., <strong>in</strong> the 3D case n <strong>in</strong>d oscillates around<br />
its stationary value even for the longest time
M. Alduc<strong>in</strong> et al. / Surface Science 559 (2004) 233–240 237<br />
n<br />
<strong>in</strong>d<br />
(0, t) (a.u.)<br />
n<br />
<strong>in</strong>d<br />
(0, t) (a.u.)<br />
0.3<br />
0.2<br />
0.1<br />
0<br />
0.08<br />
0.06<br />
0.04<br />
0.02<br />
(a)<br />
2D<br />
0 5 10 15 20 25<br />
t (a.u.)<br />
(b)<br />
3D<br />
0<br />
0 5 10 15 20 25<br />
t (a.u.)<br />
Fig. 2. <strong>Time</strong> dependence of the <strong>electron</strong>ic density n <strong>in</strong>d ð0; tÞ<br />
(bold-solid l<strong>in</strong>e) <strong>in</strong>duced <strong>in</strong> a 2D <strong>electron</strong> <strong>gas</strong> (upper panel) and<br />
a 3D <strong>electron</strong> <strong>gas</strong> (lower panel) at the position of the suddenly<br />
created charge Z 1 ¼ 1. In both cases r s ¼ 2. The contribution to<br />
the <strong>in</strong>duced density due to plasmon excitation n pl and to e-h<br />
pair excitations n eh are represented by dotted and by long-dashed<br />
l<strong>in</strong>es, respectively. The steady-state value n <strong>in</strong>d ð0; t !1Þis<br />
<strong>in</strong>dicated by a th<strong>in</strong>-solid l<strong>in</strong>e.<br />
shown <strong>in</strong> the figure. Comparison between Fig. 2(a)<br />
and (b) reveals that the orig<strong>in</strong> of this discrepancy<br />
is, precisely, the different time dependence of n pl .<br />
As it was already po<strong>in</strong>ted out by Canright for a 3D<br />
<strong>electron</strong> <strong>gas</strong> [9], the long-term transient is provided<br />
by the plasmon part. The existence of a quite welldef<strong>in</strong>ed<br />
frequency at which the spectral function<br />
takes the highest values gives rise to the oscillatory<br />
behaviour with frequency x p . The absence of<br />
this oscillatory term at long times <strong>in</strong> the 2D case is<br />
thus related to the special character of the 2D<br />
plasmon mode. The <strong>two</strong> features remarked <strong>in</strong> the<br />
previous section make difficult to f<strong>in</strong>d a unique<br />
characteristic frequency as <strong>in</strong> the 3D case. As a<br />
consequence, its contribution to the <strong>in</strong>duced density<br />
at r ¼ 0 is very different from the 3D result,<br />
and does not show an oscillatory behaviour.<br />
In Fig. 3, we show the <strong>in</strong>terpolated images of<br />
the radial densities, i.e., 2prn <strong>in</strong>d ðr; tÞ <strong>in</strong> 2D (Fig.<br />
3(a)) and 4pr 2 n <strong>in</strong>d ðr; tÞ <strong>in</strong> 3D (Fig. 3(b)). The correspond<strong>in</strong>g<br />
stationary limit is represented on the<br />
right part of each panel. We observe the Friedel<br />
oscillations appear<strong>in</strong>g <strong>in</strong> both stationary limits<br />
that scale as [s<strong>in</strong>ðq F rÞ=r] for r !1. The images<br />
provide a valuable <strong>in</strong>formation on the propagation<br />
of the response of the medium to an external<br />
perturbation. In view of these figures, the evolution<br />
<strong>in</strong> time of the <strong>screen<strong>in</strong>g</strong> process can be described<br />
<strong>in</strong> <strong>two</strong> steps: the switch<strong>in</strong>g on process or<br />
propagation of the shock-wave along the medium<br />
and the stabilization to the steady behaviour. We<br />
def<strong>in</strong>e the switch<strong>in</strong>g on process at a given distance<br />
as the <strong>in</strong>terval go<strong>in</strong>g from the arrival of the first<br />
perturbation up to the <strong>in</strong>stant at which the <strong>in</strong>duced<br />
density reaches its highest value. This wave-front<br />
can be easily identified <strong>in</strong> each image as the first<br />
band grow<strong>in</strong>g upwards from the left-bottom corner<br />
of the figure.<br />
Consider<strong>in</strong>g this switch<strong>in</strong>g on process, we f<strong>in</strong>d<br />
similarities between the 2D and the 3D cases. The<br />
wave-front is characterized by strong variations of<br />
the <strong>in</strong>duced density that achieves values much<br />
larger than those of its steady-state limit. The<br />
propagation velocity can be roughly estimated<br />
from the slope of the wave-front as v ð1 2Þv F<br />
(v F is the Fermi velocity <strong>in</strong> each case). Ma<strong>in</strong> differences<br />
appear <strong>in</strong> the transition to the stationary<br />
value. In the 2D case, the <strong>screen<strong>in</strong>g</strong> transients last<br />
roughly the passage of this wave-front. As a consequence,<br />
after a limited short-time <strong>in</strong>terval s<strong>in</strong>ce<br />
the arrival of the <strong>in</strong>itial perturbation (Dt 8–10<br />
a.u.), the steady-state value is basically reached.<br />
Furthermore, the transient regime does not show<br />
any oscillatory behaviour. Note that after 20 a.u.<br />
of time the stationary regime has been achieved for<br />
all the distances shown <strong>in</strong> the figure. On the contrary,<br />
<strong>in</strong> the 3D case the <strong>screen<strong>in</strong>g</strong> transients last<br />
for very long times. After the passage of the first<br />
wave-front the radial density cont<strong>in</strong>ues oscillat<strong>in</strong>g<br />
around its steady-state value.<br />
In order to get <strong>in</strong>formation on the efficiency of<br />
the medium to screen the external charge, we also
238 M. Alduc<strong>in</strong> et al. / Surface Science 559 (2004) 233–240<br />
Fig. 3. (Colour on l<strong>in</strong>e) Interpolated images of the radial<br />
densities: (a) 2prn <strong>in</strong>d ðr; tÞ for the 2D case and (b) 4pr 2 n <strong>in</strong>d ðr; tÞ<br />
for the 3D case, when a charge Z 1 ¼ 1 is suddenly created at<br />
r ¼ 0 and t ¼ 0. In both figures r s ¼ 2. The correspond<strong>in</strong>g<br />
stationary limit is represented on the right part of each panel.<br />
Colour codes are shown <strong>in</strong> the <strong>in</strong>sets (See the onl<strong>in</strong>e paper for a<br />
colour version of the figure.).<br />
calculate the <strong>in</strong>tegrated <strong>screen<strong>in</strong>g</strong> density QðR; tÞ,<br />
def<strong>in</strong>ed <strong>in</strong> 2D as<br />
Q 2D ðR; tÞ ¼<br />
Z R<br />
0<br />
dr 2prn <strong>in</strong>d ðr; tÞ;<br />
ð6Þ<br />
and <strong>in</strong> 3D as<br />
Q 3D ðR; tÞ ¼<br />
Z R<br />
0<br />
dr 4pr 2 n <strong>in</strong>d ðr; tÞ:<br />
ð7Þ<br />
This quantity shows the range of distances <strong>in</strong><br />
which the external charge is basically screened, i.e.<br />
the value of R at which QðRÞ 1. Therefore, the<br />
study of its evolution <strong>in</strong> time allows us to extract<br />
the time needed by the system to efficiently screen<br />
the external charge.<br />
In Fig. 4 we compare the time evolution of QðRÞ<br />
with the steady-state limit (bold-solid l<strong>in</strong>es) <strong>in</strong> the<br />
2D <strong>electron</strong> <strong>gas</strong> (left panels) and <strong>in</strong> the 3D <strong>electron</strong><br />
<strong>gas</strong> (right panels). The value QðRÞ ¼1, i.e., the<br />
value of the external charge to be screened, is<br />
<strong>in</strong>dicated by a th<strong>in</strong>-solid l<strong>in</strong>e. Lower plots show<br />
the evolution of QðRÞ at short times, when the<br />
switch<strong>in</strong>g on process is tak<strong>in</strong>g place <strong>in</strong> the region<br />
close to the external charge. In both systems, the<br />
dress<strong>in</strong>g mechanism evolves from the <strong>in</strong>complete<br />
<strong>screen<strong>in</strong>g</strong> at the beg<strong>in</strong>n<strong>in</strong>g of the process (t ¼ 1–2<br />
a.u.) to over<strong>screen<strong>in</strong>g</strong> phases around t ¼ 3–5 a.u.<br />
In the upper plots, we show the evolution of<br />
QðRÞ at longer times, i.e., dur<strong>in</strong>g the stabilization<br />
period. The differences observed between the 2D<br />
and the 3D radial densities are also reproduced<br />
here. In 3D, QðR; tÞ strongly oscillates around the<br />
stationary value with a slowly decreas<strong>in</strong>g amplitude.<br />
Note that for the longest time shown <strong>in</strong> the<br />
figure (t ¼ 25 a.u.) the steady value has only been<br />
achieved up to R ¼ 5 a.u. On the contrary, <strong>in</strong> 2D<br />
this transition to the stationary regime is<br />
smoother, and no strong oscillations are observed.<br />
In the important region close to the external<br />
charge (R < 10 a.u.), the dress<strong>in</strong>g process is already<br />
completed after the first 16–20 a.u. (0.4–0.5<br />
fs).<br />
4. Conclusion<br />
In summary, we have studied us<strong>in</strong>g l<strong>in</strong>ear response<br />
theory the <strong>screen<strong>in</strong>g</strong> transients when a<br />
charge is suddenly created <strong>in</strong> a 2D <strong>electron</strong> <strong>gas</strong>.<br />
Perturbations <strong>in</strong> the medium propagate with a<br />
velocity of the order of ð1 2Þv F . The steady-state<br />
is achieved after the passage of the first wavefront.<br />
For r s ¼ 2, <strong>in</strong> the important region close to
M. Alduc<strong>in</strong> et al. / Surface Science 559 (2004) 233–240 239<br />
2.5<br />
2D<br />
3D<br />
Q (R)<br />
2<br />
1.5<br />
1<br />
0.5<br />
0<br />
t = 20<br />
t = 5<br />
t = 10<br />
t = 16<br />
Q (R)<br />
2<br />
1<br />
0<br />
-1<br />
2<br />
t = 25<br />
t = 16<br />
t = 20<br />
t = 10<br />
t = 5<br />
Q (R)<br />
1<br />
Q (R)<br />
1.5<br />
t = 3<br />
1<br />
0.5<br />
t = 3<br />
t = 2<br />
t = 2<br />
0.5<br />
t = 1<br />
t = 1<br />
0<br />
0<br />
0 2 4 6 8 10<br />
0 2 4 6 8 10<br />
R (a.u.)<br />
R (a.u.)<br />
Fig. 4. <strong>Time</strong> evolution of the <strong>in</strong>tegrated <strong>screen<strong>in</strong>g</strong> density QðRÞ def<strong>in</strong>ed <strong>in</strong> Eqs. (6) and (7). From lower to upper, left (right) panels<br />
show the time evolution <strong>in</strong> the 2D (3D) <strong>electron</strong> <strong>gas</strong>. <strong>Time</strong> labels are <strong>in</strong> a.u. The values of QðRÞ for a stationary perturbation is shown<br />
by a bold-solid l<strong>in</strong>e <strong>in</strong> each plot. We <strong>in</strong>dicate by a th<strong>in</strong>-solid l<strong>in</strong>e the value QðRÞ ¼1, i.e., the value of the external charge to be screened.<br />
the external charge, the stationary regime is basically<br />
reached after the first 0.4–0.5 fs. This<br />
behaviour is very different from the 3D case <strong>in</strong><br />
which the <strong>screen<strong>in</strong>g</strong> transients, characterized by<br />
strong oscillations of the <strong>in</strong>duced density, last for<br />
much longer times. The differences between the<br />
<strong>two</strong> behaviours are due to the different nature of<br />
the 2D and 3D plasmons <strong>in</strong> the long wavelength<br />
limit.<br />
F<strong>in</strong>ally, <strong>in</strong> connection with the experimental<br />
situations mentioned <strong>in</strong> the <strong>in</strong>troduction (creation<br />
of holes <strong>in</strong> <strong>in</strong>ner-shells of adsorbates and excitation<br />
of <strong>electron</strong>s from image and surface states)<br />
our results show that, <strong>in</strong> pr<strong>in</strong>ciple, one should<br />
expect a reduced importance of <strong>screen<strong>in</strong>g</strong> transients<br />
compared to the bulk situation. Nevertheless,<br />
we also po<strong>in</strong>t out that the actual duration of<br />
transients will <strong>in</strong>crease for lower values of the<br />
surface <strong>electron</strong>ic density.<br />
Acknowledgements<br />
We are <strong>in</strong>debted to A. Borisov and R. Dıez<br />
Mui~no for fruitful discussions. We acknowledge<br />
partial support by the Basque Departamento de<br />
Educacion, Universidades e Investigacion, the<br />
University of the Basque Country UPV/EHU<br />
(Grant no. 9/UPV 00206.215-13639/2001) and the<br />
Spanish MCyT (Grant nos. BFM2001-0076 and<br />
MAT2001-0946). M.A. acknowledge f<strong>in</strong>antial<br />
support by the Gipuzkoako Foru Aldundia.<br />
References<br />
[1] M. Drescher, M. Hentschel, R. Kienberger, G. Tempea,<br />
Ch. Spielmann, G.A. Reider, P.B. Corkum, F. Krausz,<br />
Science 291 (2001) 1923.<br />
[2] M. Hentschel, R. Kienberger, Ch. Spielmann, G.A. Reider,<br />
N. Milosevic, T. Brabec, P.B. Corkum, U. He<strong>in</strong>zmann, M.<br />
Drescher, F. Krausz, Nature 414 (2001) 509.<br />
[3] A. Baltuska, Th. Udem, M. Uiberacker, M. Hentschel, E.<br />
Goulielmakis, Ch. Gohle, R. Holzwarth, V.S. Yakoviev,<br />
A. Scr<strong>in</strong>zi, T.W. H€ansch, F. Krausz, Nature 421 (2003)<br />
611.<br />
[4] J.T. Yue, S. Doniach, Phys. Rev. B 8 (1973) 4578.<br />
[5] W. Ekardt, W.-D. Sch€one, R. Keyl<strong>in</strong>g, Appl. Phys. A 71<br />
(2000) 529.<br />
[6] W.-D. Sch€one, W. Ekardt, Phys. Rev. B 62 (2000) 13464.<br />
[7] R. Huber, F. Tauser, A. Brodschelm, M. Bichler, G.<br />
Abstreiter, A. Leitenstorfer, Nature 414 (2001) 286.<br />
[8] L. Banyai, Q.T. Vu, B. Mieck, H. Haug, Phys. Rev. Lett.<br />
81 (1998) 882.<br />
[9] G.S. Canright, Phys. Rev. B 38 (1988) 1647.
240 M. Alduc<strong>in</strong> et al. / Surface Science 559 (2004) 233–240<br />
[10] A. Borisov, D. Sanchez-Portal, R. Dıez Mui~no, P.M.<br />
Echenique, Chem. Phys. Lett. 387 (2004) 95.<br />
[11] M. Alduc<strong>in</strong>, R. Dıez Mui~no, J.I. Juaristi, J. Electron<br />
Spectrosc. Relat. Phenom. 129 (2003) 105.<br />
[12] T. Nagao, T. Hildebrandt, M. Henzler, S. Hasegawa, Phys.<br />
Rev. Lett. 86 (2001) 5747.<br />
[13] R. Biagi, V. Corrad<strong>in</strong>i, G. Bertoni, C. Mariani, U. del<br />
Penn<strong>in</strong>o, M.G. Betti, Phys. Rev. B 64 (2001) 195407.<br />
[14] V.M. Silk<strong>in</strong>, T. Balasubramanian, E.V. Chulkov, A.<br />
Rubio, P.M. Echenique, Phys. Rev. B 64 (2001) 085334.<br />
[15] B. Simon, Ann. Phys.: New York 97 (1976) 279.<br />
[16] F. Stern, Phys. Rev. Lett. 18 (1967) 546.