Download the November/December 2003 Issue in PDF format
Download the November/December 2003 Issue in PDF format
Download the November/December 2003 Issue in PDF format

Create successful ePaper yourself
Turn your PDF publications into a flip-book with our unique Google optimized e-Paper software.
s<strong>in</strong>ce part of <strong>the</strong> distribution falls outside <strong>the</strong><br />
USL. With <strong>the</strong> mean of <strong>the</strong> distribution located<br />
where it is, some percentage of parts will fall outside<br />
<strong>the</strong> USL.<br />
Double-Sided and S<strong>in</strong>gle-Sided Tolerances<br />
Double-sided tolerances or bilateral tolerances<br />
are those which def<strong>in</strong>e a nom<strong>in</strong>al dimension<br />
along with a plus or m<strong>in</strong>us tolerance. Bilateral<br />
tolerances tend to generate distributions that are<br />
normal. Typically a gear size over p<strong>in</strong>s, wires or<br />
balls would be bilateral.<br />
S<strong>in</strong>gle-sided or unilateral tolerances have a<br />
s<strong>in</strong>gle limit tolerance. A zero-based dimension<br />
unilateral tolerance has zero as <strong>the</strong> <strong>in</strong>herent target<br />
value. Typically gear runout, pitch variation, etc.<br />
are unilateral tolerances. Unilateral tolerances by<br />
nature tend to generate distributions that have a<br />
visible amount of skewness or non-normality.<br />
S<strong>in</strong>gle-sided tolerances are calculated us<strong>in</strong>g <strong>the</strong><br />
Cpk or Ppk <strong>in</strong>dices as described above.<br />
Some customers use different methods <strong>in</strong> handl<strong>in</strong>g<br />
<strong>the</strong> data to calculate <strong>the</strong> capability <strong>in</strong>dex for<br />
unilateral tolerances. One example is demonstrated<br />
<strong>in</strong> <strong>the</strong> Delphi specification SD-002 (Ref. 3). A<br />
mirror image trans<strong>format</strong>ion is used to “normalize”<br />
<strong>the</strong> data set. The data is ordered from <strong>the</strong><br />
smallest values to <strong>the</strong> largest values. When <strong>the</strong>re<br />
is an odd number of data po<strong>in</strong>ts, <strong>the</strong> median is <strong>the</strong><br />
middle value of <strong>the</strong> ordered data. When <strong>the</strong>re is<br />
an even number of data po<strong>in</strong>ts, <strong>the</strong> median is <strong>the</strong><br />
average of <strong>the</strong> two middle values of <strong>the</strong> ordered<br />
data set. The trans<strong>format</strong>ion is made by first<br />
remov<strong>in</strong>g all <strong>the</strong> data po<strong>in</strong>ts that fall above <strong>the</strong><br />
median for a m<strong>in</strong>imum specification and below<br />
<strong>the</strong> median for a maximum specification. For<br />
each rema<strong>in</strong><strong>in</strong>g data value, a correspond<strong>in</strong>g value<br />
is created equally distant from <strong>the</strong> median on <strong>the</strong><br />
median’s opposite side. Standard techniques are<br />
<strong>the</strong>n used to calculate a “trial” standard deviation<br />
from <strong>the</strong> mirrored data set.<br />
Us<strong>in</strong>g σ trial , all values that exceed <strong>the</strong> (median<br />
— ^<br />
Reference value<br />
Gage Bias<br />
Figure 15—Gage bias.<br />
Observed average<br />
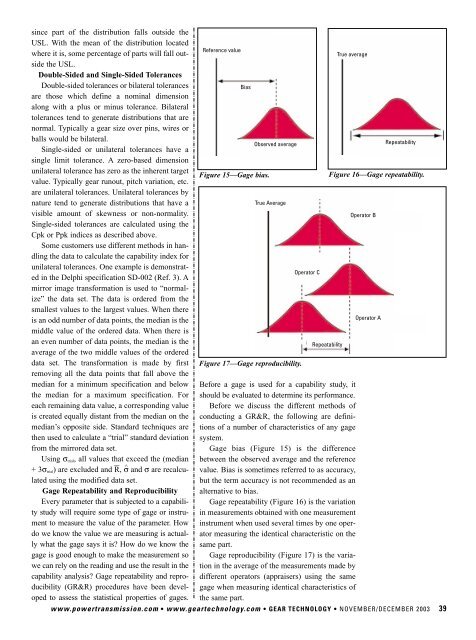
Figure 17—Gage reproducibility.<br />
Before a gage is used for a capability study, it<br />
should be evaluated to determ<strong>in</strong>e its performance.<br />
Before we discuss <strong>the</strong> different methods of<br />
conduct<strong>in</strong>g a GR&R, <strong>the</strong> follow<strong>in</strong>g are def<strong>in</strong>itions<br />
of a number of characteristics of any gage<br />
system.<br />
Gage bias (Figure 15) is <strong>the</strong> difference<br />
between <strong>the</strong> observed average and <strong>the</strong> reference<br />
value. Bias is sometimes referred to as accuracy,<br />
but <strong>the</strong> term accuracy is not recommended as an<br />
alternative to bias.<br />
Gage repeatability (Figure 16) is <strong>the</strong> variation<br />
<strong>in</strong> measurements obta<strong>in</strong>ed with one measurement<br />
<strong>in</strong>strument when used several times by one operator<br />
measur<strong>in</strong>g <strong>the</strong> identical characteristic on <strong>the</strong><br />
same part.<br />
Gage reproducibility (Figure 17) is <strong>the</strong> variation<br />
<strong>in</strong> <strong>the</strong> average of <strong>the</strong> measurements made by<br />
different operators (appraisers) us<strong>in</strong>g <strong>the</strong> same<br />
gage when measur<strong>in</strong>g identical characteristics of<br />
Figure 16—Gage repeatability.<br />
+ 3σ trial ) are excluded and R, σ and σ are recalculated<br />
us<strong>in</strong>g <strong>the</strong> modified data set.<br />
Gage Repeatability and Reproducibility<br />
Every parameter that is subjected to a capability<br />
study will require some type of gage or <strong>in</strong>strument<br />
to measure <strong>the</strong> value of <strong>the</strong> parameter. How<br />
do we know <strong>the</strong> value we are measur<strong>in</strong>g is actually<br />
what <strong>the</strong> gage says it is? How do we know <strong>the</strong><br />
gage is good enough to make <strong>the</strong> measurement so<br />
we can rely on <strong>the</strong> read<strong>in</strong>g and use <strong>the</strong> result <strong>in</strong> <strong>the</strong><br />
capability analysis? Gage repeatability and reproducibility<br />
(GR&R) procedures have been developed<br />
to assess <strong>the</strong> statistical properties of gages. <strong>the</strong> same part.<br />
www.powertransmission.com • www.geartechnology.com • GEAR TECHNOLOGY • NOVEMBER/DECEMBER <strong>2003</strong> 39<br />
Bias<br />
True Average<br />
Gage Repeatability<br />
Operator C<br />
Repeatability<br />
True average<br />
Operator B<br />
Gage Repeatability<br />
Operator A<br />
Repeatability