Download - Gear Technology magazine
Download - Gear Technology magazine
Download - Gear Technology magazine

You also want an ePaper? Increase the reach of your titles
YUMPU automatically turns print PDFs into web optimized ePapers that Google loves.
that the minimum transmission error is<br />
achieved E V when E the N sum T of the S profile and<br />
lead crown are equal to about 0.0009 in.<br />
The rows are ori ented such that the sum<br />
of profile and lead crowns is lowest at<br />
the top and increases as one reads down<br />
the table.<br />
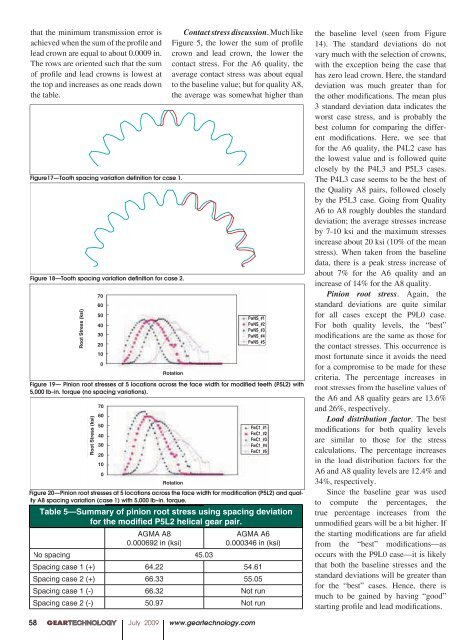
Figure17—Tooth spacing variation definition for case 1.<br />
Figure 18—Tooth spacing variation definition for case 2.<br />
Root Stress (ksi)<br />
Root Stress (ksi)<br />
70<br />
60<br />
50<br />
40<br />
30<br />
20<br />
10<br />
0<br />
70<br />
60<br />
50<br />
40<br />
30<br />
20<br />
10<br />
0<br />
Rotation<br />
Rotation<br />
FwNS_#1<br />
FwNS_#2<br />
FwNS_#3<br />
FwNS_#4<br />
FwNS_#5<br />
FwC1_#1<br />
FwC1_#2<br />
FwC1_#3<br />
FwC1_#4<br />
FwC1_#5<br />
Table 5—Summary of pinion root stress using spacing deviation<br />
for the modified P5L2 helical gear pair.<br />
AGMA A8<br />
0.000692 in (ksi)<br />
No spacing 45.03<br />
Contact stress discussion. Much like<br />
Figure 5, the lower the sum of profile<br />
crown and lead crown, the lower the<br />
contact stress. For the A6 quality, the<br />
av erage contact stress was about equal<br />
to the base line value; but for quality A8,<br />
the average was some what higher than<br />
Figure 19— Pinion root stresses at 5 locations across the face width for modified teeth (P5L2) with<br />
5,000 lb–in. torque (no spacing variations).<br />
Figure 20—Pinion root stresses at 5 locations across the face width for modification (P5L2) and quality<br />
A8 spacing variation (case 1) with 5,000 lb–in. torque.<br />
AGMA A6<br />
0.000346 in (ksi)<br />
Spacing case 1 (+) 64.22 54.61<br />
Spacing case 2 (+) 66.33 55.05<br />
Spacing case 1 (-) 66.32 Not run<br />
Spacing case 2 (-) 50.97 Not run<br />
the baseline level (seen from Figure<br />
14). The standard deviations do not<br />
vary much with the selection of crowns,<br />
with the excep tion being the case that<br />
has zero lead crown. Here, the standard<br />
deviation was much greater than for<br />
the other modifications. The mean plus<br />
3 standard deviation data indicates the<br />
worst case stress, and is probably the<br />
best column for comparing the different<br />
modifications. Here, we see that<br />
for the A6 qual ity, the P4L2 case has<br />
the lowest value and is fol lowed quite<br />
closely by the P4L3 and P5L3 cases.<br />
The P4L3 case seems to be the best of<br />
the Quality A8 pairs, followed closely<br />
by the P5L3 case. Going from Quality<br />
A6 to A8 roughly doubles the standard<br />
deviation; the average stresses in crease<br />
by 7-10 ksi and the maximum stresses<br />
in crease about 20 ksi (10% of the mean<br />
stress). When taken from the baseline<br />
data, there is a peak stress increase of<br />
about 7% for the A6 quality and an<br />
increase of 14% for the A8 quality.<br />
Pinion root stress. Again, the<br />
standard deviations are quite similar<br />
for all cases except the P9L0 case.<br />
For both quality levels, the “best”<br />
modifications are the same as those for<br />
the contact stresses. This oc currence is<br />
most fortunate since it avoids the need<br />
for a compromise to be made for these<br />
criteria. The percentage increases in<br />
root stresses from the baseline values of<br />
the A6 and A8 quality gears are 13.6%<br />
and 26%, respectively.<br />
Load distribution factor. The best<br />
modifications for both quality levels<br />
are similar to those for the stress<br />
calculations. The percentage increases<br />
in the load distribution factors for the<br />
A6 and A8 quality levels are 12.4% and<br />
34%, respectively.<br />
Since the baseline gear was used<br />
to compute the percentages, the<br />
true percentage increases from the<br />
unmodified gears will be a bit higher. If<br />
the start ing modifications are far afield<br />
from the “best” modi fications—as<br />
occurs with the P9L0 case—it is likely<br />
that both the baseline stresses and the<br />
standard deviations will be greater than<br />
for the “best” cases. Hence, there is<br />
much to be gained by having “good”<br />
starting profile and lead modifications.<br />
00 GEARTECHNOLOGY July 2009 www.geartechnology.com<br />
58