Boll, Jan - Soil and Water Conservation Society
Boll, Jan - Soil and Water Conservation Society
Boll, Jan - Soil and Water Conservation Society
You also want an ePaper? Increase the reach of your titles
YUMPU automatically turns print PDFs into web optimized ePapers that Google loves.
Evaluation of <strong>Conservation</strong><br />
Practices in a Mixed-L<strong>and</strong><br />
Use <strong>Water</strong>shed using<br />
Interdisciplinary Analyses<br />
<strong>Jan</strong> <strong>Boll</strong> 1 , Erin S. Brooks 1 , Brian Crabtree 1 Naga S. Tosakana 2 , J.D. Wulfhorst 2 ,<br />
Larry van Tassel 2 , <strong>and</strong> Robert Mahler 3<br />
1<br />
Biological <strong>and</strong> Agricultural Engineering, University of Idaho, Moscow, ID<br />
2<br />
Agricultural Economics <strong>and</strong> Rural Sociology, University of Idaho, Moscow, ID<br />
3<br />
Plant, <strong>Soil</strong> <strong>and</strong> Entomological Sciences, University of Idaho, Moscow, ID
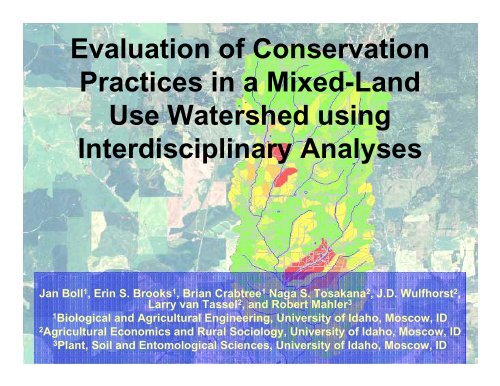
Paradise Creek <strong>Water</strong>shed<br />
•5000 ha watershed<br />
•Mixed l<strong>and</strong> use<br />
watershed with urban,<br />
agricultural <strong>and</strong> forested<br />
l<strong>and</strong>s<br />
•Exceeds TMDL for<br />
sediment loading (need<br />
85% reduction)<br />
Funded by USDA-CSREES-<br />
<strong>Conservation</strong> Effectiveness Assessment<br />
Program (CEAP)
Research & Objectives<br />
Our research includes: 1) combination of<br />
monitoring <strong>and</strong> modeling, 2) participatory<br />
component with local operators/managers<br />
Objectives:<br />
To modify a distributed erosion model to model<br />
hydrology correctly<br />
To target agricultural fields from physical data<br />
( sediment transport model)<br />
To target agricultural fields using physical <strong>and</strong><br />
socio-economic data ( optimization)
Hydrology<br />
• Variable source hydrology<br />
– The majority of runoff exiting a watershed is driven by<br />
a relatively small portion of the watershed.<br />
– The abundance of these runoff generating areas may<br />
increase <strong>and</strong> decrease depending on temporal <strong>and</strong><br />
spatial variability.
Saturated areas
<strong>Water</strong> Erosion Prediction Project<br />
(WEPP) Model<br />
• Uses readily available data sources (DEM,<br />
soils, l<strong>and</strong> use, climate)<br />
• We modified WEPP to simulate variable<br />
source area hydrology<br />
• Addition of 20 overl<strong>and</strong> flow elements per<br />
hillslope<br />
– Allows subsurface lateral flow to become<br />
surface runoff at toe slopes within a hillslope
Elevation map<br />
Slope map
GeoWEPP generated<br />
hillslopes<br />
• Up to 1000 hillslopes<br />
allowed per watershed<br />
• 20 Overl<strong>and</strong> flow elements<br />
per hillslope (maximum)
5 crops:<br />
• winter wheat<br />
• spring wheat<br />
• barley<br />
• peas<br />
• lentils<br />
3 tillage practices:<br />
• conventional<br />
• conservation (mulch till)<br />
• direct seed (no-till)<br />
•CRP<br />
L<strong>and</strong> use map
<strong>Water</strong> <strong>and</strong> Sediment Control Structure<br />
Gully Plug<br />
photo: Bill Dansert ISCC
Rock Chute<br />
Filter Strip<br />
Diversion<br />
Roof<br />
management
Hillslope Diagram<br />
With multiple OFE’s<br />
water can exit the<br />
hillslope when lower<br />
OFE’s become<br />
saturated
Historic Data Points<br />
2006 points
RESULTS<br />
• WEPP: quick validation review<br />
• WEPP: 30 yr simulations for different<br />
tillage practices<br />
• WEPP: mean vs median for management<br />
• Optimization: maximum returns while<br />
reducing sediment delivery to stream
Observed versus Simulated Streamflow<br />
40<br />
35<br />
WEPP Simulated<br />
Observed<br />
30<br />
Streamflow (mm)<br />
25<br />
20<br />
15<br />
10<br />
5<br />
0<br />
1/9/01 6/8/01 11/5/01 4/4/02 9/1/02 1/29/03 6/28/03 11/25/03 4/23/04
Streamflow <strong>and</strong> Sediment Load<br />
40<br />
35<br />
WEPP Simulated Streamflow<br />
Observed<br />
WEPP Simulated Sediment Load<br />
10000<br />
9000<br />
8000<br />
Streamflow (mm)<br />
30<br />
25<br />
20<br />
15<br />
7000<br />
6000<br />
5000<br />
4000<br />
Del. Sediment (Tonnes)<br />
3000<br />
10<br />
2000<br />
5<br />
1000<br />
0<br />
0<br />
11/5/01 3/10/02 7/13/02 11/15/02 3/20/03 7/23/03 11/25/03 3/29/04 8/1/04
Grass Direct Seed Mulch Till Conventional<br />
0.07 Tons/ac<br />
0.1 tons/ac<br />
0.9 tons/ac<br />
2.5 tons/ac<br />
614 Tons<br />
1100 tons<br />
10,000 tons<br />
24,000 tons<br />
Winter Wheat<br />
Spring Barley<br />
Spring Peas<br />
Rotation<br />
Sediment<br />
Delivery<br />
by<br />
Hillslope<br />
***30 year Averages
photo: Bill Dansert ISCC
Gully Plugs<br />
Severely eroded spots<br />
- Areas where on the average 75<br />
percent or more of the original surface<br />
layer has been lost from accelerated<br />
erosion. Typically 2 to 5 acres.<br />
Escarpments<br />
A relatively continuous <strong>and</strong> steep slope or<br />
cliff generally produced by erosion, but can<br />
be produced by faulting breaking the<br />
continuity of more gently sloping l<strong>and</strong><br />
surfaces. Exposed nonbedrock material is<br />
nonsoil or very shallow, poorly developed<br />
soil.
Sediment load: Yearly variations<br />
1000000.00<br />
100000.00<br />
Conv. WW-Barley-Pea<br />
Mulch WW-Barley-Pea<br />
Direct Seed WW-Barley-Pea<br />
Grass<br />
Total Sediment Load (Tons)<br />
10000.00<br />
1000.00<br />
100.00<br />
10.00<br />
1.00<br />
1977 1978 1979 1980 1981 1982 1983 1984
30 Year WEPP Simulated Sediment Load<br />
Rotation<br />
Tillage Practice<br />
Average<br />
(Tons)<br />
Median<br />
(Tons)<br />
WW-Barley-Pea Conventional 46,300 23,500<br />
WW-Barley-Pea Mulch 10,658 2,800<br />
WW-Barley-Pea Direct Seed 1,213 300<br />
WW-Barley Conventional 34,106 16,856<br />
WW-Barley Mulch 4,428 365<br />
WW-Barley Direct Seed 3,946 275<br />
WW-Pea Conventional 79,700 37,200<br />
WW-Pea Mulch 12,400 2,700<br />
WW-Pea Direct Seed 2,100 200<br />
Grass Grass 600 100
2003<br />
1977<br />
1979<br />
1981<br />
1983<br />
1985<br />
1987<br />
1989<br />
1991<br />
1993<br />
1995<br />
1997<br />
1999<br />
2001<br />
1975<br />
8<br />
7<br />
6<br />
5<br />
4<br />
3<br />
2<br />
1<br />
0<br />
Sediment load: Average <strong>and</strong> Median<br />
Mulch tillage Winter Wheat-Barley Rotation<br />
Average<br />
Median<br />
30 Year Average = 0.9 tons/ac<br />
30 Year Median = 0.01 tons/ac<br />
Sediment Delivered to Streams (tons/ac)
Sediment Load: Average <strong>and</strong> Median<br />
100%<br />
90%<br />
1998 Mulch Till WW-Barley-Pea<br />
Cumulative Percentage of Fields<br />
80%<br />
70%<br />
60%<br />
50%<br />
40%<br />
30%<br />
20%<br />
Median = 0.8 Tons/Field<br />
Average = 7.1 Tons/Field<br />
10%<br />
0%<br />
0 1 2 3 4 5 6 7 8 9 10<br />
Sediment Delivered to Streams (Tons/Field)
Load reduction efficiency: by field<br />
100%<br />
90%<br />
80%<br />
Cumulative Percent Load<br />
70%<br />
60%<br />
50%<br />
40%<br />
30%<br />
20%<br />
10%<br />
0%<br />
Grass<br />
NT WW-B-P<br />
NT WW-P<br />
NT WW-B<br />
MT WW-B<br />
MT WW-B-P<br />
MT WW-P<br />
CT WW-B<br />
CT WW-B-P<br />
CT WW-P<br />
0% 10% 20% 30% 40% 50% 60% 70% 80% 90% 100%<br />
Cumulative Percent of Fields
Load reduction efficiency: by area<br />
100%<br />
Cumulative Percent of 30 Year Average Load<br />
90%<br />
80%<br />
70%<br />
60%<br />
50%<br />
40%<br />
30%<br />
20%<br />
10%<br />
0%<br />
Grass<br />
NT WW-B-P<br />
NT WW-P<br />
NT WW-B<br />
MT WW-B<br />
MT WW-B-P<br />
MT WW-P<br />
CT WW-B<br />
CT WW-B-P<br />
CT WW-P<br />
0% 10% 20% 30% 40% 50% 60% 70% 80% 90% 100%<br />
Cumulative Percent Area
Optimization Model<br />
• To evaluate various options to achieve sediment<br />
reduction goals while optimizing the farm income<br />
• The objective function is to maximize the net<br />
returns subjected to constraints of l<strong>and</strong> availability<br />
<strong>and</strong> soil loss reduction:<br />
Max Π = ( PC<br />
* Y − C,<br />
F<br />
CC,<br />
F<br />
) X<br />
C,<br />
F<br />
C,<br />
F<br />
Subject to the constraints:<br />
Σ X<br />
C , F<br />
=<br />
C<br />
Σ eC<br />
, F<br />
X<br />
C , F<br />
L<br />
≤<br />
F<br />
E
Data<br />
• Operators provided crop/tillage/machinery/<br />
fertilizer/pesticide/harvest practices, BY<br />
FIELD<br />
• The yield data for the model were<br />
generated by using the CROPSYST<br />
simulation model<br />
• Sediment delivery was provided by the<br />
WEPP model
Optimization results<br />
Crop distribution<br />
<strong>Soil</strong> loss<br />
reduction<br />
(%)<br />
Area<br />
(ac)<br />
Variable<br />
profit<br />
($/ac)<br />
Rotations<br />
Wwheat<br />
(ac)<br />
Barley<br />
(ac)<br />
Lentil<br />
(ac)<br />
Peas<br />
(ac)<br />
CRP<br />
(ac)<br />
0<br />
4943<br />
142<br />
Rotation 2 & 3<br />
2471<br />
0<br />
2016<br />
461<br />
0<br />
10<br />
4943<br />
133<br />
Rotation 1, 2, 3 & 4<br />
2237<br />
9<br />
1772<br />
456<br />
469<br />
20<br />
4943<br />
131<br />
Rotation 1, 2, 3 & 4<br />
2178<br />
9<br />
1700<br />
468<br />
587<br />
30<br />
4943<br />
127<br />
Rotation 1, 2, 3 & 4<br />
2039<br />
9<br />
1562<br />
468<br />
865<br />
40<br />
4943<br />
124<br />
Rotation 1, 2, 3 & 4<br />
1913<br />
9<br />
1448<br />
461<br />
1128<br />
50<br />
4943<br />
119<br />
Rotation 1, 2, 3 & 4<br />
1837<br />
23<br />
1377<br />
438<br />
1268<br />
60<br />
4943<br />
118<br />
Rotation 1, 2, 3 & 4<br />
1837<br />
23<br />
1359<br />
456<br />
1311<br />
Rotations: 1 = CRP, 2 = Winter wheat-Peas, 3 = Winter wheat-Lentil, 4 = Winter wheat-Barley
Optimization results<br />
Net returns ($/ac) vs <strong>Soil</strong> loss reduction (%)<br />
Net returns ($/<br />
160<br />
140<br />
120<br />
100<br />
80<br />
60<br />
40<br />
20<br />
Variable profit ($/ac)<br />
0<br />
0 10 20 30 40 50 60<br />
<strong>Soil</strong> loss reduction (%)
0% Reduction 10% Reduction 30% Reduction 50% Reduction 60% Reduction<br />
0% CRP 9% CRP 18% CRP 26% CRP 27% CRP<br />
Optimization<br />
-maximize profit while reducing sediment load<br />
Available Options<br />
- Winter Wheat, Spring Wheat, Barley, Peas, Lentils, CRP<br />
- Mulch Tillage
0% Reduction 10% Reduction 30% Reduction 50% Reduction 60% Reduction<br />
Optimization<br />
-maximize profit while reducing sediment load<br />
Available Options<br />
- Winter Wheat, Spring Wheat, Barley, Peas, Lentils, CRP<br />
- Conventional Tillage, Mulch Tillage
Targeting Talking Points<br />
• How do we manage agricultural l<strong>and</strong>scapes:<br />
median conditions or w/ extreme events?<br />
• How to include non-agricultural effects when<br />
managing agricultural l<strong>and</strong>scapes?<br />
• How do l<strong>and</strong>owner/operator relationships affect<br />
our ability to manage agricultural l<strong>and</strong>scapes?<br />
• What level of cost-share is needed to<br />
adequately target ‘hot spots’ in the watershed?<br />
Thank you!


