Benchmarking Study Report ENG - 2004-2005 - AMFA
Benchmarking Study Report ENG - 2004-2005 - AMFA
Benchmarking Study Report ENG - 2004-2005 - AMFA

Create successful ePaper yourself
Turn your PDF publications into a flip-book with our unique Google optimized e-Paper software.
Authors: Nigar Pirmammadova (<strong>AMFA</strong>), Scott Gaul (MIX) 1<br />
May 2007<br />
The Azerbaijan <strong>Benchmarking</strong> Trends <strong>Report</strong> <strong>2004</strong>-<strong>2005</strong> has been prepared<br />
by the Azerbaijan Micro-finance Association (<strong>AMFA</strong>) with MIX<br />
Market, and co-financed by BP and its co-ventures in the Azeri-Chirag-<br />
Guneshli, Shahdeniz, Baku-Tbilisi-Ceyhan and South Caucasus Pipeline<br />
projects and UNDP Azerbaijan.<br />
Note: The views and ideas expressed in this report are those of the<br />
authors and do not necessarily reflect the views and ideas of the project<br />
sponsors.<br />
This trend report presents comparative performance of Azerbaijani<br />
Microfinance Institutions that have reported to MIX Market during<br />
last 2 consecutive years. Illustrated trend lines would allow MFI<br />
managers and board members to monitor their institution's performance<br />
on country scale. It is the second report in industry literature<br />
of Azerbaijan microfinance and should be useful for financial institutions,<br />
donor agencies and investors as well as the government and<br />
other interested parties.<br />
1<br />
ACKNOWLEDGMENTS: Nigar Pirmammadova is Finance Manager of <strong>AMFA</strong> and Scott Gaul is the Lead Analyst, Eastern<br />
Europe and Central Asia at MIX.<br />
<strong>AMFA</strong> is the Azerbaijan Micro-finance Association uniting 19 members. <strong>AMFA</strong> was founded in December 2001 and<br />
officially registered at the Ministry of Justice of Azerbaijan in November <strong>2004</strong>.<br />
40, Jafar Jabbarli Street, Caspian Business Center, 5th floor, Baku-AZ 1065, Azerbaijan<br />
Tel/Fax: (+994 12) 437 1645; 437 2339<br />
www.amfa.az<br />
While developing this report <strong>AMFA</strong> used data and tools provided by Microfinance Information eXchange (MIX). MIX provided<br />
<strong>AMFA</strong> with benchmarking databases and technology, the format for this report and editing support. ACDI/VOCA<br />
MBAEC Consultant Jerrold Smelcer has provided overall review and editing support.
Azerbaijan <strong>Benchmarking</strong> Trends <strong>Report</strong> <strong>2004</strong> - <strong>2005</strong> Prepared May 2007<br />
Executive Summary<br />
The microfinance sector in Azerbaijan experienced<br />
rapid development in <strong>2005</strong>. The outstanding<br />
portfolio of MFIs crossed $50 million<br />
USD in <strong>2005</strong> and has reached over $200 million<br />
USD by the time of this writing in early<br />
2007. The number of active borrowers reached<br />
60,000 in <strong>2005</strong>, then 86,000 by June 2006 and<br />
has now approached 167,000 in 2007. 1<br />
In<br />
order to look at the nature of this growth more<br />
concretely, this report explores performance<br />
changes in the microfinance sector of<br />
Azerbaijan from <strong>2004</strong> - <strong>2005</strong>. Although the<br />
accelerated growth has necessitated expansion<br />
into new regions, management has maintained<br />
efficiency and increased profitability. The flow<br />
of investor and donor funds to MFIs in<br />
Azerbaijan has also increased, supported by the<br />
high level of transparency within the sector and<br />
demonstrated most strongly by several MFIs<br />
which have carried out external rating evaluations.<br />
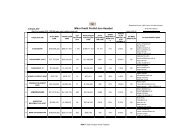
Five institutions - CredAgro NBCO,<br />
Findev, Viator LLC, Normicro and Azercredit -<br />
have been qualified on MIX Market with 5<br />
diamonds, the highest level. 2<br />
The rating reports<br />
confirm management's respect for financial<br />
transparency as MFIs grow, mature, and expand<br />
their products/services to harder to reach<br />
clients.<br />
The activity and growth experienced in<br />
Azerbaijan today is a direct reflection of<br />
effective management decisions made by MFIs<br />
during the <strong>2005</strong> year. All performance<br />
improved in each of the following areas:<br />
outreach/scale, financial structure, profitability/<br />
sustainability, revenue/expense, efficiency/productivity,<br />
and portfolio risk. MFIs improved<br />
loan distribution techniques, efficiently<br />
managed expenses, increased profits, attracted<br />
more investors and provided greater service to<br />
their clients. The following sections break down<br />
each ratio measurement category and<br />
summarizes the highlights.<br />
1<br />
As reported on 31 March, 2007.<br />
2<br />
www.mixmarket.org<br />
1
AZERBAIJAN BENCHMARKING TRENDS REPORT <strong>2004</strong> - <strong>2005</strong><br />
Outreach and Scale<br />
RATIO ANALYSIS<br />
The gross loan portfolio (GLP) of MFIs in<br />
Azerbaijan grew by 36.4%, which is also<br />
reflected in the increased number of borrowers<br />
and greater rural outreach. The GLP was<br />
$12,825,763 with 25,832 active clients in<br />
2003, increasing to $19,826,193 and 41,502<br />
active borrowers in <strong>2004</strong> and finally to a<br />
portfolio of $53,043,458 with 61,758 clients 3 in<br />
<strong>2005</strong>. Average loan balances remained roughly<br />
constant over the two years, increasing from<br />
$351 to $372 USD per borrower or from 37%<br />
to 39% of GNI per capital.<br />
Branches opened in 10 new regions, as<br />
revealed in the <strong>AMFA</strong> Matrix -- a report produced<br />
by <strong>AMFA</strong> that continuously updates MFI<br />
statistical information (number of clients,<br />
amount of outstanding loans, size of loans<br />
every quarter, etc.) for MFIs in Azerbaijan. The<br />
Financial Structure<br />
MFIs in Azerbaijan have gradually increased<br />
their access to debt financing and have<br />
leveraged this debt to fund their growth.<br />
Commercial lenders have provided additional<br />
loan capital to several MFIs, which allowed<br />
them to expand their field of activities<br />
accordingly. The median debt/equity ratio for<br />
Azerbaijani MFIs increased from 0.3 to 0.44 in<br />
<strong>2005</strong> - an increase of almost 50%, while the<br />
median commercial funding liabilities ratio<br />
Chart 1: Growth in microcredit portfolio in Azerbaijan<br />
Source: <strong>AMFA</strong> Matrix <strong>Report</strong>, <strong>2005</strong>.<br />
Matrix states that FINCA opened new branches<br />
in Xanlar and Hajiqabul; Micro Finance Bank of<br />
Azerbaijan opened branches in Ganja and<br />
Shamakhi; CredAgro opened branches in<br />
Agstafa, Shamkir and Bilasuvar; and Agroinvest<br />
opened branches in Masalli, Jalilabad and Saatli<br />
regions.<br />
increased from 1.2% in <strong>2004</strong>, to 8.7% in <strong>2005</strong>.<br />
This corresponds to a dollar increase in commercial<br />
debt outstanding from $2.2M USD to<br />
over $13.8M USD within the year <strong>2005</strong> alone.<br />
The ratio of overall gross loan portfolio to total<br />
assets increased by 5.2% year on year, to<br />
90.2% overall, as the maturing microfinance<br />
sector also began to allocate more assets to the<br />
credit portfolio.<br />
3<br />
The percent of women borrowers among the total number of clients increased by 6.1% in <strong>2005</strong> (Gender Ratio: female - 37%; male - 63%)<br />
2
AZERBAIJAN BENCHMARKING TRENDS REPORT <strong>2004</strong> - <strong>2005</strong><br />
Profitability and Sustainability<br />
Profitability & sustainability ratios measure<br />
the ability of an MFI to continue operations and<br />
develop in the future. The trend analysis<br />
indicates that all profitability and sustainability<br />
indicators improved in comparison with <strong>2004</strong>.<br />
However, overall profitability was still low as<br />
these rapidly growing institutions continued to<br />
expand operations, and the majority of institutions<br />
still had negative adjusted returns.<br />
Nevertheless, return on assets (ROA) and return<br />
on equity (ROE) each grew in <strong>2005</strong>. ROA<br />
increased from -4.6% in <strong>2004</strong> to -0.1% in<br />
<strong>2005</strong>, while ROE increased from -6.3% in <strong>2004</strong><br />
to -0.6% in <strong>2005</strong>. Moreover, <strong>2005</strong> marked the<br />
first time that self-sufficiency ratios reached<br />
levels above the breakeven point of 100%.<br />
Operational self-sufficiency (OSS) increased<br />
from 119.8% in <strong>2004</strong> to 129.7% in <strong>2005</strong>, while<br />
financial self-sufficiency (FSS) increased from<br />
81.3% in <strong>2004</strong> to 104.5% in <strong>2005</strong>. The<br />
increase in FSS reflects that <strong>2005</strong> is the first<br />
year in which the majority of Azerbaijan MFIs<br />
have been able to cover all adjusted financial,<br />
operating and provisioning costs.<br />
Revenue and Expenses<br />
Yield is an indicator of the ability of an MFI<br />
to generate revenue for operations from the<br />
gross loan portfolio (GLP). Yield levels also<br />
closely track the effective interest rates charged<br />
on credit by MFIs. In <strong>2005</strong>, nominal yields<br />
increased by 1.5%, to a median level of 34.5%,<br />
which may be due to the increased cost of<br />
commercial financing. However, after adjustments<br />
for inflation are made, real yields actually<br />
decreased by 1.8% year to year. Expenses<br />
Efficiency and Productivity<br />
also saw a slight overall decrease across the<br />
years <strong>2004</strong> - <strong>2005</strong>. Operating expenses,<br />
composed of personnel and administrative<br />
expenses, remained roughly constant while<br />
loan loss expenses decreased slightly. At the<br />
same time however, financial expenses saw a<br />
slight increase - from a median of 7.0% to 8.5%<br />
(of total assets). This reflects a higher cost of<br />
funding, again due to inflation and the<br />
increased presence of commercial lenders.<br />
Efficiency and productivity ratios indicate how<br />
well an MFI utilizes its resources, particularly in<br />
regards to assets and personnel. Operating<br />
expense/loan portfolio and personnel<br />
expense/loan portfolio both decreased during<br />
the year despite strong inflation, and this<br />
decrease can be partly explained by the small<br />
increase in loan balances. In terms of personnel<br />
capacity, borrowers per loan officer decreased<br />
from 174 in <strong>2004</strong> to 151 in <strong>2005</strong>, while borrowers<br />
per staff member increased from 84 in<br />
<strong>2004</strong> to 88 in <strong>2005</strong>. This could indicate that<br />
MFIs increased the number of loan officers to<br />
handle the increased lending and borrower<br />
volume, but kept the general staff levels steady.<br />
It could also reflect the increased presence of<br />
MFIs in more sparsely populated rural regions<br />
of Azerbaijan, with lower productivity levels at<br />
newer branches.<br />
3
AZERBAIJAN BENCHMARKING TRENDS REPORT <strong>2004</strong> - <strong>2005</strong><br />
Portfolio Quality<br />
In <strong>2005</strong>, all portfolio quality ratios improved in<br />
comparison with <strong>2004</strong> figures which is an indication<br />
that management is performing proper<br />
due diligence throughout the lending and collection<br />
process. In terms of ratio analysis, portfolio<br />
at risk (PAR) indicates the potential for<br />
future losses based on late payments from the<br />
gross loan portfolio. PAR > 30 days decreased<br />
from 1.2% in <strong>2004</strong> to 0.6% in <strong>2005</strong>; while PAR<br />
> 90 days decreased to 0.3%. In both cases,<br />
these levels are well below global medians. To<br />
complement the decline in PAR, the write-off<br />
ratio also decreased from 0.7% to 0.3% year on<br />
Summary<br />
This <strong>2005</strong> Performance Trend Analysis has<br />
revealed that improvements occurred in every<br />
measurement category for Azerbaijan MFIs<br />
since the last <strong>Benchmarking</strong> <strong>Report</strong> in <strong>2004</strong>.<br />
Indicators such as gross loan portfolio, number<br />
of active borrowers, yield on gross portfolio<br />
(real), profit margin, operational self-sufficiency,<br />
return on assets, portfolio at risk, write-offs, and<br />
the number of personnel each improved<br />
year. 4<br />
Risk coverage indicates an MFI's ability<br />
to absorb loan losses if all loans payments overdue<br />
by longer than 30 days were to be written<br />
off. A decline in the risk coverage ratio of<br />
26.2%, coupled with reduced loan loss provision<br />
expenses indicates that MFIs adopted less<br />
conservative provisioning policies to reflect the<br />
low delinquency levels. The reduction in PAR<br />
and write-offs helped alleviate the need to<br />
reserve capital for risk coverage, which gave<br />
management a greater ability to focus funds on<br />
operational issues.<br />
between <strong>2004</strong> and <strong>2005</strong>. Despite the fact that<br />
non-banking credit organizations were not<br />
allowed to accept deposits, 5<br />
management also<br />
strengthened outreach into more rural areas.<br />
<strong>2005</strong> was a year of change and accomplishments<br />
that helped provide the foundation on<br />
which the MFI community continues to build<br />
today.<br />
4<br />
MFI write-off policies in Azerbaijan are dependent on the individual MFI management or on Court decision.<br />
5<br />
The microfinance activities in Azerbaijan are regulated by the Civil Code and the Law on Banks and Banking Activities. Current legislation in<br />
Azerbaijan does not allow non-banking credit institutes to accept deposits or receive tax-exempt status. Therefore, deposit taking ratios are not<br />
provided in this report<br />
4
2 Performance Trend Analysis Azerbaijan<br />
6
Azerbaijan<br />
Performance Trend Analysis 3<br />
7
AZERBAIJAN BENCHMARKING TRENDS REPORT <strong>2004</strong> - <strong>2005</strong><br />
APPENDIX<br />
Inflation and Exchange Rate Indicators<br />
Inflation Rate Indicators<br />
Exchange Rates Indicators<br />
8