WHAT IS THE BEST MEASURE OF EMPLOYMENT AND ... - TARA
WHAT IS THE BEST MEASURE OF EMPLOYMENT AND ... - TARA
WHAT IS THE BEST MEASURE OF EMPLOYMENT AND ... - TARA

You also want an ePaper? Increase the reach of your titles
YUMPU automatically turns print PDFs into web optimized ePapers that Google loves.
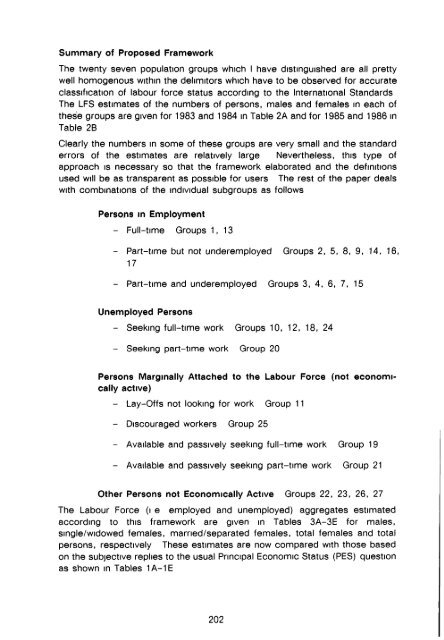
Summary of Proposed Framework<br />
The twenty seven population groups which I have distinguished are all pretty<br />
well homogenous within the dehmitors which have to be observed for accurate<br />
classification of labour force status according to the International Standards<br />
The LFS estimates of the numbers of persons, males and females in each of<br />
these groups are given for 1983 and 1984 in Table 2A and for 1985 and 1986 in<br />
Table 2B<br />
Clearly the numbers in some of these groups are very small and the standard<br />
errors of the estimates are relatively large Nevertheless, this type of<br />
approach is necessary so that the framework elaborated and the definitions<br />
used will be as transparent as possible for users The rest of the paper deals<br />
with combinations of the individual subgroups as follows<br />
Persons in Employment<br />
- Full-time Groups 1, 13<br />
- Part-time but not underemployed Groups 2, 5, 8, 9, 14, 16,<br />
17<br />
- Part-time and underemployed Groups 3, 4, 6, 7, 15<br />
Unemployed Persons<br />
- Seeking full-time work Groups 10, 12, 18, 24<br />
- Seeking part-time work Group 20<br />
Persons Marginally Attached to the Labour Force (not economically<br />
active)<br />
- Lay-Offs not looking for work Group 11<br />
- Discouraged workers Group 25<br />
- Available and passively seeking full-time work Group 19<br />
- Available and passively seeking part-time work Group 21<br />
Other Persons not Economically Active Groups 22, 23, 26, 27<br />
The Labour Force (i e employed and unemployed) aggregates estimated<br />
according to this framework are given in Tables 3A-3E for males,<br />
single/widowed females, married/separated females, total females and total<br />
persons, respectively These estimates are now compared with those based<br />
on the subjective replies to the usual Principal Economic Status (PES) question<br />
as shown in Tables 1A-1E<br />
202