
Create successful ePaper yourself
Turn your PDF publications into a flip-book with our unique Google optimized e-Paper software.
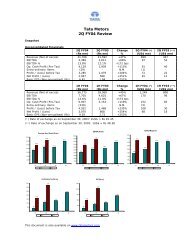
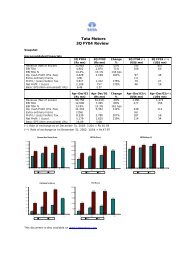
Distribution of Revenue<br />
(` in crores)<br />
<strong>2010</strong>-<strong>11</strong> 2009-10<br />
Depreciation, 1361 (2.60%)<br />
Interest, <strong>11</strong>44 (2.19%)<br />
Reserves, 345 (0.66%)<br />
Employees, 2294 (4.38%)<br />
Shareholders, 1274 (2.44%)<br />
Depreciation, 1034 (2.57%)<br />
Interest, <strong>11</strong>04 (2.74%)<br />
Reserves, 1248 (3.10%)<br />
Employees, 1836 (4.57%)<br />
Shareholders, 859 (2.14%)<br />
axes & Duties, 4749 (9.08%)<br />
Taxes & Duties, 3556 (8.84%)<br />
Operation & Other<br />
Expenses,<br />
5409 (10.34%)<br />
Operation & Other<br />
Expenses, 5069 (12.60%)<br />
Materials, 35743 (68.32%)<br />
Materials, 25512 (63.44%)<br />
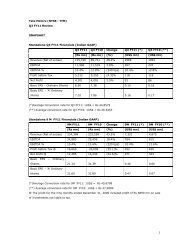
Sources of Revenue<br />
(` in crores)<br />
<strong>2010</strong>-<strong>11</strong> 2009-10<br />
Others, 1562 (2.98%)<br />
Dividend/Other Income, 183 (0.35%)<br />
Exports, 3406 (6.51%)<br />
Domestic Spare Part Sales,<br />
2620 (5.01%)<br />
Vehicle Financing, <strong>11</strong>5 (0.22%)<br />
Others, <strong>11</strong>08 (2.76%)<br />
Divedend/Other Income, 1853 (4.61%)<br />
Exports,1978 (4.92%)<br />
Domestic Spare Part Sales,<br />
2161 (5.37%)<br />
Vehicle Financing, 220 (0.55%)<br />
Domestic Vehicles Sales,<br />
44433 (84.93%)<br />
Domestic Vehicles Sales,<br />
32898 (81.80%)
Go Green Today<br />
As a responsible corporate citizen, the<br />
Company welcomes and supports the<br />
‘Green Initiative’ taken by the Ministry<br />
of Corporate Affairs, enabling the<br />
Company to effect electronic delivery<br />
of documents. The above initiative will<br />
go a long way in conserving paper<br />
which is a natural resource as also result<br />
in substantial savings on printing and<br />
posting of annual reports and other<br />
documents of your Company sent to<br />
shareholders.<br />
Members are requested to support<br />
this green initiative by updating their<br />
email addresses with the respective<br />
Depository Participants, in case of<br />
electronic shareholding; or registering<br />
their email addresses with the Company’s<br />
Registrar and Transfer Agents, in case of<br />
physical shareholding. Join this cause<br />
and make the world a cleaner, greener<br />
and healthier place to live.<br />
Board of Directors<br />
Contents<br />
Summarised Balance Sheet and Profit and Loss Account.<br />
Chairman’s Statement................................................................... 1<br />
Notice.................................................................................................. 5<br />
Directors' Report............................................................................. 10<br />
Management Discussion and Analysis.................................... 23<br />
Report on Corporate Governance............................................ 41<br />
Fund Flow Statement.................................................................... 58<br />
Standalone Accounts<br />
– Auditors’ Report........................................................................... 59<br />
– Balance Sheet............................................................................... 62<br />
– Profit and Loss Account............................................................. 63<br />
– Cash Flow Statement................................................................. 64<br />
– Schedules to Accounts.............................................................. 66<br />
– Significant Accounting Policies.............................................. 83<br />
– Notes to Accounts....................................................................... 86<br />
Balance Sheet Abstract and Company’s General<br />
Business Profile................................................................................ 104<br />
Annual General Meeting<br />
Date : Friday, August 12, 20<strong>11</strong><br />
Time : 3.00 p.m.<br />
Venue :<br />
Birla Matushri Sabhagar,<br />
19, Sir Vithaldas<br />
Thackersey Marg,<br />
Mumbai 400 020.<br />
Consolidated Accounts<br />
– Auditors’ Report........................................................................... 105<br />
– Balance Sheet............................................................................... 106<br />
– Profit and Loss Account............................................................. 107<br />
– Cash Flow Statement................................................................. 108<br />
– Schedules to Accounts.............................................................. <strong>11</strong>0<br />
– Significant Accounting Policies.............................................. <strong>11</strong>9<br />
– Notes to Accounts....................................................................... 124<br />
Subsidiary Companies: Financial Highlights <strong>2010</strong>-<strong>11</strong>........ 134<br />
Financial Statistics........................................................................... 136<br />
Awards................................................................................................ 138<br />
Attendance Slip/Proxy<br />
`1 crore = `10 million
Board of Directors<br />
Ratan N <strong>Tata</strong><br />
Chairman<br />
Ravi Kant<br />
Vice-Chairman<br />
N N Wadia<br />
S M Palia<br />
R A Mashelkar<br />
S Bhargava<br />
N Munjee<br />
V K Jairath<br />
R Sen<br />
Ralf Speth<br />
Carl-Peter Forster<br />
Managing Director & Group CEO<br />
P M Telang<br />
Managing Director – India operations<br />
Registered Office<br />
Bombay House<br />
24, Homi Mody Street<br />
Mumbai 400 001<br />
Tel: +91-22-6665 8282<br />
Fax: +91-22-6665 7799<br />
Email: inv_rel@tatamotors.com<br />
Website: www.tatamotors.com<br />
Works<br />
Jamshedpur, Pune, Lucknow,<br />
Pantnagar, Sanand<br />
Management Team<br />
Carl-Peter Forster, Managing Director & Group CEO<br />
P M Telang, Managing Director - India Operations<br />
C Ramakrishnan, Chief Financial Officer<br />
R Pisharody, President - Commercial Vehicles Business Unit<br />
T Leverton, Head, Advanced and Product Engineering<br />
S B Borwankar, Sr Vice President (Mfg Operations-CVBU)<br />
Prabir Jha, Sr Vice President (Human Resources)<br />
P Y Gurav, Sr Vice President (Corp Finance - Accts & Taxation)<br />
Girish Wagh, Head (Passenger Car Operations)<br />
S Ravishankar, Vice President (Engg Systems, ERC)<br />
B B Parekh, Chief (Strategic Sourcing)<br />
R Bhaskar, Plant Head -CVBU<br />
Vikram Sinha, Head (Car Plant - PCBU)<br />
A K Jindal, Head Engineering (Comm. Vehicles - ERC)<br />
R Ramakrishnan,Vice President (Commercial - PCBU)<br />
N Pinge, Vice President (Internal Audit)<br />
R Bagga, Vice President (Legal)<br />
A S Puri, Vice President (Govt Affairs & Collab)<br />
Company Secretary<br />
H K Sethna<br />
Share Registrars<br />
TSR Darashaw Limited<br />
6-10, Haji Moosa Patrawala Industrial Estate,<br />
20, Dr. E. Moses Road, Mahalaxmi, Mumbai-400 0<strong>11</strong><br />
Tel: +91-22-6656 8484; Fax: +91-22-6656 8494<br />
Email: csg-unit@tsrdarashaw.com<br />
Solicitors<br />
AZB & Partners; Mulla & Mulla & Craigie, Blunt & Caroe<br />
Auditors<br />
Deloitte Haskins & Sells (Registration No. <strong>11</strong>7366W)<br />
Bankers<br />
State Bank of India, Bank of America, Bank of Baroda, Bank<br />
of India, Bank of Maharashtra, Central Bank of India, Citibank<br />
N.A., Corporation Bank, Deutsche Bank, HDFC Bank, Hongkong<br />
and Shanghai Banking Corporation, ICICI Bank, Standard<br />
Chartered Bank, Union Bank of India, Punjab National Bank,<br />
Indian Bank, IDBI Bank, Karur Vysya Bank, Federal Bank, United<br />
Bank of India, Allahabad Bank, State Bank of Patiala, Andhra<br />
Bank, State Bank of Mysore, ING Vysya Bank<br />
Corporate Identity Number (CIN)<br />
L28920MH1945PLC004520
Summarised Balance Sheet<br />
(` in crores)<br />
Company<br />
<strong>Tata</strong> <strong>Motors</strong>’ Group<br />
WHAT THE COMPANY OWNED<br />
As at<br />
As at<br />
As at<br />
As at<br />
March 31,<br />
March 31,<br />
March 31,<br />
March 31,<br />
20<strong>11</strong><br />
<strong>2010</strong><br />
20<strong>11</strong><br />
<strong>2010</strong><br />
1. NET FIXED ASSETS 17,475.63 16,436.04 43,493.12 38,506.33<br />
2. GOODWILL - - 3,584.79 3,422.87<br />
3. INVESTMENTS 22,624.21 22,336.90 2,544.26 2,219.12<br />
4. DEFERRED TAX ASSETS (NET) - - 632.34 425.97<br />
5. FOREIGN CURRENCY MONETARY ITEM TRANSLATION<br />
DIFFERENCE ACCOUNT (NET)<br />
- 161.69 - -<br />
6. NET CURRENT ASSETS (2,164.63) (5,865.98) 4,051.10 724.81<br />
7. TOTAL ASSETS (NET) 37,935.21 33,068.65 54,305.61 45,299.10<br />
WHAT THE COMPANY OWED<br />
1. LOANS 15,898.75 16,594.54 32,791.41 35,108.36<br />
2. NET WORTH 20,013.30 14,965.47 19,171.47 8,206.48<br />
3. MINORITY INTEREST - - 246.60 213.51<br />
4. FOREIGN CURRENCY MONETARY ITEM TRANSLATION<br />
DIFFERENCE ACCOUNT (NET)<br />
- - - 191.15<br />
5. DEFERRED TAX LIABILITY (NET) 2,023.16 1,508.64 2,096.13 1,579.60<br />
6. TOTAL FUNDS EMPLOYED 37,935.21 33,068.65 54,305.61 45,299.10<br />
161
Sixty-sixth annual report <strong>2010</strong>-20<strong>11</strong><br />
<strong>Tata</strong> <strong>Motors</strong> Limited<br />
Summarised Profit and Loss Account<br />
Company<br />
(` in crores)<br />
<strong>Tata</strong> <strong>Motors</strong>’ Group<br />
<strong>2010</strong>-20<strong>11</strong> 2009-<strong>2010</strong> <strong>2010</strong>-20<strong>11</strong> 2009-<strong>2010</strong><br />
1. INCOME<br />
SALE OF PRODUCTS AND OTHER INCOME FROM<br />
OPERATIONS<br />
52,135.97 38,364.10 127,419.62 95,567.42<br />
LESS : EXCISE DUTY 4,095.51 2,771.05 4,286.32 3,048.17<br />
48,040.46 35,593.05 123,133.30 92,519.25<br />
DIVIDEND AND OTHER INCOME 183.26 1,853.45 89.61 1,793.12<br />
48,223.72 37,446.50 123,222.91 94,312.37<br />
2. EXPENDITURE<br />
RAW MATERIALS / COMPONENTS, MANUFACTURING AND<br />
OTHER EXPENSES<br />
40,975.13 29,578.64 96,010.66 75,153.32<br />
EMPLOYEE COST 2,294.02 1,836.13 9,342.67 8,751.77<br />
PRODUCT DEVELOPMENT EXPENDITURE 106.17 144.03 962.49 498.20<br />
DEPRECIATION / AMORTISATION 1,360.77 1,033.87 4,655.51 3,887.13<br />
INTEREST AND DISCOUNTING CHARGES 1,143.99 1,103.84 2,045.42 2,239.71<br />
EXCEPTIONAL ITEMS - LOSS / (GAIN) 147.12 920.45 (231.01) 259.60<br />
TOTAL EXPENDITURE 46,027.20 34,616.96 <strong>11</strong>2,785.74 90,789.73<br />
3. PROFIT BEFORE TAX 2,196.52 2,829.54 10,437.17 3,522.64<br />
4. TAX EXPENSE (384.70) (589.46) (1,216.38) (1,005.75)<br />
5. PROFIT AFTER TAX 1,8<strong>11</strong>.82 2,240.08 9,220.79 2,516.89<br />
6. SHARE OF MINORITY INTEREST - - (48.52) (30.33)<br />
7. SHARE OF PROFIT / (LOSS) IN RESPECT OF INVESTENTS IN<br />
ASSOCIATE COMPANIES - - 101.35 84.50<br />
8. PROFIT FOR THE YEAR 1,8<strong>11</strong>.82 2,240.08 9,273.62 2,571.06<br />
162 4
Chairman‘s Statement<br />
Dear Shareholder,<br />
In <strong>2010</strong>, the world as a whole continued on a path of moderate economic recovery, but with<br />
dramatic differences between major geographic regions.<br />
In the western hemisphere, the U.S. showed distinct signs of GDP growth at 2.8% in <strong>2010</strong>,<br />
although job levels and home mortgage figures did not improve. Western Europe and<br />
the U.K. were marginally positive at 2% and 1.3% respectively. In striking contrast, Asia<br />
registered a growth rate of 9.5% led by China and India at 10.3% and 8.5% respectively. In<br />
Latin America, Brazil registered a robust growth of 7.5% and South Africa registered a very<br />
respectable growth rate of 2.8%.<br />
The figures of growth and economic activity re-affirm that the hub of sustained economic<br />
growth has shifted from the developed nations in North America, Western Europe and the<br />
U.K., to the newly-developed and developing countries in Asia, Latin America and Africa,<br />
where the domestic market demand for goods and services is increasing, where the cost<br />
of skilled labor is low, and where newer production facilities are not burdened with high<br />
legacy costs. Further, the astronomical rise in natural resources has given some of the<br />
resource-rich nations in the developing world a new-found position of global dominance<br />
in sourcing to the developed manufacturers of the west. Whatever may be one’s future<br />
view, one would have to accept that investments in new technologies, manufacturing<br />
facilities and skills development will most likely be in that part of the world where large<br />
population-driven markets have developed, and that more and more highly competitive<br />
goods and services will emanate from such locations for export to the established markets<br />
of the developed world. As boundaries and barriers become less meaningful, skilled labor,<br />
research and development and supporting infrastructure will tend to be relocated in these<br />
new emerging locations in Asia and Latin America.<br />
1
Sixty-sixth annual report <strong>2010</strong>-20<strong>11</strong><br />
<strong>Tata</strong> <strong>Motors</strong> Limited<br />
A good example of these recent global shifts is the case of passenger cars. In 1955 the<br />
United States was undisputedly the largest manufacturer of automobiles. It produced<br />
7.1 million cars ~70% of world consumption. Detroit was the center for most important new<br />
automotive technologies in terms of new features, new materials, process and manufacturing<br />
innovations. By 1960, the U.S. ceded its technical dominance to the European carmakers<br />
which could develop and deliver more attractive cars of higher quality at competitive<br />
prices. By 1980, Japan and later South Korea became serious competitors to the Europeans<br />
and began to take a larger share of the U.S. market by producing more appealing, higher<br />
quality and technically innovative cars at competitive prices. The landscape in <strong>2010</strong> has<br />
dramatically changed again! China has emerged as the world’s largest automobile producer.<br />
Its production of 13.8 million cars in <strong>2010</strong> accounted for 24% of world production, surpassing<br />
the U.S., which produced only 2.7 million cars 1 – 5% of the world’s production. Further, China<br />
has emerged as the world’s largest domestic market for automobiles (In <strong>2010</strong> Chinese buyers<br />
bought about 18 million automobiles, against <strong>11</strong>.7 million bought in the U.S.). Even after the<br />
economic meltdown in 2009, China and India saw 45% and 26% growth respectively in their<br />
domestic automobile markets while Europe, U.K. and the U.S. automobile markets declined<br />
by 6%, <strong>11</strong>% and 21% respectively.<br />
The global automobile industry production in <strong>2010</strong> stood at about 58 million for passenger<br />
cars and about 19 million for commercial vehicles, registering a growth of about 22% and<br />
38% respectively over the previous year.<br />
<strong>Tata</strong> <strong>Motors</strong><br />
Commercial Vehicles – India<br />
Industry-wide sales of commercial vehicles in India during the year were 7,42,091 – a growth<br />
of 27.3% over the previous year.<br />
During the year, <strong>Tata</strong> Motor’s commercial vehicles sales achieved an all-time high of<br />
4,58,828 – registering a growth of 22.7% over the previous year and a market share of<br />
61%. Intermediate and heavy truck sales increased by 30% and several new models were<br />
introduced during the year. Sales of the Ace, the sub-one ton pick-up, grew 25% over the<br />
previous year and achieved the highest ever annual sales. The Company’s other commercial<br />
vehicles also achieved record sales during the year.<br />
1<br />
Passenger cars only (excluding SUVs, MPVs and light trucks)<br />
2
Passenger bus sales during the year also grew substantially, both diesel and CNG powered,<br />
and the Company’s new low-floor city buses have been exceedingly popular in the cities<br />
where they have been marketed.<br />
Passenger Cars – India<br />
In the passenger car segment, the industry registered sales of 24,66,814 passenger vehicles<br />
– a growth of 29.8% over the previous year.<br />
Sales levels at <strong>Tata</strong> <strong>Motors</strong> grew at only 23% – resulting in a market share decline of 0.7%.<br />
Initiatives are underway to revitalize the dealer network and improve market share. The total<br />
Company sales, since it entered the passenger car segment in 1999, crossed 2 million cars.<br />
The highest ever annual sales were achieved during the year. Nano sales crossed 1,00,000<br />
and the all-new crossover, Aria was launched in the second quarter.<br />
Total export sales of <strong>Tata</strong> <strong>Motors</strong> amounted to about 58,000 vehicles – an increase of 70%<br />
over the previous year.<br />
Jaguar Land Rover<br />
Sales of Jaguar cars and Land Rover/Range Rover vehicles have been extremely encouraging.<br />
During the year, Jaguar introduced the new XJ sedan and a new R-series – high performance<br />
versions of the XK sports and the XF sedan. Sales of Jaguar and Land Rover vehicles span<br />
140 countries, and their market appeal has been growing.<br />
Total wholesale sales of Jaguar cars during the year were about 53,000, registering a growth of<br />
<strong>11</strong>.8% over the previous year. Land Rover/Range Rover achieved wholesale sales of 1,90,628,<br />
registering a growth of 30.1% over the previous year. The new Evoque is proposed to be<br />
launched in the current year and has attracted a very positive reaction from the market.<br />
Assembly operations in India have commenced for the Land Rover Freelander. Assembly<br />
of other Land Rover products are also under consideration. To optimize the synergetic<br />
strengths between JLR and <strong>Tata</strong> <strong>Motors</strong> in India, an examination is also underway on a joint<br />
engine development program which would have manufacturing facilities both in the U.K.<br />
and India. The Company is also considering various options for assembly and localization of<br />
selected products in China, which has become an important market for the Company.<br />
Both <strong>Tata</strong> <strong>Motors</strong> in India and Jaguar Land Rover in the U.K. have extensive product<br />
development plans for cars, off-road vehicles and commercial vehicles, powered by regular<br />
and alternative fuels, as also electric and hybrid vehicles, to meet future fuel efficiency and<br />
low emission requirements.<br />
3
Sixty-sixth annual report <strong>2010</strong>-20<strong>11</strong><br />
<strong>Tata</strong> <strong>Motors</strong> Limited<br />
Looking Ahead<br />
While <strong>2010</strong>-<strong>11</strong> has been a year of high economic growth in Asia, the quarterly growth figures<br />
in China and India have been declining. Inflation rates have risen and the central banks in<br />
both countries have initiated measures to slow down their economies to curb inflation.<br />
The resulting high interest rates, tighter credit regimes and higher fuel costs will dampen<br />
consumer demand for a range of consumer products including automobiles.<br />
The quarterly growth figures in Asia have been declining during the year and it is expected<br />
that both China and India will register lower growth rates in 20<strong>11</strong>-12. There is therefore a<br />
likelihood of a general slowdown in industrial activity in Asia compared to the growth rates<br />
achieved over the past few years and possibly a noticeable drop in consumer demand for<br />
goods and services. Automobile sales have already started to decline in India. There has also<br />
been a decline in automobile sales in China for the first time in two years.<br />
The extent of an economic slowdown in Asia will depend on the severity of the antiinflationary<br />
measures adopted. Japan, which has been an industrial powerhouse for several<br />
decades, will be unbelievably burdened in the rebuilding of the country following the<br />
terrible devastation caused by the earthquake and tsunami earlier this year. While Japan will<br />
undoubtedly succeed in its enormous reconstruction task solely because of the national<br />
pride, dedication and discipline of its people, it is expected that Japan will register low<br />
figures of industrial growth.<br />
The health of the world economy in 2012 and beyond will depend more heavily on the<br />
economic health of Asia. Inflation is indeed a lurking enemy of healthy growth and needs to<br />
be controlled. Speculation in natural resources that have a significant impact on the entire<br />
value chain of industrial production also needs to be controlled. What should be of concern<br />
to all is the creation of a situation where the pendulum swings too far in the opposite<br />
direction, causing another global slowdown – this time, not based on over-valued assets<br />
but on self-imposed fiscal prudence. It is hoped that a realistic balance will be achieved<br />
in the Asian countries to ensure that these countries continue to be the drivers of growth,<br />
innovation and prosperity for millions of their people as also both sources and markets for<br />
the rest of the world.<br />
Mumbai, July 6, 20<strong>11</strong><br />
Chairman<br />
4
NOTICE<br />
NOTICE IS HEREBY GIVEN THAT THE SIXTY-SIXTH ANNUAL GENERAL MEETING OF TATA MOTORS LIMITED will be held on<br />
Friday, August 12, 20<strong>11</strong> at 3.00 p.m., at Birla Matushri Sabhagar, 19, Sir Vithaldas Thackersey Marg, Mumbai 400 020 to<br />
transact the following business:<br />
Ordinary Business<br />
1. To receive, consider and adopt the Audited Profit and Loss Account for the year ended March 31, 20<strong>11</strong> and the Balance<br />
Sheet as at that date together with the Reports of the Directors and the Auditors thereon.<br />
2. To declare a dividend on Ordinary Shares and ‘A’ Ordinary Shares.<br />
3. To appoint a Director in place of Mr Ravi Kant, who retires by rotation and is eligible for re-appointment.<br />
4. To appoint a Director in place of Mr N N Wadia, who retires by rotation and is eligible for re-appointment.<br />
5. To appoint a Director in place of Mr S M Palia, who retires by rotation and is eligible for re-appointment.<br />
6. To appoint Auditors and fix their remuneration.<br />
Special Business<br />
7. Appointment of Dr Ralf Speth as a Director<br />
To consider and, if thought fit, to pass with or without modification, if any, the following resolution as an Ordinary Resolution:<br />
“RESOLVED that Dr Ralf Speth who was appointed by the Board of Directors as an Additional Director of the Company<br />
with effect from November 10, <strong>2010</strong> and who holds office upto the date of this Annual General Meeting of the<br />
Company, in terms of Section 260 of the Companies Act, 1956 (‘the Act‘), but who is eligible for appointment and in<br />
respect of whom the Company has received a notice in writing from a Member under Section 257 of the Act proposing<br />
his candidature for the office of Director of the Company, be and is hereby appointed a Director of the Company whose<br />
office shall be liable to retirement by rotation.”<br />
8. Sub-division of Ordinary and ‘A’ Ordinary Shares of the Company<br />
To consider and, if thought fit, to pass with or without modification, if any, the following resolution as an Ordinary Resolution:<br />
“RESOLVED that subject to the provisions of Section 94 and other applicable provisions, if any, of the Companies Act,<br />
1956 (‘the Act‘) (including any statutory modification(s) or re-enactment thereof, for the time being in force) and<br />
Article 69 of Articles of Association of the Company and subject to the approvals, consents, permissions and sanctions<br />
as may be necessary from the concerned authorities or bodies, 70,00,00,000 Ordinary Shares and 20,00,00,000 ‘A’<br />
Ordinary Shares both having a face value of `10/- each in the Authorised Share Capital of the Company be sub-divided<br />
into 3,50,00,00,000 Ordinary Shares and 1,00,00,00,000 ‘A’ Ordinary Shares both of `2/- each and that 30,00,00,000<br />
Convertible Cumulative Preference Shares of `100/- each in the Authorised Share Capital of the Company would<br />
remain unchanged and that Clause V of the Memorandum of Association of the Company be altered accordingly.”<br />
“RESOLVED FURTHER that pursuant to the said sub-division the 53,83,22,483 Issued and Subscribed Ordinary Shares<br />
and 9,63,86,471 Issued and Subscribed ‘A’ Ordinary Shares, both having a face value of `10/- each, [hereinafter together<br />
referred to as the ‘Existing Share(s)’] shall stand sub-divided into 2,69,16,12,415 Ordinary Shares of the face value of `2/-<br />
each and 48,19,32,355 ‘A’ Ordinary Shares of the face value of `2/- each (hereinafter together referred to as ‘the Shares’).”<br />
“RESOLVED FURTHER that upon the said sub-division of the Existing Share certificate(s) in relation to the existing<br />
Ordinary and ‘A’ Ordinary Shares of the face value of `10/- each held in physical form shall be deemed to have been<br />
automatically cancelled and be of no effect on and from the Record Date fixed by the Board of Directors of the<br />
5
Sixty-sixth annual report <strong>2010</strong>-20<strong>11</strong><br />
<strong>Tata</strong> <strong>Motors</strong> Limited<br />
Company (hereinafter referred to as ‘the Board’, which term shall be deemed to include any Committee which the Board<br />
may constitute to exercise its powers, including powers conferred by this resolution) for this purpose and the Company<br />
may without requiring the surrender of the certificates for the Existing Shares, directly issue and dispatch new share<br />
certificates in lieu thereof, in accordance with the provisions of the Companies (Issue of Share Certificates) Rules, 1960<br />
and in the case of Existing Shares held in dematerialized form or in respect of Members who opt to receive the subdivided<br />
Shares in dematerialized form, the sub-divided Shares shall be credited to the respective beneficiary account<br />
of the Members with the Depository Participants.”<br />
“RESOLVED FURTHER THAT the Board be and is hereby authorized to take all such steps as may be necessary for<br />
obtaining such approvals, to execute all such documents, instruments and writings, to do all such acts, matters and<br />
things as may be required in this connection and to delegate all or any of the powers herein vested in the Board to<br />
give effect to the aforesaid resolution.”<br />
By Order of the Board of Directors<br />
Mumbai, May 26, 20<strong>11</strong><br />
Registered Office:<br />
Bombay House, 24, Homi Mody Street, Mumbai 400 001<br />
H K SETHNA<br />
Company Secretary<br />
Notes:<br />
a. The relative Explanatory Statement pursuant to Section 173 of the Companies Act, 1956 in respect of the business<br />
under Item Nos.7 and 8 set out above and details under Clause 49 of the Listing Agreement with the Stock Exchanges<br />
in respect of Directors seeking appointment/reappointment at this Annual General Meeting are annexed hereto.<br />
b. A MEMBER ENTITLED TO ATTEND AND VOTE IS ENTITLED TO APPOINT A PROXY TO ATTEND AND VOTE ON A POLL<br />
INSTEAD OF HIMSELF AND THE PROXY NEED NOT BE A MEMBER. The instrument appointing Proxy as per the format<br />
included in the Annual Report should be returned to the Registered Office of the Company not less than FORTY-EIGHT<br />
HOURS before the time for holding the Meeting. Proxies submitted on behalf of limited companies, societies, partnership<br />
firms, etc. must be supported by appropriate resolution /authority, as applicable, issued by the member organization.<br />
c. Corporate Members intending to send their authorised representatives to attend the meeting are requested to send<br />
to the Company, a certified copy of the Board Resolution authorising their representative to attend and vote in their<br />
behalf at the Meeting.<br />
d. Only registered Members (including the holders of ‘A’ Ordinary Shares) of the Company may attend and vote at the<br />
Annual General Meeting. The holders of the American Depositary Receipts (the ‘ADRs’) and Global Depositary Receipts<br />
(the ‘GDRs’) of the Company shall not be entitled to attend the said Annual General Meeting. However, the ADR holders<br />
are entitled to give instructions for exercise of voting rights at the said meeting through the Depositary, to give or<br />
withhold such consents, to receive such notice or to otherwise take action to exercise their rights with respect to such<br />
underlying shares represented by each such American Depositary Share. A brief statement as to the manner in which<br />
such voting instructions may be given is being sent to the ADR holders by the Depositary. The Depositary for the<br />
holders of the GDRs shall exercise voting rights in respect of the deposited shares by issue of an appropriate proxy or<br />
power of attorney in terms of the Deposit Agreement pertaining to the GDRs.<br />
In respect of ‘A’ Ordinary Shares, if any resolution at the meeting is put to vote by a show of hands, each ‘A’ Ordinary<br />
Shareholder shall be entitled to one vote, i.e., the same number of votes as available to holders of Ordinary Shares. If any<br />
resolution at the meeting is put to vote on a poll, or if any resolution is put to vote by postal ballot, each ‘A’ Ordinary<br />
Shareholder shall be entitled to one vote for every ten ‘A’ Ordinary Shares held.<br />
6
e. In case of joint holder attending the Meeting, only such joint holder who is higher in the order of names will be entitled<br />
to vote.<br />
f. The Register of Members and Transfer Books of the Company will be closed from Thursday, July 21, 20<strong>11</strong> to Friday,<br />
August 12, 20<strong>11</strong>, both days inclusive. If the dividend as recommended by the Board of Directors is approved at the<br />
Annual General Meeting, payment of such dividend will be made on or after August 16, 20<strong>11</strong> as under:<br />
i. To all Beneficial Owners in respect of shares held in electronic form, as per the data made available by the National<br />
Securities Depository Limited and the Central Depository Services (India) Limited, as of the close of business hours<br />
on July 20, 20<strong>11</strong>.<br />
ii. To all Members in respect of shares held in physical form, after giving effect to valid transfers in respect of transfer<br />
requests lodged with the Company on or before the close of business hours on July 20, 20<strong>11</strong>.<br />
iii. The ‘A’ Ordinary Shareholders will receive dividend for any financial year at five percentage points more than the<br />
aggregate rate of dividend declared on Ordinary Shares for that financial year.<br />
g. To avoid loss of dividend warrants in transit and undue delay in respect of receipt of dividend warrants, the Company<br />
has provided a facility to the Members for remittance of dividend through the National Electronic Clearing System<br />
(NECS). NECS essentially operates on the new and unique bank account number allotted by banks post implementation<br />
of Core Banking Solutions (CBS) for centralized processing of inward instructions and efficiency in handling bulk<br />
transactions. The NECS facility is available at locations identified by Reserve Bank of India from time to time and<br />
covers most of the cities and towns. Members holding shares in physical form and desirous of availing this facility are<br />
requested to contact the Company’s Registrars and Transfer Agents.<br />
h. Members holding shares in dematerialised mode are requested to intimate all changes pertaining to their bank<br />
details, NECS, mandates, nominations, power of attorney, change of address/name, PAN details, etc. to their Depository<br />
Participant only and not to the Company’s Registrars and Transfer Agents. Changes intimated to the Depository<br />
Participant will then be automatically reflected in the Company’s records which will help the Company and its<br />
Registrars and Transfer Agents to provide efficient and better service to the Members.<br />
i. As per Securities and Exchange Board of India (SEBI) notification, submission of Permanent Account Number (PAN)<br />
is compulsorily required for participating in the securities market, deletion of name of deceased shareholder or<br />
transmission/transposition of shares. Members holding shares in dematerialised mode are requested to submit the PAN<br />
details to their Depository Participant, whereas Members holding shares in physical form are requested to submit the<br />
PAN details to the Company’s Registrars and Transfer Agents.<br />
j. Members’ attention is particularly drawn to the “Corporate Governance” section in respect of unclaimed and unpaid<br />
dividends.<br />
k. Members desiring any information as regards the Accounts are requested to write to the Company at an early date so<br />
as to enable the Management to keep the information ready at the Meeting.<br />
l. As an austerity measure, copies of the Annual Report will not be distributed at the Annual General Meeting. Members<br />
are requested to bring their attendance slip alongwith a copy of Annual Report to the Meeting.<br />
7
Sixty-sixth annual report <strong>2010</strong>-20<strong>11</strong><br />
<strong>Tata</strong> <strong>Motors</strong> Limited<br />
8<br />
Explanatory Statement<br />
The following Explanatory Statement, pursuant to Section 173 of the Companies Act, 1956 (‘the Act’), sets out all material<br />
facts relating to the business mentioned at Item Nos. 7 and 8 of the accompanying Notice dated May 26, 20<strong>11</strong>.<br />
Item No. 7: The Board of Directors (‘the Board’) appointed Dr Ralf Speth as an Additional Director of the Company with<br />
effect from November 10, <strong>2010</strong>, pursuant to Section 260 of the Act and Article 132 of the Articles of Association of the<br />
Company. Under Section 260 of the Act, Dr Speth ceases to hold office at this Annual General Meeting but is eligible for<br />
appointment as a Director. Notice under Section 257 of the Act has been received from a Member signifying his intention<br />
to propose Dr Speth’s appointment as a Director.<br />
Dr Speth holds a Doctorate of Engineering in Mechanical Engineering and Business Administration from Warwick University.<br />
He also holds a Degree in Engineering from Rosenheim University, Germany. Dr Speth worked as a Business Consultant for<br />
a number of years before joining BMW in 1980. Having served BMW for 20 years, Dr Speth joined Ford Motor Company's<br />
Premier Automotive Group as Director of Production, Quality and Product Planning. Prior to this appointment, Dr Speth<br />
was Head of Global Operations at the International Industrial Gases and Engineering Company, The Linde Group, having<br />
joined the company as Vice President of Operations in 2002. Dr Speth joined Jaguar Land Rover as CEO and Director w.e.f.<br />
February 19, <strong>2010</strong> and is also the Chairman and CEO of Jaguar Cars Limited and Land Rover Limited. Brief information of<br />
Dr Speth is given in the Annexure attached to the Notice.<br />
The Board considers it desirable that the Company should continue to avail of the services of Dr Speth and accordingly<br />
commends the Resolution at Item No.7 for approval by the Members.<br />
Dr Speth is concerned or interested in Item No.7 of the Notice.<br />
Item No. 8: The Company’s Ordinary Shares (OS) and ‘A’ Ordinary Shares (AOS) (collectively ‘the Shares’) are actively traded<br />
on the Bombay Stock Exchange Limited (BSE) and the National Stock Exchange of India Limited (NSE). Over the last few<br />
years, there has been a sharp rise in the market price of the Company’s OS and AOS and are currently quoted at `<strong>11</strong>33.80<br />
and `630.25 respectively. In view of the above, the number of shareholders have also dropped.<br />
With the objective of bringing about greater liquidity and increasing the shareholder base by rekindling retail interest<br />
in the Company’s Shares, the Board of Directors of the Company (‘the Board’) at its meeting held on May 26, 20<strong>11</strong> have<br />
proposed to sub-divide the Shares which currently have a face value of `10/- to face value of `2/- per share. Accordingly, the<br />
present Issued and Subscribed Capital of the Company of `5,38,32,24,830/- divided into 53,83,22,483 OS of `10/- each and<br />
`96,38,64,710/- divided into 9,63,86,471 AOS of `10/- each shall stand sub-divided into 2,69,16,12,415 OS and 48,19,32,355<br />
AOS, both of face value of `2/- each. Consequently, the Authorized Share Capital of the Company shall get sub-divided<br />
as explained in the above resolution at item No.8 of the Notice. 30,00,00,000 Convertible Cumulative Preference Shares of<br />
`100/- each in the Authorised Share Capital of the Company remained unchanged.<br />
The Record Date for the aforesaid sub-division will be fixed by the Company after obtaining the shareholders’ approval,<br />
which will be notified through the Stock Exchanges. The proposed sub-division of the face value of the shares of the<br />
Company from `10/- per share to `2/- per share requires an amendment to the Memorandum of Association of the<br />
Company. Accordingly, Clause V of the Memorandum of Association of the Company is proposed to be altered to reflect<br />
the alteration in the Authorised Share Capital of the Company. The Articles of Association of the Company state that the<br />
capital of the Company is as reflected in Clause V of Memorandum of Association from time to time and hence, does not<br />
need an alteration.<br />
The ADSs and GDSs of the Company which currently represent 1 underlying OS of `10/- each would after the said<br />
sub-division continue to have a face value of `10/- each but would represent 5 underlying OS of `2/- each. Further, the<br />
conversion price for the Company’s current outstanding 4% Convertible Notes due 2014 aggregating US$375 million and<br />
Zero Coupon Convertible Alternative Reference Securities due 2012 aggregating US$473 million would be re-set as per<br />
the terms of issue of FCCNs.<br />
The consent of the Members is being sought in accordance with the provisions of Section 94 and other applicable<br />
provisions of the Act and Article 69 of Articles of Association of the Company.
A copy of the Memorandum and Articles of Association of the Company, together with the proposed alterations, is open<br />
for inspection by the Members of the Company at the Registered Office of the Company between 10.00 a.m. and 12 noon<br />
on all working days of the Company excluding Saturdays and holidays.<br />
Directors are concerned or interested in the resolution at Item No. 8 of the Notice upto the extent of their respective<br />
shareholding in the Company or to the extent of the shareholdings of the companies / institutions / trusts of which they<br />
are directors or members or trustees without any beneficial interest.<br />
By Order of the Board of Directors<br />
Mumbai, May 26, 20<strong>11</strong><br />
Registered Office:<br />
Bombay House, 24, Homi Mody Street, Mumbai 400 001<br />
H K SETHNA<br />
Company Secretary<br />
Details of Directors retiring by rotation seeking re-election and appointment of Directors at this Annual General Meeting:<br />
Particulars Mr Ravi Kant Mr N N Wadia Mr Sam Palia Dr Ralf Speth<br />
Date of Birth June 1, 1944 February 15, 1944 April 25, 1938 September 9, 1955<br />
Appointed on July 12, 2000 December 22, 1998 May 19, 2006 November 10, <strong>2010</strong><br />
Qualifications<br />
B.Tech. (Hons), M.Sc., Aston,<br />
D.Sc. (Hon.), Aston<br />
Educated in UK<br />
B.Com., LLB, CAIIB, AIB<br />
(London)<br />
Doctorate of Engineering<br />
in Mechanical Engineering<br />
and Business Administration<br />
Expertise in specific functional<br />
areas<br />
Wide experience in business<br />
and industry.<br />
Industrialist with rich<br />
business experience in<br />
general.<br />
Rich experience in the field<br />
of finance and development<br />
banking.<br />
Wide experience in areas<br />
of production, quality and<br />
product planning.<br />
Directorships held<br />
in other Public<br />
companies<br />
(excluding foreign<br />
and private<br />
companies)<br />
• TAL Manufacturing<br />
Solutions Ltd. – Chairman<br />
• <strong>Tata</strong> Advanced Materials<br />
Ltd. – Chairman<br />
• <strong>Tata</strong> Industries Ltd.<br />
• Telco Construction<br />
Equipment Co. Ltd.-<br />
Chairman<br />
• Voltas Ltd.<br />
• Britannia Industries Ltd. –<br />
Chairman<br />
• Gherzi Eastern Ltd.<br />
• <strong>Tata</strong> Chemicals Ltd.<br />
• <strong>Tata</strong> Steel Ltd.<br />
• The Bombay Burmah<br />
Trading Corp. Ltd. –<br />
Chairman<br />
• The Bombay Dyeing &<br />
Mfg. Co. Ltd. – Chairman<br />
• ACC Ltd.<br />
• AI Champdany Industries<br />
Ltd.<br />
• GRUH Finance Ltd.<br />
• Saline Area Vitalisation<br />
Enterprises Ltd.<br />
• <strong>Tata</strong> Steel Ltd.<br />
• The Bombay Dyeing &<br />
Mfg. Co. Ltd.<br />
NIL<br />
• Go Airlines (India) Ltd. –<br />
Chairman<br />
Memberships / Chairmanships<br />
of committees across<br />
public companies<br />
Investors’ Grievance<br />
• <strong>Tata</strong> <strong>Motors</strong> Ltd.<br />
NIL<br />
Audit<br />
• <strong>Tata</strong> <strong>Motors</strong> Ltd.<br />
• ACC Ltd.<br />
NIL<br />
• GRUH Finance Ltd.<br />
• <strong>Tata</strong> Steel Ltd.<br />
• The Bombay Dyeing &<br />
Mfg. Co. Ltd.<br />
Investors’ Grievance<br />
• <strong>Tata</strong> <strong>Motors</strong> Ltd.<br />
Shareholding NIL NIL 300 Ordinary Shares NIL<br />
9
Sixty-sixth annual report <strong>2010</strong>-20<strong>11</strong><br />
<strong>Tata</strong> <strong>Motors</strong> Limited<br />
DIRECTORS’ REPORT<br />
TO THE MEMBERS OF TATA MOTORS LIMITED<br />
The Directors present their Sixty-Sixth Annual Report and the Audited Statement of Accounts for the year ended March 31, 20<strong>11</strong>.<br />
FINANCIAL PERFORMANCE SUMMARY<br />
(` in crores)<br />
Company<br />
(Standalone)<br />
<strong>Tata</strong> <strong>Motors</strong> Group<br />
(Consolidated)<br />
<strong>2010</strong>-<strong>11</strong> 2009-10 <strong>2010</strong>-<strong>11</strong> 2009-10<br />
A FINANCIAL RESULTS<br />
(i) Gross Revenue 52,135.97 38,364.10 1,27,419.62 95,567.42<br />
(ii) Net Revenue (excluding excise duty) 48,040.46 35,593.05 1,23,133.30 92,519.25<br />
(iii) Total Expenditure 43,269.15 31,414.77 1,05,353.33 83,905.09<br />
(iv) Operating Profit 4,771.31 4,178.28 17,779.97 8,614.16<br />
(v) Other Income 183.26 1,853.45 89.61 1,793.12<br />
(vi) Profit before Interest, Depreciation, Amortization, Exceptional item & 4,954.57 6,031.73 17,869.58 10,407.28<br />
Tax<br />
(vii) Interest and Discounting Charges (net) 1,143.99 1,103.84 2,045.42 2,239.71<br />
(viii) Cash Profit 3,810.58 4,927.89 15,824.16 8,167.57<br />
(ix) Depreciation, Amortization & Product Development Expenses 1,466.94 1,177.90 5,618.00 4,385.33<br />
(x) Profit for the year before exceptional items & Tax 2,343.64 3,749.99 10,206.16 3,782.24<br />
(xi) Exceptional items - Loss/(Gain) 147.12 920.45 (231.01) 259.60<br />
(xii) Profit Before Tax 2,196.52 2,829.54 10,437.17 3,522.64<br />
(xiii) Tax Expense 384.70 589.46 1,216.38 1,005.75<br />
(xiv) Profit After Tax 1,8<strong>11</strong>.82 2,240.08 9,220.79 2,516.89<br />
(xv) Share of Minority Interest and Share of Profit in respect of investments<br />
- - 52.83 54.17<br />
in associate companies<br />
(xvi) Profit for the year 1,8<strong>11</strong>.82 2,240.08 9,273.62 2,571.06<br />
(xvii) Balance Brought Forward from Previous Year – Profit/(Loss) 1,934.13 1,685.99 (1,017.85) (1,553.66)<br />
(xviii) Amount Available for Appropriations 3,745.95 3,926.07 8,255.77 1,017.40<br />
B APPROPRIATIONS<br />
(a) Debenture Redemption Reserve - 500.00 - 500.00<br />
(b) General Reserve 200.00 500.00 228.78 520.32<br />
(c) Other Reserves - - 84.20 13.08<br />
(d) Dividend (including tax) 1,467.03 991.94 1,481.30 1,001.85<br />
(e) Balance carried to Balance Sheet 2,078.92 1,934.13 6,461.49 (1,017.85)<br />
DIVIDEND<br />
Considering the Company’s financial performance, the Directors have recommended a dividend of `20/- per share on the increased<br />
capital of 53,83,22,483 Ordinary Shares of `10/- each (previous year: `15/- per share) and `20.50 per share on 9,63,86,471 'A' Ordinary<br />
Shares of `10/- each (previous year: `15.50 per share) fully paid-up and any further Ordinary Shares and/or ‘A’ Ordinary Shares that may<br />
be allotted by the Company prior to July 21, 20<strong>11</strong> (being the book closure date for the purpose of the said dividend entitlement) for<br />
<strong>2010</strong>-<strong>11</strong> and will be paid on or after August 16, 20<strong>11</strong>. The said dividend, if approved by the Members, would involve a cash outflow<br />
of `1,467.03 crores (previous year: `991.94 crores) resulting in a payout of 81% (previous year: 44%) of the standalone profits of the<br />
Company.<br />
10
OPERATING RESULTS AND PROFITS<br />
After a good year 2009-10 during which economies across the world showed signs of recovery, the economic conditions globally<br />
continued to be strong and positive in <strong>2010</strong>-<strong>11</strong>, resulting in a strong growth for the automotive sector. The Indian economy continued<br />
to do well, driven by a good performance from the agricultural and the industrial sector with a GDP growth of 8.6%. The automotive<br />
sector recorded a growth of over 26% in India on the back of a robust economy.<br />
Supported by its strong distinct product offerings in both the commercial vehicle and passenger vehicle ranges, the Company recorded<br />
a turnover of `52,136 crores, a growth of 35.9% over the previous year. While the Company maintained a strong focus on cost control<br />
and market pricing, the increase in raw -material cost and fixed marketing expenses resulted in a lower EBITDA margin of 9.9% as<br />
compared to <strong>11</strong>.7% in the previous year. The Profit Before Tax and Profit After Tax for <strong>2010</strong>-<strong>11</strong> was `2,197 crores and `1,812 crores<br />
respectively, as compared to `2,830 crores and `2,240 crores in the previous year. It may be noted that the previous year profit included<br />
a net positive impact of `958 crores, mainly on account of profit on certain divestments which was partly set off by a loss on redemption<br />
of preference shares in a subsidiary company.<br />
Jaguar Land Rover results for <strong>2010</strong>-<strong>11</strong> showed a significant improvement with increase, both in volumes and revenue, better product<br />
mix, favourable exchange rates and higher margins. The introduction of the new Jaguar XJ, growing momentum of the Range Rover<br />
and Range Rover Sport and, in particular, the strengthening of the Jaguar Land Rover business in China, where it opened a National<br />
Sales Company (NSC) in mid <strong>2010</strong>, were the main drivers. In addition, Jaguar Land Rover continued to benefit from cost efficiencies and<br />
effective cash management initiatives adopted in response to the challenging operating conditions in 2008 and 2009.<br />
As the global markets recovered coupled with a strong focus on product and market initiatives, particularly at jaguar and Land Rover,<br />
the <strong>Tata</strong> <strong>Motors</strong> Group turnover in <strong>2010</strong>-<strong>11</strong> grew by 33.1% to `1,23,133 crores. <strong>Tata</strong> <strong>Motors</strong> Group recorded its highest ever Consolidated<br />
Profit Before Tax of `10,437 crores (`3,523 crores in 2009-10) and the Consolidated Profit for the Year of `9,274 crores (`2,571 crores in<br />
2009-10).<br />
VEHICLE SALES AND MARKET SHARES<br />
The overall <strong>Tata</strong> <strong>Motors</strong> Group sales at 10,80,994 vehicles crossed the 1 million mark in <strong>2010</strong>-<strong>11</strong>, higher by 24.2% compared to the<br />
previous year. Global sales of all commercial vehicles were at 5,12,731 units, while global sales of all passenger vehicles were at 5,68,263<br />
units.<br />
The Company recorded sale of 7,78,540 vehicles in <strong>2010</strong>-<strong>11</strong>, a growth of 22.8% over the previous year in the Indian domestic market<br />
representing a 24.3% market share in the Indian industry. It exported 58,089 vehicles from India, a growth of 70.3% over the previous<br />
year.<br />
The Company increased its commercial vehicle sales in the Indian market to an all time high of 4,58,828 vehicles in <strong>2010</strong>-<strong>11</strong>, representing<br />
a market share of 61.8%. A strong product portfolio, improved reach and penetration in the market and focus on customer oriented<br />
initiatives including finance enablement, ensured a 22.7% growth in commercial vehicle sales. Some of the key highlights were:<br />
- The Company crossed the 4 million cumulative vehicle sales mark for its commercial vehicles.<br />
- Sale of M&HCVs grew by 26.7% to 1,96,651 vehicles representing a market share of 60.1%. The Company continued to focus on<br />
customer centric initiatives, improved the sales of the Prima, and launched product variants to strengthen its product offerings. The<br />
Company introduced its CNG Hybrid city bus range and showcased it at the Commonwealth Games in Delhi.<br />
- Sale of LCVs grew by 19.9% to 2,62,177 vehicles representing a market share of 63.2%. The new products launched such as the Ace<br />
EX, Super Ace and 407 Pickup helped increase the sales. With competition entering the small commercial vehicles’ segment, the<br />
market share in the segment was lower as against last year.<br />
The Company’s sales of passenger vehicles in the Indian market (inclusive of <strong>Tata</strong>, Fiat and Jaguar Land Rover brands) were at its highest<br />
ever at 3,19,712 vehicles, representing a market share of 13.0% in <strong>2010</strong>-<strong>11</strong>. The competition in the passenger car market continued to<br />
<strong>11</strong>
Sixty-sixth annual report <strong>2010</strong>-20<strong>11</strong><br />
<strong>Tata</strong> <strong>Motors</strong> Limited<br />
increase with more international Automobile manufacturers entering the market with a variety of product offerings. Some of the key<br />
highlights were:<br />
- The Company crossed the 2 million cumulative vehicle sales mark for its passenger vehicles.<br />
- In June <strong>2010</strong>, the Sanand plant for the production of the Nano was inaugurated. The Company completed delivery on the bookings<br />
of the Nano and opened sales in various States in a phased manner. Nano sales increased to 70,431 vehicles, a growth of 129%<br />
from 30,763 vehicles in the previous year. The Company focused on increasing the reach and penetration for the Nano and also<br />
financing enablement for potential customer segments. The Nano bagged the gold prize in the Best New Product segment under<br />
the transportation category at the <strong>2010</strong> Edison Award, symbolizing persistence and excellence personified as also the world’s oldest<br />
and coveted international award for ‘Good Design’ in <strong>2010</strong> conferred by the Chicago Athenaeum: Museum of Architecture and<br />
Design together with the European Centre for Architecture Art Design and Urban Studies in the category of transportation.<br />
- The sales in the Small Car segment (comprising the Nano, the Indica and the Vista) increased to 1,80,091 vehicles, a growth of 13.9%<br />
representing a market share of <strong>11</strong>.7%.<br />
- The Indigo and the Indigo Manza sales were 87,919 vehicles. The Indigo eCS and the Indigo Manza Elan variants launched in the<br />
year were well received in the market and improved the Company’s market share in the mid-size segment to 25.8% (after taking<br />
Jaguar).<br />
- In the Multi Utility Vehicles (MUV) segment, the Company sold 42,741 (including Land Rovers) vehicles, a growth of 27.0% mainly<br />
boosted by sales of the Safari. The Aria - a premium crossover and the Venture - a multi-purpose vehicle in this segment launched<br />
during the year facilitated improvement in market share which stood at 13.2%.<br />
- The Fiat sales were 20,342 vehicles representing a market share of 0.8% - with sales of the 8,536 Lineas and <strong>11</strong>,806 Grande<br />
Puntos.<br />
- The Company sold 889 vehicles from the Jaguar Land Rover range in India and widened its dealership network. It also began<br />
working on the local assembly for the Jaguar Land Rover range in Pune which has since been operational from May 20<strong>11</strong>.<br />
- Assisted by a recovery from the economic crisis in its key markets and a renewed focus on exports, the Company’s International<br />
Business grew by 70.3%. The Company exported 50,244 commercial vehicles, a growth of 80.2% and 7,845 passenger vehicles, a<br />
growth of 25.9% as compared to the previous year. The Company continues to keenly focus on international markets and expects to<br />
launch its new product range in many of these markets. An assembly plant in South Africa is being set up and is expected to start<br />
production next year.<br />
Jaguar Land Rover sold 2,43,621 vehicles in <strong>2010</strong>-<strong>11</strong> registering a growth of 25.6% with sales of 52,993 Jaguars - a growth of <strong>11</strong>.8% and<br />
1,90,628 Land Rovers - a growth of 30.06% over the previous year. Jaguar Land Rover’s major international markets (U.S., U.K., China and<br />
Germany) continued to do well and boosted sales of the Jaguar Land Rover range. The new Jaguar XJ, deliveries of which started in the<br />
year, contributed significantly to the growth of the Jaguar brand. Jaguar Land Rover also displayed the Jaguar C-X75 at the Paris Motor<br />
Show and launched the all new XKR-S Jaguar at the Geneva Motor Show which received rave reviews. The Range Rover - Evoque<br />
displayed at various auto shows and planned for launch early next year, received rave accolades and is expected to translate the brand<br />
identity of Range Rover so as to include small and very relevant products without diminishing its brand value. Jaguar and Land Rover<br />
received more than 80 international awards for its vehicles during <strong>2010</strong>, which were shared equally between the two iconic brands.<br />
Jaguar Land Rover retail volumes in the U.K. totalled 58,134, a 1.9% increase over the previous year whilst the retail volumes in the North<br />
America totalled 50,280 with Jaguar and Land Rover volumes growing by 14.8% and 22.9% respectively over the previous year. Retail<br />
volumes in key growth markets grew significantly with China at 28,893 and Russia at <strong>11</strong>,689, higher by 69.9% and 32.4% respectively,<br />
over the previous year. There was moderate growth in Europe of 6.2% resulting in retail volumes of 53,7<strong>11</strong> and across all other markets<br />
of 38,198 representing a 15.7% growth over the previous year. Market Share of Jaguar Land Rover in U.K., U.S., Europe, Russia and China<br />
were also either maintained or marginally improved.<br />
12
<strong>Tata</strong> Daewoo Commercial Vehicle (TDCV) sales were stagnant at 8,748 vehicles as compared to 8,769 vehicles in the previous year.<br />
The financial instability of its sole distributor in its domestic market in the previous year brought new challenges and opportunities.<br />
TDCV started its own sales company to distribute its products in the Korean market and also launched the Euro V compliant range of<br />
products.<br />
<strong>Tata</strong> Hispano <strong>Motors</strong> Carrocera, S.A. sold 505 vehicles as compared to 248 units in the previous year, increasing its market share to 13%<br />
from 8% in the previous year. It won a prestigious order for supplying around 500 buses in the next 3 years to the Avanza Group, one of<br />
the largest private passenger transportation groups in Spain.<br />
<strong>Tata</strong> <strong>Motors</strong> Thailand (TMTL) continued to do well with sales of 6,031 vehicles against 2,536 vehicles in the previous year. The growth<br />
was driven by a good response to the Xenon CNG model. TMTL also launched the Super Ace in the Thailand market.<br />
CUSTOMER FINANCING INITIATIVES<br />
The vehicle financing activity in India under the brand ”<strong>Tata</strong> MotorFinance” (TMF) of <strong>Tata</strong> <strong>Motors</strong> Finance Limited - a wholly owned<br />
subsidiary company, has shown improvements in disbursements as well as net interest margins, driven mainly by the overall economic<br />
recovery coupled with a strong focus by TMF on controlling costs, improving quality of fresh acquisitions and micro-management of<br />
collections. TMF financed 1,60,781 vehicles during the year as compared to 1,44,806 vehicles in the previous year. Total disbursements<br />
at `7,908 crores grew by 18% as against `6,697 crores in the previous year. The disbursals for commercial vehicles were `6,041 crores<br />
(94,446 units) as compared to `5,123 crores (96,593 units) and for passenger cars were `1,867 crores (66,335 units) as compared to<br />
`1,454 crores (48,213 units) in the previous year. The market share in terms of the <strong>Tata</strong> vehicles financed by TMF declined from 26%<br />
in Commercial vehicles to 21% and increased from 21% to 22% in passenger cars. TMF’s strategy on managing non-performing assets<br />
(NPA), improving collection efficiencies, improvements in the “Risk Scored Pricing Model” approach and thrust on customer relations<br />
through a branch based re-organised field structure, has in the last 2 years turned around and improved its operations and profitability,<br />
setting a robust platform to enable future growth.<br />
Jaguar Land Rover have entered into arrangements with financial service providers to make vehicle financing available to customers<br />
in 12 countries worldwide covering the largest markets by volume, including Chase Auto Finance in the U.S. and FGA Capital (a joint<br />
venture between Fiat Auto and Credit Agricole) in the UK and the rest of Europe.<br />
HUMAN RESOURCES<br />
The overall employee relations were peaceful and harmonious throughout the year. The Company continued to create a productive,<br />
learning and caring environment by implementing robust and comprehensive HR processes. <strong>2010</strong>-<strong>11</strong> saw the Company attracting<br />
substantial talent to fill some key Senior Leadership positions. The permanent manpower headcount also increased by 7% to 26,214.<br />
This increase in headcount supported the production and sales of over 8 lakh vehicles. The productivity, in terms of the turnover per<br />
employee’ has gone up by 19.3% to `96 lakhs / employee. The Commercial Vehicles Business Unit showed consistent improvement over<br />
the years and is better than its competitors on all of the 8 HR Management parameters as rated by A C Nielsen.<br />
The long term wage settlements were signed between the management and its unions at locations where the settlements were due<br />
for negotiations. The bonus settlements at all our plant locations were signed/announced in the month of September/October. The <strong>Tata</strong><br />
<strong>Motors</strong> Employees Union elections at Pune CVBU and PCBU were conducted peacefully on March 9, 20<strong>11</strong>, with new representatives<br />
being elected.<br />
Jaguar Land Rover have generally enjoyed cordial relations with employees at their factories and offices and have not had any strikes in<br />
the last eight years. More than 96% of manufacturing shop floor workers and approximately 45% of salaried staff in the U.K. are members<br />
of a labour union. Jaguar Land Rover signed a landmark settlement deal with the Unions which would lead to the creation of new<br />
jobs in the next decade, including 1,500 jobs at its Halewood facility, Liverpool in 20<strong>11</strong>. Jaguar Land Rover is recognised as a preferred<br />
employer in the U.K. and has won recognition in The Times “Top 100 Graduate Employers” for 20<strong>11</strong>; has won entry into The Times “Top<br />
50 employers for Women” and “one to note” as a first time entry in The Times “Best Companies” survey.<br />
13
Sixty-sixth annual report <strong>2010</strong>-20<strong>11</strong><br />
<strong>Tata</strong> <strong>Motors</strong> Limited<br />
SAFETY & HEALTH - PERFORMANCE AND INITIATIVES<br />
All of the Company‘s operating plants in India have been certified to OHSAS - 18001 and ISO - 14001 standards and all the CVBU units<br />
have been conferred with the ‘Golden Peacock Award’ on Safety & Health. Jamshedpur plant was adjudged first and was awarded by CII<br />
(Confederation of Indian Industry) Eastern Region in Safety, Health & Environment Practices. The Company took steps towards ensuring<br />
that every single individual working within its plant premises is protected from any harmful impact of his/her working and the inherent<br />
risks. Towards this end, the Company recently completed a diagnostic of the existing safety systems through DuPont and is taking steps<br />
to raise the safety standards to world class levels. ZAP (Zero Accident Plan) meetings are held all across plants and the defined bay<br />
owners in these plants champion these meetings. <strong>Tata</strong> Marcopolo <strong>Motors</strong> Limited would be implementing IMS – 18001/14001/9001 in<br />
both their plants in 20<strong>11</strong>-12 and other initiatives to increase focus on safety, including conducting of periodical audits to measure and<br />
ensure safety. A host of initiatives on health and wellness were taken across all plants in India. Specifically, a Health Index was initiated<br />
in the Pune plant and Ergonomics study carried out to improve workplace environment.<br />
In overseas locations:<br />
Jaguar Land Rover has robust health and safety management systems based on the U.K. Health and Safety Executive's HSG 65 Standard<br />
for Successful Health and Safety Management. Jaguar Land Rover are working to achieve the international health and safety certification<br />
standard OHSAS 18001, on all sites, with the first stage of the certification process completed during <strong>2010</strong>. All Jaguar Land Rover<br />
employees receive health and safety training as part of their induction and are kept up-to-date by weekly health and safety briefings,<br />
quarterly occupational health and safety information bulletin, specific safety brief in response to any significant incidents that occur,<br />
health and safety information on dedicated safety notice boards at each site and campaigns to raise awareness of specific risks or safety<br />
processes. Jaguar Land Rover also participates in awareness campaigns led by the U. K. Health and Safety Executive and the European<br />
Agency for Safety and Health at Work.<br />
TDCV Korea achieved an accident rate of 0.30% (lower than the national average as well as competitors) and is certified to OHSAS-18001<br />
& ISO – 14001 Standards. <strong>Tata</strong> Hispano, Spain achieved ISO - 14001 certification. <strong>Tata</strong> <strong>Motors</strong> (Thailand) Ltd. (TMTL) had Zero accidents<br />
and also conducted specific training from equipment suppliers like wheel alignment, overhead cranes, two/four post lifters, etc. to<br />
ensure safe and proper operations by the workmen.<br />
The above initiatives are in line with the <strong>Tata</strong> <strong>Motors</strong> Group’s medium term goal to emerge as a leader in safety in the Indian automobile<br />
industry and globally in the longer horizon.<br />
FINANCE<br />
The borrowings of the Company as on March 31, 20<strong>11</strong> stood at `15,899 crores (previous year `16,595 crores). Cash and Bank balances<br />
and Current investments in Liquid / Liquid Plus schemes of Mutual funds stood at `2,514 crores (previous year `2,273 crores).<br />
<strong>Tata</strong> <strong>Motors</strong> Group’s borrowings as on March 31, 20<strong>11</strong> stood at `32,791 crores (previous year `35,108 crores). Cash and Bank balances<br />
and current investments in Liquid / Liquid Plus schemes of Mutual funds stood at `12,071 crores (previous year `9,808 crores). The key<br />
highlights were:-<br />
- The Company issued rated, listed, secured/unsecured non-convertible debentures of `900 crores with maturities of 10 – 15 years as<br />
a step to raise long term resources and optimize the loan maturity profile.<br />
- In October <strong>2010</strong>, the Company raised funds aggregating `3,351 crores (US$ 750 million) by an issue of 3,21,65,000 ‘A’ Ordinary<br />
Shares at a price of `764/- per share and 83,20,300 Ordinary Shares at a price of `1,074/- per share to Qualified Institutional Buyers<br />
('QIBs'), under a qualified institutional placement. The said issue was well received by the investors and the Company availed of the<br />
opportunity to price it at the mid-upper band. This milestone in the financing strategy enabled it to come closer to its objective of<br />
balance sheet de-leveraging.<br />
- Consequent upon the holders of Foreign Currency Convertible Notes (FCCNs) of US$327.07 million and JP¥ 30 million exercising<br />
their option to convert their FCCNs to Ordinary Shares, the Company allotted 2,35,70,426 Ordinary Shares.<br />
14
- The Company redeemed the 0% JP¥ 720 million Convertible Notes as per the terms of the issue which were remaining outstanding<br />
out of the 0% JP¥ <strong>11</strong>,760 million Convertible Notes issued in 2006, the balance 93.9% of the said Notes being previously converted/<br />
repurchased.<br />
- tranche 1 of the secured, rated, credit enhanced, listed 2% coupon non convertible debentures aggregating `800 crores was<br />
redeemed as per the terms of issue out of the 4 tranches of debentures aggregating `4,200 crores issued in 2009-10.<br />
- With a turnaround in the business and continuing strong profitability in <strong>2010</strong>-<strong>11</strong>, the net debt at Jaguar Land Rover reduced to<br />
GB£ 233 million. During the year, Jaguar Land Rover took steps to establish hedging lines in order to reduce risks to the business<br />
from foreign exchange fluctuations and establishing long term funding facilities in order to strengthen the capital structure.<br />
- <strong>Tata</strong> <strong>Motors</strong> Finance Ltd have raised `361 crores by an issue of unsecured, non-convertible, subordinated perpetual debentures<br />
towards Tier 1 and 2 capital to meet its growth strategy and improve its Capital Adequacy ratio.<br />
<strong>Tata</strong> <strong>Motors</strong> Group‘s gross Debt/Equity ratio as at March 31, 20<strong>11</strong> at 1.17 was significantly lower as compared to 4.28 as on<br />
March 31, <strong>2010</strong>.<br />
The Company has undertaken and will continue to implement suitable steps for raising long term resources to match the Company‘s<br />
fund requirement and to optimize its loan maturity profile. The Company’s rating for foreign currency borrowings was revised upwards<br />
by Standard & Poor by 2 notches to BB- and by Moodys by 3 notches to Ba3. For borrowings in local currency, the rating was revised<br />
upwards by 1 notch by Crisil at AA-, by ICRA at LAA- and reaffirmed by CARE at AA-.<br />
INFORMATION TECHNOLOGY INITIATIVES<br />
<strong>Tata</strong> <strong>Motors</strong> Group continues to lead in the use of Information Technology as an integral part of its strategy and goes beyond the<br />
organisation’s boundaries to cover suppliers, dealers and customers. The Company won an Architecture Excellence Award in the IT<br />
Service Management category at the ICMG World Conclave. The Company’s competitive advantage includes a world class Customer<br />
Relations’ Management solutions (CRM) with integrated Dealer Management System (DMS) used by more than 2,500 channel partners.<br />
For receiving customer requests and feedback, the Company has an enterprise sms no. 5616161 and a customer toll free no. 1800 209<br />
7979. CRM capabilities are now being replicated in its international operations. Major highlights of the year are:–<br />
• Enhancement of the call center operation’s capabilities to get benchmark customer interaction performance, addition of Key<br />
Accounts Portal and deployment of Used Vehicle and Customer Loyalty solution.<br />
• Strengthening of IT support through distributed warehouse management and spares’ planning systems for its after market operations.<br />
• Implementation of ERP for large and complex maintenance operations for the Delhi Transport Corporation.<br />
• Supplier self service with design collaboration solution extended to additional 550 vendors with more than 2,500 vendors.<br />
• Use of manufacturing automation systems to run lean production operations with advanced systems in plants for Nano and Ace.<br />
• Expanded analytics and planning solutions to all key business functions with plans to embrace advanced analytical capabilities.<br />
• Jaguar Land Rover completed IT transition from Ford and launched multiple strategic ERP programs.<br />
• Jaguar Land Rover has commenced IT enhancements with the implementation of SAP ERP software in the UK and SAP "all in one"<br />
in the National Sales Companies. Jaguar Land Rover is also transforming its product development capabilities with new toolsets,<br />
including Product Life Cycle Management (PLM).<br />
• TDCV, Korea started its own sales and marketing operations, which went through the ERP implementation to support retail sales and<br />
initiated centralized IT procurement to leverage common contracts and terms.<br />
The <strong>Tata</strong> <strong>Motors</strong> Group companies are collaborating on various fronts in the use of Information Technology including deployment of<br />
state-of-the-art video conferencing system. The <strong>Tata</strong> Technologies Group continues to be a strategic partner in strengthening the <strong>Tata</strong><br />
<strong>Motors</strong> Group IT capabilities.<br />
15
Sixty-sixth annual report <strong>2010</strong>-20<strong>11</strong><br />
<strong>Tata</strong> <strong>Motors</strong> Limited<br />
NEW PRODUCT, TECHNOLOGY AND ENVIRONMENT FRIENDLY INITIATIVES<br />
Product Development<br />
The Company strives to be at the forefront of innovation and works to launch products aimed at the emerging needs of its customers. It<br />
continues to develop and build on its in-house capabilities and works with the right partners to ensure that it has competitive product<br />
offerings. Some of the Company’s key products and initiatives for the year include:<br />
- Showcased the <strong>Tata</strong> Pixel - a concept for a future city car at the Geneva Motor Show.<br />
- Launched the Aria - a premium crossover with high-end features such as 4x4, Torque on Demand, ESP, six airbags.<br />
- Launched the BS IV compliant variants of the Indica and the Indigo CS, the Indica eV2 and Indigo eCS with segment leading fuel<br />
efficiencies. These vehicles are powered by the Company’s 1.4L CRAIL engine.<br />
- Launched Elan - a high end variant of the Indigo Manza sedan.<br />
- Ace Zip and Magic Iris were test marketed in various parts of the country and are expected to be formally launched across the<br />
country in May this year. This completes the Ace family offerings now spanning from the Ace Zip and Magic Iris at the lower end<br />
and the Super Ace and Venture on the higher end.<br />
- Launched the Venture - a Multi Purpose Vehicle (MPV) on the Ace platform.<br />
- The Prima range launched in the previous year was expanded with the introduction of the Prima Construck range of tippers<br />
in the market. Some Prima trucks were also launched in Korea and some of the tippers are soon expected to be launched in the<br />
international markets.<br />
- Jaguar Land Rover launched the all new Jaguar XJ, the new 4.4 V8 diesel Range Rover and the new 2.2 diesel Land Rover -<br />
Freelander.<br />
- Jaguar's Advanced Design Team and the Jaguar Land Rover Technical Innovation Team created a concept car for the Paris Motor<br />
Show to celebrate 75 years of Jaguar Design and Innovation. The resultant - a stunning Jaguar C-X75, is a radical combination of<br />
hyper-car, eco-friendliness and 21 st century technology, which won 'Car of the Show' capturing the imagination of millions. Jaguar<br />
Land Rover recently announced their partnership with Williams F1 to bring a version of this concept to the market in 2013.<br />
- <strong>Tata</strong> Hispano <strong>Motors</strong> Carrocera, S.A., Spain introduced 4 new brand models of its buses, viz. Area - an urban bus, 2 hybrid urban buses<br />
and Naya - a new deluxe coach. This alongwith the Xerus and Intea models launched last year would expand its product range in<br />
high-end buses/coaches.<br />
Development of Environment Friendly Technologies<br />
As a responsible automotive manufacturer, the <strong>Tata</strong> <strong>Motors</strong> Group continues to develop vehicles and technologies to reduce its carbon<br />
footprint. Some of the significant initiatives/achievements are:<br />
- Showcased its CNG parallel Hybrid low-floor city buses in the Commonwealth Games in Delhi.<br />
- <strong>Tata</strong> Indica Vista EVX developed by engineers at our European subsidiary - <strong>Tata</strong> <strong>Motors</strong> European Technical Centre, Plc, bagged<br />
‘the Most Economic Small Passenger EV’ and ‘the Most Economical and Environment Friendly Small Passenger EV’ under the Small<br />
Passenger EV category at the inaugural Royal Automobile Club, Brighton to London Future Car Challenge.<br />
- Migrated to meeting the BS IV emission norms by developing BS IV compliant range of vehicles, in particular, Indica eV2 and<br />
Indigo eCS with 1.4L CRAIL engines with segment leading fuel efficiencies.<br />
- Jaguar and Land Rover continue to invest heavily in environmental innovation to support delivery of the 2012 European Union<br />
requirement for reduction in CO 2<br />
. the <strong>2010</strong>-<strong>11</strong> new model launches including the all new Jaguar XJ, the new 4.4 V8 Diesel Range<br />
Rover and the new 2.2 Diesel Land Rover - Freelander realised improvements in CO 2<br />
performance in excess of 10 %. The Jaguar<br />
XF and Range Rover Evoque to be launched in the second quarter of 20<strong>11</strong>, would continue this trend. The Jaguar XF 2.2 Diesel 8<br />
16
speed automatic transmission variant with Stop/Start technology reduces the entry model CO 2<br />
output whilst the Evoque features a<br />
number of lightweight, vehicle efficiency and Powertrain technologies that make this the most fuel efficient Range Rover ever.<br />
- Jaguar Land Rover is working on introducing a new Premium Lightweight Architecture for its products. This has seen a host of<br />
environment friendly technologies including new aluminium alloys, down-sized powertrains, Eco HMI, sustainable materials, best-<br />
CO 2<br />
navigation routes, electronic power steering, aerodynamic features and many more technologies. These technologies enable the<br />
delivery of class leading 'Luxury' and 'Performance' combined with low CO 2<br />
and lay the foundation for efficient hybridization of the<br />
platform. Jaguar Land Rover's initial Full-Hybrid programme is also in advanced stages.<br />
- In <strong>2010</strong>-<strong>11</strong>, some of the Plug-In Hybrid projects of Jaguar Land Rover were completed and have provided the technical foundation<br />
for a production development programme for Parallel Plug-in Hybrids. In addition, Jaguar Land Rover has made significant progress<br />
on a number of ongoing collaborative Research and Development programmes investigating a wide range of CO 2<br />
reduction<br />
technologies. These include radical combustion engine downsizing/pressure charging, alternative power sources for Series Hybrids,<br />
Flywheel KERS and waste energy recovery systems.<br />
- <strong>Tata</strong> Hispano <strong>Motors</strong> Carrocera SA, Spain, won a prestigious order for supplying 10 CNG Series Hybrid low-floor city buses, to be built<br />
on the Company’s chassis, to EMT Madrid, a Madrid city public transportation company.<br />
CONSOLIDATED FINANCIAL STATEMENTS<br />
The <strong>Tata</strong> Motor’s Group reported consolidated revenues (net of excise) for <strong>2010</strong>-<strong>11</strong> of `123,133 crores, posting a growth of 33.1% over<br />
`92,519 crores in the previous year, with strong volume growth globally in all major markets. The Consolidated Profit before Tax (PBT)<br />
for the year was `10,437 crores, compared to a PBT of `3,523 crores for the previous year. The Consolidated Profit for the period (After<br />
Tax and post minority interest and profit in respect of Associate companies) for the year was `9,274 crores, a significant increase from a<br />
profit of `2,571 crores in the previous year. As required under the Listing agreement with the Stock Exchanges, Consolidated Financial<br />
Statements of the <strong>Tata</strong> <strong>Motors</strong> Group (the Company and all its subsidiary companies) are attached.<br />
Pursuant to the provisions of Section 212(8) of the Companies Act, 1956 (Act), the Ministry of Corporate Affairs vide its General Circular<br />
No 2/20<strong>11</strong> dated February 8, 20<strong>11</strong> has granted a general exemption subject to certain conditions to holding companies from complying<br />
with the provisions of Section 212 of the Act which requires the attaching of the Balance Sheet, Profit & Loss Account and other<br />
documents of its subsidiary companies to its Balance Sheet. Accordingly, the said documents are not being included in this Annual<br />
Report. The main financial summaries of the subsidiary companies are provided under the section 'Subsidiary Companies: Financial<br />
Highlights <strong>2010</strong>-<strong>11</strong>' in the Annual Report. The Company will make available the said annual accounts and related detailed information<br />
of the subsidiary companies upon request by any member of the Company or its subsidiary companies and the same will also be kept<br />
open for inspection by any member at the Head Office of the Company and the subsidiary companies.<br />
SUBSIDIARY AND ASSOCIATE COMPANIES<br />
Subsidiary Companies<br />
The Company has 67 (direct and indirect) subsidiaries (10 in India and 57 abroad) as on March 31, 20<strong>11</strong> as disclosed in the accounts.<br />
During the year, the following changes have taken place in subsidiary companies:<br />
Subsidiary companies formed/acquired, etc.<br />
• The Company acquired 80% stake in Trilix Srl., Turin (Italy), a design and engineering company in September, <strong>2010</strong>.<br />
• <strong>Tata</strong> Precision Industries Pte. Ltd became a subsidiary after the Company increased its shareholding from 49.99% to 78.39% by<br />
subscribing to an additional 28.4% share of <strong>Tata</strong> Precision Industries Pte Ltd, Singapore on February 15, 20<strong>11</strong>. <strong>Tata</strong> Precision Industries<br />
Pte Ltd holds 100% shares of <strong>Tata</strong> Engineering Services Pte Ltd, hence <strong>Tata</strong> Engineering Services Pte Ltd also became a subsidiary.<br />
• <strong>Tata</strong> Daewoo Commercial Vehicle Company Limited formed a wholly owned subsidiary, <strong>Tata</strong> Daewoo Commercial Vehicle Sales and<br />
Distribution Company Limited.<br />
17
Sixty-sixth annual report <strong>2010</strong>-20<strong>11</strong><br />
<strong>Tata</strong> <strong>Motors</strong> Limited<br />
• HV Axles Limited and HV Transmissions Limited, two of the Company’s subsidiaries, have announced an amalgamation to harness<br />
synergies and graduate to become a total driveline solutions provider.<br />
Companies ceasing to be subsidiary companies<br />
• INCAT SAS, a subsidiary of <strong>Tata</strong> Technologies Limited was liquidated.<br />
• Jaguar Land Rover Mexico SA de CV was sold to an importer.<br />
Name changes<br />
Carroseries Hispano Maghreb to <strong>Tata</strong> Hispano <strong>Motors</strong> Carroseries Maghreb.<br />
Other than the above there has been no material change in the nature of the business of the subsidiary companies.<br />
Associate companies<br />
As on March 31, 20<strong>11</strong>, the Company had 7 associate companies as disclosed in the accounts:<br />
FIXED DEPOSITS<br />
The Company discontinued the acceptance and renewal of fixed deposits from the public and shareholders with effect from May 28,<br />
<strong>2010</strong>. During the year, it changed the Registrars to the Fixed Deposit scheme to M/s. TSR Darashaw Limited (TSRDL) from M/s. Link<br />
Intime India Private Limited. TSRDL are also the Registrars and Transfer Agents for shares and debentures issued by the Company since<br />
past few decades and would thus be a focal point of contact for all investor services. The Company has no overdue deposits other than<br />
unclaimed deposits.<br />
ENERGY, TECHNOLOGY & FOREIGN EXCHANGE<br />
Details of energy conservation and research and development activities undertaken by the Company along with the information in<br />
accordance with the provisions of Section 217(1)(e) of the Companies Act, 1956, read with the Companies (Disclosure of Particulars in<br />
the Report of Board of Directors) Rules, 1988, are given as an Annexure to the Directors‘ Report.<br />
DIRECTORS<br />
Dr Ralf Speth was appointed as an Additional Director on November 10, <strong>2010</strong> in accordance with Section 260 of the Companies Act,<br />
1956 (the Act) and Article 132 of the Company’s Articles of Association and will cease to hold office at the forthcoming Annual General<br />
Meeting and is eligible for appointment. In accordance with the provisions of the Act and the Article of Association of the Company,<br />
M/s Ravi Kant, N N Wadia and S M Palia are liable to retire by rotation and are eligible for re-appointment. Attention of the Members is<br />
invited to the relevant items in the Notice of the Annual General Meeting and the Explanatory Statement thereto.<br />
Dr J J Irani, a Director nominated by <strong>Tata</strong> Steel Limited (Steel Director) and who is a non-rotational Director as per Article 127 of the<br />
Company’s Articles of Association, has conveyed his decision to step down from the Company’s Board from June 2, 20<strong>11</strong> on attaining 75<br />
years as per the Retirement policy of the <strong>Tata</strong> Group. Dr Irani was also a member of the Company’s Executive Committee of the Board.<br />
The Board of Directors in its meeting held on May 26, 20<strong>11</strong> expressed appreciation of the enormous contributions made by Dr Irani over<br />
the years to the development and growth of the Company as also his good counsel in charting its future direction.<br />
CORPORATE GOVERNANCE<br />
A separate section on Corporate Governance forming part of the Directors’ Report and the certificate from the Practicing Company<br />
Secretary confirming compliance of Corporate Governance norms as stipulated in Clause 49 of the Listing Agreement with the Indian<br />
Stock Exchanges is included in the Annual Report.<br />
PARTICULARS OF EMPLOYEES<br />
The Company has 99 employees who were in receipt of remuneration of not less than `60 lakhs during the year or `5 lakhs per month<br />
during any part of the said year. The Information required under Section 217(2A) of the Companies Act, 1956 and the Rules made<br />
18
thereunder is provided in the Annexure forming part of the Report. In terms of Section 219(1)(b)(iv) of the Act, the Report and Accounts<br />
are being sent to the shareholders excluding the aforesaid Annexure. Any Shareholder interested in obtaining a copy of the same may<br />
write to the Company Secretary.<br />
CSR INITIATIVES<br />
A separate section on initiatives taken by the Company to fulfill its Corporate Social Responsibilities is included in the Annual Report.<br />
AUDIT<br />
M/s Deloitte Haskins & Sells (DHS), Registration No. <strong>11</strong>7366W, who are the Statutory Auditors of the Company hold office until the<br />
conclusion of the ensuing Annual General Meeting. It is proposed to re-appoint them to examine and audit the accounts of the Company<br />
for the Financial Year 20<strong>11</strong>-12. DHS have, under Section 224(1) of the Act, furnished a certificate of their eligibility for re-appointment.<br />
Cost Audit<br />
As per the requirement of the Central Government and pursuant to Section 233B of the Act, the audit of the cost accounts relating to<br />
motor vehicles is carried out every year. Pursuant to the approval of Ministry of Corporate Affairs (MCA) vide Sr. No. 52/413/CAB/1989<br />
dated September 1, 2009, M/s Mani & Co. having registration No. 00004 were appointed as the Cost Auditors for auditing the Company’s<br />
cost accounts relating to motor vehicles for the financial year ended March 31, <strong>2010</strong>. Consequent upon the audit undertaken and<br />
submission of the Cost Audit Report dated August 10, <strong>2010</strong> and based on the recommendation of the Audit Committee, the Board<br />
approved of the said Audit Report on August 10, <strong>2010</strong> which was filed with the MCA on September 8, <strong>2010</strong>.<br />
DIRECTORS’ RESPONSIBILITY STATEMENT<br />
Pursuant to Section 217 (2AA) of the Act, the Directors, based on the representation received from the Operating Management, confirm<br />
that:-<br />
- in the preparation of the annual accounts, the applicable accounting standards have been followed and that there are no material<br />
departures;<br />
- they have, in the selection of the accounting policies, consulted the Statutory Auditors and have applied them consistently and<br />
made judgments and estimates that are reasonable and prudent so as to give a true and fair view of the state of affairs of the<br />
Company at the end of the financial year and of the profit of the Company for that period;<br />
- they have taken proper and sufficient care, to the best of their knowledge and ability, for the maintenance of adequate accounting<br />
records in accordance with the provisions of the Act, for safeguarding the assets of the Company and for preventing and detecting<br />
fraud and other irregularities;<br />
- they have prepared the annual accounts on a going concern basis.<br />
ACKNOWLEDGEMENTS<br />
The Directors wish to convey their appreciation to all of the Company’s employees for their enormous personal efforts as well as their<br />
collective contribution to the Company’s performance. The Directors would also like to thank the employee unions, shareholders, fixed<br />
deposit holders, customers, dealers, suppliers, bankers, Government and all the other business associates for the continuous support<br />
given by them to the Company and their confidence in its management.<br />
Mumbai, May 26, 20<strong>11</strong><br />
On behalf of the Board of Directors<br />
RATAN N TATA<br />
Chairman<br />
Annexure to the Directors’ Report<br />
19
Sixty-sixth annual report <strong>2010</strong>-20<strong>11</strong><br />
<strong>Tata</strong> <strong>Motors</strong> Limited<br />
Annexure TO the DIRECTORS’ REPORT<br />
(Additional information given in terms of Notification 1029 of 31-12-1998 issued by the Department of Company Affairs)<br />
A. Conservation of Energy<br />
The Company has always been conscious of the need for conservation of energy and has been steadily making progress towards this<br />
end. Energy conservation measures have been implemented at all its plants and offices and special efforts are being put on undertaking<br />
specific energy conservation projects such as:<br />
• Installation of Variable Frequency Drives (VFD) for: electrical heating system of Continuous Carburizing Hardening Furnace (CCHF) ,<br />
cooling tower cold water pump motor, clean room Air Supply Unit motor, etc;<br />
• Switchover from electrical heating to LPG based heating system in washing machines and aluminium melting furnace;<br />
• Installation of CFL, LED bus bar indicators, 24Wx4 T5 lamps for street lights, Electronic ballast and LED street lights;<br />
• Switching off unwanted lights;<br />
• Installation of Light pipes and Transparent Polycarbonate sheets;<br />
• Installation of efficient Weishaupt Burners in plant and waste heat recovery from furnace flue gases to heat water for process;<br />
• Modification in PLC logic Top coat-2 oven cooling zone, optimization of phosphate bath temperature, optimization of AC plant<br />
operations, installation of active grill for data center AC system, to reduce electricity consumption;<br />
• Installation of Energy Efficient <strong>Motors</strong> (Eff-1), Wind Ventilators, Super magnetic dust separator; Downsizing of motors, Trimming of<br />
impeller of oversized water recirculation pump, etc.<br />
These changes have resulted in e lectrical energy saving of 1.93 crore units, reduction in consumption of LDO fuel by 79KL and Propane<br />
by 194MT, leading to savings in cost of around `10.43 crores and annual CO 2<br />
reduction of 17,401 tCO 2<br />
for the Company.<br />
In addition, the Company’s endeavour of tapping wind energy has also made significant contributions in:<br />
• Generation of 527.1 lakh units from Wind Power resulting in savings of electricity charges of `17.85 crores and reduction of CO 2<br />
by<br />
48,620 tCO 2<br />
.<br />
• For the Company‘s 20.85MW Wind power project, United Nations Framework Convention for Climate Change (UNFCCC) have issued<br />
27,554 CERs on January 20, 20<strong>11</strong> for the period 2008-09.<br />
Awards / Recognitions received during the year are as follows:<br />
• The Company’s CVBU Pune won the “GOLD” rating of Green Factory Building Award from Indian Green Building Council (IGBC), which<br />
is first of its kind in India and for the <strong>Tata</strong> Group. All the existing buildings are rated as GOLD rating factory buildings in Pimpri. The<br />
Company is the first to receive this award for the existing factory buildings.<br />
• CVBU Pune was declared winner of 'Vasundhara Awards <strong>2010</strong>' organised by the Maharashtra Pollution Control Board (MPCB), winner<br />
of first prize in Technical Paper Contest at INSSAN Regional Convention <strong>2010</strong> of INSSAN (Indian National Suggestion Schemes'<br />
Association) - Eastern India Chapter. It also received the Excellent Energy Efficient Unit award in the CII <strong>11</strong>th National Awards for<br />
Excellence in Energy Management - <strong>2010</strong>.<br />
• The Company won the Srishti G-Cube Awards for Good Green Governance in Manufacturing - Engineering category, CVBU Pune was<br />
the winner, Jamshedpur Plant was declared ''runner up'', and Pantnagar Plant received a ''certificate of commendation''.<br />
• CVBU Lucknow was adjudged the Excellent Energy Efficient Unit for the second time in a row at the <strong>11</strong>th National Awards for<br />
Excellence in Energy Management <strong>2010</strong>, conducted by CII - Godrej Green Business Centre at Chennai. It also received the Silver<br />
Award in the automobile sector at the <strong>11</strong>th Global Green Tech Excellence Awards <strong>2010</strong> and awarded the first prize in the National<br />
Energy Conservation Award (NECA) <strong>2010</strong>, in the Automobile Sector, at New Delhi.<br />
20
• Pantnagar Plant received the first prize in the Uttarakhand State Energy Conservation Award <strong>2010</strong>, under the Large and Medium<br />
scale industry category. It was also awarded the second prize at the National Energy Conservation Awards (NECA) <strong>2010</strong>, under the<br />
Automobile Manufacturing Sector. This is the consecutive second year that the Plant has received this National Award.<br />
B. Technology Absorption<br />
The Company has continued its endeavor to absorb the best of technologies for its product range to meet the requirements of a<br />
globally competitive market. All of its vehicles and engines are compliant with the prevalent regulatory norms in India and also in the<br />
countries to which they are exported. It has also undertaken programs for development of vehicles which would run on alternate fuels<br />
like LPG, CNG, Bio-diesel, Electric traction etc.<br />
Major Technology absorption projects undertaken during last year include:<br />
Technology For<br />
Development of Navigation system on Aria<br />
Vehicle vibration reduction during shut-down of engine for Aria and Magic Iris by using high damping SBR engine-mounts<br />
For In-cab noise reduction of Xenon, Super-Ace and Venture, tuning of a Torsional Vibration Damper [TVD]<br />
Inflatable curtains for side impact protection<br />
Parallel Hybrid Technology for Buses<br />
Status<br />
Implemented in<br />
production<br />
Implemented<br />
Under Implementation<br />
Technology for indigenized high temperature cables developed for use on vehicles<br />
EE – Architecture Development methodology for vehicles<br />
Development in progress<br />
Symptom Driven Diagnostics development for vehicles<br />
During the year, the Company filed 141 Patent Applications and 41 Design applications. In respect of applications filed in earlier years,<br />
<strong>11</strong> Patents were granted and 36 Designs were registered.<br />
To reinforce the need for technology up-gradation to attain international levels of competitiveness and to be able to offer contemporary<br />
products, the Company invested in facilities for vehicle level performance development, various optimisation and emission measurements,<br />
for validating safety requirements, and meeting various evolving regulatory requirements in domestic and international markets, such<br />
as:<br />
• Heavy duty chassis dynamometers for vehicle level performance development and various calibrations for Utility Vehicles and<br />
Passenger Cars.<br />
• Heavy duty chassis dynamometers for performance development and various calibrations for Medium and Heavy commercial<br />
vehicles and 440 kW Dynamic transient dynamometer and allied auxiliary equipment.<br />
• Robotic driver mileage accumulation for light, medium and heavy commercial vehicles.<br />
• Enhancement of Chassis Dynamometer Emission Lab for passenger cars and small commercial vehicles for Euro V emission<br />
norms onward. This lab is upgraded with new 48” chassis dynamometer as per regulatory requirements and advanced emissions<br />
measurement systems.<br />
• Facilities and equipment to meet safety regulations such as mobile crash test barrier for side impact testing (as per US regulations),<br />
Rear impact testing (as per Korean regulation). Introduction of xenon –ve arc, flicker free lighting system for high speed digital<br />
photography during crash events.<br />
• Hardware in Loop (H.I.L.) set up for body cluster module development.<br />
• Rapid prototyping equipment with selective laser sintering (SLS) technology for ‘ready to test’ plastic prototype parts.<br />
• Eight poster road load simulator for vehicle structural durability of Medium and Heavy commercial vehicles.<br />
21
Sixty-sixth annual report <strong>2010</strong>-20<strong>11</strong><br />
<strong>Tata</strong> <strong>Motors</strong> Limited<br />
Investments are also made to upgrade the existing facilities through addition of various data acquisition systems and analysis software<br />
for Road Load Data collection, NVH testing, engines related testing and calibration and enhancement of automation of test beds.<br />
Major Technology imports include:<br />
Technology for Year of Import Status<br />
Development and application of a two cylinder common rail diesel engine for small passenger car and<br />
small commercial vehicles.<br />
2007-08<br />
2008-09<br />
2009-10<br />
Completed<br />
Gas Injection technology for LCV, MCV and HCV engines 2009-10 Under Development<br />
Stop-Start feature for various vehicle platforms 2009-10 In progress<br />
Engine Management for Series Hybrid Technology for Buses 2009-10 Under Development<br />
Design and Development of New Generation engine platforms for LCVs and UVs 2006-07 Completed<br />
Design and Development of Infinitely variable transmission based on full toriodal traction-drive variators<br />
for various vehicle platforms.<br />
2007-08 Under implementation<br />
Design and Development of Electric Hatchback in windows vehicle – Indica Vista EV 2008-09 Under implementation<br />
During the year the Company spent `1,187.21 crores on Research and Development activities including expenditure on capital assets<br />
purchased for Research and Development which was 2.47% of the net turnover.<br />
C. Foreign Exchange Earnings and Outgoing<br />
(`in crores)<br />
Earning in foreign currency 3,358.64<br />
Expenditure in foreign currency (including dividend remittance) 3,180.17<br />
22
Management Discussion and Analysis<br />
Business Overview<br />
<strong>Tata</strong> <strong>Motors</strong> Business: The Indian economy recorded a robust growth rate estimated at 8.6% over 2009-10, driven by growth in the<br />
agricultural sector (5.4%), industrial sector (8.1%) and services sector (9.6%). The growth in the first half of the fiscal year was higher,<br />
which moderated in the second half. The year also witnessed inflationary trends beyond RBI targets and followed successive increases in<br />
CRR and other monetary policy changes by RBI to curb inflation, which progressively affected the business sentiment through the year.<br />
As a result, the second half of the fiscal year saw a drop in the Index for Industrial Production (IIP) as industrial activity was affected.<br />
On the back of overall economic growth, the automotive industry recorded an increase of 26% in current fiscal. Facilitated by economic<br />
growth, increase in personal disposable incomes, availability of finance and development of infrastructure, the commercial vehicle<br />
industry growth moderated to 27% as compared to 40% in 2009-10 and the passenger vehicle industry grew by 30% as compared to<br />
25% in 2009-10, driven by increased level of disposable income.<br />
From October 1, <strong>2010</strong>, emission norms in India migrated to the Bharat Stage III for the non-metro cities / towns, considering an<br />
imminent increase in prices, there was a spurt in buying of vehicles (mainly commercial vehicles) in the first half of the year. The fuel<br />
prices, especially the petrol prices increased throughout the year, thereby affecting the consumer sentiment to an extent. The year also<br />
witnessed a significant pressure on commodity prices, leading to increase in costs and pressure on margins.<br />
The Company’s total domestic sales increased by 22.8% to 7,78,540 vehicles in <strong>2010</strong>-<strong>11</strong>.The commercial vehicle sales at 4,58,828 vehicles<br />
grew by 22.7% and the Company maintained its leadership position in the domestic market despite new players entering the field.<br />
The passenger vehicles volumes at 3,19,712 vehicles grew by 23.0% in the domestic market on the back of increased volumes of the<br />
Nano, launch of Aria and the launches of new variants of Indigo, Manza and Safari. The Company’s exports increased by 70.3% to 58,089<br />
vehicles during the year with significant economic improvement in its major international markets such as the Indian sub-continent,<br />
South Africa and the Middle East.<br />
The industry performance in the domestic market during <strong>2010</strong>-<strong>11</strong> and the Company’s share is given below:-<br />
Category<br />
Industry Sales (Nos.) Company Sales (Nos.) Company Market Share (%)<br />
<strong>2010</strong>-<strong>11</strong> 2009-10 Growth <strong>2010</strong>-<strong>11</strong> 2009-10 Growth <strong>2010</strong>-<strong>11</strong> 2009-10<br />
Commercial Vehicles * 7,42,091 5,82,933 27.3% 4,58,828 3,73,842 22.7% 61.8 64.1<br />
Passenger Vehicles # 24,66,814 19,00,704 29.8% 3,19,712 2,60,020 23.0% 13.0 13.7<br />
Total 32,08,905 24,83,637 29.2% 7,78,540 6,33,862 22.8% 24.3 25.5<br />
Source: Society of Indian Automobile Manufacturers report and Company Analysis<br />
* including Magic and Winger sales; #including Fiat & Jaguar Land Rover branded cars<br />
Industry Structure and Developments<br />
Commercial Vehicles<br />
The domestic Commercial Vehicle market in <strong>2010</strong>-<strong>11</strong>, recorded a robust growth of 27.3% which resulted in the highest ever sales of<br />
7,42,091 vehicles in <strong>2010</strong>-<strong>11</strong>. High growth rates continued through the first half of the fiscal year supported by sustained economic<br />
growth and impact of a lower base in the corresponding period last year. The demand for commercial vehicles continued to be robust,<br />
driven by growth in the agricultural and industrial sectors of the economy.<br />
The domestic industry performance during <strong>2010</strong>-<strong>11</strong> and the Company’s share is given below:-<br />
Category<br />
Industry Sales (Nos.) Company Sales (Nos.) Company Market Share (%)<br />
<strong>2010</strong>-<strong>11</strong> 2009-10 Growth <strong>2010</strong>-<strong>11</strong> 2009-10 Growth <strong>2010</strong>-<strong>11</strong> 2009-10<br />
M&HCV 3,27,3<strong>11</strong> 2,44,959 33.6% 1,96,651 1,55,161 26.7% 60.1 63.3<br />
LCVs * 4,14,780 3,37,974 22.7% 2,62,177 2,18,681 19.9% 63.2 64.7<br />
Total 7,42,091 5,82,933 27.3% 4,58,828 3,73,842 22.7% 61.8 64.1<br />
Source: Society of Indian Automobile Manufacturers report and Company Analysis<br />
* including Magic and Winger sales<br />
23
Sixty-sixth annual report <strong>2010</strong>-20<strong>11</strong><br />
<strong>Tata</strong> <strong>Motors</strong> Limited<br />
The Company’s commercial vehicle sales in the domestic and international markets, at 5,09,072 vehicles, were 26.7% higher than<br />
the previous year. The Company recorded its highest ever sales in the domestic commercial vehicle market. In the international<br />
business it crossed the 50,000 mark for the first time in its history. A strong product portfolio, coupled with its continued leadership<br />
in market reach and penetration and extensive efforts toward finance enablement for customers, were the key growth drivers. The<br />
Company’s market share in <strong>2010</strong>-<strong>11</strong>at 61.8% was lower as compared to 64.1% in the previous year, mainly due to inability of key<br />
suppliers to ramp-up production to meet market demand and new competition in the SCV segment where hitherto Ace was the only<br />
product.<br />
The year also witnessed a recovery in the major international markets, leading to a strong growth in the exports of commercial vehicles.<br />
In particular, the M&HCV and SCV exports to the Indian subcontinent region showed a robust growth.<br />
In the domestic market, the M&HCV segment grew by 26.7% on the back of strong growth in the Indian economy. The growth in the<br />
core sectors of the economy and revival in the EXIM trade benefited the M&HCV segment. There was healthy freight availability in the<br />
market, operations for transporters were profitable and construction and mining sectors continued to grow backed by infrastructure<br />
projects. The good monsoons also ensured a growth in the agricultural sector and this aided the freight market.<br />
The Company launched product variants tailored to specific market segments. It launched the Construck range of the Prima and<br />
upgraded its entire product range to comply with the BS III emission norms w.e.f. October 1, <strong>2010</strong>. The Company also showcased and<br />
operated its first CNG Hybrid city bus at these Games in Delhi.<br />
The LCV segment recoded a growth of 19.9% through the year in <strong>2010</strong>-<strong>11</strong>. While this was largely aided by the growth in the small<br />
commercial vehicles, the rest of the segment comprising of the 4 and 7 tonne segments also grew handsomely. The Company improved<br />
its performance in the pickup segment.<br />
The sales of the <strong>Tata</strong> Ace continued to increase in its fifth year of sales. The Company has launched a portfolio of variants on the popular<br />
Ace platform such as the Ace EX, Super Ace, Venture which have been well received in the market. Launch of products by competition<br />
in this segment resulted in a lower market share of 63.2% in the year <strong>2010</strong>-<strong>11</strong> as compared to 64.7% during last year.<br />
Passenger Vehicles<br />
The year <strong>2010</strong>-<strong>11</strong> was a remarkable year for the passenger vehicle industry, recording a growth of 29.8%, driven by increase in the<br />
disposable incomes, availability of finance and a positive consumer sentiment coupled with aggressive new model launches and pricing<br />
by manufacturers.<br />
The Industry performance and the Company’s performance in the segments that it operates in is given below:-<br />
Category<br />
Industry Sales Company Sales (Audited Nos.)* Company Market Share (%)<br />
<strong>2010</strong>-<strong>11</strong> 2009-10 Growth <strong>2010</strong>-<strong>11</strong> 2009-10 Growth <strong>2010</strong>-<strong>11</strong> 2009-10<br />
Small Car (Mini + Compact) 15,45,992 <strong>11</strong>,92,007 29.7% 1,80,091 1,58,093 13.9% <strong>11</strong>.6 13.3<br />
Midsize Car 3,75,137 2,87,923 30.3% 96,880 68,263 41.9% 25.8 23.7<br />
Utility Vehicle / SUV 3,23,592 2,70,888 19.5% 42,741 33,664 27.0% 13.2 12.4<br />
Total Passenger Vehicles # 24,66,814 19,00,704 29.8% 3,19,712 2,60,020 23.0% 13.0 13.7<br />
Source: Society of Indian Automobile Manufacturers report and Company Analysis<br />
* including Fiat & Jaguar Land Rover branded cars # Total Industry Nos. include sales in other segments<br />
During the year, the Company recorded its highest ever sales of 3,19,712 vehicles (including Fiat & Jaguar Land Rover) in the domestic<br />
market. The Company continued to be amongst the top three players in the Indian passenger vehicle market with a market share of<br />
13.0%. The Company launched a variety of new products and variants in the year. It launched the Indica eV2 and Indigo eCS variants<br />
in the market with segment leading fuel efficiencies. It also introduced the Venture - a multi purpose vehicle and the Aria - first Indian<br />
crossover in the UV segment.<br />
In the International Business, while the recovery in its key export markets for the passenger car business was slow; the sales increased<br />
to 7,845, a growth of 25.9% over the previous year.<br />
24
For the passenger car industry, the small car segment with sales of over 1.5 million vehicles, continued to be the biggest segment of<br />
the market, recording a growth of 29.7%. The growth in this segment was mainly driven by the continued launch of new models. In a<br />
rapidly expanding market, the Company‘s share in <strong>2010</strong>-<strong>11</strong> was <strong>11</strong>.6%, lower than 13.3% in 2009-10. The Company sold 70,431 Nano<br />
cars in <strong>2010</strong>-<strong>11</strong>, a growth of 129% over 2009-10. It inaugurated the Sanand plant for the production of the Nano in June 20<strong>11</strong> and<br />
production was progressively ramped up through the year. The Company focused on expanding the reach for the Nano through Special<br />
Nano Access Points and by ensuring availability of finance for all segments of customers through flexible / tailored finance schemes. The<br />
Company launched a refreshed version of the Indica Vista and a new variant, Indica eV2, with the CRAIL engine and a segment leading<br />
fuel efficiency of 25 kmpl.<br />
The midsize segment with sales of 3,75,137 vehicles during <strong>2010</strong>-<strong>11</strong>, grew by 30.3%. During the year with sales of 87,919 vehicles, the<br />
Indigo range, registered an increase of 55.3%. With the launch of the Indigo eCS, the Company increased its market share in this segment<br />
to 25.8% and is also repositioning its Indigo brand at the higher end of the segment with the introduction of the Indigo Manza, Elan.<br />
The UV market recorded a healthy growth of 19.5%, during the year, with sales of 3,23,592 vehicles. The Company increased its market<br />
share in this segment to 13.2%, with sales of 42,741 vehicles. The Company improved its sales with launch of Aria, Venture and a refreshed<br />
version of Safari.<br />
The Company sold 20,342 Fiat cars in <strong>2010</strong>-<strong>11</strong>, with sale of 8,536 lineas and <strong>11</strong>,613 Grande Puntos which represented a market share<br />
of 0.8% for the Fiat brand.<br />
The Company sold 889 Jaguar and Land Rover vehicles through its exclusive dealerships in India in the second year of the introduction<br />
of the Jaguar Land Rover brands in India and launched the Jaguar XJ and Jaguar XF Diesel in the market in this year. It focused on<br />
widening its network across the country during <strong>2010</strong>-<strong>11</strong>. The Company set up an assembling activity for the Land Rover - Freelander 2<br />
at Pune which has since been operational from May this year.<br />
Jaguar and Land Rover Business: During the year, external environment for Jaguar Land Rover continued to improve compared to<br />
2009-10, with favourable GDP growth in key markets driving increased demand for premium products. Jaguar Land Rover continued to<br />
benefit from favourable exchange rates, particularly the US$ and the Euro throughout the year.<br />
The financial results of Jaguar Land Rover have showed continuous improvement resulting in a reported profit before tax of<br />
£1,126 million for the year. In addition to this, the last quarter results represented the sixth successive quarter of positive profit after tax.<br />
The substantial improvement in the operations, EBITDA, net income and cash and general liquidity position, was attributable to an increase<br />
in wholesale volumes and an improvement in product mix associated with the introduction of the new Jaguar XJ and the cessation of<br />
the Jaguar X-Type and the continued strength of the Range Rover and Range Rover Sport. Jaguar Land Rover business experienced an<br />
improvement in market mix, in particular the strengthening of business in China, which was supported by the launch of an National<br />
Sales Company in China in mid-<strong>2010</strong>. Further, performance was also assisted by the positive impact of the strengthening of the US dollar<br />
against the Pound Sterling and the euro, which has positively affected revenues (a portion of which comprises wholesale volumes in<br />
US dollars) against the backdrop of a largely Pound Sterling and euro cost base. The improvement in results of operations in <strong>2010</strong>-<strong>11</strong> was<br />
also partially attributable to further cost-efficiency improvements in material costs and manufacturing costs, supported by increased<br />
production volume levels. Jaguar Land Rover continue to benefit from cost efficiencies and effective cash management initiatives<br />
adopted in response to the challenging operating conditions in 2008 and 2009, including the alignment of production with demand,<br />
active management of working capital through extension of the term of trade payables and acceleration of the term of trade receivables<br />
while reducing inventories and scaling down the cost base across the business.<br />
Jaguar Land Rover PLC generated record revenue and earnings during <strong>2010</strong>-<strong>11</strong>. This was primarily driven by increased demand for both<br />
brands as well as a strong product and market mix, particularly in China and Russia as well as favourable exchange rates. Group revenues<br />
increased by 51% over the last fiscal.<br />
For <strong>2010</strong>-<strong>11</strong>, the Material Cost of sale as a percentage of revenue has improved over the last fiscal by 5.3%, Employee costs for <strong>2010</strong>-<strong>11</strong><br />
increased by 6.3%, reflecting an increase in permanent and agency heads, primarily in Product Development and the latest two year<br />
wage rate agreement that was signed in November <strong>2010</strong>. Other expense for <strong>2010</strong>-<strong>11</strong> increased by 34%, mainly volume driven. These<br />
costs include manufacturing and launch costs, freight and distribution costs, warranty costs, product development expenses, selling and<br />
fixed marketing expenses. Some of these were attributable to spend on the Range Rover Evoque that should be in the market in June<br />
20<strong>11</strong> as well as XJ which was launched in May <strong>2010</strong>. Expenditure capitalised for <strong>2010</strong>-<strong>11</strong> increased reflecting the increased spend on<br />
future model development for both brands.<br />
Wholesale volumes at 2,43,621 vehicles in <strong>2010</strong>-<strong>11</strong> reflected a growth of 26% as compared to 2009-10. At a brand level, wholesale<br />
volumes of the Jaguar and Land Rover at 52,993 and 1,90,628 reflected a growth of 12% and 30% respectively over 2009-10.<br />
25
Sixty-sixth annual report <strong>2010</strong>-20<strong>11</strong><br />
<strong>Tata</strong> <strong>Motors</strong> Limited<br />
Retail volumes in the UK totaled 58,134, a 2% increase on the prior period, whilst the North American retails were up 21% to<br />
50,280. Retails in key growth markets saw significant increases with China retail volumes ending the reporting period at 28,893 and<br />
Russia <strong>11</strong>,689 up on prior reporting period by 70% and 32% respectively. There was moderate growth in Europe of 6% resulting in<br />
retail volumes of 53,7<strong>11</strong> and across all other markets the retail volume of 38,198 represented 16% growth on the prior reporting<br />
period.<br />
Jaguar’s <strong>11</strong>MY XJ went on sale in first quarter of <strong>2010</strong>-<strong>11</strong>, bringing the ‘new’ Jaguar line-up to full strength for the first time.<br />
This combination of XF, XK and new XJ received significant media coverage and helped mark the 75th anniversary of the Jaguar<br />
brand. The XJ was made available internationally as a standard or long wheelbase vehicle with GENIII 5.0-litre petrol and 3.0-litre diesel<br />
engines.<br />
The Jaguar C-X75 concept car was showcased at the Paris <strong>Motors</strong>how in September <strong>2010</strong>, to mark the brand’s 75th anniversary.<br />
This dominated all media outlets at the show. It revealed next-generation powertrain technology in the form of electric motors<br />
and a Bladon Jets-developed turbine generator. The design also received great praise, lighting the way for Jaguars of the future. In<br />
the latter half of the year, a decision of the build production versions of the C-X75 in association with Williams F1 was taken. This<br />
high-performance hybrid supercar will stay true to the initial concept design study. Project C-X75 features an equally innovative<br />
powertrain to the micro gas turbine technology presented in the original concept car. The road-going supercar will use a stateof-the-art,<br />
small-capacity turbocharged internal combustion engine with powerful electronic motors at each axle providing<br />
four-wheel drive.<br />
In March 20<strong>11</strong>, the Jaguar XKR-S, a more powerful version of the XKR, was revealed at the Geneva Motor Show. Aimed at driving<br />
enthusiasts, it adopts a more powerful version of the 5.0-litre V8.<br />
20<strong>11</strong> marks the Jaguar E-Type’s 50th anniversary. <strong>2010</strong> marked the 40th Anniversary of Range Rover with a number of activities designed<br />
to celebrate the iconic brand, including an exclusive celebration at Kensington Palace. Another historic milestone during the anniversary<br />
year was the production of the Millionth Range Rover at Land Rover's Solihull plant which was donated to the UK charity 'Help for<br />
Heroes'.<br />
In July <strong>2010</strong>, Land Rover held the international media Ride and drive in Portugal for the revised <strong>11</strong>MY Range Rover. A new, class-leading<br />
V8 diesel engine, new 8-speed transmission, two significant Terrain Response® upgrades and subtle external styling enhancements are<br />
amongst the features on the new 20<strong>11</strong> Range Rover, which went on sale in the UK in September <strong>2010</strong>.<br />
The LR-TDV8 4.4-litre with parallel sequential turbocharging replaces the outstanding LR-TDV8 3.6-litre and is unique to the<br />
Range Rover. The all-new LR-TDV8 combines superior power and massive torque with unparalleled levels of refinement. Despite the<br />
extra performance, this V8 engine is cleaner too, delivering even lower fuel consumption and CO 2<br />
emissions than its predecessor.<br />
The combined cycle fuel consumption of the new LR-TDV8 4.4-litre is 30.1mpg, making this the first Range Rover ever to better 30<br />
mpg.<br />
Freelander 2 eD4 was launched (mainly Europe/UK), Land Rover's most fuel efficient vehicle to date, achieving 47.2 MPG and 158 g/<br />
km CO 2<br />
. It is Land Rover's first 2WD vehicle, offering customers who prefer this option access to the Land Rover brand. Its Co 2<br />
and 2WD<br />
credentials also make this an important fleet vehicle; allowing the brand access to many more corporate / company fleets. At the end<br />
of March, the 2,50,000th Freelander 2 was produced at Land Rover's Halewood plant in Merseyside, UK, a production milestone for Land<br />
Rover's biggest selling model.<br />
<strong>2010</strong>-<strong>11</strong> saw the formal introduction of the Range Rover Evoque, the smallest and most fuel efficient Range Rover ever. The new model<br />
was first shown in July <strong>2010</strong> at Kensington Palace before making its motorshow debut at Paris and Los Angles. Supported by the Hello<br />
Evoque campaign, the new Range Rover has been well received by media and customers alike. European pricing for the Range Rover<br />
Evoque was announced at the Geneva Motor Show. Pricing for other markets including the USA and UK was announced over the<br />
following months and received significant media coverage. The entry level price of under £30,000 was welcomed, along with the range<br />
of personalisation options available.<br />
Land Rover’s on going commitment to building vehicles that are more fuel and emissions-efficient reaches another milestone at the<br />
20<strong>11</strong> Geneva Motor Show with the first presentation of Range_e. This development model is equipped with an advanced plug-in hybrid<br />
diesel-electric powertrain that Land Rover expects to make available in future production models, following the scheduled launch of its<br />
diesel-electric hybrid in 2013.<br />
<strong>Tata</strong> Daewoo Commercial Vehicles (TDCV) Business: <strong>2010</strong>-<strong>11</strong> was a very challenging year for TDCV, where as in the first<br />
half of the year, domestic sales were severely impacted due to financial crisis of TDCV’s main distributor and the second half of the year<br />
26
ecorded lower exports. The impact was accentuated due to appreciating Korean Won. These factors had an adverse impact on its profitability.<br />
TDCV registered net revenues of KRW 7,26,859 million (`2,881 crores), and recorded a Profit after Tax of KRW 18,430 million<br />
(`73 crores) in <strong>2010</strong>-<strong>11</strong>. TDCV launched its wholly owned Sales and Distribution Company to act as its sole distributor in the<br />
domestic market. Total market for heavy commercial vehicles in Korea increased by 17.3% with vehicles sales at 12,860 units<br />
in <strong>2010</strong>-<strong>11</strong>, compared to 10,964 units in the previous year. TDCV’s share was 2,848 vehicles in <strong>2010</strong>-<strong>11</strong> with a market share of<br />
22.1%, as compared to 3,080 units and market share of 28.1% for the same period in the previous year. In the medium duty truck<br />
segment total market increased to <strong>11</strong>,926 units in the year under review, an increase of 24.5% compared to 9,582 units in the<br />
previous year. TDCV’s share was 2,895 units in <strong>2010</strong>-<strong>11</strong> with a market share of 24.3% compared to 2,273 units in 2009-10 and a<br />
market share of 23.7%, an increase of 60 basis points in total market share. TDCV exported 2,957 Completely Built Units (CBU)<br />
during the year as compared to 3,562 CBU in the previous year, a decline of 17.0%. TDCV has major presence in countries like<br />
Algeria which showed signs of fatigue in Dump / Mixer segment. The Gulf Cooperation Council (GCC) block which is one of the Company‘s<br />
major exports market had been worst effected during the global financial crisis and did not fully recover even in <strong>2010</strong>-<strong>11</strong>.<br />
<strong>Tata</strong> <strong>Motors</strong> Finance Ltd (TMFL) Business: <strong>2010</strong>-<strong>11</strong> was a year of consolidation and growth for TMFL which is engaged in the<br />
business of vehicle financing. Many facets of TMFL’s operations, particularly the management of non-performing assets, collection<br />
efficiencies as well as overall disbursements have shown significant improvements / increases, resulting in a substantially improved<br />
financial performance for the year. TMFL registered net revenues of `1,367 crores and reported a Profit After Tax of `127 crores in<br />
<strong>2010</strong>-<strong>11</strong>.<br />
TMFL’s main areas of focus continued to be on improving the quality of business sourced, managing overall costs and increased<br />
attention on collections management. This is been done through managing customer-wise outstanding. TMFL has widened the profile<br />
of customers it manages to improve the portfolio mix. This strategy, along with the upgrading / improvements on the ‘Risk Scored<br />
Pricing Model’ has ensured that TMFL realizes an appropriate price for higher risk products/markets. TMFL is confident that, on this<br />
robust platform, it can now further its growth across all customer segments in the coming years.<br />
Total disbursements by TMFL were `7,908 crores as against `6,697 crores in the previous year. TMFL financed 1,60,781 vehicles during<br />
the year as compared to 1,44,806 vehicles in the previous year. Disbursals for new commercial vehicles were `6,041 crores (94,446 units)<br />
as compared to `5,123 crores (96,593 units). The Passenger Car business grew significantly with the disbursements on the Nano vehicles<br />
and passenger car disbursements for the year were at `1,867 crores (66,335 units) as compared to `1,454 crores (48,213 units) in the<br />
previous year.<br />
<strong>Tata</strong> Technologies (TTL) Business: TTL, a key strategic partner in several of the information technology initiatives for the <strong>Tata</strong> <strong>Motors</strong><br />
Group, recorded an overall revenue growth of 16.7% in revenue from sale of products and services, from `1,070 crores in 2009-10 to<br />
`1,249 crores in <strong>2010</strong>-<strong>11</strong>. Due to stringent cost control, focus on operating efficiencies and offshoring, the operating profit registered<br />
an increase of 48.3% over last year, while profit before taxes grew at a rate of 42.8% on a year-on-year basis. Profit after taxes grew by<br />
52.8% during the same period.<br />
During this period, services revenue increased by 12.1% and product sales increased by 29.6% over last year to reach figures of<br />
`882 crores and `367 crores, respectively. The services revenue comprises Engineering Automation Group [EAG], Enterprise Solutions<br />
Group [ESG] and Product Lifecycle Management [PLM]. EAG addresses the engineering and design needs of manufacturers through<br />
services for all stages of the product development and manufacturing process. ESG addresses the Information Technology needs<br />
of manufacturers including business solutions, strategic consulting, ERP implementation, systems integration, IT networking and<br />
infrastructure solutions and program management. PLM addresses the product development technology solution requirements of<br />
manufacturers including end-to-end implementation of PLM technology, best practices and PLM consulting. PLM also includes the<br />
Company’s proprietary applications iGETIT® and iCHECKIT.<br />
Comments on Financial Performance on a Consolidated basis<br />
The sales net of excise duty on a consolidated basis, have recorded a growth of 33.1% in the year <strong>2010</strong>-<strong>11</strong> to `1,23,133.30 crores. The<br />
increase is mainly attributable to growth in revenue both at <strong>Tata</strong> <strong>Motors</strong> and Jaguar Land Rover business on the background of robust<br />
growth in automotive volumes. The automotive operation is the most significant segment, accounting for 99.3% and 96.9% for fiscal<br />
20<strong>11</strong> and <strong>2010</strong> respectively, of its total revenues. For fiscal 20<strong>11</strong>, revenue from automotive operations before inter segment eliminations<br />
was `1,22,243.65 crores as compared to `89,615.07 crores for fiscal <strong>2010</strong>. (A reference may be made to review of performance of TML<br />
and Jaguar Land Rover business discussed above).<br />
The following table sets forth selected consolidated financial information for the Company, including as a percentage of turnover net of<br />
excise duty, for the year ended March 31, 20<strong>11</strong> and <strong>2010</strong>:-<br />
27
Sixty-sixth annual report <strong>2010</strong>-20<strong>11</strong><br />
<strong>Tata</strong> <strong>Motors</strong> Limited<br />
Percentage of Turnover<br />
<strong>2010</strong>-<strong>11</strong> 2009-10<br />
Turnover net of excise duty 100.0 100.0<br />
Expenditure:<br />
- Material (including change in stock and processing charges) 65.1 67.4<br />
- Employee Cost 7.6 9.5<br />
- Manufacturing and other expenses 17.5 18.8<br />
- Expenditure transferred to capital and other accounts (4.7) (5.0)<br />
Total Expenditure 85.5 90.8<br />
Other Income 0.1 1.9<br />
Profit before Exceptional Item, Depreciation, Interest and Tax 14.6 <strong>11</strong>.2<br />
Depreciation (including product development expenditure) 4.6 4.7<br />
Interest and Discounting Charges (Net) 1.7 2.4<br />
Exceptional item – (gain)/loss (0.2) 0.3<br />
Profit before Tax 8.5 3.8<br />
Material Cost (including change in stock and processing charges)<br />
<strong>2010</strong>-<strong>11</strong> 2009-10<br />
Consumption of raw materials and components 70,453.73 54,105.54<br />
Purchase of product for sale 10,390.84 8,538.52<br />
Processing Charges 1,172.48 878.99<br />
Change in Stock-in-trade and Work-in-progress (1,836.19) (1,148.67)<br />
Material (including change in stock and processing charges) 80,180.86 62,374.38<br />
The material cost has come down from 67.4% to 65.1% of net sales. The reduction is mainly attributable to Jaguar Land Rover operations<br />
which improved product mix, better price realization and continuous cost reduction initiatives. The raw material cost as a % to revenue<br />
has gone up during <strong>2010</strong>-<strong>11</strong>, mainly due to input cost not fully absorbed through pricing and marginally adverse price mix.<br />
Employee Cost<br />
While the employee cost has increased by `590.90 crores in absolute terms, as a % to net revenue it has come down from 9.5% to<br />
7.6% in the current year. The increase in the Company’s employee cost and other subsidiaries (excluding Jaguar Land Rover business)<br />
mainly relates to increase cost on account of normal yearly increases, performance payments, impact of wage revisions and on account<br />
of increased volumes. The increase in Jaguar Land Rover business mainly relates to higher pension costs, primarily due to volumes and<br />
two year wage settlement.<br />
Manufacturing and Other Expenses<br />
<strong>2010</strong>-<strong>11</strong> 2009-10 Change<br />
Expenses for manufacture, administration and selling<br />
(a) Stores, spare parts and tools consumed 1,189.24 1,050.61 138.63<br />
(b) Freight, transportation, port charges, etc. 2,436.93 2,050.44 386.49<br />
(c) Repairs to buildings 69.85 57.05 12.80<br />
(d) Repairs to plant, machinery, etc. 228.45 278.13 (49.68)<br />
(e) Power and fuel 851.60 689.45 162.15<br />
(f) Rent 104.72 106.71 (1.99)<br />
(g) Rates and taxes 192.58 181.63 10.95<br />
(h) Insurance 161.71 161.92 (0.21)<br />
(i) Publicity 4,089.95 2,974.18 1,<strong>11</strong>5.77<br />
(j) Incentive / Commission to dealers 868.13 595.57 272.56<br />
(k) Works operation and other expenses <strong>11</strong>,238.84 9,124.72 2,<strong>11</strong>4.12<br />
Expenses for manufacture, administration and selling 21,432.00 17,270.41 4,161.59<br />
Excise Duty on change in Stock-in-trade 139.05 86.95 52.10<br />
Total 21,571.05 17,357.36 4,213.69<br />
28
During the year manufacturing and other expenses increased to `21,571.05 crores from `17,357.36 crores for 2009-10. While the<br />
increases are mainly due to volumes, in terms of revenue, it has come down from 18.8% to 17.5% in the current year. The increase in<br />
stores, spare parts and tools consumed is due to higher level of production. The publicity expenses have increased mainly on account<br />
of new product introductions (Nano, Prima, New Jaguar XJ). The incentives / commission relates to the Company’s business, where the<br />
increase is mainly volume driven.<br />
The works operation and other expenses during the current year have come down to 9.1% from 9.9% of net revenue. There has been<br />
reduction in provision towards residual risk on vehicles sold by Jaguar Land Rover business. As may be seen from the above table,<br />
despite increase in volumes, the group has been in a position to contain costs at all levels.<br />
Expenditure transferred to capital and other accounts represents amounts allocated out of employee cost and other expenses<br />
towards the amounts capitalized mainly for product development. Expenditure transferred to capital and other accounts increased to<br />
`5,741.25 crores from `4,578.42 crores of 2009-10. The increase represents mainly new product development plans at the Company’s<br />
and Jaguar Land Rover, currently underway.<br />
Other Income decreased to `89.61 crores from `1,793.12 crores in 2009-10, mainly due to higher profit on sale of investments in<br />
previous year. The other income for 2009-10 included profit on sale of controlling stake in Telcon was `1,057.92 crores. The profit (net)<br />
on account of sale of other investments was `17.35 crores in <strong>2010</strong>-<strong>11</strong> as compared to `693.62 crores for 2009-10.<br />
Profit before Interest, Exceptional items and Tax has increased from `10,407.28 crores in 2009-10 to `17,869.58 crores in <strong>2010</strong>-<strong>11</strong>. The<br />
increase reflects significant turnaround during the year in the operations of Jaguar Land Rover business.<br />
Depreciation and Amortization (including product development expenditure): During <strong>2010</strong>-<strong>11</strong>, the expenditure has increased by<br />
28.1% to `5,618 crores from `4,385.33 crores in 2009-10. The increase in depreciation and amortization expenses of `1,232.67 crores<br />
represent impact on account of capitalization (mainly towards capacity and new products) at the Company’s including the effect of<br />
assets installed in the earlier years for which full effect has come in the current year. Further, there has been an increase in amortization<br />
of product development cost consequent to commencement of commercial production of new products mainly Prima, Nano, New XJ<br />
and other products. The increase is also attributable to product development expenditure written off during the year of `962.49 crores<br />
as compared to `498.20 crores in 2009-10.<br />
Net interest cost<br />
<strong>2010</strong>-<strong>11</strong> 2009-10 Change<br />
Interest and discounting charges<br />
Interest expenses 2,229.72 2,126.34 103.38<br />
Discounting charges 666.78 671.30 (4.52)<br />
Interest capitalized (5<strong>11</strong>.23) (332.32) (178.91)<br />
Interest received (339.85) (225.61) (<strong>11</strong>4.24)<br />
Interest expenses 2,045.42 2,239.71 (194.29)<br />
Net interest cost decreased by 8.7% to `2,045.42 crores from `2,239.71 crores of 2009-10. The Company has been successful in containing<br />
the costs through borrowings at lower rates and by substituting part of the borrowings through issue of equity. (Please refer to details<br />
given below of Gross debt). On the background of significant improvement in operations the net interest cost at Jaguar Land Rover was<br />
`153.32 crores in <strong>2010</strong>-<strong>11</strong> as compared to `328.83 crores in 2009-10.<br />
Exceptional Items<br />
<strong>2010</strong>-<strong>11</strong> 2009-10 Change<br />
Exchange Gain (Net) on revaluation of foreign currency borrowings, deposits and loans (231.01) (84.47) (146.54)<br />
Others - Loss - 344.07 (344.07)<br />
The Exceptional items – others for 2009-10, include (a) employee separation cost of `191.12 crores of Jaguar and Land Rover; (b)<br />
unamortised debt issue cost of `105.04 crores written off on prepayment of bridge loan for acquisition of Jaguar Land Rover business;<br />
and (c) provision for a product liability case at Jaguar Land Rover.<br />
Consolidated Profit before Tax (PBT) has increased to `10,437.17 crores in <strong>2010</strong>-<strong>11</strong> as compared to `3,522.64 crores in 2009-10,<br />
representing a positive swing of `6,914.53 crores. The entire increase is attributable to a remarkable improvement in the performance<br />
of Jaguar Land Rover business.<br />
29
Sixty-sixth annual report <strong>2010</strong>-20<strong>11</strong><br />
<strong>Tata</strong> <strong>Motors</strong> Limited<br />
Tax expense has increased to `1,216.38 crores in <strong>2010</strong>-<strong>11</strong> from `1,005.75 crores in 2009-10. The tax expense as a % to PBT was <strong>11</strong>.7%<br />
in <strong>2010</strong>-<strong>11</strong> as compared to 28.6% in 2009-10. The reduction in tax expense is mainly due to set-off of past tax losses at Jaguar Land<br />
Rover and benefits of R & D expenses at TML, which are eligible for weighted deduction. The tax expense is not comparable with the<br />
profit before tax, since it is consolidated on a line-by-line addition for each subsidiary company and no tax effect is recorded in respect<br />
of consolidation adjustments.<br />
Consolidated Profit after Tax (PAT) of the Group increased to `9,273.62 crores as compared to `2,571.06 crores in 2009-10.<br />
Consolidated Balance Sheet<br />
Fixed Assets<br />
As at March 31,<br />
20<strong>11</strong> <strong>2010</strong><br />
Change %<br />
Gross Fixed assets (including capital work in progress) 83,191.79 72,738.72 10,453.07 14.4<br />
Accumulated Depreciation 39,698.67 34,232.39 5,466.28 16.0<br />
Net Fixed assets 43,493.12 38,506.33 4,986.79 13.0<br />
Net Fixed Assets including Capital Work in Progress increased to `43,493.12 crores as at March 31, 20<strong>11</strong>, as compared to `38,506.33 crores<br />
as at March 31, <strong>2010</strong>. The gross fixed assets have increased by `10,453.07 crores. The increase mainly represents product development<br />
projects, both at the Company and Jaguar Land Rover and establishment of new facility for Nano and other capacity / new product plan<br />
of the Company.<br />
Investments increased to `2,544.26 crores as at March 31, 20<strong>11</strong> as compared to `2,219.12 crores as at March 31, <strong>2010</strong>. The movement<br />
(net) of `325.14 crores represents increase due to investments in shares by the Company and `101.35 crores by way of share of<br />
undistributed profit on associates.<br />
Net Current Assets<br />
As at March 31,<br />
20<strong>11</strong> <strong>2010</strong><br />
Change %<br />
Current Assets, Loans & Advances 51,034.92 42,445.64 8,589.28 20.2<br />
Current Liabilities (37,<strong>11</strong>4.65) (34,077.33) (3,037.32) 9.0<br />
Provisions (9,869.17) (7,643.50) (2,225.67) 29.1<br />
Net Current Assets 4,051.10 724.81 3,326.29 458.9<br />
Net Current Assets increased to `4,051.10 crores as at March 31, 20<strong>11</strong> from `724.81 crores as at March 31, <strong>2010</strong>. The increase in current<br />
assets represents – (a) increase in inventory by `2,758.48 crores, due to volumes (b) Cash and bank balances increased by `2,204.61<br />
crores due to surplus cash at Jaguar Land Rover business and unutilized proceeds of QIP issue of `505.00 crores; and (c) Loans and<br />
advances increased by `3,940.54 crores, which represents – (i) increase in vehicle financing activity to support the demand; (ii) net<br />
increase in receivable on account of Minimum Alternative Tax credit entitlement in future years; and (iii) increase in excise duty / VAT<br />
and other dues from the government.<br />
Current liabilities have increased due to increase in sundry creditors, reflecting the volume related changes more particularly in the<br />
last quarter. The increase in provisions represents mainly pension provisions at Jaguar Land Rover in view of change in actuarial<br />
assumptions.<br />
Gross debt (total of secured and unsecured loans) has reduced to `32,791.41 crores as at March 31, 20<strong>11</strong> as compared to `35,108.36<br />
crores as at March 31, <strong>2010</strong>.<br />
Net debt (gross debt reduced by available cash and bank balances and mutual fund investments) stood at `21,479.90 crores as at<br />
March 31, 20<strong>11</strong> as compared to `27,086.49 crores as at March 31, <strong>2010</strong>. The significant reduction in debt mainly relate improvement in<br />
operations, fund raising through Qualified Institutional Placement issue of `3,249.80 crores (net of issue expenses) and conversion of<br />
Foreign Currency Convertible Notes of `1,490.25 crores. Debt equity ratio is 1.71 as at March 31, 20<strong>11</strong> as compared to 4.28 as at March<br />
31, <strong>2010</strong>.<br />
30
Cash Flow<br />
The following table sets forth selected items from consolidated cash flow statement:<br />
Rs. in crores %<br />
<strong>2010</strong>-<strong>11</strong> 2009-10 Change<br />
Net Cash from Operating Activities <strong>11</strong>,240.15 8,997.13 24.9<br />
Profit for the year 9,273.62 2,571.06<br />
Adjustments to arrive at cash from operations 7,406.13 5,054.43<br />
Changes in working capital (4,048.40) 2,600.85<br />
Direct taxes paid (1,391.20) (1,229.21)<br />
Net Cash used in Investing Activities (7,065.67) (7,533.05) (6.2)<br />
Purchase of fixed assets (Net) (8,<strong>11</strong>2.77) (8,453.24)<br />
Net investments, short term deposit, margin money and loans given 706.06 (461.58)<br />
Proceeds from sale of stake in subsidiary - 1,159.50<br />
Investments in subsidiary companies (70.42) (56.30)<br />
Dividend and interest received 4<strong>11</strong>.46 278.57<br />
Net Cash (used in)/from in Financing Activities (1,401.29) 2,841.74 (149.3)<br />
Equity issuance (Net of issue expenses) 3,249.80 1,794.19<br />
Proceeds from issue of share to minority shareholders 5.19 54.50<br />
Dividend Paid (including paid to minority shareholders) (1,019.53) (349.57)<br />
Interest paid (2,469.07) (2,855.34)<br />
Net Borrowings (net of issue expenses) (1,167.68) 4,197.96<br />
Net increase in cash and cash equivalent 2,773.19 4,305.82 (35.6)<br />
Effect of exchange fluctuation on cash flows 259.61 (<strong>11</strong>5.86)<br />
Cash and bank balances on acquisition / sale of stake in subsidiaries (net) 2.47 (41.60)<br />
Cash and cash equivalent, beginning of the year 6,529.96 2,381.60<br />
Cash and cash equivalent, end of the year 9,565.23 6,529.96<br />
The cash generated from operations before working capital changes and before considering deployment in the vehicle financing<br />
business was `16,679.75 crores as compared to `7,625.49 crores in the previous year. After considering the impact of working capital<br />
changes and inflows on account of securitization of financing loan portfolio (net of deployment), the net cash generated from operations<br />
was `<strong>11</strong>,240.15 crores as compared to `8,997.13 crores in the previous year. The following factors contributed to change in working<br />
capital:<br />
• Increase in trade and other payables by `1,447.95 crores due to increase in manufacturing activity.<br />
which was partially offset by:<br />
• Increase in trade and other receivables amounting `731.52 crores due to increase in sales volumes.<br />
• Increase in inventories amounting `2,410.68 crores representing higher volumes/activity.<br />
• Increase in vehicle / loans and hire purchase receivables by `2,354.15 crores.<br />
31
Sixty-sixth annual report <strong>2010</strong>-20<strong>11</strong><br />
<strong>Tata</strong> <strong>Motors</strong> Limited<br />
The net cash outflow from investing activity reduced during the current year to `7,065.65 crores from `7,533.05 crores for the last year.<br />
• Net cash used for purchase of fixed assets was `8,<strong>11</strong>2.77 crores during the year as against `8,453.24 crores for the last year. The<br />
capital expenditure relates mainly to capacity expansion of our product facilities and product development costs for proposed / new<br />
product launches as well as on quality and reliability improvement projects.<br />
• During the year 2009-10, the Company sold 20% stake in Telcon, resulting in cash inflow of `1,159.50 crores.<br />
• Net cash inflow from sale / redemption of other investments is ` 7.44 crores in <strong>2010</strong>-<strong>11</strong> as compared to ` 958.56 crores in 2009-10.<br />
During 2009-10, the Company has sold part of its investment in <strong>Tata</strong> Steel.<br />
• During the year, the Company had invested `32.14 crores net, in mutual funds for parking of surplus cash, against of `979.55 crores<br />
in the last year.<br />
The net change in financing activity was outflow of `1,401.29 crores against net inflow `2,841.74 crores for last year.<br />
• In October <strong>2010</strong>, the Company raised `3,249.80 crores (net) by way of issue of shares through QIP (against `1,794.19 crores during<br />
the year 2009-10 by way of issue of GDS).<br />
• The net change in other borrowings during the year was a reduction by `1,167.68 crores as compared to increase of `4,197.96 crores<br />
during the last year.<br />
• The cash outflow on account of dividend increased to `1,019.53 crores from `349.57 crores.<br />
• The net cash outflow on account of interest reduced to `2,469.07 crores from `2,855.34 crores.<br />
Financial Performance as a measure of Operational Performance (on a standalone basis)<br />
Supported by its strong and distinct product offerings in both the commercial vehicle and passenger vehicle range, the Company‘s<br />
revenues have grown by 34.9% in <strong>2010</strong>-<strong>11</strong>. The operating margin decreased mainly due to increase in raw material cost and fixed<br />
marketing expenses. The Profit after tax of `1,812 crores was lower by 19% as compared to `2,240 crores in 2009-10 (during 2009-10,<br />
the Company recorded a profit of `1,802 crores on sale of investments which was partly set-off by a loss of `851 crores on redemption<br />
of preference shares in a subsidiary company).<br />
Percentage of Turnover<br />
<strong>2010</strong>-<strong>11</strong> 2009-10<br />
Turnover net of excise duty 100.0 100.0<br />
Expenditure:<br />
Material (including change in stock and processing charges) 74.4 71.7<br />
Employee Cost 4.8 5.2<br />
Manufacturing and other expenses (net) 10.9 <strong>11</strong>.4<br />
Total Expenditure 90.1 88.3<br />
Other Income 0.4 5.2<br />
Profit before Exceptional Item, Depreciation, Interest and Tax 10.3 16.9<br />
Depreciation (including product development expenses) 3.1 3.3<br />
Interest and Discounting Charges (Net) 2.4 3.1<br />
Exchange Loss (Net) on revaluation of foreign currency borrowings, deposits and loans 0.3 0.2<br />
Loss on redemption of investments in Preference Shares held in a subsidiary company - 2.4<br />
Profit before Tax 4.5 7.9<br />
Turnover net of excise duty: Turnover net of excise duties increased by 34.9% to `48,040.46 crores from `35,593.05 crores in 2009-<br />
10. The total number of vehicles sold during the year increased by 25.3% to 8,36,629 vehicles from 6,67,971 vehicles. The domestic<br />
volumes increased by 22.8% to 7,78,540 vehicles from 6,33,862 vehicles in 2009-10, while export volumes showed improvement and<br />
increased by 70.3% to 58,089 vehicles from 34,109 vehicles in 2009-10. Gross turnover from sale of vehicles, including export and other<br />
incentives, increased by 37.0% to `47,507.65 crores from `34,677.40 crores in 2009-10. Sale of spare parts for vehicles increased by 24.9%<br />
to `2,827.10 crores from `2,263.54 crores in 2009-10.<br />
32
Material (including change in stock and processing charges):<br />
<strong>2010</strong>-<strong>11</strong> 2009-10 Change %<br />
Consumption of raw materials and components 27,058.47 20,392.60 6,665.87 32.7<br />
Purchase of product for sale 7,363.13 4,513.23 2,849.90 63.2<br />
Processing Charges 1,676.07 1,212.90 463.17 38.2<br />
Change in Stock-in-trade and Work-in-progress (354.22) (606.63) 252.41 (41.6)<br />
Material (including change in stock and processing charges) 35,743.45 25,512.10 10,231.35 40.1<br />
Net Raw Material consumption including processing charges increased by 40.1% to `35,743.45 crores from `25,512.10 crores of<br />
2009-10, primarily due to increase in vehicle volumes. Material cost as a % of net turnover increased to 74.4% from 71.7% for 2009-10,<br />
mainly due to increase in input prices. Despite a steep increase in commodity prices during the year, the Company was able to contain<br />
the material cost through vigorous cost reduction programs.<br />
Employee Cost: The employee cost increased by 24.9% to `2,294.02 crores from `1,836.13 crores in 2009-10, due to normal yearly<br />
increases in the form of increments, promotions, wage agreement and increase in head count. However, as a % of the net turnover, the<br />
employee cost is reduced from 5.2% to 4.8%. The Company continues to focus on measures to manage employee cost on a long term<br />
basis.<br />
Manufacturing and Other Expenses: The Company continues to drive initiatives to contain costs to offset the volume effect<br />
and inflation. Thus, the manufacturing and other expenses, expressed as a percentage to net turnover were lower at 10.9% in<br />
<strong>2010</strong>-<strong>11</strong> as compared to <strong>11</strong>.4% in 2009-10. In absolute terms the expenses have increased to `5,231.68 crores in <strong>2010</strong>-<strong>11</strong> from `4,066.54<br />
crores in 2009-10. This increase is primarily due to higher volumes and increase in fixed marketing expenses to promote the new<br />
products.<br />
Other Income is significantly lower at `183.26 crores during the current year as compared to `1,853.45 crores in 2009-10. In 2009-10,<br />
other income included profit of `1,801.12 crores on sale of its investments.<br />
Profit before Exceptional Item, Depreciation, Interest and Tax decreased by 17.9% to `4,954.57 crores from `6,031.73 crores in<br />
2009-10. The decrease is mainly due to lower other income as explained above and a lower operating margin.<br />
Depreciation and amortization (including product development expenses) increased by 24.5% to `1,466.94 crores from `1,177.90<br />
crores in 2009-10. The increase reflects, impact on account of additions to fixed assets towards plant and facilities for expansion and<br />
new products introduction, mainly production facility at Sanand and new product introductions. Further, there has been increase in<br />
amortization relating to capitalization of product development cost for products launched in recent years.<br />
Net interest cost marginally increased to `1,143.99 crores from `1,103.84 crores in 2009-10. The borrowings have decreased consequent<br />
to substitution of funds raised by issue of shares through Qualified Institutional Placement (QIP). Despite increase in capex and working<br />
capital during the year, the Company managed to restrict the borrowing cost through infusion of equity funds and reduction in<br />
borrowing rates.<br />
Exceptional Items: During 2009-10, TML Holdings Pte. Ltd., Singapore, a wholly owned subsidiary, had redeemed preference shares of<br />
the face value of US$ 195.1 million at a discount of US$ 189.2 million. Consequent to the redemption, the Company recognized a loss<br />
of `850.86 crores.<br />
Profit Before Tax (PBT) of the Company of `2,196.52 crores represented 4.5% of net revenues in <strong>2010</strong>-<strong>11</strong> as compared to PBT of<br />
`2,829.54 crores representing 7.9% of net revenues in 2009-10. PBT in 2009-10, included profit on sale of investment of `1,801.12 crores,<br />
which was partly netted off by loss on redemption of preference shares in a wholly owned subsidiary of `850.86 crores.<br />
Tax expenses decreased to `384.70 crores from `589.46 crores in 2009-10. The effective tax rate for <strong>2010</strong>-<strong>11</strong> is 17.5% of PBT as compared<br />
to 20.8% for 2009-10. The reduction is due to increase in tax benefits during the year.<br />
Profit After Tax (PAT) of the Company decreased by 19.1% to `1,8<strong>11</strong>.82 crores from `2,240.08 crores in 2009-10. Basic Earnings per<br />
Share (EPS) decreased to `30.28 as compared to `42.37 in the previous year for Ordinary Shares and `30.78 as compared to `42.87<br />
for ‘A’ Ordinary Shares in the previous year. The lower EPS reflects the lower PAT over a higher equity base in <strong>2010</strong>-<strong>11</strong> as compared to<br />
2009-10.<br />
33
Sixty-sixth annual report <strong>2010</strong>-20<strong>11</strong><br />
<strong>Tata</strong> <strong>Motors</strong> Limited<br />
Balance Sheet<br />
Fixed Assets<br />
As at March 31,<br />
20<strong>11</strong> <strong>2010</strong><br />
Change %<br />
Gross Fixed Assets (including capital work in progress) 25,941.88 23,648.96 2,292.92 9.7<br />
Depreciation 8,466.25 7,212.92 1,253.33 17.4<br />
Total 17,475.63 16,436.04 1,039.59 6.3<br />
The gross fixed assets including Capital Work in Progress increased to `25,941.88 crores as at March 31, 20<strong>11</strong> as compared to `23,648.96<br />
crores as at March 31, <strong>2010</strong>. After considering the depreciation, the net block at `17,475.63 crores as at March 31, 20<strong>11</strong>, reflected<br />
an increase of `1,039.59 crores. additions during the year are `2,292.92 crores (net), which included, Nano plant at Sanand, product<br />
development cost mainly for Winger Ambulance, Aria and other regulatory projects and other capex towards capacity for the new<br />
products, balancing equipments etc.<br />
Investments increased marginally to `22,624.21 crores as at March 31, 20<strong>11</strong>, as compared to ` 22,336.90 crores as at March 31, <strong>2010</strong>.<br />
Net Current Assets<br />
As at March 31,<br />
20<strong>11</strong> <strong>2010</strong><br />
Change %<br />
Current Assets 14,090.61 <strong>11</strong>,506.61 2,584.00 22.5<br />
Current Liabilities (13,032.53) (14,609.16) 1,576.63 -10.8<br />
Provisions (3,222.71) (2,763.43) (459.28) 16.6<br />
Net Current Assets (2,164.63) (5,865.98) 3,701.35 -63.1<br />
Net current assets increased to `(2,164.63) crores as at March 31, 20<strong>11</strong> from `(5,865.98) crores as at March 31, <strong>2010</strong>. The increase is due<br />
to Current assets (a) increased inventories on account of volumes and strategic inventory; and (b) increased receivable in respect of sales<br />
to various State Transport Undertakings wherein payments are received after 60 to 90 days of billing. Current liabilities are lower due<br />
to decrease in tenure from 89 days to 75 days in respect of acceptances and reduction in redemption premium due to conversion of<br />
Foreign Currency Convertible Notes (FCCN).<br />
Gross debt (total of secured and unsecured loans) decreased to `15,898.75 crores as at March 31, 20<strong>11</strong> as compared to `16,594.54<br />
crores as at March 31, <strong>2010</strong>. During the year, the holders of FCCNs of US$ 327.06 million and JPY 30 million exercised their option to<br />
convert their FCCNs to shares.<br />
Net debt (gross debt reduced by available cash and bank balances and mutual fund investments) stood at `13,838.90 crores as at March<br />
31, 20<strong>11</strong> as compared to `14,930.96 crores as at March 31, <strong>2010</strong>.<br />
Cash Flow<br />
The net cash inflow from operations before adjustments for working capital changes and vehicle financing activity increased to<br />
`4,656.71 crores during the year from `4,168.78 crores. However, there was a net increase in working capital of `3,012.70 crores and<br />
decrease of `366.41 crores vehicle financing activity, which adversely impacted cash flow from operations by `5,396.90 crores. During<br />
the year, there has been an increase in the inventory of raw material and finished goods mainly on account of volumes and production<br />
imbalances due to supplier constraints. The receivables have gone up mainly on account of past dues from State Transport Undertakings.<br />
After considering the tax payments, the net cash from operating activity was `1,505.56 crores for <strong>2010</strong>-<strong>11</strong> as against `6,400.18 crores<br />
for the last year.<br />
The net cash outflow from investing activity reduced during the current year to `2,521.88 crores from `<strong>11</strong>,848.29 crores for the last year.<br />
During the last year, the Company sold `10,751.91 crores in subsidiary companies (mainly related to acquisition of Jaguar Land Rover<br />
business) and joint ventures. The investment in fixed assets (net) was `2,381.65 cores during the year as against `2,310.17 crores for the<br />
last year. During the year, the Company sold `437.28 crores in mutual funds for parking of surplus cash (during the last year, there was<br />
a net investment of `519.43 crores). During 2009-10, the Company sold shares/redeemed part of investments in subsidiaries and sold<br />
other investments, resulting in cash inflow of `2,144.31 crores.<br />
34
The net change in cash inflow on account of financing activity was `1,648.42 crores against `5,534.34 crores for last year. During the<br />
year, the Company raised `3,249.80 crores (net) by way of issue of shares through Qualified Institutional Placement against `1,794.19<br />
crores during the year 2009-10 by way of issue of GDS. The net change in other borrowings during the year was a reduction by `595.76<br />
crores as compared to increase of `5,474.53 crores during the last year. The cash outflow on account of dividend increased to `990.21<br />
crores from `344.90 crores. The net cash outflow on account of interest reduced to `1,206.93 crores from `1,389.48 crores. Thus, the cash<br />
outflow from financing activity has significantly reduced consequent to lower outflow on account of investing activity.<br />
Opportunities and Risks<br />
Opportunities<br />
Road development: Continued focus on development of road infrastructure is expected to have a positive thrust to automobile sales<br />
in the country. The near completion of the Golden Quadrilateral road project, the development under the North South East West road<br />
corridor project and other phases under the National Highway Development Programme, continue to provide a boost to growth of<br />
automobile sales. Additionally, the development under the Pradhan Mantri Gram Sadak Yojana (PMGSY), to construct and upgrade rural<br />
road networks is expected to result in higher rural penetration of vehicle sales. Improvement in road infrastructure will facilitate faster<br />
transportation of goods and passengers, and would in turn create a demand for safer, reliable and faster vehicles. With its wide range<br />
of goods and passenger transportation vehicles ranging from 0.75 Ton load carrier to large haulage tractors (49T) for goods movement,<br />
buses and coaches for public transportation and passenger cars and utility vehicles for personal transportation, the Company is poised<br />
to gain significantly from the initiatives on infrastructure development and the improved road infrastructure.<br />
Population Dividend and increase in income levels: With more than half of India's population less than 25 years of age, India has<br />
the youngest population in the world. India has a large work force with 64% of the population in the working age group of 19-64 years<br />
and is poised to be the largest contributor to the global workforce over the next few decades. With a significantly high proportion of<br />
youth population, India has a large consumer base for goods and services. Steady increase in working population and rise in disposable<br />
income will provide a demand impetus to automobile industry, both in terms of personal transportation as well as goods movement.<br />
Growing consumer culture: In India, with the continuous rise in disposable income, the demand for a better lifestyle continues<br />
to enhance consumption levels and rapid growth in several segments like lifestyle product, cellular phones and cable and satellite<br />
television. This growing consumerism is expected to lead to an increase in car penetration from the current levels of 8 per thousand<br />
towards the 500+ levels witnessed in the developed countries. The Company, with its broad based portfolio is expected to benefit from<br />
improved enviroment.<br />
Rural market growth: There has been continuing shift in rural spending in terms of its growth and it is less dependent on farm income.<br />
Income remittances from migrant rural population, increase in land prices and increase in non-farm activities such as trading and<br />
agro-processing are boosting non-farm income. The increase in prices of agricultural produce / products, and access to finance and<br />
institutional credit has brought greater wealth to rural households. Policy measures such as the National Rural Employment Guarantee<br />
Scheme (NREGS), which guarantees 100 days of employment to one member of every rural household, and increased government<br />
spending in rural areas, have helped to reduce rural under-employment and raised rural income levels. It is estimated that compared<br />
with 48% of motorcycles sales in the rural areas, only <strong>11</strong>% of cars/UVs sales are today contributed by the rural market, which indicates<br />
a potential growth opportunity in this market. The Company has offered affordable transport solutions and distribution channels to<br />
leverage the opportunities presented by this market.<br />
International Business: India continues to be a competitive source both in terms of quality and cost for the automotive industry<br />
globally, both for vehicles and components. India’s manufacturing base continues to benefit from these scale economies coupled with<br />
technology/quality improvements. The Company’s product portfolio in commercial vehicles and passenger cars and wide distribution<br />
channels enables the Company to take advantage of various opportunities in international business. The Company has also set up and<br />
is further exploring the setting up of manufacturing footprint overseas, which would combine these advantages with local operations<br />
and sourcing in these markets.<br />
Risks<br />
Hardening of interest rates and other inflationary trends: RBI continues with its monetary policy measures to curb inflation. RBI has<br />
stepped up policy rates 7 times during fiscal <strong>2010</strong>-<strong>11</strong> and again in May 20<strong>11</strong>, resulting in hardening of the repo rate by 225 bps to 7.25%<br />
and reverse repo by 275 bps to 6.75%. During the year, rising interest rates have compelled the banks to increase base rate, impacting<br />
borrowing costs for corporate sector, which has negative impact on the expansion of output and capacity expansion especially in the<br />
manufacturing sector. It will impact cooling down of demand side of the economy will affect the growth of EMI driven products and<br />
also impact profit margins of the corporate sector. Further hardening of consumer interest rates could have an adverse impact on the<br />
automotive industry, mainly in terms of interest cost on automotive loans. Inflation could also have a negative impact on growth and<br />
consequently on automobile sales in the domestic market.<br />
35
Sixty-sixth annual report <strong>2010</strong>-20<strong>11</strong><br />
<strong>Tata</strong> <strong>Motors</strong> Limited<br />
Fuel Prices: The Brent crude prices surged from an average of US$ 75 a barrel during May – September <strong>2010</strong>, to US$ 123 a barrel in<br />
April 20<strong>11</strong>. The Government has partly deregulated petrol prices and diesel / cooking gas continues to be subsidized. The fuel<br />
price continues to impact inflation and Government finances. Further, higher fuel prices force the consumers to think of alternative<br />
transportation solutions or defer purchases. The Company’s product programmes encompass initiatives to improve fuel efficiency of its<br />
products and investing in programmes for development of alternative solutions. The Kirit Parikh committee recommendations that the<br />
retail prices of petrol and diesel to be market determined and that an additional excise duty of `80,000 per car to be levied on diesel<br />
cars if implemented, could adversely impact demand.<br />
Input Costs: Input costs on account of commodities like steel, non-ferrous, precious metals, rubber and petroleum products have risen<br />
over the year and resulted in higher input costs. While the Company continues to pursue cost reduction initiatives, rises in commodity<br />
prices and other costs resulting from inflationary pressures, could impact the Company’s profitability to the extent that the same are not<br />
absorbed by the market through price increases and/or could have a negative impact on the demand. In addition, because of intense<br />
price competition and the high level of fixed costs, the Company may not be able to adequately address changes in commodity prices<br />
even if they are foreseeable.<br />
Environmental and other Government Regulations: Stringent emission norms and safety regulations could bring new complexities<br />
and cost increases for automotive industry, impacting the Company’s business. WTO, Free Trade Agreements and other similar policies<br />
could make the market more competitive for local manufacturers.<br />
In the international markets, most of the countries have stricter norms of regulations related to emission, safety, noise, technology etc.<br />
These factors may impact demand of the Company’s products in international markets. The Company competes with international<br />
players, established in those markets which have a global brand image, larger financial capability and multiple product platforms.<br />
To comply with current and future environmental norms, the Company may have to incur additional capital expenditure and R&D<br />
expenditure to upgrade products and manufacturing facilities, which would have an impact on the Company’s cost of production<br />
and the results of operations and may be difficult to pass through to its customers. If the Company is unable to develop commercially<br />
viable technologies within the time frames set by the new standards, the Company could face significant civil penalties or be forced to<br />
restrict product offerings drastically to remain in compliance. Moreover, meeting government mandated safety standards is difficult and<br />
costly because crash worthiness standards tend to conflict with the need to reduce vehicle weight in order to meet emissions and fuel<br />
economy standards.<br />
Global Competition: India being the second fastest growing economy in the world, continues to be an attractive destination for the<br />
global automotive players. The global automotive manufacturers present in India have been expanding their product portfolio and<br />
enhancing their capacities in India. To counter the threat of growing global competition, the Company continues to intensify its drive to<br />
improve quality and product offering, while maintaining its low cost product development/sourcing advantage.<br />
Further, the global automotive industry, including the premium passenger car segment, is highly competitive and competition is likely<br />
to further intensify in view of the continuing globalisation and consolidation in the worldwide automotive industry. There is a strong<br />
trend among market participants in the premium automotive industry towards intensifying efforts to retain their competitive position<br />
in established markets while also developing a presence in more profitable and fast growing emerging markets, such as China. A range<br />
of factors affect the competitive environment, including, among other things, quality and features of vehicles, innovation, development<br />
time, ability to control costs, pricing, reliability, safety, fuel economy, environmental impact and perception thereof, customer service and<br />
financing terms.<br />
To counter the threat of growing global competition, the Company continues to intensify its drive to improve quality and product<br />
offering while maintaining its low cost product development/sourcing advantage.<br />
Exchange Rates: The Company’s operations are subject to risk arising from fluctuations in exchange rates with reference to countries<br />
in which it operates. These risks primarily relate to fluctuations of Pound to US Dollar, Japanese Yen, Renminbi, Russian Ruble and Euro,<br />
and fluctuations of Indian Rupee against Pound, US Dollar and Euro.<br />
The Company imports capital equipment, raw materials and components and also sells vehicles in various countries. These transactions<br />
are denominated in foreign currencies, primarily the U.S. dollar and Euro. Moreover, the Company has outstanding foreign currency<br />
denominated debt and hence it is sensitive to fluctuations in foreign currency exchange rates. It has experienced and expects to<br />
continue to experience foreign exchange losses and gains on obligations denominated in foreign currencies in respect of its borrowings<br />
and foreign currency assets and liabilities due to currency fluctuations. Although the Company engages in currency hedging as per its<br />
policy, in order to decrease its foreign exchange exposure, the weakening of rupee against the dollar or other major foreign currencies<br />
may have an adverse effect on its cost of borrowing and consequently may increase its financing costs, which could have a significant<br />
adverse impact on the results of operations<br />
36
New Project Execution: Intensifying competition, reducing product life cycles and breadth of the Company’s product portfolio,<br />
necessitates the Company to continuously invest in new products, upgrades and capacity enhancement programme. Though the<br />
Company employs sophisticated techniques and processes to forecast the demand of new products yet the same is subject to margin<br />
of error. Timely introduction of new products, their acceptance in the market place and managing the complexity of operations across<br />
various manufacturing locations, would be the key to sustain competitiveness.<br />
Deterioration in global economic conditions: The impact of the recent global financial crisis continues to be a cause of concern<br />
despite concerted efforts to contain the adverse impact of these events on global recovery.<br />
The Indian automotive industry is affected substantially by the general economic conditions in India and around the world. The demand<br />
for automobiles in the Indian market is influenced by factors including the growth rate of the Indian economy, easy availability of credit,<br />
and increase in disposable income among Indian consumers, interest rates, freight rates and fuel prices. During the global financial<br />
crisis, the Reserve Bank of India (RBI) had eased its monetary policy stance to stimulate economic activity. Subsequently, as the Indian<br />
economy started recovering from the downturn, inflation pressures increased substantially and despite several interest rate hikes,<br />
inflation continues to be high. The trends of higher inflation, muted industrial growth and rising interest rates are expected to pose<br />
downside risks to overall growth. The automotive industry in general is cyclical and economic slowdowns in the past have affected the<br />
manufacturing sector including the automotive and related industries. Deterioration in key economic factors such as growth rate, interest<br />
rates and inflation as well as reduced availability of financing for vehicles at competitive rates may adversely affect our automotive sales<br />
in India and results of operations.<br />
Jaguar and Land Rover business has significant presence in the UK, North America and Continental Europe and has operations in many<br />
major countries across the globe. The Company also has automotive operations in South Korea, Spain and Thailand. The global economic<br />
downtown significantly impacted the global automotive markets, particularly in the United States and Europe, where Jaguar Land Rover<br />
business have significant sales exposure. The Company’s strategy, which includes new product launches and expansion into growing<br />
markets such as China, Russia and Brazil, may not be sufficient to mitigate the decrease in demand for its products in established<br />
markets and this could have a significant adverse impact on the financial performance. In response to the recent economic slowdown,<br />
the Company further intensified efforts to review and realign cost structure such as reducing manpower costs and other fixed costs.<br />
Further, Jaguar Land Rover business is exploring opportunities to reduce breakeven levels through increased sourcing of materials from<br />
low cost countries, reduction in number of suppliers, reduction in number of platforms, reduction in engineering change costs, increased<br />
use of off-shoring and several other initiatives. Although consumer sentiments have improved in many developed markets since late<br />
2009, if industry demand softens because of a major debt crisis, negative economic growth in key markets or other factors, the results<br />
of operations and financial condition could be substantially and adversely affected.<br />
Increase in costs, or disruption in the supply, of vehicle parts from natural disasters: The recent earthquake and tsunami in Japan<br />
and their aftermath have created significant economic uncertainty in that country, the effects of which are largely not yet assessable.<br />
Since the earthquake, the Company has observed a significant drop in commercial activity in Japan, and it believes that the economic<br />
activity in the country may be generally disrupted for a substantial period of time. Some of the Jaguar Land Rover‘s vehicles use raw<br />
materials, pre-products and vehicle parts that are sourced from Japan, including microchips. The recent natural disasters in that country<br />
have caused some Japanese suppliers to halt, delay or reduce production, which could reduce or disrupt the supply of such raw materials,<br />
pre-products and vehicle parts and / or an increase in their cost. Substantial increases in the costs or a significant delay or sustained<br />
interruption in the supply of key inputs sourced from Japan could adversely affect the Jaguar Land Rover‘s ability to maintain the<br />
current and expected levels of production.<br />
Changes in tax, tariff or fiscal policies: Imposition of any additional taxes and levies designed to limit the use of automobiles could<br />
adversely affect the demand for the Company‘s vehicles and the results of operations. Changes in corporate and other taxation policies<br />
as well as changes in export and other incentives given by various governments or import or tariff policies could also adversely affect<br />
the Company’s results of operations. Such government actions may be unpredictable and beyond the Company’s control, and any<br />
adverse changes in government policy could have a material adverse effect on its business prospects, results of operations and financial<br />
condition.<br />
Political instability, wars, terrorism, multinational conflicts, natural disasters, fuel shortages / prices, epidemics, labour strikes:<br />
The Company’s products are exported to a number of geographical markets and the Company plans to expand international operations<br />
further in the future. Consequently, the Company is subject to various risks associated with conducting the business both within and<br />
outside the domestic market and the operations may be subject to political instability, wars, terrorism, regional and / or multinational<br />
conflicts, natural disasters, fuel shortages, epidemics and labour strikes. In addition, conducting business internationally, especially<br />
in emerging markets, exposes the Company to additional risks, including adverse changes in economic and government policies,<br />
unpredictable shifts in regulation, inconsistent application of existing laws and regulations, unclear regulatory and taxation systems<br />
and divergent commercial and employment practices and procedures.<br />
37
Sixty-sixth annual report <strong>2010</strong>-20<strong>11</strong><br />
<strong>Tata</strong> <strong>Motors</strong> Limited<br />
Product liability, warranty and recall: The Company is subject to risks and costs associated with product liability, warranties and recalls<br />
in connection with performance, compliance or safety related issues affecting its vehicles. The Company spends considerable resources<br />
in connection with product recalls and these resources typically include the cost of the part being replaced and the labour required<br />
to remove and replace the defective part. In addition, product recalls can cause consumers to question the safety or reliability of the<br />
Company’s vehicles and harm its reputation. Any harm to the reputation of any one of the Company’s models can result in a substantial<br />
loss of customers.<br />
Furthermore, the Company may also be subject to class actions or other large scale product liability or other lawsuits in various<br />
jurisdictions in which it has a significant presence. The use of shared components in vehicle production increases this risk because<br />
individual components are deployed in a number of different models across brands. Any costs incurred or lost sales caused by product<br />
liability, warranties and recalls could materially adversely affect the business.<br />
Jaguar Land Rover Pension obligations: The Company provides post-retirement and pension benefits to its employees, some of<br />
which are defined benefit plans. The pension liabilities are generally funded and the pension plan assets are particularly significant.<br />
As part of its Strategic Business Review process, the Company closed the Jaguar Land Rover defined benefit pension plan to<br />
new joiners as at April 19, <strong>2010</strong>. All new employees in the operations from April 19, <strong>2010</strong> have joined a new defined contribution pension<br />
plan.<br />
Lower return on pension fund assets, changes in market conditions, changes in interest rates, changes in inflation rates and adverse<br />
changes in other critical actuarial assumptions, may impact its pension liabilities and consequently increase funding requirements,<br />
which will adversely affect the Company’s financial condition and results of operations.<br />
Automobile financing business: The Company is subject to risks associated with its automobile financing business. Any defaults by the<br />
customers or inability to repay instalments as due, could adversely affect the business, results of operations and cash flows. In addition,<br />
any downgrades in the Company’s credit ratings may increase the borrowing costs and restrict the access to the debt markets. Over<br />
time, and particularly in the event of any credit rating downgrades, market volatility, market disruption, regulatory changes or otherwise,<br />
the Company may need to reduce the amount of financing receivables it originates, which could adversely affect the ability to support<br />
the sale of vehicles.<br />
Underperformance of distribution channels and supply chains: The Company’s products are sold and serviced through a network<br />
of authorized dealers and service centers across the domestic market, and a network of distributors and local dealers in international<br />
markets. The Company monitor the performance of its dealers and distributors and provide them with support to enable them to<br />
perform to the expectations. Any under performance by the dealers or distributors could adversely affect our sales and results of<br />
operations. The Company relies on third parties to supply the raw materials, parts and components used in the manufacture of our<br />
products. Furthermore, for some of these parts and components, the Company are dependent on a single source. The Company’s ability<br />
to procure supplies in a cost effective and timely manner is subject to various factors, some of which are not within its control. While<br />
the Company manages supply chain as part of its vendor management process, any significant problems with supply chain in the future<br />
could affect results of operations in an adverse manner.<br />
Adverse economic conditions, decline in automobile demand, lack of access to sufficient financing arrangements could have a negative<br />
financial impact on the suppliers and distributors in turn impairing timely availability of components to the Company, while impairments<br />
to the financial condition of distributors may impact the performance in some markets. In addition, if one or more of the other global<br />
automotive manufacturers were to become insolvent, this would have an adverse impact on the supply chains and may further affect<br />
results of operations in an adverse manner.<br />
In respect of Jaguar Land Rover business, as part of a separation agreement from Ford, the Company has entered into supply agreements<br />
with Ford and certain other third parties for critical components. Any disruption of such transitional services could have a material<br />
adverse impact on operations and financial condition.<br />
Labour unrest: All of the Company’s permanent employees, other than officers and managers, in India and most of the permanent<br />
employees in South Korea and the United Kingdom, including certain officers and managers, in relation to automotive business, are<br />
members of labour unions and are covered by wage agreements, where applicable with those labour unions.<br />
In general, the Company considers labour relations with all of employees to be good. However, in the future the Company may be<br />
subject to labour unrest, which may delay or disrupt the operations in the affected regions, including the acquisition of raw materials<br />
and parts, the manufacture, sales and distribution of products and the provision of services. If work stoppages or lock-outs at the<br />
facilities or at the facilities of the major vendors occur or continue for a long period of time, the business, financial condition and results<br />
of operations may be adversely affected.<br />
38
Outlook<br />
As per RBI Monetary Policy statement in May 20<strong>11</strong>, the global recovery is likely to sustain in 20<strong>11</strong>(calendar year) and global growth is<br />
expected to moderate to 4.4% as compared to 5% in <strong>2010</strong>. Real GDP growth estimated at 8.6% during <strong>2010</strong>-<strong>11</strong>, is likely to moderate at<br />
8% during 20<strong>11</strong>-12. The moderation is expected on the background of higher oil and commodity prices and the automotive industry<br />
will have similar moderation more particularly due to higher interest rate on vehicle loans. Key markets for Jaguar Land Rover such as<br />
China, Russia and Middle East are expected to grow, while UK, USA, Rest of Europe are expected to grow moderately.<br />
Rising commodity prices among other factors are likely to drive up input costs thereby putting margins under pressure. The competition,<br />
in both commercial and passenger vehicle segments, is expected to intensify going forward.<br />
On the above background, the Company will continue to focus on retaining its advantage of market reach and penetration. The<br />
Company will continue to introduce new products, variants and fuel efficient products. These will offer superior value to the customers<br />
and improve the Company’s market position. Aggressive cost reduction will be accentuated by the Company to offset the increase in<br />
input costs and at the same time review pricing actions.<br />
The Company will also aggressively pursue opportunities in the International markets as a part of its internationalization drive including<br />
evaluation of possible overseas manufacturing.<br />
The Company will aggressively market its products in the domestic and export markets. The Company will continue its actions on<br />
increasing the reach and penetration for the Nano through expansion of channels and campaigns. It will also continue to work with host<br />
of financiers to ensure the availability of finance for all the customer segments.<br />
Jaguar Land Rover will continue to focus on profitable volume growth, managing costs, improving efficiencies to sustain the growth<br />
momentum and continuous sustainable investments in technology and products. It will also focus on increasing its presence in the<br />
growth markets such as China, Russia, India and Brazil along with launching new products and variants.<br />
Internal Control Systems and their adequacy<br />
The Company has in place an adequate system of internal controls. It has documented procedures covering all financial and operating<br />
functions. These controls have been designed to provide a reasonable assurance with regard to maintaining of proper accounting<br />
controls, monitoring of operations, protecting assets from unauthorized use or losses, compliances with regulations and for ensuring<br />
reliability of financial reporting. The Company has continued its efforts to align all its processes and controls with global best practices<br />
in these areas as well.<br />
Some significant features of the internal control systems are:<br />
• Corporate policies on accounting and major processes;<br />
• Well-defined processes for formulating and reviewing annual and long term business plans;<br />
• Preparation and monitoring of annual budgets for all operating and service functions;<br />
• State-of-the-art ERP, Supplier Relations Management and Customer Relations Management, connect its different locations, dealers<br />
and vendors for efficient and seamless information exchange;<br />
• An on-going program for reinforcement of the <strong>Tata</strong> Code of Conduct. The Code covers integrity of financial reporting, ethical conduct,<br />
regulatory compliance, conflict of interests review and reporting of concerns. All employees of the Company are regularly exposed<br />
to communications under this program;<br />
• Bi-monthly meeting of the Management Committee at apex level to review operations and plans in key business areas;<br />
• A well established multi-disciplinary Internal Audit team, which reviews and reports to management and the Audit Committee about<br />
the compliance with internal controls and the efficiency and effectiveness of operations and the key process risks;<br />
• Audit Committee of the Board of Directors, comprising independent directors, which is functional since August 1988, regularly<br />
reviews the audit plans, significant audit findings, adequacy of internal controls, compliance with Accounting Standards as well as<br />
reasons for changes in accounting policies and practices, if any;<br />
• A comprehensive information security policy and continuous upgrades to IT system;<br />
• Documenting major business processes and testing thereof including financial closing, computer controls and entity level controls<br />
as part of compliance with Sarbanes-Oxley Act;<br />
39
Sixty-sixth annual report <strong>2010</strong>-20<strong>11</strong><br />
<strong>Tata</strong> <strong>Motors</strong> Limited<br />
• Anti-fraud programme.<br />
The Board takes responsibility for the total process of risk management in the organisation. The Audit Committee reviews reports<br />
covering operational, financial and other business risk areas. Through an Enterprise Risk Management programme, each Business Unit<br />
addresses opportunities and the attendant risks through an institutionalized approach that is aligned to the Company’s objectives. This<br />
is also facilitated by internal audit. The business risk is managed through cross functional involvement and intense communication<br />
across businesses. Results of the risk assessment and residual risks are presented to the senior management.<br />
Material Developments in Human Resources/Industrial Relations<br />
A cordial industrial relations environment prevailed at all the manufacturing units of the Company during the year. The permanent<br />
employees‘ strength of the Company (standalone) was 26,214 and of the <strong>Tata</strong> <strong>Motors</strong>’ Group (consolidated) was 53,151 as on March 31,<br />
20<strong>11</strong>. The Company entered into a three year wage settlement with its Union at Jamshedpur through amicable process of negotiations.<br />
Jaguar Land Rover signed a landmark settlement deal with the Unions which would lead to the creation of new jobs in the next decade,<br />
including 1,500 jobs at its Halewood facility, Liverpool in 20<strong>11</strong>.<br />
CAUTIONARY STATEMENT<br />
Statements in the Management Discussion and Analysis describing the Company’s objective, projections, estimates, expectations may be<br />
“forward-looking statements” within the meaning of applicable securities laws and regulations. Actual results could differ materially from<br />
those expressed or implied. Important factors that could make a difference to the Company’s operations include, among others, economic<br />
conditions affecting demand /supply and price conditions in the domestic and overseas markets in which the Company operates, changes in<br />
the Government regulations, tax laws and other statutes and incidental factors.<br />
40
Report on Corporate Governance<br />
COMPANY'S PHILOSOPHY ON CORPORATE GOVERNANCE<br />
As part of the <strong>Tata</strong> group, the Company’s philosophy on Corporate Governance is founded upon a rich legacy of fair, ethical and<br />
transparent governance practices, many of which were in place even before they were mandated by adopting highest standards of<br />
professionalism, honesty, integrity and ethical behaviour. As a global organisation the Corporate Governance practices followed by the<br />
Company and its subsidiaries are compatible with international standards and best practices. Through the Governance mechanism in the<br />
Company, the Board alongwith its Committees undertake its fiduciary responsibilities to all its stakeholders by ensuring transparency,<br />
fairplay and independence in its decision making.<br />
The Corporate Governance philosophy has been further strengthened with the implementation, a few years ago, by the Company of the<br />
<strong>Tata</strong> Business Excellence Model as a means to drive excellence, the Balanced Scorecard methodology for tracking progress on long term<br />
strategic objectives and the <strong>Tata</strong> Code of Conduct which articulates the values, ethics and business principles and serves as a guide to<br />
the Company, its directors and employees and an appropriate mechanism to report any concern pertaining to non-adherence to the<br />
said Code and addressing the same is also in place. The Company is in full compliance with the requirements of Corporate Governance<br />
under Clause 49 of the Listing Agreement with the Indian Stock Exchanges (“the Listing Agreement”). The Company’s Depositary<br />
Programme is listed on the New York Stock Exchange and the Company also complies with US regulations as applicable to Foreign<br />
Private Issuers (non-US listed companies) which cast upon the Board of Directors and the Audit Committee, onerous responsibilities<br />
to improve the Company’s operating efficiencies. Risk management and internal control functions have been geared up to meet the<br />
progressive governance standards.<br />
As a good corporate governance practice, the Company has voluntarily undertaken an Audit by M/s Parikh & Associates, Practicing<br />
Company Secretaries, of the secretarial records and documents for the period under review in respect of compliance with the Companies<br />
Act, 1956, listing agreement with the Indian stock exchanges and the applicable regulations and guidelines issued by Securities and<br />
Exchange Board of India.<br />
BOARD OF DIRECTORS<br />
The Board of Directors alongwith its Committees provide leadership and guidance to the Company's management and directs, supervises<br />
and controls the performance of the Company. The Board currently comprises 13 Directors out of which eleven Directors (84.62%) are<br />
Non-Executive Directors. The Company has a Non-Executive Chairman and the seven Independent Directors comprise more than half<br />
the total strength of the Board. All the Independent Directors have confirmed that they meet the 'independence' criteria as mentioned<br />
under Clause 49 of the Listing Agreement.<br />
None of the Directors on the Company's Board is a Member of more than ten Committees and Chairman of more than five Committees<br />
(Committees being, Audit Committee and Investors' Grievance Committee) across all the companies in which he is a Director. All the<br />
Directors have made necessary disclosures regarding Committee positions held by them in other companies and do not hold the office<br />
of Director in more than fifteen public companies. None of the Directors of the Company is related to each other. All Non Executive<br />
Directors excluding the 'Steel' Director (<strong>Tata</strong> Steel representative), are liable to retire by rotation. The appointment of the Managing<br />
Directors, including the tenure and terms of remuneration are also approved by the members.<br />
The required information as enumerated in Annexure IA to Clause 49 of the Listing Agreement is made available to the Board of Directors<br />
for discussions and consideration at Board Meetings. The Board reviews the declaration made by the Managing Directors regarding<br />
compliance with all applicable laws on a quarterly basis as also steps taken to remediate instances of non compliance. The Managing<br />
Director & Group CEO, Managing Director - India Operations and Chief Financial Officer (CFO) have certified to the Board in accordance<br />
with Clause 49 V of the Listing Agreement pertaining to CEO and CFO certification for the Financial Year ended March 31, 20<strong>11</strong>.<br />
During the year under review, ten Board Meetings were held on April 27, <strong>2010</strong>, May 27, <strong>2010</strong>, June 28, <strong>2010</strong>, August 10, <strong>2010</strong>, August 25,<br />
<strong>2010</strong>, August 31, <strong>2010</strong>, October 22, <strong>2010</strong>, November 9, <strong>2010</strong>, February <strong>11</strong>, 20<strong>11</strong> and March 16, 20<strong>11</strong>. The maximum time-gap between<br />
any two consecutive meetings did not exceed four months. The composition of the Board, attendance at Board Meetings held during<br />
41
Sixty-sixth annual report <strong>2010</strong>-20<strong>11</strong><br />
<strong>Tata</strong> <strong>Motors</strong> Limited<br />
the Financial Year under review and at the last Annual General Meeting, number of directorships (including <strong>Tata</strong> <strong>Motors</strong>), memberships/<br />
chairmanships of the Board and Committees of public companies and their shareholding as on March 31, 20<strong>11</strong> in the Company are as<br />
follows:<br />
Name of the<br />
Director<br />
Director<br />
Indentification<br />
Number<br />
Category<br />
No. of<br />
Board<br />
Meetings<br />
attended<br />
in the<br />
year<br />
Attendance<br />
at the last<br />
AGM<br />
Directorships (1)<br />
Committee<br />
positions (2)<br />
Chairman Member Chairman Member Ordinary<br />
Shares<br />
Shareholding<br />
‘A’<br />
Ordinary<br />
Shares<br />
Ratan N <strong>Tata</strong> 00000001 Non-Executive Chairman 10 Yes 10 1 - - 187346 21836<br />
Ravi Kant 00016184 Non-Executive, Vice Chairman 10 Yes 3 3 - 1 - -<br />
J J Irani (3) 003<strong>11</strong>104 Non-Executive 9 Yes 4 7 - 2 4815 1300<br />
R Gopalakrishnan (4) 00027858 Non-Executive 5 Yes 2 7 - 5 3750 -<br />
N N Wadia 00015731 Non-Executive, Independent 5 No 3 5 - - - -<br />
S M Palia 0003<strong>11</strong>45 Non-Executive, Independent 9 Yes - 7 2 4 300 -<br />
R A Mashelkar 00074<strong>11</strong>9 Non-Executive, Independent 9 Yes 1 8 - 3 - -<br />
S Bhargava 00035672 Non-Executive, Independent 10 Yes 2 9 3 5 - -<br />
N Munjee 00010180 Non-Executive, Independent 10 Yes 1 14 4 5 - -<br />
V K Jairath 00391684 Non-Executive, Independent 9 Yes - 2 1 3 50 -<br />
R Sen 03043868 Non-Executive, Independent 8 Yes - 1 - - - -<br />
Ralf Speth (5) 03318908 Non-Executive 1 No - 1 - - - -<br />
Carl-Peter Forster 02986480 Managing Director & Group CEO 10 Yes 1 1 - - - -<br />
P M Telang 00012562 Managing Director - India Operations 10 Yes 3 7 - - 3180 500<br />
(1) excludes Directorships in private companies, foreign companies and associations (4) ceased to be a Director w.e.f. September 1, <strong>2010</strong><br />
(2) includes only Audit and Investors’ Grievance Committees (5) appointed as Additional Director w.e.f. November 10, <strong>2010</strong><br />
(3) <strong>Tata</strong> Steel Representative and would step down as Director w.e.f. June 2, 20<strong>11</strong><br />
as per Company’s retirement policy.<br />
THE COMMITTEES OF THE BOARD<br />
To focus effectively on the issues and ensure expedient resolution of diverse matters, the Board has constituted a set of Committees with<br />
specific terms of reference/scope. The Committees operate as empowered agents of the Board as per their Charter/terms of reference.<br />
Targets set by them as agreed with the management are reviewed periodically and mid-course corrections are also carried out. The<br />
Board of Directors and the Committees also take decisions by the circular resolutions which are noted at the next meeting. The minutes<br />
of the meetings of all Committees of the Board are placed before the Board for discussions/noting. The relationship between the Board,<br />
the Committees and the senior management functions is illustrated below.<br />
Shareholders<br />
Audit Committee<br />
Management<br />
Committee<br />
Operations<br />
Committee<br />
Board of Directors<br />
Managing Director & Group CEO<br />
Managing Director - India Operations<br />
Executive<br />
Committee of Board<br />
Remuneration<br />
Committee<br />
Head<br />
(Commercial<br />
Vehicles)<br />
Head<br />
(Passenger<br />
Car<br />
Operations)<br />
Head<br />
(Passenger<br />
Car<br />
Commercial)<br />
Head (ERC)<br />
Chief<br />
Financial<br />
Officer<br />
Nominations<br />
Committee<br />
Investors’ Grievance<br />
Committee<br />
Head (Corporate Planning)<br />
Head (Govt. Affairs & Collaboration)<br />
Head (PCBU-International Business)<br />
Head (CVBU-International Business)<br />
Chief (Strategic Sourcing)<br />
Head (Human Resource)<br />
Chief Internal Auditor<br />
cum Chief Ethic Counselor<br />
Head (Legal)<br />
Company Secretary<br />
Head (Corporate Communication)<br />
Ethics & Compliance<br />
Committee<br />
Special need based<br />
Committees<br />
42
AUDIT COMMITTEE<br />
The Audit Committee functions according to its Charter that defines its composition, authority, responsibility and reporting functions<br />
in accordance with the Companies Act, 1956, listing requirements and US regulations applicable to the Company and is reviewed from<br />
time to time. Whilst, the full Charter is available on the Company’s website, given below is a gist of the responsibilities of the Audit<br />
Committee:<br />
a. Reviewing the quarterly financial statements before submission to the Board, focusing primarily on:<br />
• Compliance with accounting standards and changes in accounting policies and practices;<br />
• Major accounting entries involving estimates based on exercise of judgment by Management;<br />
• Audit Qualifications and significant adjustments arising out of audit;<br />
• Analysis of the effects of alternative GAAP methods on the financial statements;<br />
• Compliance with listing and other legal requirements concerning financial statements;<br />
• Review Reports on the Management Discussion and Analysis of financial condition, results of Operations and the Directors’<br />
Responsibility Statement;<br />
• Overseeing the Company’s financial reporting process and the disclosure of its financial information, including earnings<br />
press release, to ensure that the financial statements are correct, sufficient and credible;<br />
• Disclosures made under the CEO and CFO certification and related party transactions to the Board and Shareholders.<br />
b. Reviewing with the management, external auditor and internal auditor, adequacy of internal control systems and recommending<br />
improvements to the management.<br />
c. Reviewing, with the management, the statement of uses/application of funds raised through an issue (public issue, rights issue,<br />
preferential issue, etc.), the statement of funds utilized for purposes other than those stated in the offer document/ prospectus/<br />
notice and the report submitted by the monitoring agency monitoring the utilisation of proceeds of a public or rights issue, and<br />
making appropriate recommendations to the Board to take up steps in this matter.<br />
d. Recommending the appointment/removal of the statutory auditor, cost auditor, fixing audit fees and approving nonaudit/consulting<br />
services provided by the statutory auditors’ firms to the Company and its subsidiaries; evaluating auditors’<br />
performance, qualifications and independence. It shall also ensure that the cost auditors are independent, have arm’s length<br />
relationship and are also not otherwise disqualified at the time of their appointment or during their tenure.<br />
e. Reviewing the adequacy of internal audit function, coverage and frequency of internal audit, appointment, removal, performance<br />
and terms of remuneration of the chief internal auditor.<br />
f. Discussing with the internal auditor and senior management significant internal audit findings and follow-up thereon.<br />
g. Reviewing the findings of any internal investigation by the internal auditor into matters involving suspected fraud or irregularity<br />
or a failure of internal control systems of a material nature and report the matter to the Board.<br />
h. Discussing with the external auditor before the audit commences, the nature and scope of audit, as well as conduct post-audit<br />
discussions to ascertain any area of concern.<br />
i. Reviewing the Company’s financial and risk management policies.<br />
j. Reviewing the functioning of the Whistle-Blower and the legal compliance mechanism.<br />
k. Reviewing the financial statements and investments made by subsidiary companies.<br />
l. Look into the reasons for any substantial defaults in payment to the depositors, debenture holders, shareholders (in case of nonpayment<br />
of declared dividend) and creditors, if any.<br />
m. Reviewing the effectiveness of the system for monitoring compliance with laws and regulations.<br />
n. Approving the appointment of CFO after assessing the qualification, experience and background etc of the candidate.<br />
43
Sixty-sixth annual report <strong>2010</strong>-20<strong>11</strong><br />
<strong>Tata</strong> <strong>Motors</strong> Limited<br />
During the year, the Committee reviewed key audit findings covering operational, financial and compliance areas. Management personnel<br />
presented their risk mitigation plan to the Committee. It also reviewed the internal control system in subsidiary companies, status on<br />
compliance of its obligations under the Charter and confirmed that it fulfilled its duties and responsibilities. The Committee through selfassessment<br />
annually evaluates its performance. The Chairman of the Audit Committee briefs the Board members about the significant<br />
discussions at Audit Committee meetings.<br />
The Committee comprises four Independent Directors, all of whom are financially literate and have relevant finance and/or audit<br />
exposure. Mr S M Palia is the financial expert. The quorum of the Committee is two members or one-third of its members, whichever is<br />
higher. The Chairman of the Audit Committee also attended the last Annual General Meeting of the Company. During the period under<br />
review, nine Audit Committee meetings were held on April 26, <strong>2010</strong>, May 26, <strong>2010</strong>, July 15, <strong>2010</strong>, August 9, <strong>2010</strong>, August 31, <strong>2010</strong>, October<br />
28, <strong>2010</strong>, November 4, <strong>2010</strong>, January 10, 20<strong>11</strong> and February 10, 20<strong>11</strong>. The composition of the Audit Committee and attendance at its<br />
meetings is as follows:<br />
Composition N Munjee (Chairman) S M Palia R A Mashelkar V K Jairath*<br />
Meetings attended 9 6 9 1<br />
* Appointed as member of Audit Committee on January 14, 20<strong>11</strong>.<br />
The Committee meetings are held at the Company’s Corporate Headquarters or at its plant locations and are usually attended by the<br />
Vice Chairman, Managing Director & Group CEO, Managing Director-India Operations, Chief Financial Officer, Chief Internal Auditor,<br />
Statutory Auditor and Cost Auditor. The Business and Operation Heads are invited to the meetings, as required. The Company Secretary<br />
acts as the Secretary of the Audit Committee. The Internal Audit function headed by the Chief Internal Auditor reports to the Audit<br />
Committee to ensure its independence.<br />
The Committee relies on the expertise and knowledge of management, the internal auditors and the independent Statutory Auditor in<br />
carrying out its oversight responsibilities. It also uses external expertise, if required. The management is responsible for the preparation,<br />
presentation and integrity of the Company’s financial statements including consolidated statements, accounting and financial reporting<br />
principles. The management is also responsible for internal control over financial reporting and all procedures are designed to ensure<br />
compliance with accounting standards, applicable laws and regulations as well as for objectively reviewing and evaluating the adequacy,<br />
effectiveness and quality of the Company’s system of internal control.<br />
Deloitte Haskins & Sells, Mumbai (Deloitte) (Registration Number <strong>11</strong>7366W) the Company’s independent Statutory Auditor, is responsible<br />
for performing an independent audit of the Financial Statements and expressing an opinion on the conformity of those financial<br />
statements with accounting principles generally accepted in India.<br />
REMUNERATION COMMITTEE<br />
The Remuneration Committee of the Company is empowered to review the remuneration of the Managing Director and the Executive<br />
Director, retirement benefits to be paid to them under the Retirement Benefit Guidelines approved by the Board, recommending on the<br />
amount and distribution of commission to the non-executive directors based on criteria fixed by the Board and to deal with matters<br />
pertaining to Employees’ Stock Option Scheme, if any.<br />
The Remuneration Committee comprises two Independent Directors (including the Chairman of the Committee) and two Non-Executive<br />
Directors. During the year under review, one Remuneration Committee meeting was held on May 27, <strong>2010</strong>. The decisions are taken by<br />
the Committee at meetings or by passing circular resolutions. The composition of the Remuneration Committee and attendance at its<br />
meeting is as follows:<br />
Composition N N Wadia (Chairman) Ratan N <strong>Tata</strong> S Bhargava Ravi Kant<br />
Meetings attended 1 1 1 1<br />
44
Remuneration Policy<br />
a. The remuneration of the Managing Directors is recommended by the Remuneration Committee based on criteria such as<br />
industry benchmarks, the Company’s performance vis-à-vis the industry, responsibilities shouldered, performance/track record,<br />
macro economic review on remuneration packages of heads of other organisations and is decided by the Board of Directors.<br />
The Company pays remuneration by way of salary, perquisites and allowances (fixed component), incentive remuneration and/or<br />
commission (variable components) to its Managing Directors. Annual increments are decided by the Remuneration Committee<br />
within the salary scale approved by the Members and are effective from April 1, annually.<br />
b. A sitting fee of `20,000/- for attendance at each meeting of the Board, Audit Committee, Executive Committee, Remuneration<br />
Committee and Nominations Committee and `5,000/- for Investors’ Grievance Committee, Ethics & Compliance Committee and Rights<br />
Committee is paid to its Members (excluding Managing Directors). The sitting fees paid/payable to the non-whole-time Directors<br />
is excluded whilst calculating the above limits of remuneration in accordance with Section 198 of the Act. The Company also<br />
reimburses out-of-pocket expenses to Directors attending meetings held at a city other than the one in which the Directors<br />
reside.<br />
c. The remuneration by way of commission to the non-executive directors is decided by the Board of Directors and distributed<br />
to them based on their participation and contribution at the Board and certain Committee meetings as well as time spent on<br />
matters other than at meetings. The Members had, at the Annual General Meeting held on July 24, 2008, approved the payment<br />
of remuneration by way of commission to the non-whole-time directors of the Company, of a sum not exceeding 1% per annum<br />
of the net profits of the Company, calculated in accordance with the provisions of the Act, for a period of 5 years commencing<br />
April 1, 2008.<br />
d. Remuneration of employees largely consists of basic remuneration, perquisites, allowances and performance incentives. The<br />
components of the total remuneration vary for different employee grades and are governed by industry patterns, qualifications<br />
and experience of the employee, responsibilities handled by him, his individual performances, etc. The annual variable pay of<br />
senior managers is linked to the Company’s performance in general and their individual performance for the relevant year is<br />
measured against specific major performance areas which are closely aligned to the Company’s objectives.<br />
The Directors’ remuneration and sitting fees paid/payable by the Company in respect of the Financial Year <strong>2010</strong>-<strong>11</strong>, are given below:<br />
Non-Executive Directors<br />
(` in Lakhs)<br />
Name Commission Sitting Fees Name Commission Sitting Fees<br />
Ratan N <strong>Tata</strong> (1) 200 3.20 R A Mashelkar 40 3.60<br />
Ravi Kant (2) 100 3.35 N Munjee 72 4.00<br />
J J Irani 26 2.20 S Bhargava 35 2.20<br />
R Gopalakrishnan (3) 10 1.50 V K Jairath 23 2.10<br />
N N Wadia 20 1.40 R Sen 18 1.60<br />
S M Palia 56 3.40 R Speth (4) - -<br />
(1) Apart from the above, Mr Ratan N. <strong>Tata</strong>, who was formerly the Executive Chairman of the Company is paid/provided `27.33 lakhs as retirement benefits as per Company’s<br />
policy.<br />
(2) Mr Ravi Kant, who was formerly the Managing Director of the Company is paid/provided `72.35 lakhs as retirement benefits as per Company’s policy. As advisor to the Company<br />
for overseeing Jaguar Land Rover operations of the Company, Mr Ravi Kant is entitled to a fee equivalent to GB£ 75,000 p.a. and use of a Company Car. Both of these are not<br />
included in the above.<br />
(3) Ceased to be a Director w.e.f. September 1, <strong>2010</strong>.<br />
(4) Dr Ralf Speth was appointed as a Non-Executive Director w.e.f. November 10, <strong>2010</strong>. In view of his appointment as Chief Executive Officer and Director of Jaguar Land Rover PLC,<br />
Dr Speth is not paid any commission or sitting fees for attending Board meetings of the Company.<br />
45
Sixty-sixth annual report <strong>2010</strong>-20<strong>11</strong><br />
<strong>Tata</strong> <strong>Motors</strong> Limited<br />
Managing Directors<br />
(` in Lakhs)<br />
Name Salary Perquisites &<br />
Allowances<br />
46<br />
Commission Retirement Benefits (1)<br />
Carl-Peter Forster 418.80 791.13 (2) – 50.26<br />
P M Telang 63.00 48.63 (3) 275 (4) 17.01<br />
(1) Excludes provision for encashable leave and gratuity as separate actuarial valuation is not available<br />
(2) Includes variable incentive and guaranteed bonus paid/payable<br />
(3) Includes leave encashment<br />
(4) Payable in FY 20<strong>11</strong>-12<br />
Service Contracts, Severance Fees and Notice Period<br />
Terms of Agreement Mr Carl-Peter Forster,<br />
Managing Director & Group CEO<br />
Mr P M Telang,<br />
Managing Director–India Operations<br />
Period of Contract April 1, <strong>2010</strong> to March 31, 2013 June 2, 2009 to June 21, 2012<br />
Severance fees Either party may terminate the appointment with effect<br />
to the end of a month upon written notice to the other<br />
party. In case the contract is terminated by Mr Forster,<br />
he will pay the Company 6 month’s basic salary. In<br />
case the contract is terminated by the Company, the<br />
Company will pay all salaries and benefits payable<br />
under the agreement for 3 years period. In the event<br />
Mr Forster takes up appropriate employment elsewhere,<br />
then the Company would pay 50% of basic salary and<br />
bonus entitlement for the remaining period. There is no<br />
separate provision for payment of Severance fees.<br />
The Contract may be terminated by either party giving<br />
the other party six months’ notice or the Company<br />
paying six months’ salary in lieu thereof. There is no<br />
separate provision for payment of Severance fees.<br />
Retirement Policy for Directors<br />
The Company has adopted the Guidelines for retirement age wherein Managing and Executive Directors retire at the age of 65 years<br />
whilst all the Non-Executive Directors retire at the age of 75 years. The Company has also adopted a Retirement Policy for Managing and<br />
Executive Directors which has also been approved by the Members of the Company, offering special retirement benefits including pension,<br />
ex-gratia, medical and other benefits. In addition to the above, the retiring Managing Director is entitled to residential accommodation<br />
or compensation in lieu of accommodation on retirement. The quantum and payment of the said benefits are subject to an eligibility<br />
criteria of the retiring director and is payable at the discretion of the Board in each individual case on the recommendation of the<br />
Remuneration Committee.<br />
INVESTORS’ GRIEVANCE COMMITTEE<br />
The Investors’ Grievance Committee comprises Mr S M Palia, Independent Director as the Chairman, Mr Ravi Kant, Vice Chairman and<br />
Mr V K Jairath*, Non-Executive Director. The Investors’ Grievance Committee of the Board is empowered to oversee the redressal of<br />
investors’ complaints pertaining to share/debenture transfers, non-receipt of annual reports, interest/dividend payments, issue of<br />
duplicate certificates, transmission (with and without legal representation) of shares and debentures matters pertaining to Company’s<br />
fixed deposit programme and other miscellaneous complaints. During the year under review, two Investors’ Grievance Committee<br />
meetings were held on September 1, <strong>2010</strong> and February <strong>11</strong>, 20<strong>11</strong>. The composition of the Investors’ Grievance Committee and attendance<br />
at its meeting is as follows:<br />
Composition S M Palia (Chairman) Ravi Kant R Gopalakrishnan # V K Jairath *<br />
Meetings attended 2 2 1 1<br />
# Ceased to be Member w.e.f. September 1, <strong>2010</strong> * Appointed w.e.f. October 18, <strong>2010</strong><br />
Compliance Officer<br />
Mr H K Sethna, Company Secretary, who is the Compliance Officer, can be contacted at:<br />
<strong>Tata</strong> <strong>Motors</strong> Limited, Bombay House, 24, Homi Mody Street, Mumbai - 400 001, India.<br />
Tel: 91 22 6665 8282, 91 22 6665 7824 / Fax: 91 22 6665 7260 / Email: inv_rel@tatamotors.com.
Complaints or queries relating to the shares can be forwarded to the Company’s Registrar and Transfer Agents – M/s TSR Darashaw Ltd.<br />
at csg-unit@tsrdarashaw.com, whereas complaints or queries relating to the public fixed deposits can be forwarded to the Registrars to<br />
the Fixed Deposits Scheme – M/s TSR Darashaw Ltd. at tmlfd@tsrdarashaw.com. (Registrars for Fixed Deposits w.e.f. February 1, 20<strong>11</strong>).<br />
The status on the total number of complaints received during the FY <strong>2010</strong>-<strong>11</strong> is as follows:<br />
Type<br />
Nos.<br />
Complaints regarding non-receipt of dividend/interest, shares lodged for transfer 221<br />
Complaints received from the shareholders through SEBI and other statutory bodies and resolved 66<br />
Complaints redressed out of the above 286<br />
Pending complaints as on 31.3.20<strong>11</strong> 1 (1)<br />
Other Queries received from shareholders and depositors and replied 15377<br />
(1)<br />
1 SEBI complaint was replied within 1-7 days but the same has been reflected as unresolved as on 31.03.20<strong>11</strong>, as per the condition for complete resolution defined by SEBI.<br />
All letters received from the investors are replied to and the response time for attending to investors’ correspondence during FY<strong>2010</strong>-<strong>11</strong><br />
is shown in the following table:<br />
Number %<br />
Total number of correspondence received during <strong>2010</strong>-20<strong>11</strong> 15664 100.00<br />
Replied within 1 to 4 days of receipt 104<strong>11</strong> 66.46<br />
Replied within 5 to 7 days of receipt 2493 15.92<br />
Replied within 8 to 15 days of receipt 2534 16.18<br />
Replied after 15 days of receipt (1) 82 0.52<br />
Received in last week of March 20<strong>11</strong> and replied in April 20<strong>11</strong> 144 0.92<br />
(1)<br />
These correspondence pertained to court cases which involved retrieval of case files, cases involving reterival of very old records, co-ordination with the Company/Advocates etc,<br />
partial documents awaited from the Investors, cases involving registration of legal documents, executed documents received for issue of duplicate certificates and transmission of shares<br />
without legal representation which involved checking of the documents, sending notices to Stock Exchange and issue of duplicate certificates/transmission of shares after approval<br />
from the Company. However, all these cases have been attended to within the statutory limit of 30 days.<br />
There were no pending share transfers and complaints pertaining to the Financial Year ended March 31, 20<strong>11</strong>. Out of the above, 147<br />
complaints pertained to letters received through Statutory/Regulatory bodies and those related to Court/Consumer forum matters,<br />
fraudulent encashment and non-receipt of dividend amounts.<br />
On recommendations of the Investors’ Grievance Committee, the Company has taken various investor friendly initiatives like sending<br />
reminders to investors who have not claimed their dues, launching an odd lot scheme, sending nominations forms etc. Critical feedback,<br />
complaints and suggestions received from investors are considered and addressed appropriately.<br />
OTHER COMMITTEES<br />
The Executive Committee of Board reviews capital and revenue budgets, long-term business strategies and plans, the organizational<br />
structure of the Company, real estate and investment transactions, allotment of shares and/or debentures, borrowing and other routine<br />
matters. The Committee also discusses the matters pertaining to legal cases, acquisitions and divestment, new business forays and<br />
donations. During the year under review, four Committee meetings were held on April 12, <strong>2010</strong>, July 28, <strong>2010</strong>, October <strong>11</strong>, <strong>2010</strong> and<br />
March 8, 20<strong>11</strong>.<br />
The composition of the Executive Committee of Board and attendance at meetings is given hereunder:<br />
Composition Ratan N <strong>Tata</strong> Ravi Kant J J Irani R Gopalakrishnan * N N Wadia N Munjee ** Carl-Peter P M Telang<br />
Forster<br />
Meetings attended 4 4 2 2 - 1 4 4<br />
* Ceased to be a Director w.e.f. September 1, <strong>2010</strong> ** Appointed w.e.f. October 18, <strong>2010</strong><br />
The Executive Committee of the Board formed a Donations Committee in September 2003 and a Corporate Social Responsibility<br />
(CSR) Committee in January 2006, comprising the Managing Director and the Senior Management which meets from time to time to<br />
fulfill the community and social responsibilities of its stakeholders.<br />
47
Sixty-sixth annual report <strong>2010</strong>-20<strong>11</strong><br />
<strong>Tata</strong> <strong>Motors</strong> Limited<br />
The Nominations Committee of the Board was constituted with the objective of identifying independent directors to be inducted on<br />
the Board and to take steps to refresh the constitution of the Board from time to time. During the year under review, meeting was held<br />
on May 27, <strong>2010</strong> and attended by all the members. The Nominations Committee comprises Mr N N Wadia as the Chairman, Mr Ratan N<br />
<strong>Tata</strong>, Mr S M Palia and Mr Ravi Kant (appointed w.e.f. April 23, <strong>2010</strong>).<br />
The Ethics and Compliance Committee was constituted to formulate policies relating to the implementation of the <strong>Tata</strong> Code of<br />
Conduct for Prevention of Insider Trading (the Code), take on record the monthly reports on dealings in securities by the “Specified<br />
Persons” and decide penal action in respect of violations of the applicable regulations/the Code. During the year under review, two<br />
meetings of the Committee were held on September 1, <strong>2010</strong> and February <strong>11</strong>, 20<strong>11</strong>. The composition of the Ethics and Compliance<br />
Committee and attendance at meetings, is given hereunder:<br />
Composition S M Palia (Chairman) Ravi Kant * R Gopalakrishnan # V K Jairath *<br />
Meetings attended 2 1 1 1<br />
# Ceased to be Member w.e.f. September 1, <strong>2010</strong> * Appointed w.e.f. October 18, <strong>2010</strong>.<br />
Mr C Ramakrishnan, Chief Financial Officer, acts as the Compliance Officer under the said Code. Apart from the above, the Board of<br />
Directors also constitutes Committee(s) of directors with specific terms of reference, as it may deem fit.<br />
Code of Conduct: Whilst the <strong>Tata</strong> Code of Conduct is applicable to all Whole-time Directors and employees of the Company, the Board<br />
has also adopted a Code of Conduct for Non-Executive Directors, both of which are available on the Company’s website. All the Board<br />
members and senior management of the Company as on March 31, 20<strong>11</strong> have affirmed compliance with their respective Codes of<br />
Conduct. A Declaration to this effect, duly signed by the CEO and Managing Director is annexed hereto.<br />
SUBSIDIARY COMPANIES<br />
The Company does not have any material non-listed Indian subsidiary company and hence, it is not required to have an Independent<br />
Director of the Company on the Board of such subsidiary company. The Audit Committee also has a meeting wherein the CEO and CFO<br />
of the subsidiary companies make a presentation on significant issues in audit, internal control, risk management, etc. Significant issues<br />
pertaining to subsidiary companies are also discussed at Audit Committee meetings. Apart from disclosures made in the Directors'<br />
Report there were no strategic investments made by the Company’s non-listed subsidiaries during the year under review.<br />
The minutes of the subsidiary companies are placed before the Board of Directors of the Company and the attention of the Directors<br />
is drawn to significant transactions and arrangements entered into by the subsidiary companies. The performance of its subsidiaries is<br />
also reviewed by the Board periodically.<br />
GENERAL BODY MEETINGS<br />
Location and time of General Meetings in the past 3 years:<br />
Date Year Type Venue Time<br />
September 1, <strong>2010</strong> 2009-<strong>2010</strong><br />
Birla Matushri Sabhagar,<br />
August 25, 2009 2008-2009<br />
Annual General Meeting<br />
19, Sir Vithaldas Thackersey Marg,<br />
3:00 p.m.<br />
Mumbai – 400 020<br />
July 24, 2008 2007-2008<br />
The following are the Special Resolutions passed at General Meetings held in the past 3 years:<br />
Date of Meeting<br />
September 1, <strong>2010</strong><br />
August 25, 2009<br />
July 24, 2008<br />
Summary<br />
No Special Resolution passed<br />
No Special Resolution passed<br />
Commission to non Whole time Directors<br />
Postal Ballot<br />
In August, <strong>2010</strong>, the Company had obtained the approval of its Members under Section 192A of the Companies Act, 1956, pertaining to:-<br />
(i) Resolution No. 1 : Raising of Additional long term resources upto a limit of `4,700 crores.<br />
(ii) Resolution No. 2 : Issuance of ‘A’ Ordinary Shares on exercise of conversion option by holders of Zero Coupon Convertible Alternative<br />
Reference Securities (CARS)<br />
(iii) Resolution No. 3 : Increase in borrowing limits up to `30,000 crores.<br />
(iv) Resolution No. 4 : Creation of Charges on the Company’s properties up to `30,000 crores.<br />
(v) Resolution No. 5 : Payment of Advisory fees to Mr Ravi Kant, Vice Chairman.<br />
48
Voting Pattern and Procedure for Postal Ballot:<br />
1. The Board of Directors of the Company had, at its meeting held on June 28, <strong>2010</strong>, appointed Ms.Shirin Bharucha, Advocate, as the<br />
Scrutinizer for conducting the postal ballot voting process.<br />
2. The Postal Ballot process was carried out in a fair and transparent manner. The postal ballot forms had been kept under her safe<br />
custody in sealed and tamper proof ballot boxes before commencing the scrutiny of such postal ballot forms.<br />
3. All postal ballot forms received up to the close of working hours on August 6, <strong>2010</strong> the last date and time fixed by the Company for<br />
receipt of the forms, had been considered.<br />
4. The results of the Postal Ballot were announced on August 10, <strong>2010</strong> at the Registered Office of the Company as per the Scrutinizer’s<br />
Report as under :<br />
Resolutions<br />
No. 1:<br />
(Special Resolution)<br />
No. 2:<br />
(Special Resolution)<br />
No. 3:<br />
(Ordinary Resolution)<br />
No. 4:<br />
(Ordinary Resolution)<br />
No. 5:<br />
(Special Resolution)<br />
Type of<br />
Capital<br />
No of Ballot<br />
Papers<br />
In favour Against Invalid Votes Total<br />
No. of votes % No of Ballot<br />
Papers<br />
No. of votes % No of Ballot<br />
Papers<br />
No. of<br />
votes<br />
% No of Ballot<br />
Papers<br />
No. of votes %<br />
OS 8752 318778404 293 20807279 646 <strong>11</strong>5448 9691 33970<strong>11</strong>31<br />
AOS 975 2436990 23 288830 87 809 1085 2726629<br />
Total 9727 321215394 93.81 316 21096109 6.16 733 <strong>11</strong>6257 0.03 10776 342427760 100.00<br />
OS 8496 338322830 288 13519166 907 164676 9691 352006672<br />
AOS 976 2591661 14 134092 95 873 1085 2726626<br />
Total 9472 340914491 96.10 302 13653258 3.85 1002 165549 0.05 10776 354733298 100.00<br />
OS 8336 320349476 424 19333042 931 164618 9691 339847136<br />
AOS 958 2436760 29 288981 98 890 1085 2726631<br />
Total 9294 322786236 94.22 453 19622023 5.73 1029 165508 0.05 10776 342573767 100.00<br />
OS 8299 319818937 441 19700376 951 205844 9691 339725157<br />
AOS 956 2436775 28 288960 101 897 1085 2726632<br />
Total 9255 322255712 94.10 469 19989336 5.84 1052 206741 0.06 10776 342451789 100.00<br />
OS 8271 347217437 331 3482957 1089 230444 9691 350930838<br />
AOS 932 2619684 38 105948 <strong>11</strong>5 1000 1085 2726632<br />
Total 9203 349837121 98.92 369 3588905 1.01 1204 231444 0.07 10776 353657470 100.00<br />
OS = Ordinary Shares; AOS = ‘A’ Ordinary Shares<br />
Note: ‘A’ Ordinary Shareholders are entitled to one vote for every ten ‘A’ Ordinary Shares held as per the terms of its issue and Articles of Association. Any fractions have been ignored.<br />
The voting rights for the ‘A’ Ordinary Shares have accordingly been reckoned.<br />
All resolutions moved at the last Annual General Meeting were passed by a show of hands by the requisite majority of members<br />
attending the meeting. None of the items to be transacted at the ensuing meeting is required to be passed by postal ballot.<br />
DISCLOSURES<br />
• Details of related party transactions entered into by the Company are included in the Notes to Accounts. Material individual<br />
transactions with related parties are in the normal course of business on an arm’s length basis and do not have potential conflict<br />
with the interests of the Company at large. Transactions with related parties entered into by the Company in the normal course of<br />
business are placed before the Audit Committee.<br />
• As at March 31, 20<strong>11</strong>, deposits held by the directors of the Company amounted to `<strong>11</strong>.52 crores which were placed at the rate of<br />
interest which is as applicable to the public, employees and shareholders as per the terms of the fixed deposit scheme.<br />
• The Company has complied with various rules and regulations prescribed by stock exchanges, Securities and Exchange Board of<br />
India or any other statutory authority relating to the capital markets during the last 3 years. No penalties or strictures have been<br />
imposed by them on the Company.<br />
• In October <strong>2010</strong>, the Company raised `3,351.01 crores through Qualified Institutions Placement route (QIP). As on March 31, 20<strong>11</strong>,<br />
`2,846.01 crores were utilized out of the aforesaid funds for the purpose as specified in the offer document. Details of this issue and<br />
end use are provided to the Audit Committee on a quarterly basis..<br />
• The Audit Committee and the Board have adopted a Whistle-Blower Policy which provides a formal mechanism for all employees<br />
of the Company to approach the Management of the Company (Audit Committee in case where the concern involves the Senior<br />
Management) and make protective disclosures to the Management about unethical behaviour, actual or suspected fraud or violation<br />
of the Company’s Code of Conduct or ethics policy. The disclosures reported are addressed in the manner and within the time frames<br />
prescribed in the Policy. The Company affirms that no employee of the Company has been denied access to the Audit Committee.<br />
49
Sixty-sixth annual report <strong>2010</strong>-20<strong>11</strong><br />
<strong>Tata</strong> <strong>Motors</strong> Limited<br />
The status of compliance in respect of non-mandatory requirements of Clause 49 of Listing Agreement is as follows:<br />
Chairman of the Board: Being the Group Chairman, the Company does not reimburse expenses incurred by the Non-Executive<br />
Chairman for maintenance of a separate Chairman’s office.<br />
At its meeting held on July 25, 2006, the Board of Directors has adopted the Revised Guidelines (2006) regarding the retirement age<br />
of Directors. In line with best practice to continuously refresh the Board’s membership, the Board is encouraged to seek a balance<br />
between change and continuity. A tenure of 9 years may be considered a threshold for granting further tenure for independent directors<br />
based, inter alia, on the merit and contribution of each Director. The Nomination Committee takes into consideration criteria such as<br />
qualifications and expertise whilst recommending induction of non-executive directors on the Board.<br />
Remuneration Committee: Details are given under the heading “Remuneration Committee”.<br />
Shareholder Rights: Details are given under the heading “Means of Communications”.<br />
Audit Qualifications: During the year under review, there was no audit qualification in the Company’s financial statements. The Company<br />
continues to adopt best practices to ensure a regime of unqualified financial statements.<br />
Training of Board Members: The Directors interact with the management in a very free and open manner on information that may be<br />
required by them. Orientation and factory visits are arranged for new Directors. The Independent Directors are encouraged to attend<br />
training programmes that may be of relevance and interest to the Directors in discharging their responsibilities to the Company’s<br />
stakeholders.<br />
Mechanism for evaluating non-executive Board members: The performance evaluation of non-executive members is done by the<br />
Board annually based on criteria of attendance and contributions at Board/Committee Meetings as also for the role played other than<br />
at Meetings.<br />
Whistle Blower Mechanism: The Company has adopted a Whistle-Blower Policy. Please refer to ‘DISCLOSURES’ given above.<br />
MEANS OF COMMUNICATION<br />
The Quarterly, Half Yearly and Annual results are regularly submitted to the Stock Exchanges in accordance with the Listing Agreement<br />
and are generally published in Indian Express, Financial Express and Loksatta (Marathi). The information regarding the performance of<br />
the Company is shared with the shareholders every six months through a half yearly communiqué and the Annual Report. The official<br />
news releases, including on the quarterly and annual results and presentations made to institutional investors analysts are also posted<br />
on the Company’s website www.tatamotors.com.<br />
The ‘Investors’ section on the Company’s website keeps the investors updated on material developments in the Company by providing<br />
key and timely information like Financial Results, Annual Reports, Shareholding Pattern, presentations made to Analysts etc. A brief<br />
profile of Directors is also on the Company‘s website. Members also have the facility of raising their queries/complaints on share related<br />
matters through a facility provided on the Company’s website.<br />
The Annual Report, Quarterly Results, Shareholding Pattern of the Company are posted through Corporate Filing and Dissemination<br />
System (CFDS), a portal which is a single source to view information filed by listed companies. Hard copies of the said disclosures and<br />
correspondence are also filed with the Stock Exchanges.<br />
GENERAL INFORMATION FOR MEMBERS<br />
The Company is registered with the Registrar of Companies, Maharashtra, Mumbai. The Corporate Identity Number (CIN) allotted to the<br />
Company by the Ministry of Corporate Affairs (MCA) is L28920MH1945PLC004520.<br />
Annual General Meeting<br />
Date and Time<br />
Friday, August 12, 20<strong>11</strong> at 3:00 p.m.<br />
Venue Birla Matushri Sabhagar, 19, Sir Vithaldas Thackersey Marg, Mumbai 400 020<br />
Date of Book Closure<br />
Dividend Payment Date<br />
Tuesday, July 21 to Friday, August 12, 20<strong>11</strong> (both days inclusive)<br />
August 16, 20<strong>11</strong>. The Dividend warrants will be posted/dividend amount will be remitted into the shareholders account<br />
on or after August 16, 20<strong>11</strong><br />
50
Financial Calendar (Tentative)<br />
Financial Year ending March 31<br />
Results for the Quarter ending<br />
June 30, 20<strong>11</strong> before August 14, 20<strong>11</strong><br />
September 30, 20<strong>11</strong> before November 14, 20<strong>11</strong><br />
December 31, 20<strong>11</strong> before February 14, 2012<br />
March 31, 2012 before May 30, 2012<br />
Listing<br />
The Company’s securities are listed on the Bombay Stock Exchange Ltd. (BSE) and National Stock Exchange of India Ltd. (NSE).<br />
The following are the details of the Company's shares:<br />
Type<br />
ISIN No.<br />
Bombay Stock Exchange (BSE)<br />
National Stock Exchange (NSE)<br />
Stock Code Address Stock Code Address<br />
Ordinary Shares INE155A01014 500570 Phiroze Jeejeebhoy Towers TATAMOTORS<br />
Dalal Street<br />
‘A’ Ordinary Shares IN9155A01012 570001<br />
Mumbai 400 001<br />
www.bseindia.com<br />
TATAMTRDVR<br />
“Exchange Plaza”<br />
Bandra Kurla Complex,<br />
Bandra (E), Mumbai 400 051<br />
www.nseindia.com<br />
For details on listings of Non-Convertible Debentures on the Wholesale Debt market segment of the NSE, please refer to ‘Outstanding<br />
Securities’ section of this Report.<br />
International Listing<br />
There are two separate programs for the Company’s Depositary Receipts.<br />
- The American Depositary Shares (ADSs) (through the conversion of its International Global Depositary Shares into American<br />
Depositary Shares (ADSs) are listed on the New York Stock Exchange (NYSE) since September 27, 2004.<br />
- The Global Depositary Shares (GDSs) issued in October 2009 are listed on the Luxembourg Stock Exchange since then. The said GDSs<br />
are also traded on London Stock Exchange on IOB platform. Please also refer to the section on ‘Outstanding Depositary Receipts and<br />
Convertible Instruments’ for details pertaining to international listing of Foreign Currency Convertible Notes.<br />
The following are the details of the Company's ADSs/GDSs:<br />
Type Stock Exchange and Address Ticker Symbol Description ISIN CUSIP SEDOL<br />
ADS New York SE, 20 Broad Street New York, NY 100 005 TTM Common Shares US8765685024 876568502 B02ZP96<br />
GDS Luxembourg SE, <strong>11</strong>,<br />
Avenue de la porte – Neuve,<br />
L – 2227, Luxembourg.<br />
TTMT LX Common Shares US8765686014 876568601 B4YT1P2<br />
Two-way Fungibility of Depositary Receipts<br />
The Company offers foreign investors a limited facility for conversion of Ordinary Shares into American Depositary Receipts/Global<br />
Depository Receipts within the limits permissible for two-way Fungibility, as announced by the Reserve Bank of India vide its operative<br />
guidelines for the limited two way fungibility under the "Issue of Foreign Currency Convertible Bond and Ordinary Shares (through<br />
Depository Receipt Mechanism) Scheme 1993", circular dated February 13, 2002.<br />
Payment of Listing Fees<br />
The Company has paid Annual Listing fees for FY 20<strong>11</strong>-12 to all the Stock Exchanges (both domestic and international) where the<br />
Company’s securities are listed.<br />
51
Sixty-sixth annual report <strong>2010</strong>-20<strong>11</strong><br />
<strong>Tata</strong> <strong>Motors</strong> Limited<br />
Market Information<br />
Market price data - monthly high/low of the closing price and trading volumes on BSE/NSE depicting liquidity of the Company’s Ordinary<br />
Shares and ‘A’ Ordinary Shares on the said exchanges is given hereunder:-<br />
Ordinary Shares<br />
‘A’ Ordinary Shares<br />
Month<br />
Bombay Stock Exchange Limited<br />
National Stock Exchange of India<br />
Limited<br />
Bombay Stock Exchange<br />
Limited<br />
National Stock Exchange of<br />
India Limited<br />
High (`)<br />
Low (`)<br />
No. of<br />
Shares<br />
High (`)<br />
Low (`)<br />
No. of<br />
Shares<br />
High (`)<br />
Low (`)<br />
No. of<br />
Shares<br />
High (`)<br />
Low (`)<br />
No. of<br />
Shares<br />
Apr-10 872.85 773.95 17147536 872.60 774.15 10147<strong>11</strong>62 600.35 450.00 1012<strong>11</strong>89 600.70 450.05 17234921<br />
May-10 855.55 673.70 21522510 854.45 673.45 <strong>11</strong>1787192 587.20 470.70 1600244 587.95 469.25 3807655<br />
Jun-10 808.30 725.65 19576154 807.30 724.95 92842012 529.00 492.45 403961 529.35 492.20 1620321<br />
Jul-10 865.70 750.90 12074924 866.70 750.95 60910683 609.30 488.35 991386 610.60 489.20 4379280<br />
Aug-10 1047.60 841.90 24106892 1048.30 841.80 1095530<strong>11</strong> 764.40 606.65 3263697 764.90 605.20 10038746<br />
Sep-10 <strong>11</strong>06.65 1008.55 15698165 <strong>11</strong>06.45 1010.75 61529022 793.60 720.20 925737 799.15 720.20 5483486<br />
Oct-10 <strong>11</strong>94.25 <strong>11</strong>04.90 8136586 <strong>11</strong>96.05 <strong>11</strong>02.95 55735635 868.80 752.50 3387039 871.05 754.00 13883922<br />
Nov-10 1302.15 <strong>11</strong>53.90 <strong>11</strong>541487 1302.50 <strong>11</strong>54.25 67796791 909.45 768.00 3171556 909.65 768.50 14687610<br />
Dec-10 1365.60 1248.10 13034385 1365.15 1247.60 88595099 855.05 772.20 2054694 854.80 772.60 10928607<br />
Jan-<strong>11</strong> 1306.45 <strong>11</strong>45.70 9507436 1308.45 <strong>11</strong>47.05 60772907 788.30 682.10 785743 789.00 683.90 7706258<br />
Feb-<strong>11</strong> 1250.80 1058.25 14783186 1248.60 1054.40 754725<strong>11</strong> 727.75 586.50 826276 727.65 588.30 7022706<br />
Mar-<strong>11</strong> 1247.50 <strong>11</strong>17.95 8990876 1249.00 <strong>11</strong>17.45 48669066 718.90 627.55 1305694 719.90 628.40 6629218<br />
The Performance of the Company’s Stock Price vis-à-vis Sensex, Auto Index, ADR and GDR:<br />
BSE SENSEX ..& AUTO INDEX<br />
25000<br />
20000<br />
15000<br />
10000<br />
5000<br />
0<br />
Apr/10<br />
May/10<br />
Jun/10<br />
Jul/10<br />
Aug/10<br />
Sep/10<br />
Oct/10<br />
Nov/10<br />
Dec/10<br />
Jan/<strong>11</strong><br />
Feb/<strong>11</strong><br />
Mar/<strong>11</strong><br />
1600<br />
1400<br />
1200<br />
1000<br />
800<br />
600<br />
400<br />
200<br />
0<br />
<strong>Tata</strong> <strong>Motors</strong> Ordinary Shares (in `)<br />
<strong>Tata</strong> <strong>Motors</strong> Ordinary Shares<br />
& ‘A’ Ordinary Shares<br />
1600<br />
1400<br />
1200<br />
1000<br />
800<br />
600<br />
400<br />
200<br />
0<br />
Apr/10<br />
May/10<br />
Jun/10<br />
Jul/10<br />
Aug/10<br />
Sep/10<br />
Oct/10<br />
Nov/10<br />
Dec/10<br />
Jan/<strong>11</strong><br />
Feb/<strong>11</strong><br />
Mar/<strong>11</strong><br />
$40<br />
$35<br />
$30<br />
$25<br />
$20<br />
$15<br />
$10<br />
$5<br />
$0<br />
ADR & GDR<br />
BSE Sensex Auto Index Ordinary Share In BSE<br />
Ordinary Shares ‘A’ Ordinary Shares ADR Price GDR Price<br />
The monthly high and low of the Company’s ADRs and GDRs is given below:<br />
(in US $)<br />
ADRs<br />
GDRs<br />
Month High Low Month High Low Month High Low Month High Low<br />
April-10 20.60 18.74 October-10 28.95 25.59 April-10 19.74 17.36 October-10 26.83 24.87<br />
May-10 20.60 15.65 November-10 36.00 27.99 May-10 19.24 14.12 November-10 29.33 25.44<br />
June-10 18.21 16.22 December-10 31.65 27.86 June-10 17.74 15.41 December-10 30.30 27.75<br />
July-10 19.24 17.16 January-<strong>11</strong> 30.06 24.26 July-10 18.60 15.99 January-<strong>11</strong> 29.25 25.04<br />
August-10 22.73 19.31 February-<strong>11</strong> 27.07 23.93 August-10 22.53 18.26 February-<strong>11</strong> 27.62 23.27<br />
September-10 25.52 21.90 March-<strong>11</strong> 28.16 25.02 September-10 24.64 21.57 March-<strong>11</strong> 28.01 24.82<br />
52
Registrar and Transfer Agents<br />
For Share related matters, Members are requested to correspond with the Company’s Registrar and Transfer Agents – M/s TSR Darashaw<br />
Limited quoting their folio no./DP ID & Client ID at the following addresses:<br />
1. For transfer lodgement, delivery and correspondence: TSR Darashaw Limited, Unit: <strong>Tata</strong> <strong>Motors</strong> Limited, 6-10, Haji Moosa Patrawala<br />
Industrial Estate, 20, Dr. E Moses Road, (Nr. Famous Studios) Mahalaxmi, Mumbai – 400 0<strong>11</strong>.Tel: 022-6656 8484; Fax: 022- 6656 8494;<br />
e-mail : csg-unit@tsrdarashaw.com; website:www.tsrdarashaw.com<br />
2. For the convenience of investors based in the following cities, transfer documents and letters will also be accepted at the following<br />
branches/agencies of TSR Darashaw Limited:<br />
(i) 503, Barton Centre, 5th Floor, 84, Mahatma Gandhi Road, Bangalore - 560 001. Tel: 080– 25320321, Fax : 080-25580019, e-mail :<br />
tsrdlbang@tsrdarashaw.com<br />
(ii) Bungalow No.1, “E” Road, Northern Town, Bistupur, Jamshedpur – 831 001. Tel: 0657 – 2426616, Fax: 0657 – 2426937, email :<br />
tsrdljsr@tsrdarashaw.com<br />
(iii) <strong>Tata</strong> Centre, 1st Floor, 43, Jawaharlal Nehru Road, Kolkata – 700 071. Tel: 033 – 22883087, Fax: 033 – 22883062, e-mail: tsrdlcal@<br />
tsrdarashaw.com<br />
(iv) Plot No.2/42, Sant Vihar, Ansari Road, Daryaganj, New Delhi – <strong>11</strong>0 002. Tel : 0<strong>11</strong> – 23271805, Fax : 0<strong>11</strong> – 23271802, e-mail : tsrdldel@<br />
tsrdarashaw.com<br />
(v) Agent: Shah Consultancy Services Pvt Limited: 3-Sumathinath Complex, Pritam Nagar Akhada Road, Ellisbridge, Ahmedabad -380<br />
006. Tel: 079–2657 6038, e-mail: shahconsultancy8154@gmail.com<br />
For Fixed Deposits, the investors are requested to correspond with the Registrars to the Fixed Deposits Scheme – TSR Darashaw Limited<br />
at the same addresses as mentioned above. Our Registrars to the Fixed Deposits Scheme have been changed from M/s Linkintime India<br />
Private Limited to M/s TSR Darashaw Limited w.e.f. February 1, 20<strong>11</strong>.<br />
Share Transfer System<br />
Securities lodged for transfer at the Registrar’s address are normally processed within 15 days from the date of lodgement, if the<br />
documents are clear in all respects. All requests for dematerialization of securities are processed and the confirmation is given to the<br />
depositories within 15 days. Senior Executives of the Company are empowered to approve transfer of shares and debentures and other<br />
investor related matters. Grievances received from investors and other miscellaneous correspondence on change of address, mandates,<br />
etc. are processed by the Registrars within 15 days.<br />
Secretarial Audit<br />
• Pursuant to Clause 47(c) of the Listing Agreement with the Stock Exchanges, certificates, on half-yearly basis, have been issued by a<br />
Company Secretary-in-Practice for due compliance of share transfer formalities by the Company.<br />
• A Company Secretary-in-Practice carried out a Reconciliation of Share Capital Audit to reconcile the total admitted capital with NSDL<br />
and CDSL and the total issued and listed capital. The audit confirms that the total issued/paid up capital is in agreement with the<br />
aggregate of the total number of shares in physical form and the total number of shares in dematerialised form (held with NSDL<br />
and CDSL).<br />
Shareholding Pattern as on March 31, 20<strong>11</strong><br />
Category<br />
As on March 31,<br />
20<strong>11</strong><br />
No. of<br />
shares<br />
Ordinary Shares<br />
% No. of<br />
shares<br />
As on March 31,<br />
<strong>2010</strong><br />
% variance<br />
<strong>11</strong> v/s 10<br />
% As on March 31,<br />
20<strong>11</strong><br />
No. of<br />
shares<br />
'A' Ordinary Shares<br />
As on March 31,<br />
<strong>2010</strong><br />
% No. of<br />
shares<br />
%<br />
% variance<br />
<strong>11</strong> v/s 10<br />
Promoters and Promoter Group *187471466 34.83 *187376876 37.00 (2.17) 18210330 18.90 33934959 52.88 (33.98)<br />
Mutual Funds and Unit Trust of India 7547665 1.40 10880291 2.15 (0.75) 24146102 25.06 4401585 6.86 18.20<br />
Government Companies, Financial<br />
63584927 <strong>11</strong>.81 79913933 15.78 (3.97) 8586280 8.91 5133050 7.99 0.92<br />
Institutions, Banks and Insurance cos<br />
Foreign Institutional Investors 127020938 23.60 90289797 17.83 5.77 38650993 40.12 13166186 20.52 19.60<br />
NRIs, Foreign companies and ADRs/GDRs <strong>11</strong>3434533 21.07 88151027 17.41 3.66 573162 0.60 681546 1.06 (0.46)<br />
Others 39212755 7.29 49769246 9.83 (2.54) 6174839 6.41 6859048 10.69 (4.28)<br />
Total 538272284 100 50638<strong>11</strong>70 100 0 100 100 0<br />
* Out of the Promoter holding, 4,40,00,000 shares (March 31, <strong>2010</strong> – 4,50,00,000 shares) aggregating 8.17% (March 31, <strong>2010</strong> – 8.89%) of the paid-up capital were pledged.<br />
53
Sixty-sixth annual report <strong>2010</strong>-20<strong>11</strong><br />
<strong>Tata</strong> <strong>Motors</strong> Limited<br />
Distribution of shareholding as on March 31, 20<strong>11</strong><br />
Ordinary Shares<br />
54<br />
Range of Shares<br />
No. of shares<br />
No. of shares<br />
Physical<br />
form (%)<br />
Demat<br />
form (%)<br />
% of<br />
Capital<br />
No. of<br />
Holders<br />
No. of shareholders<br />
Physical<br />
form (%)<br />
Demat<br />
form (%)<br />
% of<br />
Capital<br />
1 - 500 20962820 0.93 2.96 3.89 315978 18.75 76.09 94.84<br />
501 - 1000 7292249 0.29 1.07 1.36 10255 0.67 2.40 3.07<br />
1001 - 2000 5700531 0.19 0.87 1.06 4080 0.23 1.00 1.23<br />
2001 - 5000 5259898 0.16 0.82 0.98 1754 0.09 0.44 0.53<br />
5001 -10000 2635364 0.06 0.43 0.49 370 0.02 0.10 0.12<br />
Above 10000 496421422 0.15 92.07 92.22 739 0.01 0.21 0.22<br />
Total 538272284 1.78 98.22 100.00 333176 19.75 80.25 100.00<br />
'A' Ordinary Shares<br />
No. of shares<br />
No. of shareholders<br />
Range of Shares<br />
No. of shares Physical Demat % of No. of Physical Demat % of Capital<br />
form (%) form (%) Capital Holders form (%) form (%)<br />
1 - 500 1740331 0.06 1.74 1.80 23785 5.61 85.85 91.46<br />
501 - 1000 746167 0.01 0.77 0.78 976 0.01 3.74 3.75<br />
1001 - 2000 730998 0.00 0.76 0.76 496 0.00 1.90 1.90<br />
2001 - 5000 1033843 0.00 1.07 1.07 333 0.00 1.28 1.28<br />
5001 -10000 821740 0.00 0.85 0.85 <strong>11</strong>4 0.00 0.44 0.44<br />
Above 10000 91268627 0.00 94.74 94.74 305 0.00 1.17 1.17<br />
Total 96341706 0.07 99.93 100.00 26009 5.61 94.39 100.00<br />
Top shareholders (holding in excess of 1% of capital) as on March 31, 20<strong>11</strong><br />
Ordinary Shares<br />
‘A’ Ordinary Shares<br />
Name of Shareholder<br />
No. of<br />
shares held<br />
% to paidup<br />
capital<br />
Name of Shareholder<br />
No. of<br />
shares held<br />
% to paidup<br />
capital<br />
<strong>Tata</strong> Sons Limited 137858939 25.61 <strong>Tata</strong> Sons Limited 16901979 17.54<br />
Citibank N.A. New York, NYADR 109422229 20.33 IVY Funds, Inc. Asset Strategy Fund 9298590 9.65<br />
department<br />
HDFC Trustee Company Limited – HDFC TOP 200 FUND 4263310 4.43<br />
Life Insurance Corporation of India 40953666 7.61 PCA India Equity Open Limited 3880815 4.03<br />
Limited<br />
HDFC Trustee Company Limited – HDFC EQUITY FUND 2974235 3.09<br />
<strong>Tata</strong> Steel Limited 29562139 5.49 Birla Sun Life Insurance Company Limited 2462853 2.56<br />
<strong>Tata</strong> Industries Limited 13687297 2.54 Deutsche Securities Mauritius Limited <strong>2010</strong>920 2.09<br />
Europacific Growth Fund 8244753 1.53 Government of Singapore 1934919 2.01<br />
SBI Life Insurance Company Limited 1671467 1.73<br />
IVY Funds, Inc. Asset Strategy Fund 5784730 1.07 Dragon Peacock Investments Limited 1658805 1.72<br />
HDFC Trustee Company Limited – HDFC PRUDENCE FUND 1269080 1.32<br />
The Hartford Capital Appreciation 5544346 1.03 Swiss Finance Corporation (Mauritius) Limited <strong>11</strong>77940 1.22<br />
Fund<br />
Blackrock India Equities Fund (Mauritius) Limited <strong>11</strong>15180 1.16<br />
Dematerialisation of shares<br />
The electronic holding of the shares as on March 31, 20<strong>11</strong> through NSDL and CDSL are as follows:<br />
Particulars<br />
Ordinary Shares<br />
‘A’ Ordinary Shares<br />
20<strong>11</strong> (%) <strong>2010</strong> (%) 20<strong>11</strong> (%) <strong>2010</strong> (%)<br />
NSDL 97.34 96.44 98.78 98.93<br />
CDSL 0.88 1.51 1.15 0.96<br />
Total 98.22 97.95 99.93 99.89<br />
Outstanding Securities:<br />
Outstanding Depositary Receipts/Warrants or Convertible instruments, conversion date and likely impact on equity:<br />
A. Depositary Receipts<br />
• 10,94,22,229 ADSs listed on the New York Stock Exchange.<br />
• 3,06,164 GDSs listed on the Luxembourg Stock Exchange.
B. Foreign Currency Convertible Notes<br />
• 4,730 - Zero Coupon Convertible Alternative Reference Securities (due 2012) of US$100,000 each (CARS) aggregating US$ 473<br />
million issued in July 2007 which allow the Company to give the holder an option to convert the CARS, inter alia, into qualifying<br />
securities as per terms of issue.<br />
• 1,174 - 4% Convertible Notes (due 2014) of US$100,000 each aggregating US$<strong>11</strong>7.4 million issued in October 2009 may, at the<br />
option of the Note holders, be converted into 88,52,293 Ordinary Shares at `613.77 per share (Reset Price) at any time into GDSs<br />
during November 25, 2009 to October 16, 2014 and ADSs at anytime during October 15, <strong>2010</strong> to October 16, 2014.<br />
The following are the relevant details of the notes:<br />
Security Type ISIN Nos. CUSIP Listing at<br />
Zero Coupon Notes (due 2012) XS0307881762 030788176 Singapore Stock Exchange, 2 Shenton Way, #19-00 SGX Center 1,<br />
Singapore 068804<br />
4% Notes (due 2014) XS0457793510 045779351 Luxembourg Stock Exchange,<br />
<strong>11</strong>, Avenue de la porte – Neuve, L – 2227, Luxembourg<br />
Overseas Depositary<br />
Citibank N.A. 388 Greenwich Street, 14th Floor<br />
New York, NY 10013<br />
There are no outstanding warrants issued by the Company.<br />
Domestic Custodian<br />
Citibank N.A., Trent House, 3rd floor, G-60, Bandra Kurla Complex, Bandra (East),<br />
Mumbai 400 051<br />
Apart from Shares and Convertible Instruments, the following Non Convertible Debentures (NCD) are listed on the National Stock<br />
Exchange under Wholesale Debt Market segment*:<br />
ISIN Number<br />
Principal<br />
Amount<br />
Redemption<br />
Premium<br />
Yield to<br />
Maturity (%)<br />
Date of Maturity<br />
INE155A07177 `350 crores `96.55 crores 8.40 March 31, 2013<br />
INE155A07185 `1,800 crores `658.05 crores 8.45 March 31, 2014<br />
INE155A07193 `1,250 crores `919.23 crores 10.03 March 31, 2016<br />
INE155A07219 `200 crores Nil 9.95 March 2, 2020<br />
INE155A07227 `500 crores Nil 10.25 `100 crores – April 30, 2022, `100 crores – April 30, 2023,<br />
`150 crores – April 30, 2024, `150 crores – April 30, 2025<br />
INE155A08043 `150 crores Nil 9.90 May 7, 2020<br />
INE155A08050 `100 crores Nil 9.75 May 24, 2020<br />
INE155A08068 `150 crores Nil 9.70 July 18, 2020<br />
*Detailed information on the above debentures is included in the ‘Notes to Accounts’.<br />
Plant Locations<br />
Location<br />
Pimpri, Pune – 4<strong>11</strong> 018; Chikhali, Pune – 410 501; Chinchwad, Pune – 4<strong>11</strong> 033<br />
Jamshedpur – 831 010<br />
Chinhat Industrial Area, Lucknow – 226 019<br />
Plot No. 1, Sector <strong>11</strong> and Plot No. 14, Sector 12, I.I.E., Pantnagar, District Udhamsingh<br />
Nagar, Uttarakhand – 263145<br />
Revenue Survey No. 1, Village Northkotpura, Tal, Sanand, Dist. Ahmedabad - 380 015<br />
KIADB Block II, Belur Industrial Area, Mummigatti Post, Dharwad – 580007<br />
Debenture Trustee<br />
Vijaya Bank,<br />
Merchant Banking<br />
Division, Head Office,<br />
41/2, M.G. Road,<br />
Trinity Circle,<br />
Bangalore – 560 001<br />
Range of Products Produced<br />
Medium and Heavy Commercial Vehicles (M&HCVs), Light<br />
Commercial Vehicles (LCVs), Utility Vehicles (UVs) and Cars<br />
M&HCVs<br />
M&HCVs and LCVs<br />
LCVs & Cars<br />
Passenger Cars<br />
Project under construction / implementation<br />
Address for correspondence<br />
<strong>Tata</strong> <strong>Motors</strong> Limited, Bombay House, 24, Homi Mody Street, Mumbai - 400 001, India.<br />
Action required regarding non-receipt of dividends, proceeds of matured deposits and interest and redeemed debentures and<br />
interest thereon:<br />
(i) Pursuant to Sections 205A and 205C of the Act, all unclaimed/unpaid dividend, application money, debenture interest and interest<br />
on deposits as well as principal amount of debentures and deposits pertaining to the Company and erstwhile <strong>Tata</strong> Finance Limited<br />
(TFL) remaining unpaid or unclaimed for a period of 7 years from the date they became due for payment, have been transferred to<br />
the Investors Education and Protection Fund (IEPF) established by the Central Government.<br />
55
Sixty-sixth annual report <strong>2010</strong>-20<strong>11</strong><br />
<strong>Tata</strong> <strong>Motors</strong> Limited<br />
(ii) In case of non receipt/non encashment of the dividend warrants, Members are requested to correspond with the Company’s<br />
Registrars/the Registrar of Companies, as mentioned hereunder:<br />
Dividend for<br />
Whether it can Contact Office<br />
Action to be taken<br />
be claimed<br />
2004-05 to 2009-10 Yes TSR Darashaw Limited Letter on plain paper.<br />
2002-03 to 2003-04 No - None. Already transferred to IEPF.<br />
2000-01 and 2001-02 N.A. - Not Applicable due to non declaration of dividend.<br />
1995-96 to 1999-2000 No - None. Already transferred to IEPF.<br />
1978-79 to 1994-95 Yes Office of the Registrar of Companies, CGO Complex, Claim in Form No. II of the Companies Unpaid Dividend<br />
‘A’ Wing, 2nd floor, Next to RBI, CBD – Belapur, Navi (Transfer to General Revenue Account of the Central<br />
Mumbai – 400614. Maharashtra 91 22 2757 6802 Government) Rules, 1978.<br />
(iii) Following table gives information relating to outstanding dividend accounts and due dates for claiming dividend:<br />
Financial Year Date of Declaration Last date for claiming dividend *<br />
2003-04 (Final) July 8, 2004 July 7, 20<strong>11</strong><br />
2004-05 July <strong>11</strong>, 2005 July 10, 2012<br />
2005-06 July <strong>11</strong>, 2006 July 10, 2013<br />
2006-07 July 9, 2007 July 8, 2014<br />
2007-08 July 24, 2008 July 23, 2015<br />
2008-09 August 25, 2009 August 24, 2016<br />
2009-10 September 1, <strong>2010</strong> August 31, 2017<br />
*Indicative dates. Actual dates may vary.<br />
(iv) Following amounts have been transferred to IEPF during the year:<br />
Particulars As on March 31, <strong>2010</strong> FY 10-<strong>11</strong> As at March 31, 20<strong>11</strong><br />
Unpaid dividend amounts of the Company 2,33,84,145.99 81,97,268 3,15,81,413.99<br />
Application moneys received for allotment of any securities and due for refund 31,351.08 1,140 32,491.08<br />
Unpaid matured deposit with the Company 3,33,83,729.00 40,32,916 3,74,16,645.00<br />
Unpaid matured debentures with the Company 3,95,04,605.53 NIL 3,95,04,605.53<br />
Interest accrued on matured deposits with Company 1,09,39,788.64 18,50,361 1,27,90,149.64<br />
Interest accrued on matured debentures with Company 2,32,93,452.10 4,02,241 2,36,95,693.10<br />
Total 13,05,37,072.34 1,44,83,926 14,50,20,998.34<br />
(v) While the Company’s Registrar has already written to the Members, Debenture holders and Depositors informing them about the<br />
due dates for transfer to IEPF for unclaimed dividends/interest payments, attention of the stakeholders is again drawn to this matter<br />
through the Annual Report.<br />
(vi) Investors of the Company and of the erstwhile TFL who have not yet encashed their unclaimed/unpaid amounts are requested to<br />
do so at the earliest.<br />
(vii) Other facilities of interest to shareholders holding shares in physical form<br />
• As per Clause 5A of the Listing Agreement, the Company has sent reminders to those shareholders, who have not submitted<br />
their shares for exchange of share certificates upon, sub-division of face value of shares (Sub-division in 1989 from face value of<br />
`100/- each to `10/- each), conversion of convertible debentures and whose share certificates have been returned undelivered<br />
after transfer, change of address etc. These certificates are currently lying with the Registrar and Transfer Agents of the Company.<br />
Members, holding Company’s shares in physical form, are requested to tally their holding with the certificates in their possession<br />
and revert in case of any discrepancy in holdings. In case there is no response after three reminders, the unclaimed shares shall<br />
be transferred to one folio in the name of ”Unclaimed Suspense Account” and the voting rights on such shares shall remain<br />
frozen till the rightful owner claims the shares.<br />
• Nomination facility: Shareholders, who hold shares in single name and wish to make/change the nomination in respect of their<br />
shares as permitted under Section 109A of the Act, may submit to the Registrars and Transfer Agents, the prescribed Form 2B.<br />
• Bank details: Shareholders are requested to notify/send the following to the Company’s Registrars and Share Transfer Agents to<br />
facilitate better services:<br />
1. Any change in their address/mandate/NECS bank details; and<br />
2. Particulars of the bank account in which they wish their dividend to be credited, in case they have not been furnished<br />
earlier.<br />
(viii) Shareholders are advised that respective bank details and address as furnished by them to the Company will be printed on their<br />
dividend warrants as a measure of protection against fraudulent encashment.<br />
56<br />
(in `)
DECLARATION BY THE CEO UNDER CLAUSE 49 OF THE LISTING AGREEMENT REGARDING ADHERENCE TO THE CODE OF CONDUCT<br />
In accordance with Clause 49 sub-clause I(D) of the Listing Agreement with the Stock Exchanges, I hereby confirm that, all the Directors<br />
and the Senior Management personnel of the Company have affirmed compliance to their respective Codes of Conduct, as applicable<br />
to them for the Financial Year ended March 31, 20<strong>11</strong>.<br />
For <strong>Tata</strong> <strong>Motors</strong> Limited<br />
CARL-PETER FORSTER<br />
Managing Director & Group CEO<br />
Mumbai, May 26, 20<strong>11</strong><br />
PRACTISING COMPANY SECRETARIES’ CERTIFICATE ON CORPORATE GOVERNANCE<br />
TO THE MEMBERS OF TATA MOTORS LIMITED<br />
We have examined the compliance of the conditions of Corporate Governance by <strong>Tata</strong> <strong>Motors</strong> Limited for the year ended on<br />
March 31, 20<strong>11</strong>, as stipulated in clause 49 of the Listing Agreement of the said Company with the Stock Exchanges.<br />
The compliance of the conditions of Corporate Governance is the responsibility of the management. Our examination was limited<br />
to procedures and implementation thereof, adopted by the Company for ensuring the compliance of the conditions of Corporate<br />
Governance. It is neither an audit nor an expression of opinion on the financial statements of the Company.<br />
In our opinion and to the best of our information and according to the explanations given to us, and the representations made by the<br />
Directors and the Management, we certify that the Company has complied with the conditions of Corporate Governance as stipulated<br />
in the above mentioned Listing Agreement.<br />
We state that such compliance is neither an assurance as to the future viability of the Company nor of the efficiency or effectiveness<br />
with which the management has conducted the affairs of the Company.<br />
For Parikh & Associates<br />
Practising Company Secretaries<br />
P. N. Parikh<br />
FCS: 327 CP: 1228<br />
Mumbai, May 26, 20<strong>11</strong><br />
57
Sixty-sixth annual report <strong>2010</strong>-20<strong>11</strong><br />
<strong>Tata</strong> <strong>Motors</strong> Limited<br />
FUNDS FLOW - LAST FIVE YEARS<br />
(` in crores)<br />
<strong>2010</strong>-<strong>11</strong> 2009-10 2008-09 2007-08 2006-07<br />
Sources of Funds<br />
1 Funds generated from operations<br />
A. Profit after tax 1,8<strong>11</strong>.82 2,240.08 1,001.26 2,028.92 1,913.46<br />
B. Depreciation (including Lease Equalisation) 1,356.26 1,029.36 870.05 647.82 582.51<br />
C. Provision / (Reversal) for diminution in value of investments (net) 34.00 61.05 (1.96) (62.93) 1.09<br />
D. Net deferred tax charge 376.30 589.46 (2.50) 401.54 177.22<br />
E. Adjustment in General Reserve for difference in opening liability<br />
for Employee Benefits [Note b(v)] - - - - (27.12)<br />
F. Credit for Dividend Distribution Tax of Subsidiary Companies - - 15.29 - -<br />
G. Exchange gain (net) on Long term Foreign currency monetary<br />
items deferred consequent to amendment to AS-<strong>11</strong> [Note b(iii)] 161.69 (325.81) 106.23 - -<br />
H. Marked to Market Exchange loss on Forward contracts transferred<br />
to Hedging Reserve Account on adoption of principles of hedge<br />
accounting under AS30 [Note b(v)] - 132.57 (132.57) - -<br />
Total 3,740.07 3,726.71 1,855.80 3,015.35 2,647.16<br />
2 Proceeds from Rights issue of Ordinary shares and ‘A’ Ordinary shares - - 4,139.33 - -<br />
3 Proceeds from issue of Global Depository Shares - 1,794.19 - - -<br />
4 Proceeds from QIP issue 3,351.01 - - - -<br />
5 Proceeds from FCCN, Warrants and Convertible Debentures<br />
converted into Ordinary Shares and premium thereon 1,493.32 1,555.76 8.52 6.90 96.38<br />
6 (a) Decrease in Working Capital - 2,145.94 - 1,348.30 -<br />
(b) Decrease in Finance receivables 366.41 1,393.58 406.22 2,227.41 -<br />
7 Increase in Borrowings (net of repayments) - 3,460.35 6,885.04 2,271.38 1,072.30<br />
8 Decrease in short term deposits with banks - - 1,081.85 - 508.72<br />
8,950.81 14,076.53 14376.76 8,869.34 4,324.56<br />
Application of Funds<br />
9 Capital Expenditure (net) 2,396.29 2,873.33 5,<strong>11</strong>8.13 4,705.95 2,456.30<br />
10 Investments made (net of sales) 321.31 9,429.82 8,055.90 2,370.34 462.94<br />
<strong>11</strong> Payment of Redemption Premium on NCD 71.96 - - - -<br />
12 Increase in short term deposits with banks 804.66 490.67 - 1,122.40 -<br />
13 (a) Increase in Working Capital 3,000.57 - 830.47 - 728.26<br />
(b) Increase in Finance receivables - - - - 4.61<br />
14 Dividends (including tax thereon) 1,467.03 991.94 345.70 659.68 676.39<br />
15 Miscellaneous Expenditure (to the extent not written off or adjusted)<br />
and utilisation of Securities Premium Account [Note (a) below] 193.20 290.77 26.56 10.97 (3.94)<br />
8,950.81 14,076.53 14,376.76 8,869.34 4,324.56<br />
Notes :<br />
(a) Utilisation of Securities Premium Account includes<br />
FCCN / CARS / Rights issue expenses and premium<br />
on redemption of Debentures 193.20 292.79 30.59 15.01 0.09<br />
(b) The Sources and Application of funds does not include<br />
(i) Provision for premium on redemption of CARS / FCCN 941.08 * 1,001.46 * 835.19 * 675.19 * 284.25<br />
(ii) Liability towards premium on redemption of NCD 1,673.83 1,745.79 - - -<br />
(iii) Exchange gain (net) and depreciation thereon adjusted from<br />
General Reserve to Fixed Assets relating to FY 2007-08<br />
consequent to amendment to AS<strong>11</strong> - - 85.09 * - -<br />
(iv) Exchange gain (net) adjusted from General Reserve to<br />
Foreign Currency Monetary Item Translation Difference Account<br />
relating to FY 2007-08 consequent to amendment to AS<strong>11</strong> - - 57.89 - -<br />
(v) Exchange loss (net) on forward contracts adjusted to General<br />
Reserve on adoption of principles of hedge accounting under AS30 - - 6.87 * - -<br />
(vi) Deferred Tax on account of item 1(E) and 1(H) - (45.06) 45.06 - 12.93<br />
* net of deferred tax<br />
(c) Figures for the previous years have been regrouped wherever necessary.<br />
58
AUDITORS’ REPORT<br />
TO THE MEMBERS OF<br />
TATA MOTORS LIMITED<br />
1. We have audited the attached Balance Sheet of TATA MOTORS LIMITED (“the Company”) as at March 31, 20<strong>11</strong>, the Profit and Loss<br />
Account and the Cash Flow Statement of the Company for the year ended on that date, both annexed thereto. These financial statements<br />
are the responsibility of the Company’s Management. Our responsibility is to express an opinion on these financial statements based<br />
on our audit.<br />
2. We conducted our audit in accordance with the auditing standards generally accepted in India. Those Standards require that we plan<br />
and perform the audit to obtain reasonable assurance about whether the financial statements are free of material misstatements. An<br />
audit includes examining, on a test basis, evidence supporting the amounts and the disclosures in the financial statements. An audit<br />
also includes assessing the accounting principles used and the significant estimates made by the Management, as well as evaluating<br />
the overall financial statement presentation. We believe that our audit provides a reasonable basis for our opinion.<br />
3. As required by the Companies (Auditor’s Report) Order, 2003 (CARO) issued by the Central Government in terms of Section 227(4A) of<br />
the Companies Act, 1956, we enclose in the Annexure a statement on the matters specified in paragraphs 4 and 5 of the said Order.<br />
4. Further to our comments in the Annexure referred to in paragraph 3 above, we report as follows:<br />
(a) we have obtained all the information and explanations which to the best of our knowledge and belief were necessary for the<br />
purposes of our audit;<br />
(b) in our opinion, proper books of account as required by law have been kept by the Company so far as it appears from our examination<br />
of those books;<br />
(c) the Balance Sheet, the Profit and Loss Account and the Cash Flow Statement dealt with by this report are in agreement with the<br />
books of account;<br />
(d) in our opinion, the Balance Sheet, the Profit and Loss Account and the Cash Flow Statement dealt with by this report are in compliance<br />
with the Accounting Standards referred to in Section 2<strong>11</strong>(3C) of the Companies Act, 1956;<br />
(e) in our opinion and to the best of our information and according to the explanations given to us, the said accounts give the information<br />
required by the Companies Act, 1956 in the manner so required and give a true and fair view in conformity with the accounting<br />
principles generally accepted in India:<br />
(i) in the case of the Balance Sheet, of the state of affairs of the Company as at March 31, 20<strong>11</strong>;<br />
(ii) in the case of the Profit and Loss Account, of the profit of the Company for the year ended on that date; and<br />
(iii) in the case of the Cash Flow Statement, of the cash flows of the Company for the year ended on that date.<br />
5. On the basis of the written representations received from the Directors as on March 31, 20<strong>11</strong> taken on record by the Board of Directors,<br />
none of the Directors is disqualified as on March 31, 20<strong>11</strong> from being appointed as a director in terms of Section 274(1) (g) of the<br />
Companies Act, 1956.<br />
For DELOITTE HASKINS & SELLS<br />
Chartered Accountants<br />
(Registration No. <strong>11</strong>7366W)<br />
MUMBAI, May 26, 20<strong>11</strong><br />
N. VENKATRAM<br />
Partner<br />
(Membership No.71387)<br />
59
Sixty-sixth annual report <strong>2010</strong>-20<strong>11</strong><br />
<strong>Tata</strong> <strong>Motors</strong> Limited<br />
ANNEXURE TO THE AUDITORS’ REPORT<br />
(Referred to in paragraph 3 of our report of even date)<br />
(i) The nature of the Company’s business activities during the year are such that clauses (xiii), and (xiv) of paragraph 4 of the Companies (Auditors’<br />
Report) Order, 2003 are not applicable to the Company.<br />
(ii) In respect of its fixed assets:<br />
(a) The Company has maintained proper records showing full particulars including quantitative details and situation of fixed assets;<br />
(b) The fixed assets were physically verified during the year by the Management in accordance with a regular programme of verification which, in<br />
our opinion, provides for physical verification of all the fixed assets at reasonable intervals. According to the information and explanation given<br />
to us, no material discrepancies were noticed on such verification;<br />
(c) The fixed assets disposed off during the year, in our opinion, do not constitute a substantial part of the fixed assets of the Company and such<br />
disposal, in our opinion, has not affected the going concern status of the Company.<br />
(iii) In respect of its inventory:<br />
(a) As explained to us, the stock of finished goods (other than a significant part of the spare parts held for sale) and work-in-progress in the<br />
Company’s custody have been physically verified by the Management as at the end of the financial year, before the year-end or after the yearend,<br />
and in respect of stocks of stores and spares, the aforesaid spare parts held for sale, and raw materials in the Company’s custody, there<br />
is a perpetual inventory system and a substantial portion of the stocks have been verified during the year. In our opinion, the frequency of<br />
verification is reasonable. In case of materials and spare parts held for sale lying with the third parties, certificates confirming stocks have been<br />
received in respect of a substantial portion of the stocks held during the year or at the year-end;<br />
(b) In our opinion and according to the information and explanation given to us, the procedures of physical verification of inventories followed by<br />
the Management were reasonable and adequate in relation to the size of the Company and the nature of its business;<br />
(c) In our opinion and according to the information and explanations given to us, the Company is maintaining proper records of inventory. The<br />
discrepancies noticed on verification between the physical stocks and the book records were not material having regard to the size of the<br />
operations of the Company and have been properly dealt with in the books of account.<br />
(iv) In respect of loans, secured or unsecured, granted by the Company to companies, firms or other parties covered in the Register under Section 301 of<br />
the Companies Act, 1956, according to the information and explanations given to us:<br />
(a) the Company has granted unsecured loans aggregating `415.24 Crores to four parties covered in the register maintained under Section 301 of<br />
the Companies Act, 1956 (including `174.24 Crores granted during the year to four parties). At the year-end, the outstanding balances of such<br />
loans aggregated `434.41 Crores and maximum amount outstanding during the year was ` 434.41 Crores.<br />
(b) the rate of interest and other terms and conditions of such loans are, in our opinion, prima facie not prejudicial to the interest of the Company<br />
having regard to the market yields and the business relationship with the Company to whom loans have been granted.<br />
(c) The receipts of principal amounts have been as per stipulations however there have been delays in receipts of interests.<br />
(d) There are no overdue amounts in respect of principal outstanding. In respect of overdue interest amounts of more than rupees one lakh<br />
remaining outstanding as at the year-end, the Management has taken reasonable steps for the recovery of the overdue interest amounts.<br />
In respect of loans, secured or unsecured, taken by the Company from companies, firms or other parties covered in the Register maintained<br />
under Section 301 of the Companies Act, 1956, according to the information and explanations given to us:<br />
(e) the Company has taken loans aggregating `<strong>11</strong>.52 Crores from six parties covered in the Register maintained under Section 301 of the Companies<br />
Act, 1956 (including `1 Crore from one party during the year). At the year-end, the outstanding balance of such loans taken aggregated `<strong>11</strong>.52<br />
Crores and the maximum amount outstanding during the year was `18.04 Crores.<br />
(f) the rate of interest and other terms and conditions of such loans taken are, in our opinion, prima facie not prejudicial to the interests of the<br />
Company.<br />
(g) The principal amount is not due for repayment and the Company has been regular in payment of interest.<br />
(v) In our opinion and according to the information and explanations given to us, having regard to the explanations that some of the items purchased are<br />
of special nature and suitable alternative sources do not exist for obtaining comparable quotations, there exists an adequate internal control system<br />
commensurate with the size of the Company and the nature of its business with regard to purchases of inventory and fixed assets and with regard to<br />
the sale of goods and services. During the course of our audit, we have not observed any major weakness in such internal control system.<br />
(vi) In respect of contracts or arrangements entered in the register maintained in pursuance of Section 301 of the Companies Act, 1956, to the best of our<br />
knowledge and belief and according to the information and explanations given to us:<br />
(a) The particulars of contracts or arrangements referred to Section 301 that needed to be entered in the register maintained under the said<br />
section have been so entered.<br />
(b) Where each of such transaction is in excess of rupees five lakhs in respect of any party, and having regard to our comments in para (v) above, the<br />
transactions have been made at prices which are prima facie reasonable having regard to the prevailing market prices at the relevant time.<br />
(vii) In our opinion and according to the information and explanations given to us, the Company has complied with the provisions of Sections 58A<br />
and 58AA or any other relevant provisions of the Companies Act, 1956 and the Companies (Acceptance of Deposits) Rules, 1975 with regard to the<br />
deposits accepted from the public. According to the information and explanations given to us, no order has been passed by the Company Law Board<br />
or the National Company Law Tribunal or the Reserve Bank of India or any Court or any other Tribunal.<br />
(viii) In our opinion, the Company has an adequate internal audit system commensurate with the size and the nature of its business.<br />
(ix) We have broadly reviewed the books of account relating to the manufacture of motor vehicles pursuant to the Rules made by the Central Government<br />
for the maintenance of cost records under Section 209 (1)(d) of the Companies Act, 1956 and are of the opinion that prima facie, the prescribed<br />
accounts and records have been made and maintained. We have, however, not made a detailed examination of the records with a view to determining<br />
whether they are accurate or complete. To the best of our knowledge and according to the information and explanations given to us, the Central<br />
Government has not prescribed maintenance of cost records for any other product of the Company.<br />
(x) According to the information and explanations given to us in respect of statutory dues:<br />
(a) The Company has generally been regular in depositing with the appropriate authorities undisputed dues, including provident fund, investor<br />
education and protection fund, employees’ state insurance, income-tax, sales tax, wealth tax, service tax, customs duty, excise duty, cess and<br />
other material statutory dues applicable to it. With regard to the contribution under the Employees’ Deposit Linked Insurance Scheme, 1976<br />
(the Scheme), we are informed that the Company has its own Life Cover Scheme, and consequently, an application has been made seeking an<br />
extension of exemption from contribution to the Scheme, which is awaited. Further, since the Central Government has till date not prescribed<br />
the amount of cess payable under Section 441A of the Companies Act, 1956, we are not in a position to comment upon the regularity or<br />
otherwise of the Company in depositing the same.<br />
60
(b) There were no undisputed amounts payable in respect of provident fund, investor education and protection fund, employees’ state insurance,<br />
income-tax, wealth tax, service tax, customs duty, excise duty, cess and other material statutory dues applicable to the Company that were in<br />
arrears as at March 31, 20<strong>11</strong> for a period of more than six months from the date they became payable.<br />
(c) Details of dues of income-tax, sales tax, wealth tax, service tax, customs duty, excise duty and cess which have not been deposited as on March<br />
31, 20<strong>11</strong> on account of any disputes are given below:<br />
Name of the Statute Nature of the Dues Amount Period to which the amount relates<br />
Forum where pending<br />
(` in crores)<br />
Income Tax Laws Income Tax 27.94 1997-98, 2002-03 and 2005-06 Appellate Tribunal<br />
Income Tax 38.92 1984-85, 1985-86, 1986-87, 2004-05,<br />
Commissioner<br />
2005-06, 2006-07, 2007-08 and 2008-09<br />
Central Excise Laws Excise Duty & Service Tax 0.49 <strong>2010</strong>-<strong>11</strong> High Court<br />
Excise Duty & Service Tax 481.22 1993-94 to 1994-95,1999-00, 2002-03<br />
Appellate Tribunal<br />
2004-05 to <strong>2010</strong>-<strong>11</strong><br />
Excise Duty & Service Tax 7.96 1984-85, 1994-95 to 1995-96, 2003-04,<br />
Commissioner (Appeals)<br />
2006-07 to 2007-08 and 2009-10 to <strong>2010</strong>-<strong>11</strong><br />
Excise Duty & Service Tax 0.18 2007-08, 2008-09 Additional Commissioner<br />
Sales Tax Laws Sales Tax 13.01 1995-96 Supreme Court<br />
Sales Tax 574.86 1984-85 to 1990-91,1993-94 to 2007-08 High Court<br />
Sales Tax 21.61 1988-89 to 1989-90, 1992-93, 1995-1996 to1996-97, Appellate Tribunal<br />
1999-2000 to 2000-01, 2004-05 to 2006-07<br />
Sales Tax 0.20 1996-97, 1998-99, 2001-02 Commissioner (Appeals)<br />
Sales Tax 216.79 1997-98 to 2008-09 Joint Commissioner<br />
Sales Tax 16.31 1979-80, 1986-87, 1992-93, 1994-95, 1996-97<br />
Deputy Commissioner<br />
1998-99 to 2000-01, 2003-04 to 2008-09<br />
Sales Tax 128.57 1988-89 to 1989-90, 1995-96, 1997-98,<br />
Additional Commissioner<br />
2005-06 to <strong>2010</strong>-<strong>11</strong><br />
Sales Tax 0.07 1986-87, 1988-89, 1990-91, 1995-96,<br />
Assistant Commissioner<br />
1997-98, 1999-2000<br />
Sales Tax 1.84 1986-87, 1990-91 to 1991-92, 1993-94,<br />
1996-97, 1999-2000 to 2001-02<br />
Trade Tax Officer<br />
(xi) The Company does not have any accumulated losses at the end of the financial year and has not incurred cash losses during the financial year covered<br />
by our audit and the immediately preceding financial year.<br />
(xii) In our opinion and according to the information and explanations given to us, the Company has not defaulted in the repayment of dues to banks,<br />
financial institutions and debenture holders.<br />
(xiii) Based on our examination of the records and the information and explanations given to us, the Company has not granted any loans and advances on<br />
the basis of security by way of pledge of shares, debentures and other securities.<br />
(xiv) In our opinion and according to the information and explanations given to us, the Company has not given any guarantee for loans taken by others<br />
from banks or financial institutions. Accordingly, the provisions of clause (xv) of Paragraph 4 of the Companies (Auditor’s Report) Order, 2003 are not<br />
(xv)<br />
applicable to the Company.<br />
In our opinion and according to the information and explanations given to us, the term loans have been applied for the purposes for which they were<br />
obtained.<br />
(xvi) In our opinion and according to the information and explanations given to us and on an overall examination of the Balance Sheet of the Company,<br />
as at March 31, 20<strong>11</strong>, we report that funds raised on short term basis of ` 4,797.78 Crores have been used during the year for long-term investment.<br />
Further the Company has explained that steps are being taken to augment long term funds.<br />
(xvii) According to the information and explanations given to us, the Company has not made any preferential allotment of shares to parties and companies<br />
covered in the register maintained under Section 301 of the Companies Act, 1956.<br />
(xviii)According to the information and explanations given to us, during the period covered by our audit report, the Company has issued 5,000 debentures<br />
of `10 lakhs each. The Company has created security in respect of 5,000 debentures issued in the current year and in respect of 2,000 debentures<br />
issued in month of March <strong>2010</strong>.<br />
(xix) According to the information and explanations given to us, during the year covered by our audit report, the Company has not raised any money by<br />
public issue.<br />
(xx)<br />
To the best of our knowledge and according to the information and explanations given to us, no fraud by the Company and no material fraud on the<br />
Company has been noticed or reported during the year.<br />
For DELOITTE HASKINS & SELLS<br />
Chartered Accountants<br />
(Registration No. <strong>11</strong>7366W)<br />
MUMBAI, May 26, 20<strong>11</strong><br />
N. VENKATRAM<br />
Partner<br />
(Membership No.71387)<br />
61
Sixty-sixth annual report <strong>2010</strong>-20<strong>11</strong><br />
<strong>Tata</strong> <strong>Motors</strong> Limited<br />
Balance Sheet as at March 31, 20<strong>11</strong><br />
(` in crores)<br />
As at<br />
Schedule Page March 31,<br />
SOURCES OF FUNDS <strong>2010</strong><br />
1. SHAREHOLDERS’ FUNDS<br />
(a) Share Capital 1 70 637.71 570.60<br />
(b) Reserves and Surplus 2 70 19,375.59 14,394.87<br />
20,013.30 14,965.47<br />
2. LOAN FUNDS<br />
(a) Secured 3 72 7,766.05 7,742.60<br />
(b) Unsecured 4 72 8,132.70 8,851.94<br />
15,898.75 16,594.54<br />
3. DEFERRED TAX LIABILITY (NET) [Note A(3)(a)] 87 2,023.16 1,508.64<br />
4. TOTAL 37,935.21 33,068.65<br />
APPLICATION OF FUNDS<br />
5. FIXED ASSETS 5 73<br />
(a) Gross Block 21,883.32 18,416.81<br />
(b) Less - Depreciation / Amortisation 8,466.25 7,212.92<br />
(c) Net Block 13,417.07 <strong>11</strong>,203.89<br />
(d) Capital Work-in-Progress 4,058.56 5,232.15<br />
17,475.63 16,436.04<br />
6. INVESTMENTS 6 74 22,624.21 22,336.90<br />
7. FOREIGN CURRENCY MONETARY ITEM TRANSLATION<br />
DIFFERENCE ACCOUNT (NET) [Note A(9)] 94 - 161.69<br />
8. CURRENT ASSETS, LOANS AND ADVANCES<br />
(a) Interest Accrued on Investments 0.08 0.<strong>11</strong><br />
(b) Inventories 7 79 3,891.39 2,935.59<br />
(c) Sundry Debtors 8 79 2,602.88 2,391.92<br />
(d) Cash and Bank Balances 9 79 2,428.92 1,753.26<br />
(e) Loans and Advances 10 80 5,167.34 4,425.73<br />
14,090.61 <strong>11</strong>,506.61<br />
9. CURRENT LIABILITIES AND PROVISIONS<br />
(a) Current Liabilities <strong>11</strong> 82 13,032.53 14,609.16<br />
(b) Provisions 12 82 3,222.71 2,763.43<br />
16,255.24 17,372.59<br />
10. NET CURRENT ASSETS [(8) LESS (9)] (2,164.63) (5,865.98)<br />
<strong>11</strong>. TOTAL 37,935.21 33,068.65<br />
12. SIGNIFICANT ACCOUNTING POLICIES 83<br />
13. NOTES TO BALANCE SHEET 13 86<br />
As per our report attached<br />
For DELOITTE HASKINS & SELLS<br />
Chartered Accountants<br />
N VENKATRAM<br />
Partner<br />
RATAN N TATA<br />
Chairman<br />
RAVI KANT<br />
Vice-Chairman<br />
J J IRANI<br />
N N WADIA<br />
S M PALIA<br />
S BHARGAVA<br />
For and on behalf of the Board<br />
CARL- PETER FORSTER<br />
Managing Director & Group CEO<br />
P M TELANG<br />
Managing Director - India Operations<br />
N MUNJEE C RAMAKRISHNAN<br />
V K JAIRATH<br />
Chief Financial Officer<br />
R SEN<br />
R SPETH<br />
H K SETHNA<br />
Company Secretary<br />
Directors<br />
Mumbai, May 26, 20<strong>11</strong> Mumbai, May 26, 20<strong>11</strong><br />
62
Profit and Loss Account for the year ended March 31, 20<strong>11</strong><br />
(` in crores)<br />
Schedule Page 2009-<strong>2010</strong><br />
INCOME<br />
1. Sale of Products and Other Income from Operations A (1) 66 52,135.97 38,364.10<br />
Less : Excise Duty 4,095.51 2,771.05<br />
48,040.46 35,593.05<br />
2. Dividend and Other Income A (2) 66 183.26 1,853.45<br />
48,223.72 37,446.50<br />
EXPENDITURE<br />
3. Manufacturing and Other Expenses B 67 44,086.83 32,141.23<br />
4. Expenditure Transferred to Capital<br />
and Other Accounts (817.68) (726.46)<br />
43,269.15 31,414.77<br />
PROFIT BEFORE DEPRECIATION, INTEREST,<br />
EXCEPTIONAL ITEMS AND TAX 4,954.57 6,031.73<br />
5. Product Development Expenses 106.17 144.03<br />
6. Depreciation / Amortisation 5 73 1,360.77 1,033.87<br />
7. Interest and Discounting Charges (net) [Note B(4)] 95 1,143.99 1,103.84<br />
PROFIT BEFORE EXCEPTIONAL ITEMS AND TAX 2,343.64 3,749.99<br />
8. Exchange Loss (net) on Revaluation of<br />
Foreign Currency Borrowings, Deposits and Loans (147.12) (69.59)<br />
9. Loss on Redemption of Investment in Preference<br />
Shares Held in a Subsidiary Company [Note 15] 77 - (850.86)<br />
PROFIT BEFORE TAX 2,196.52 2,829.54<br />
10. Tax Expense [Note A(3)(C)] 87 (384.70) (589.46)<br />
PROFIT AFTER TAX 1,8<strong>11</strong>.82 2,240.08<br />
<strong>11</strong>. Balance brought forward from Previous Year 1,934.13 1,685.99<br />
AMOUNT AVAILABLE FOR APPROPRIATION 3,745.95 3,926.07<br />
12. APPROPRIATIONS<br />
(a) Proposed Dividend 1,274.23 859.05<br />
(b) Tax on Proposed Dividend 192.80 132.89<br />
(c) Debenture Redemption Reserve - 500.00<br />
(d) General Reserve 200.00 500.00<br />
(e) Balance carried to Balance Sheet 2,078.92 1,934.13<br />
3,745.95 3,926.07<br />
13. EARNINGS PER SHARE [Note B (7)] 97<br />
I. Ordinary Shares<br />
(a) Basic ` 30.28 42.37<br />
(b) Diluted ` 28.92 38.98<br />
II. ‘A’ Ordinary Shares<br />
(a) Basic ` 30.78 42.87<br />
(b) Diluted ` 29.42 39.48<br />
14. SIGNIFICANT ACCOUNTING POLICIES 83<br />
15. NOTES TO PROFIT AND LOSS ACCOUNT 13 to 17 95<br />
As per our report attached<br />
For DELOITTE HASKINS & SELLS<br />
Chartered Accountants<br />
N VENKATRAM<br />
Partner<br />
RATAN N TATA<br />
Chairman<br />
RAVI KANT<br />
Vice-Chairman<br />
J J IRANI<br />
N N WADIA<br />
S M PALIA<br />
S BHARGAVA<br />
For and on behalf of the Board<br />
CARL- PETER FORSTER<br />
Managing Director & Group CEO<br />
P M TELANG<br />
Managing Director - India Operations<br />
N MUNJEE C RAMAKRISHNAN<br />
V K JAIRATH<br />
Chief Financial Officer<br />
R SEN<br />
R SPETH<br />
H K SETHNA<br />
Company Secretary<br />
Directors<br />
Mumbai, May 26, 20<strong>11</strong> Mumbai, May 26, 20<strong>11</strong><br />
63
Sixty-sixth annual report <strong>2010</strong>-20<strong>11</strong><br />
<strong>Tata</strong> <strong>Motors</strong> Limited<br />
Cash Flow Statement for the year ended March 31, 20<strong>11</strong><br />
(` in crores)<br />
<strong>2010</strong>-20<strong>11</strong> 2009-<strong>2010</strong><br />
A. Cash flow from Operating Activities<br />
Profit after tax 1,8<strong>11</strong>.82 2,240.08<br />
Adjustments for:<br />
Depreciation / amortisation (including Lease Equalisation adjusted in income) 1,356.26 1,029.36<br />
Loss on sale of assets (net) (including assets scrapped / written off) 4.60 38.40<br />
Relocation expenditure, etc. 0.58 67.17<br />
Profit on sale of investments (net) (2.28) (1,801.71)<br />
Loss on redemption of investment in preference shares held in a subsidiary<br />
- 850.86<br />
company<br />
Provision for diminution in value of investments (net) 34.00 61.05<br />
Impairment of loans to associates and subsidiaries - 23.63<br />
Reversal of provision for inter corporate deposits (net) (8.02) (0.16)<br />
Wealth tax 0.81 0.90<br />
Tax expense 384.70 589.46<br />
Interest / Dividend (net) 965.27 1,054.48<br />
Exchange differences 108.97 13.24<br />
Employee Separation Cost - 2.02<br />
2,844.89 1,928.70<br />
Operating Profit before Working Capital changes 4,656.71 4,168.78<br />
Adjustments for:<br />
Trade and other receivables (722.36) (1,601.82)<br />
Inventories (955.80) (705.78)<br />
Trade and other payables (1,334.54) 3,664.63<br />
(3,012.70) 1,357.03<br />
Vehicle loans and hire purchase receivables 366.41 1,393.58<br />
(2,646.29) 2,750.61<br />
Cash generated from operations 2,010.42 6,919.39<br />
Income taxes paid (net) (504.86) (519.21)<br />
Net Cash from Operating Activities 1,505.56 6,400.18<br />
B. Cash Flow from Investing Activities<br />
Purchase of fixed assets (2,391.12) (2,330.38)<br />
Sale of fixed assets 9.47 20.21<br />
Loans to associates and subsidiaries (174.24) (107.90)<br />
Refund received against loan to associates and subsidiaries 8.62 -<br />
Advance against investments in subsidiary companies and joint venture (20.00) (2.00)<br />
Investments in subsidiary companies (463.36) (10,619.91)<br />
Investments in associate companies (4.09) -<br />
Investments in joint venture (200.00) (130.00)<br />
Investments - others (106.08) -<br />
Investments in Mutual Fund (made) / sold (net) 437.28 (519.43)<br />
Decrease in Investments in retained interests in securitisation transactions 3.20 50.43<br />
Sale / redemption of investments in subsidiary companies - 1,185.80<br />
Sale / redemption of investments - others 0.75 958.51<br />
Decrease in short term Inter-corporate deposits 34.<strong>11</strong> 16.21<br />
Deposits of Margin Money / Cash Collateral (59.89) (524.41)<br />
Realisation of Margin Money / Cash Collateral 215.74 377.63<br />
Fixed deposits with scheduled banks made (1,090.10) (412.20)<br />
Fixed deposits with scheduled banks realised 890.33 2.15<br />
Decrease / (Increase) in restricted deposits with scheduled banks 4.35 (7.08)<br />
Interest received 202.15 135.54<br />
Dividend / Income on investments received 181.00 58.54<br />
Net Cash used in Investing Activities (2,521.88) (<strong>11</strong>,848.29)<br />
64
Cash Flow Statement for the year ended March 31, 20<strong>11</strong> (contd.)<br />
(` in crores)<br />
<strong>2010</strong>-20<strong>11</strong> 2009-<strong>2010</strong><br />
C. Cash Flow from Financing Activities<br />
Expenses on Foreign Currency Convertible Notes (FCCN) conversion (3.59) (0.03)<br />
Brokerage and other expenses on Non-Convertible Debentures (NCD) (90.66) (150.75)<br />
Proceeds from issue of shares through QIP (net of issue expenses) 3,249.80 -<br />
Proceeds from issue of shares held in abeyance 3.08 0.05<br />
Proceeds from Global Depository Shares (GDS) issue - 1,794.19<br />
Reimbursement of expenses / (Expenses) incurred on issue of GDS and FCCN 0.51 (126.72)<br />
Proceeds from Fixed Deposits 339.39 2,039.<strong>11</strong><br />
Repayment of Fixed Deposits (233.58) (75.96)<br />
Proceeds from long term borrowings 1,221.68 6,432.48<br />
Repayment of long term borrowings (1,274.56) (837.88)<br />
Premium paid on redemption of NCD (71.96) -<br />
Proceeds from short term borrowings 8,223.64 6,716.51<br />
Repayment of short term borrowings (7,023.49) (6,155.84)<br />
Net change in other short-term borrowings (with maturity up to three months) (494.70) (2,366.44)<br />
Dividend paid (including Dividend tax) (990.21) (344.90)<br />
Interest paid [including discounting charges paid,<br />
` 418.50 crores (2009-<strong>2010</strong> ` 503.78 crores)] (1,206.93) (1,389.48)<br />
Net Cash from Financing Activities 1,648.42 5,534.34<br />
Net Increase in Cash and cash equivalents 632.10 86.23<br />
Cash and cash equivalents as at March 31, (Opening Balance) * # 716.27 668.74<br />
Exchange fluctuation on foreign currency bank balances 3.77 (38.70)<br />
Cash and cash equivalents as at March 31, (Closing Balance) * # 1,352.14 716.27<br />
Non-cash transactions:<br />
FCCN / CARS converted to Ordinary shares [Refer note (A)1(I)(d), page 86] 1,490.25 1,555.70<br />
Loan to subsidiary converted to equity - 89.69<br />
* Excludes Cash Collateral of ` 454.07 crores (as at March 31, <strong>2010</strong> ` 609.70 crores, as at March 31, 2009 ` 462.92 crores)<br />
# Excludes Fixed / restricted deposits with scheduled banks ` 622.71 crores (as at March 31, <strong>2010</strong> ` 427.29 crores, as at March 31, 2009 ` 10.16 crores)<br />
Previous year’s figures have been restated, wherever necessary, to conform to this year’s classification.<br />
As per our report attached<br />
For DELOITTE HASKINS & SELLS<br />
Chartered Accountants<br />
N VENKATRAM<br />
Partner<br />
RATAN N TATA<br />
Chairman<br />
RAVI KANT<br />
Vice-Chairman<br />
J J IRANI<br />
N N WADIA<br />
S M PALIA<br />
S BHARGAVA<br />
For and on behalf of the Board<br />
CARL- PETER FORSTER<br />
Managing Director & Group CEO<br />
P M TELANG<br />
Managing Director - India Operations<br />
N MUNJEE C RAMAKRISHNAN<br />
V K JAIRATH<br />
Chief Financial Officer<br />
R SEN<br />
R SPETH<br />
H K SETHNA<br />
Company Secretary<br />
Directors<br />
Mumbai, May 26, 20<strong>11</strong> Mumbai, May 26, 20<strong>11</strong><br />
65
Sixty-sixth annual report <strong>2010</strong>-20<strong>11</strong><br />
<strong>Tata</strong> <strong>Motors</strong> Limited<br />
Schedules forming part of the Profit and Loss Account<br />
(` in crores)<br />
“A” [Item no. 1 and 2]<br />
<strong>2010</strong>-20<strong>11</strong> 2009-<strong>2010</strong><br />
SALE OF PRODUCTS AND OTHER INCOME<br />
1. Sale of products and other income from operations<br />
(a) Sale of Products / Services (Schedule 14, page 100) [Note 1 below] 51,788.43 37,925.17<br />
(b) Income from Vehicle Loan contracts [Note 2 below] <strong>11</strong>4.50 219.66<br />
Sales / Income from Operations 51,902.93 38,144.83<br />
(c) Other operating income [Note 3 below] 233.04 219.27<br />
52,135.97 38,364.10<br />
2. Dividend and other income<br />
(a) Trade investments (long term) [Note 4 below] 157.79 51.34<br />
(b) Other investments (long term) 0.21 0.19<br />
(c) Other investments (current) 22.98 0.21<br />
(d) Profit on sale of current investments [Note 5 below] 2.28 689.20<br />
(e) Profit on sale of investments (net) (trade, long term) [Note 6 below] - 1,<strong>11</strong>2.51<br />
183.26 1,853.45<br />
<strong>2010</strong>-20<strong>11</strong> 2009-<strong>2010</strong><br />
Notes : (1) Includes exchange gain / (loss) (net) 64.38 (24.27)<br />
(2) Includes :<br />
(i) Loss on securitisation of Loan contracts (net) (1.54) (1.59)<br />
(ii) Interest income from Loan contracts (net) 104.94 208.14<br />
(3) Includes profit on sale of assets (net) [includes Capital Profits of ` 1.26 crores<br />
(2009-<strong>2010</strong> ` 0.88 crore)] 3.72 6.84<br />
(4) Includes dividend from subsidiary companies 92.33 7.62<br />
(5) Includes profit on sale of investment in <strong>Tata</strong> Steel Ltd. - 688.61<br />
(6) Includes profit on sale of controlling stake in a subsidiary company [Note C(iv), page 98] - 1,<strong>11</strong>2.51<br />
66
Schedules forming part of the Profit and Loss Account<br />
(` in crores)<br />
“B” [Item no. 3]<br />
<strong>2010</strong>-20<strong>11</strong> 2009-<strong>2010</strong><br />
MANUFACTURING AND OTHER EXPENSES<br />
1. Purchase of products for sale etc. [Note B(1), page 95] 7,363.13 4,513.23<br />
2. Consumption of raw materials and components [Schedule 17, page 103] 27,058.47 20,392.60<br />
3. Processing charges 1,676.07 1,212.90<br />
4. Payments to and provisions for employees : [Refer Note B(5), page 96]<br />
(a) Salaries, wages and bonus 1,808.29 1,444.54<br />
(b) Contribution to provident and other funds 219.49 184.56<br />
(c) Workmen and staff welfare expenses [Note B(i), page 68] 266.24 207.03<br />
2,294.02 1,836.13<br />
5. Expenses for manufacture, administration and selling :<br />
(a) Stores, spare parts and tools consumed 625.45 451.91<br />
(b) Freight, transportation, port charges, etc. 743.90 546.32<br />
(c) Repairs to buildings [Note B(ii), page 68] 50.86 56.13<br />
(d) Repairs to plant, machinery, etc. [Note B(iii), page 68] 77.39 76.70<br />
(e) Power and fuel 471.28 362.62<br />
(f) Rent 52.43 45.95<br />
(g) Rates and taxes 27.88 12.<strong>11</strong><br />
(h) Insurance 55.<strong>11</strong> 44.76<br />
(i) Publicity 724.52 387.35<br />
(j) Incentive / Commission to dealers 814.77 644.47<br />
(k) Works operation and other expenses [Note B(iv), page 68] 2,390.65 2,135.63<br />
6,034.24 4,763.95<br />
6. Excise Duty on change in Stock-in-trade 15.12 29.05<br />
7. Changes in Stock-in-trade and Work-in-progress :<br />
A Opening Stock<br />
(i) Work-in-progress 342.92 245.95<br />
(ii) Stock-in-trade 1,389.53 879.87<br />
1,732.45 1,125.82<br />
B Closing Stock<br />
(i) Work-in-progress 423.80 342.92<br />
(ii) Stock-in-trade 1,662.87 1,389.53<br />
2,086.67 1,732.45<br />
(354.22) (606.63)<br />
44,086.83 32,141.23<br />
67
Sixty-sixth annual report <strong>2010</strong>-20<strong>11</strong><br />
<strong>Tata</strong> <strong>Motors</strong> Limited<br />
“B” [Item no. 3] (contd.)<br />
Schedules forming part of the Profit and Loss Account<br />
NOTES :<br />
(i) Item 4 (c) : Workmen and staff welfare expenses include provisions for other employee<br />
benefit schemes<br />
(` in crores)<br />
<strong>2010</strong>-20<strong>11</strong> 2009-<strong>2010</strong><br />
25.72 15.15<br />
(ii) Item 5 (c) : Repairs to buildings exclude amounts charged to other revenue accounts 13.41 9.28<br />
(iii) Item 5 (d) : Repairs to plant, machinery, etc. exclude amounts charged to other revenue<br />
accounts<br />
199.72 139.78<br />
(iv) Item 5 (k) : Works operation and other expenses include :<br />
(1) Loss on assets scrapped / written off 2.42 45.24<br />
(2) Commission and Brokerage on sales 5.92 5.10<br />
(3) Provisions and write off for sundry debtors, vehicle loans and advances<br />
(net)<br />
184.08 292.75<br />
(4) Lease rentals in respect of plant and machinery 0.09 0.02<br />
68
Schedules forming part of the Profit and Loss Account<br />
(` in crores)<br />
“B” [Item no. 3] (contd.)<br />
<strong>2010</strong>-20<strong>11</strong> 2009-<strong>2010</strong><br />
MANAGERIAL REMUNERATION :<br />
1. Managerial remuneration for directors (excluding provision for encashable<br />
leave and gratuity as separate actuarial valuation for whole-time directors is not<br />
available) # 25.19 12.90<br />
2. The above is inclusive of :<br />
(a) Estimated expenditure on perquisites 0.33 0.17<br />
(b) Contribution to provident / superannuation funds 0.67 0.18<br />
(c) Commission to directors 8.75 9.90<br />
3. Directors’ sitting fees 0.29 0.32<br />
4. Remuneration to directors :<br />
(a) Profit after tax as per profit and loss account 1,8<strong>11</strong>.82 2,240.08<br />
(b) Add: (i) Managerial remuneration 25.19 12.90<br />
(ii) Directors’ sitting fees 0.29 0.32<br />
(iii) Tax expense 384.70 589.46<br />
(iv) Provision for diminution in value of investments 34.00 61.05<br />
(v) Loss on redemption of investment in preference shares - 850.86<br />
(vi) Depreciation / Amortisation as per books 1,360.77 1,033.87<br />
1,804.95 2,548.46<br />
3,616.77 4,788.54<br />
(c) Less: (i) Capital profit :<br />
(a) Profit (net) on sale of assets (1.26) (0.88)<br />
(b) Profit (net) on sale of investments (2.28) (1,801.71)<br />
(ii) Depreciation / Amortisation as per Section 350 of the<br />
Companies Act, 1956 (1,360.77) (1,033.87)<br />
(1,364.31) (2,836.46)<br />
Net Profit as per Section 349 / 350 of the Companies Act, 1956 2,252.46 1,952.08<br />
(d) Limit on remuneration to whole-time directors - 10% of net profit 225.25 195.21<br />
Remuneration to whole-time directors [includes commission payable to<br />
whole-time directors ` 2.75 crores (2009-<strong>2010</strong> ` 5.90 crores)] 19.19 8.90<br />
(e) Limit on commission to non-whole-time directors - 1% of net profit 22.52 19.52<br />
Commission payable to non-whole-time directors 6.00 4.00<br />
# Excludes retirement benefits / accruals thereof and fees for services 2.09 1.50<br />
69
Sixty-sixth annual report <strong>2010</strong>-20<strong>11</strong><br />
<strong>Tata</strong> <strong>Motors</strong> Limited<br />
Schedules forming part of the Balance Sheet<br />
(` in crores)<br />
“1” [Item No. 1(a)]<br />
As at<br />
As at<br />
March 31, March 31,<br />
20<strong>11</strong> <strong>2010</strong><br />
SHARE CAPITAL [Note (A) 1, page 86]<br />
Authorised:<br />
70,00,00,000 Ordinary shares of ` 10 each (as at March 31, <strong>2010</strong>: 70,00,00,000 shares) 700.00 700.00<br />
20,00,00,000 ‘A’ Ordinary shares of ` 10 each (as at March 31, <strong>2010</strong>: 20,00,00,000 shares) 200.00 200.00<br />
30,00,00,000 Convertible Cumulative Preference shares of ` 100 each<br />
(as at March 31, <strong>2010</strong>: 30,00,00,000 shares) 3,000.00 3,000.00<br />
3,900.00 3,900.00<br />
Issued and subscribed:<br />
53,82,72,284 Ordinary shares of ` 10 each (as at March 31, <strong>2010</strong>: 50,63,81,170 shares) 538.27 506.38<br />
9,63,41,706 ‘A’ Ordinary shares of ` 10 each (as at March 31, <strong>2010</strong>: 6,41,76,374 shares) 96.34 64.18<br />
634.61 570.56<br />
Less: Calls in arrears - Ordinary shares 0.01 0.01<br />
634.60 570.55<br />
Share Forfeiture - Ordinary shares 0.05 0.05<br />
Amount received in respect of Ordinary shares pending allotment 3.06 -<br />
637.71 570.60<br />
“2” [Item No. 1(b)]<br />
As at Additions Deductions As at<br />
March 31, March 31,<br />
<strong>2010</strong> 20<strong>11</strong><br />
RESERVES AND SURPLUS<br />
(a) Securities Premium Account [Note (i) and (ii), page 71] 6,714.59 4,829.80 193.71 <strong>11</strong>,350.68<br />
5,366.31 3,293.74 1,945.46 6,714.59<br />
(b) Capital Redemption Reserve 2.28 - - 2.28<br />
2.28 - - 2.28<br />
(c) Debenture Redemption Reserve 1,102.15 - - 1,102.15<br />
602.15 500.00 - 1,102.15<br />
(d) Amalgamation Reserve 0.05 - - 0.05<br />
0.05 - - 0.05<br />
(e) Special Reserve - - - -<br />
55.05 - 55.05 -<br />
(f) Revaluation Reserve [Note (iii), page 71] 24.63 - 0.44 24.19<br />
25.07 - 0.44 24.63<br />
(g) Hedging Reserve Account - - - -<br />
(87.51) 87.51 - -<br />
(h) General Reserve [Note (iv), page 71] 4,617.04 200.28 - 4,817.32<br />
4,066.71 555.05 4.72 4,617.04<br />
12,460.74 5,030.08 194.15 17,296.67<br />
10,030.<strong>11</strong> 4,436.30 2,005.67 12,460.74<br />
(i) Profit and Loss Account 2,078.92<br />
1,934.13<br />
19,375.59<br />
14,394.87<br />
70
Schedules forming part of the Balance Sheet<br />
(` in crores)<br />
“2” [Item No. 1(b)] (contd.)<br />
Notes:-<br />
<strong>2010</strong>-20<strong>11</strong> 2009-<strong>2010</strong><br />
Additions Deductions Additions Deductions<br />
(i) The opening and closing balances of Securities Premium<br />
Account are net of calls in arrears of ` 0.03 crore<br />
(ii) Changes in Securities Premium Account<br />
(a) Premium on shares issued on conversion of Foreign<br />
Currency Convertible Notes (FCCN) (including premium<br />
on shares issued which were held in abeyance out of<br />
Rights issue of shares) 1,466.70 - 1,529.<strong>11</strong> -<br />
(b) FCCN conversion expenses - 3.59 - 25.57<br />
(c) Premium on issue of shares through Qualified Institutional<br />
- - -<br />
Placement (QIP) 3,310.52<br />
(d) QIP issue expenses - 101.21 - -<br />
(e) Premium on issue of Global Depository Shares (GDS) - - 1,764.28 -<br />
(f) Recovery of expenses / Expenses on issue of GDS and FCCN 0.51 - - 126.82<br />
(g) Brokerage, stamp duty and other fees on Non-Convertible<br />
Debentures [net of tax ` 1.77 crores (2009-<strong>2010</strong> ` Nil)] - 88.89 - 140.40<br />
(h) Premium on redemption of Debentures / FCCN /<br />
Convertible Alternative Reference Securities (CARS) (net)<br />
(including exchange differences and withholding tax)<br />
[net of tax ` 139.99 crores (2009-<strong>2010</strong> ` 61.33 crores)] 52.07 - - 1,652.67<br />
(i) Others - 0.02 0.35 -<br />
4,829.80 193.71 3,293.74 1,945.46<br />
<strong>2010</strong>-20<strong>11</strong> 2009-<strong>2010</strong><br />
Additions Deductions Additions Deductions<br />
(iii) Change in Revaluation Reserve :<br />
Depreciation on revalued portion of assets taken over on<br />
amalgamation of a company - 0.44 - 0.44<br />
- 0.44 - 0.44<br />
(iv) Changes in General Reserve :<br />
(a) Amount recovered / paid (net) towards indemnity relating<br />
to business amalgamated in prior year 0.28 - - 4.72<br />
(b) Amount transferred from Special Reserve - - 55.05 -<br />
(c) Amount transferred from Profit and Loss Account 200.00 - 500.00 -<br />
200.28 - 555.05 4.72<br />
71
Sixty-sixth annual report <strong>2010</strong>-20<strong>11</strong><br />
<strong>Tata</strong> <strong>Motors</strong> Limited<br />
Schedules forming part of the Balance Sheet<br />
“3” [Item no. 2(a)] (` in crores)<br />
As at<br />
As at<br />
March 31, March 31,<br />
20<strong>11</strong> <strong>2010</strong><br />
LOANS - Secured [Note (A) 2, page 86]<br />
(a) Privately placed Non-Convertible Debentures :<br />
(i) 2% Non-Convertible Debentures (20<strong>11</strong>) - 800.00<br />
(ii) 2% Non-Convertible Debentures (2013) [Note 2(i)(a), page 86 and Note 2(ii)(a), page 87] 350.00 350.00<br />
(iii) 2% Non-Convertible Debentures (2014) [Note 2(i)(a), page 86 and Note 2(ii)(a), page 87] 1,800.00 1,800.00<br />
(iv) 2% Non-Convertible Debentures (2016) [Note 2(i)(a), page 86 and Note 2(ii)(a), page 87] 1,250.00 1,250.00<br />
(v) 9.95% Non-Convertible Debentures (2020) [Note 2(i)(b), page 87 and Note 2(ii)(a), page 87] 200.00 200.00<br />
(vi) 10.25% Non-Convertible Debentures (2022) [Note 2(i)(c), page 87 and Note 2(ii)(a), page 87] 100.00 -<br />
(vii) 10.25% Non-Convertible Debentures (2023) [Note 2(i)(c), page 87 and Note 2(ii)(a), page 87] 100.00 -<br />
(viii) 10.25% Non-Convertible Debentures (2024) [Note 2(i)(c), page 87 and Note 2(ii)(a), page 87] 150.00 -<br />
(ix) 10.25% Non-Convertible Debentures (2025) [Note 2(i)(c), page 87 and Note 2(ii)(a), page 87] 150.00 -<br />
(b) From Banks :<br />
(i) Buyers line of credit (at floating interest rate) (long term) [Notes 2(i)(d) and 2(iii), page 87] 488.10 619.97<br />
(ii) Loans, Cash Credit, Overdrafts Accounts and Buyers line of credit (short term) [Note 2(i)<br />
(d), page 87] 3,177.95 2,722.63<br />
7,766.05 7,742.60<br />
“4” [Item no. 2(b)] As at As at<br />
March 31, March 31,<br />
20<strong>11</strong> <strong>2010</strong><br />
LOANS - Unsecured<br />
(a) Foreign Currency Convertible Notes (FCCN) /<br />
Convertible Alternative Reference Securities (CARS) [Note (C) (i), page 98] 2,636.60 4,161.86<br />
(b) Privately placed Non-Convertible Debentures :<br />
(i) 9.90% Non-Convertible Debentures (2020) [Note 2(ii)(b), page 87] 150.00 -<br />
(ii) 9.75% Non-Convertible Debentures (2020) [Note 2(ii)(b), page 87] 100.00 -<br />
(iii) 9.70% Non-Convertible Debentures (2020) [Note 2(ii)(b), page 87] 150.00 -<br />
(c) Fixed Deposits * # :<br />
(i) From Public 2,435.51 2,333.05<br />
(ii) From Shareholders 856.84 840.40<br />
(d) Commercial papers [maximum balance outstanding during the year<br />
` 3,390 crores (2009-<strong>2010</strong> : ` 1,725 crores)] 1,519.82 768.63<br />
(e) Short term loans :<br />
(i) From Banks 200.00 625.00<br />
(ii) From Subsidiaries 4.00 60.00<br />
(iii) From Others 7.00 13.00<br />
(f) Other loans :<br />
(i) From Banks :<br />
- Buyers’ line of credit 22.93 -<br />
(ii) From Others 50.00 50.00<br />
8,132.70 8,851.94<br />
* Includes from Directors <strong>11</strong>.52 16.12<br />
# Includes repayable within one year 1,199.02 191.57<br />
72
Schedules forming part of the Balance Sheet<br />
(` in crores)<br />
“5”[Item no. 5]<br />
FIXED ASSETS<br />
Cost as at April<br />
1, <strong>2010</strong><br />
Additions /<br />
Adjustments<br />
[Note (iv)]<br />
Deductions /<br />
Adjustments<br />
Cost as at<br />
March 31, 20<strong>11</strong><br />
Depreciation /<br />
Amortisation<br />
for the year<br />
<strong>2010</strong>-20<strong>11</strong><br />
[Note (vi) and<br />
(ix)]<br />
Accumulated<br />
depreciation /<br />
amortisation<br />
up to March 31,<br />
20<strong>11</strong> [Note (v)<br />
and (ix)]<br />
Net Book Value<br />
as at March 31,<br />
20<strong>11</strong><br />
(a) Land 519.76 - - 519.76 - - 519.76<br />
<strong>11</strong>9.<strong>11</strong> 400.65 - 519.76 - - 519.76<br />
(b) Buildings, etc. [Note (i) and (ii)(a)] 1,542.80 521.03 0.37 2,063.46 58.16 4<strong>11</strong>.90 1,651.56<br />
1,209.22 335.55 1.97 1,542.80 42.41 353.82 1,188.98<br />
(c) Leasehold Land [Note (ii)(b)] 102.47 16.26 - <strong>11</strong>8.73 1.57 10.08 108.65<br />
77.10 25.37 - 102.47 2.58 8.51 93.96<br />
(d)<br />
(e)<br />
(f)<br />
Plant & Machinery and<br />
Equipment [Note (ii)(a) and (iii)] 12,230.44 2,744.31 105.05 14,869.70 963.33 6,539.89 8,329.81<br />
10,643.83 1,645.15 58.54 12,230.44 747.22 5,672.18 6,558.26<br />
Water System and<br />
Sanitation [Note (ii)(a)] 109.08 32.28 - 141.36 6.24 40.06 101.30<br />
87.15 21.94 0.01 109.08 4.67 33.82 75.26<br />
Furniture, Fixtures and<br />
Office Appliances [Note (iii)] 106.07 18.21 0.35 123.93 5.57 55.45 68.48<br />
100.38 5.75 0.06 106.07 4.87 50.21 55.86<br />
(g) Technical Know-how # 34.51 - - 34.51 - 34.51 -<br />
34.51 - - 34.51 - 34.51 -<br />
(h) Vehicles and Transport [Note (iii)] <strong>11</strong>7.68 25.86 1 0.25 133.29 15.94 75.59 57.70<br />
<strong>11</strong>0.54 18.47 <strong>11</strong>.33 <strong>11</strong>7.68 13.94 68.06 49.62<br />
(i) Plant taken on Lease [Note (viii)] 36.43 - - 36.43 2.55 27.86 8.57<br />
42.10 - 5.67 36.43 2.93 25.30 <strong>11</strong>.13<br />
(j) IT Assets taken on lease 53.22 10.70 - 63.92 12.65 42.58 21.34<br />
52.25 0.97 - 53.22 <strong>11</strong>.62 29.93 23.29<br />
(k) Leased Premises 31.28 - - 31.28 0.08 3.21 28.07<br />
31.28 - - 31.28 0.08 2.70 28.58<br />
(l) Assets given on lease 395.81 - - 395.81 4.86 379.09 16.72<br />
407.97 - 12.16 395.81 4.86 378.75 17.06<br />
(m) Software # 259.82 47.74 - 307.56 38.74 235.79 71.77<br />
252.96 6.92 0.06 259.82 44.58 194.67 65.15<br />
(n) Product Development Cost * 2,877.44 173.33 7.19 3,043.58 251.08 610.24 2,433.34<br />
736.77 2,140.67 - 2,877.44 154.<strong>11</strong> 360.46 2,516.98<br />
GRAND TOTAL 18,416.81 3,589.72 123.21 21,883.32 1,360.77 8,466.25 13,417.07<br />
13,905.17 4,601.44 89.80 18,416.81 1,033.87 7,212.92 <strong>11</strong>,203.89<br />
(o) Capital Work in Progress [Notes (vii) and (x)] 4,058.56<br />
5,232.15<br />
17,475.63<br />
16,436.04<br />
* internally generated intangible asset<br />
# other than internally generated intangible asset<br />
Notes :<br />
(i) Buildings include ` 8,631 (as at March 31, <strong>2010</strong> ` 8,631) being value of investments in shares of Co-operative Housing Societies.<br />
(ii) (a) Buildings, Water System and Sanitation and Plant and Machinery include Gross block ` 4.76 crores, ` 1.93 crores and ` 3.76 crores (as at March 31, <strong>2010</strong> ` 4.76<br />
crores, ` 1.93 crores and ` 3.76 crores) and Net Block ` 0.08 crore, ` 0.26 crore and ` 0.31 crore respectively (as at March 31, <strong>2010</strong> ` 0.08 crore, ` 0.34 crore and `<br />
0.32 crore) in respect of expenditure incurred on capital assets, ownership of which does not vest in the Company.<br />
(b) The registration of Leasehold Land of ` 10.80 crores (as at March 31, <strong>2010</strong> ` 44.33 crores) is in process.<br />
(iii) Includes Plant & Machinery and Equipment, Furniture, Fixtures and Office Appliances and Vehicles and Transport having Gross block of ` 295.79 crores, ` 0.44 crore<br />
and ` 0.40 crore (as at March 31, <strong>2010</strong> ` 164.85 crores, ` 0.73 crore and ` 0.57 crore), and Net block of ` 6.28 crores, ` 0.02 crore and ` 0.01 crore (as at March 31, <strong>2010</strong><br />
` 4.94 crores, ` 0.02 crore and ` 0.13 crore) respectively, held for disposal.<br />
(iv) Additions / Adjustments include capitalisation of exchange loss (including loss on derivative contracts) of ` 53.49 crores (2009-<strong>2010</strong> decapitalisation of exchange gain<br />
(net of loss on derivative contracts) of ` 308.48 crores).<br />
(v) Accumulated Depreciation includes :<br />
(a) An adjustment of ` 103.37 crores (as at March 31, <strong>2010</strong> ` 76.78 crores) on assets transferred / sold / discarded during the year.<br />
(b) Lease equalisation of ` 4.51 crores (2009-<strong>2010</strong> ` 4.51 crores) adjusted in lease rental income.<br />
(c) Depreciation of ` 0.44 crore (2009-<strong>2010</strong> ` 0.44 crore) on revalued portion of gross block transferred to Revaluation Reserve.<br />
(vi) Depreciation for the year includes loss of ` 14.13 crores (2009-<strong>2010</strong> ` 23.96 crores) on assets held for disposal.<br />
(vii) Capital Work-in-Progress includes :<br />
(a) Product Development Cost ` 2,079.17 crores (as at March 31, <strong>2010</strong> ` 1,399.26 crores).<br />
(b) Advances for capital expenditure of ` 259.53 crores (as at March 31, <strong>2010</strong> ` 264.91 crores).<br />
(c) Exchange differences and net premiums on derivative contracts, Net loss of ` <strong>11</strong>.58 crores (as at March 31, <strong>2010</strong> Net loss of ` 58.55 crores).<br />
(viii) The assets are under renewable secondary lease.<br />
(ix) Depreciation for the year and Accumulated Depreciation includes amortisation, diminution in value of assets and write down of assets net of reversals.<br />
(x) Capital Work-in-progress as of March 31, 20<strong>11</strong> includes building under construction of ` 309.88 crores for the purposes of manufacturing automobiles. Consequent to<br />
the decision to relocate and construct a similar manufacturing facility at another location, the management is in the process of evaluating several options, under all of<br />
which, no adjustment to the carrying amount of the building is considered necessary based on the information available at the balance sheet date.<br />
73
Sixty-sixth annual report <strong>2010</strong>-20<strong>11</strong><br />
<strong>Tata</strong> <strong>Motors</strong> Limited<br />
Schedules forming part of the Balance Sheet<br />
(` in crores)<br />
“6”[Item no. 6]<br />
INVESTMENTS As at As at<br />
Number Face Value Description March 31, 20<strong>11</strong> March 31, <strong>2010</strong><br />
Per Unit<br />
I. Long Term Investments (at Cost)<br />
(A) Trade Investments<br />
(1) Fully paid Ordinary / Equity shares (Quoted)<br />
28,38,813 10 Automobile Corporation of Goa Ltd 103.76 99.67<br />
(1,18,184 shares acquired during the year)<br />
44,32,497 10 <strong>Tata</strong> Steel Ltd 245.04 239.50<br />
(4,40,882 shares classified as long term investment during the<br />
year)<br />
70,249 10 <strong>Tata</strong> Chemicals Ltd 0.24 0.24<br />
349.04 339.41<br />
(2) Investments in Subsidiary Companies<br />
Fully Paid Ordinary / Equity Shares<br />
(Unquoted)<br />
75,00,000 100 Sheba Properties Ltd 75.00 75.00<br />
3,03,00,600 10 <strong>Tata</strong> Technologies Ltd 224.10 224.10<br />
24,48,120 10 Concorde <strong>Motors</strong> (India) Ltd 29.63 29.63<br />
6,50,00,000 10 TAL Manufacturing Solutions Ltd 150.00 150.00<br />
3,40,00,000 10 HV Transmissions Ltd 68.00 68.00<br />
3,82,50,000 10 HV Axles Ltd 76.50 76.50<br />
25,00,000 10 <strong>Tata</strong> <strong>Motors</strong> Insurance Broking and Advisory Services Ltd 19.31 17.31<br />
(20,00,000 shares acquired during the year)<br />
30,16,060 (KRW) 5,000 <strong>Tata</strong> Daewoo Commercial Vehicle Co. Ltd (Korea) 245.41 245.41<br />
24,68,153 (GBP) 1 <strong>Tata</strong> <strong>Motors</strong> European Technical Centre Plc, UK [Note 6, page 77] 19.85 15.56<br />
(6,04,529 shares acquired during the year)<br />
7,900 - <strong>Tata</strong> Technologies Inc 0.63 0.63<br />
1,05,00,00,000 10 <strong>Tata</strong> <strong>Motors</strong> Finance Ltd 1,750.00 1,350.00<br />
(20,00,00,000 shares acquired during the year)<br />
86,700,000 10 <strong>Tata</strong> Marcopolo <strong>Motors</strong> Ltd [Note 7, page 77] 86.70 86.70<br />
22,50,00,000 10 TML Distribution Company Ltd 225.00 225.00<br />
98,69,900 (THB) 100 <strong>Tata</strong> <strong>Motors</strong> (Thailand) Ltd [Note 8, page 77] 135.15 135.15<br />
1,19,02,000 (ZAR) 1 <strong>Tata</strong> <strong>Motors</strong> (SA) (Proprietary) Ltd 7.81 -<br />
(1,19,01,400 shares acquired during the year)<br />
100 (SGD) 1 TML Holdings Pte Ltd, (Singapore) [` 2,778.73] - -<br />
2,63,83,26,018 (USD) 1<br />
}<br />
[Notes 9, 10 and <strong>11</strong>, page 77] 12,814.00 12,814.00<br />
1,34,523 (EUR) 31.28 <strong>Tata</strong> Hispano <strong>Motors</strong> Carrocera S.A. [Note 12, page 77] 17.97 16.05<br />
1,83,59,203 (SGD) 1 <strong>Tata</strong> Precision Industries Pte. Ltd (Singapore) 40.53 -<br />
(1,33,00,000 shares acquired during the year)<br />
(Subsidiary company from current year)<br />
Trilix Srl., Turin (Italy) [Note 14, page 77] <strong>11</strong>.94 -<br />
15,997.53 15,529.04<br />
Carried Forward 16,346.57 15,868.45<br />
}<br />
74
Schedules forming part of the Balance Sheet<br />
(` in crores)<br />
“6”[Item no. 6] (contd.)<br />
INVESTMENTS (contd.) As at As at<br />
Number<br />
Face<br />
Value<br />
Per Unit<br />
Description March 31, 20<strong>11</strong> March 31, <strong>2010</strong><br />
I. Long Term Investments (at Cost) (Contd.)<br />
Brought forward 16,346.57 15,868.45<br />
(3) Fully Paid Ordinary / Equity Shares<br />
(Unquoted) in Others<br />
- - <strong>Tata</strong> Precision Industries Pte. Ltd (Singapore) - 3.<strong>11</strong><br />
(Subsidiary company from current year)<br />
25,000 1,000 <strong>Tata</strong> International Ltd 3.85 3.85<br />
1,383 1,000 <strong>Tata</strong> Services Ltd 0.14 0.14<br />
350 900 The Associated Building Company Ltd 0.01 0.01<br />
1,03,10,242 100 <strong>Tata</strong> Industries Ltd 183.19 82.97<br />
(36,44,462 shares acquired during the year)<br />
1,35,000 100 <strong>Tata</strong> Projects Ltd 4.68 4.68<br />
16,000 (TK) 1,000 NITA Co. Ltd (Bangladesh) 1.27 1.27<br />
33,600 100 Kulkarni Engineering Associates Ltd 0.67 0.67<br />
9,00,00,000 10 <strong>Tata</strong> Cummins Ltd 90.00 90.00<br />
12,375 1,000 <strong>Tata</strong> Sons Ltd 68.75 68.75<br />
5,23,33,170 10 <strong>Tata</strong> AutoComp Systems Ltd 77.47 77.47<br />
2,25,00,001 10 Haldia Petrochemicals Ltd 22.50 22.50<br />
2,40,000 10 Oriental Floratech (India) Pvt. Ltd 0.24 0.24<br />
9,17,46,395 100 Fiat India Automobiles Ltd [Note 13, page 77] 1,199.54 999.54<br />
(2,00,00,000 shares acquired during the year)<br />
3,97,50,000 10 Telco Construction Equipment Company Ltd [Note 5, page 77] 79.50 79.50<br />
39,05,624 10 <strong>Tata</strong> Capital Ltd 5.86 -<br />
(39,05,624 shares acquired during the year)<br />
1,737.67 1,434.70<br />
(4) Fully paid Cumulative Redeemable Preference Shares<br />
(Unquoted)<br />
(a) in Subsidiaries<br />
13,54,195 100 7% Concorde <strong>Motors</strong> (India) Ltd 13.54 13.54<br />
1,00,63,999 (USD) 100 6.25% TML Holdings Pte Ltd, (Singapore) [Note 15, page 77] 4,487.03 4,520.75<br />
13,63,624 (GBP) 1 6% <strong>Tata</strong> <strong>Motors</strong> European Technical Centre Plc, UK 9.75 9.28<br />
4,510.32 4,543.57<br />
(b) in Others<br />
1,00,000 1,000 7% <strong>Tata</strong> Sons Ltd 10.00 10.00<br />
2,10,00,000 10 8% <strong>Tata</strong> AutoComp Systems Ltd 21.00 21.00<br />
31.00 31.00<br />
4,541.32 4,574.57<br />
(5) Non Convertible Debentures (Unquoted)<br />
5,000 3,000 8% <strong>Tata</strong> Projects Ltd 1.50 2.25<br />
(2,500 debentures redeemed during the year)<br />
Total - Trade Investments 22,627.06 21,879.97<br />
(B) Other Investments<br />
(1) Fully paid Equity Shares (Unquoted)<br />
50,000 10 NICCO Jubilee Park Ltd 0.05 0.05<br />
22,627.<strong>11</strong> 21,880.02<br />
Less : Provision for Diminution in value of Long Term Investments<br />
108.73 74.73<br />
Total - Long Term Investments 22,518.38 21,805.29<br />
75
Sixty-sixth annual report <strong>2010</strong>-20<strong>11</strong><br />
<strong>Tata</strong> <strong>Motors</strong> Limited<br />
“6”[Item no. 6] (contd.)<br />
INVESTMENTS (contd.)<br />
Number<br />
Face Value<br />
Per Unit<br />
Schedules forming part of the Balance Sheet<br />
Description<br />
As at<br />
March 31, 20<strong>11</strong><br />
(` in crores)<br />
As at<br />
March 31, <strong>2010</strong><br />
Total - Long Term Investments<br />
(Brought forward) 22,518.38 21,805.29<br />
II. Current Investments - others<br />
(at Cost or Fair value whichever is lower)<br />
(A) Investments in Mutual Fund (Unquoted)<br />
Liquid/Liquid Plus Schemes<br />
2,50,00,000 10 SBI Debt Fund Series 90 Days - 38 Dividend 25.00 -<br />
1,50,00,000 10 Birla Sun Life Short Term FMP - Series 6 - Dividend<br />
Payout 15.00 -<br />
2,00,00,000 10 <strong>Tata</strong> Fixed Maturity Plan - Series 28 Scheme A -<br />
Dividend 20.00 -<br />
2,50,00,000 10 DSP Blackrock FMP - 3M Series 29 - Dividend Payout 25.00 -<br />
- - SBI Premier Liquid Fund - Super Institutional - Growth - 100.00<br />
- - LIC MF Savings Plus Fund - Growth Option - 100.02<br />
- - <strong>Tata</strong> Liquid Super High Investment Plan - Appreciation - 100.00<br />
- - Reliance Liquid Fund - Treasury Plan-Institutional Plan<br />
- Growth - 50.00<br />
- - Birla Sun Life Cash Plus - Institutional (Growth) - 50.00<br />
- - IDFC Cash Fund-Super Institutional Plan - Plan C -<br />
Growth - 50.00<br />
- - HDFC Cash Management Fund - Savings Plan - Growth - 70.00<br />
85.00 520.02<br />
(B) Investments in Equity shares (Quoted)<br />
35,000 10 Elcot Power Control Ltd 0.37 0.37<br />
91,800 10 Munis Forge Ltd 0.37 0.37<br />
30,997 10 Roofit Industries Ltd 0.19 0.19<br />
- - <strong>Tata</strong> Steel Ltd - 5.54<br />
0.93 6.47<br />
(C) Investments in Government Securities (Quoted)<br />
170 1,000 12.00% Uttar Pradesh 20<strong>11</strong> Stock 0.02 0.02<br />
(D) Investments in Preference Shares (Unquoted)<br />
1,00,000 100 15.50% Pennar Paterson Securities Ltd 1.00 1.00<br />
2,00,000 100 15.00% Atcom Technologies Ltd - Cumulative<br />
Preference Shares 2.00 2.00<br />
3.00 3.00<br />
88.95 529.51<br />
Less : Provision for Diminution in value of Current<br />
Investments 3.93 3.93<br />
Total - Current Investments 85.02 525.58<br />
III. Retained interest in securitisation transactions<br />
(Unquoted) (Long term)<br />
- others 0.81 4.01<br />
IV.<br />
Advance against Investments<br />
<strong>Tata</strong> <strong>Motors</strong> (SA) (Proprietary) Ltd - 0.02<br />
<strong>Tata</strong> <strong>Motors</strong> Insurance Broking and Advisory Services<br />
Ltd - 2.00<br />
Concorde <strong>Motors</strong> (India) Ltd 20.00 -<br />
20.00 2.02<br />
Total - Investments 22,624.21 22,336.90<br />
76
Schedules forming part of the Balance Sheet<br />
INVESTMENTS (contd.)<br />
NOTES : (1) Face Value per unit is in Rupees unless stated otherwise<br />
(` in crores)<br />
“6”[Item no. 6] (contd.)<br />
As at<br />
As at<br />
March 31, 20<strong>11</strong> March 31, <strong>2010</strong><br />
(2) Book Value of quoted investments 349.06 344.97<br />
(3) Book Value of unquoted investments 22,275.15 21,991.93<br />
(4) Market Value of quoted investments 379.16 345.53<br />
(5) As per the shareholders agreement dated March 30, <strong>2010</strong>, between Hitachi Construction Machinery Co. Ltd and the<br />
Company, these shares are under restriction for sale, assignment or transfer for a period of 3 years from the date of the<br />
agreement except under certain circumstances as provided in the said agreement.<br />
(6) The Company has given a letter of comfort to Standard Chartered Bank, London for GBP 15 million (` 107.21 crores as<br />
on Mar 31, 20<strong>11</strong>) against loan extended by the bank to <strong>Tata</strong> <strong>Motors</strong> European Technical Centre Plc, UK (TMETC). Also<br />
the Company has given an undertaking to Standard Chartered Bank, London to retain 100% ownership of TMETC at all<br />
times during the tenor of the loan.<br />
(7) The Company has given a letter of comfort of ` 120 crores to HDFC Bank against the short term and long term loans<br />
aggregating ` 235 crores given by HDFC Bank to <strong>Tata</strong> Marcopolo <strong>Motors</strong> Ltd (TMML). Also the Company has given an<br />
undertaking to HDFC Bank that it will not dilute its stake below 51% during the currency of the loan.<br />
(8) The Company has given a letter of comfort to Citibank NA towards the short term and long term loans aggregating THB<br />
705 million (` 103.89 crores as on March 31, 20<strong>11</strong>) given by Citibank NA to <strong>Tata</strong> <strong>Motors</strong> (Thailand) Ltd (TMTL). Further<br />
the Company has given an undertaking to Citibank NA for non-disposal of its shareholding in TMTL below 51% during<br />
the tenor of the loan.<br />
(9) The Company has given a letter of comfort along with a letter of irrevocable undertaking to State Bank of India, Bank<br />
of Baroda and Bank of India totaling GBP 370 Million (` 2,644.42 crores as on Mar 31, 20<strong>11</strong>) against their guarantees to<br />
European Investment Bank for credit facilities availed by Land Rover.<br />
(10) The Company has also given a Letter of Comfort to State Bank of India, Standard Chartered Bank and Bank of Baroda<br />
for GBP 175 Million (` 1,250.74 crores as on Mar 31, 20<strong>11</strong>), USD 40 million (` 178.36 crores as on Mar 31, 20<strong>11</strong>), GBP 70<br />
million (` 500.29 crores as on Mar 31, 20<strong>11</strong>) respectively, for credit facilities given by them to Land Rover.<br />
(<strong>11</strong>) The Company has given a letter of comfort to GE Commercial Distribution Finance Europe Ltd upto GBP 170 million<br />
(` 1,215.00 crores as on Mar 31, 20<strong>11</strong>) for revolving syndicated loan facility to Jaguar Cars Ltd and Land Rover. Also<br />
the Company has given an undertaking to GE Commercial Distribution Finance Europe Ltd to retain ultimate 100%<br />
ownership of Jaguar Cars Ltd and Land Rover at all times during the tenor of the loan.<br />
(12) The Company has given a letter of comfort to Citibank NA against working capital loans extended by the bank to <strong>Tata</strong><br />
Hispano <strong>Motors</strong> Carrocera, S.A. aggregating Euro 15 million (` 95.17 crores as on March 31, 20<strong>11</strong>). The Company has<br />
also given a letter of comfort to Banco de Valencia against bill discounting facility extended by the bank to <strong>Tata</strong> Hispano<br />
<strong>Motors</strong> Carrocera, S.A. aggregating Euro 2 million (` 12.69 crores as on March 31, 20<strong>11</strong>). The Company has also given an<br />
undertaking to Citibank NA for non-disposal of its shareholding in Hispano Carrocera, S.A. during the tenor of the loan.<br />
(13) The Company has given letter of comfort to certain banks and other lenders against credit facilities extended to Fiat<br />
India Automobiles Ltd for ` 1,600 crores and Euro 130 million (` 824.78 crores as on March 31, 20<strong>11</strong>). The Letter of<br />
Comfort is restricted to 50% of the value of credit facilities extended i.e. ` 1,212.39 crores.<br />
(14) Trilix Srl., Turin (Italy) is a limited liability company. The Company has acquired 80% of ownership of Trilix Srl., Turin (Italy)<br />
during the year.<br />
(15) During the year 2009-<strong>2010</strong>, TML Holdings Pte Ltd, Singapore, a wholly owned subsidiary of the Company, has<br />
redeemed preference shares of the face value of USD 195.1 million at a discount of USD 189.2 million. Consequent to<br />
the redemption, the Company has recognized a loss of ` 850.86 crores.<br />
(16) Trade Investments also include :<br />
Number<br />
Face Description<br />
Value<br />
Per Unit<br />
` ` `<br />
5,000 10 Metal Scrap Trade Corporation Ltd 25,000 25,000<br />
50 5 Jamshedpur Co-operative Stores Ltd 250 250<br />
16,56,517 1(M$) <strong>Tata</strong>b Industries Sdn. Bhd. Malaysia 1 1<br />
- - American Express Services Ltd - 1<br />
4 25,000 ICICI Money Multiplier Bond 1 1<br />
100 10 Optel Telecommunications 1,995 1,995<br />
200 10 Punjab Chemicals 1 1<br />
77
Sixty-sixth annual report <strong>2010</strong>-20<strong>11</strong><br />
<strong>Tata</strong> <strong>Motors</strong> Limited<br />
Schedule forming part of the Balance Sheet<br />
(` in crores)<br />
“6”[Item no. 6] (contd.)<br />
INVESTMENTS (at cost) (contd.)<br />
(17) Current Investments acquired and sold during the year :<br />
Name No. of Units Face value per unit Purchase Cost<br />
Axis Liquid Fund - IP - Daily Dividend 13,49,908 1,000 135.00<br />
Birla Sun Life Cash Manager - IP - Daily Dividend 9,49,82,456 10 95.01<br />
Birla Sun Life Cash Plus - Institutional Premium Plan - Weekly Dividend 20,94,36,616 10 210.00<br />
Birla Sun Life Cash Plus - Institutional Premium Plan - Daily Dividend 147,21,91,124 10 1,475.06<br />
Birla Sun Life Floating Rate Fund - LTP - IP - Weekly Dividend 4,99,94,938 10 50.01<br />
Birla Sun Life Savings Fund - IP - Growth 5,71,87,003 10 100.04<br />
Birla Sun Life Savings Fund - IP - Daily Dividend 3,49,79,599 10 35.00<br />
Birla Sun Life Ultra Short Term Fund - IP - Daily Dividend 9,49,68,007 10 95.02<br />
Birla Sun Life Cash Plus - Institutional Premium Plan - Growth 3,39,28,438 10 50.00<br />
Canara Robeco Liquid - Super IP - Daily Dividend 5,46,99,155 10 55.00<br />
DSP BlackRock Liquidity Fund - IP - Daily Dividend 69,97,788 1,000 700.00<br />
DSP BlackRock Liquidity Fund - IP - Weekly Dividend 24,47,479 1,000 245.00<br />
DSP BlackRock Liquidity Fund - IP - Growth 12,89,999 1,000 170.00<br />
DWS Insta Cash Plus Fund - Super IP - Growth 5,85,73,975 10 70.00<br />
DWS Insta Cash Plus Fund - IP - Daily Dividend 9,47,12,075 10 95.00<br />
DWS Insta Cash Plus Fund - Super IP - Daily Dividend 187,39,13,<strong>11</strong>7 10 1,880.00<br />
DWS Insta Cash Plus Fund - Super IP - Weekly Dividend 19,48,24,606 10 195.08<br />
HDFC Cash Management Fund - Savings Plan - Daily Dividend 37,13,66,252 10 395.00<br />
HDFC Cash Management Fund - Savings Plan - Weekly Dividend 8,94,18,439 10 95.08<br />
HDFC Liquid Fund - Premium Plan - Weekly Dividend 5,00,00,000 10 50.00<br />
HDFC Liquid Fund - Premium Plan - Daily Dividend 32,79,00,945 10 402.00<br />
IDFC Cash Fund - Plan C - Super IP - Growth 4,46,31,301 10 50.00<br />
IDFC Cash Fund - Plan C - Super IP - Daily Dividend 26,49,33,767 10 265.00<br />
JM High Liquidity - Super IP - Daily Dividend 60,40,03,394 10 605.00<br />
JP Morgan India Liquid Fund - Super IP - Daily Dividend 209,03,48,625 10 2,092.00<br />
JP Morgan India Liquid Fund - Super IP - Weekly Dividend Reinvested 60,97,18,898 10 6<strong>11</strong>.00<br />
JP Morgan India Treasury Fund - Super IP - Daily Dividend 28,50,96,843 10 285.35<br />
Kotak Floater - ST - Weekly Dividend 6,96,13,050 10 70.14<br />
Kotak Floater - ST - Weekly Dividend 4,96,89,441 10 50.00<br />
Kotak Floater - ST - Daily Dividend 156,18,51,288 10 1,580.00<br />
Kotak Floater - ST - Growth 3,43,09,092 10 55.00<br />
Kotak Floater - ST - Weekly Dividend 10,95,34,394 10 <strong>11</strong>0.20<br />
Kotak Liquid - Institutional Premium Plan - Daily Dividend 217,61,85,583 10 2,661.06<br />
Kotak Liquid - Institutional Premium Plan - Growth 6,42,59,552 10 120.00<br />
Kotak Liquid - Institutional Premium Plan - Weekly Dividend 19,43,86,701 10 195.64<br />
Kotak Flexi Debt Fund - IP - Weekly Dividend 9,32,78,455 10 95.01<br />
Kotak Floater - LT - Daily Dividend 18,85,24,561 10 190.03<br />
LIC MF Income Plus Fund - Daily Dividend 5,50,04,684 10 55.00<br />
LIC MF Liquid Fund - Daily Dividend 57,46,76,005 10 631.00<br />
Principal Cash Management Fund - Daily Dividend 4,99,96,500 10 50.00<br />
ICICI Prudential Flexible Income Plan - Premium - Growth 40,83,806 100 70.01<br />
ICICI Prudential Liquid - Super IP - Daily Dividend 16,49,62,949 100 1,650.00<br />
ICICI Prudential Liquid - Super IP - Growth 51,40,308 100 70.00<br />
ICICI Prudential Liquid - Super IP - Weekly Dividend 1,14,91,358 100 <strong>11</strong>5.05<br />
ICICI Prudential FRF - Plan D - Daily Dividend 49,98,850 100 50.00<br />
ICICI Prudential Ultra Short Term Plan - SP - Daily Dividend 9,48,10,391 10 95.01<br />
ICICI Prudential Ultra Short Term Plan - SP - Weekly Dividend 9,48,21,332 10 95.23<br />
Reliance Liquid Fund - TP - IP - Daily Dividend 58,23,70,516 10 890.29<br />
Reliance Liquidity Fund - Weekly Dividend 6,49,51,537 10 65.00<br />
Reliance Liquidity Fund - Daily Dividend 148,42,43,036 10 1,485.00<br />
Reliance Medium Term Fund - Weekly Dividend 5,56,46,453 10 95.21<br />
Reliance Money Manager Fund - IP - Daily Dividend 9,48,795 1,000 95.01<br />
Reliance Liquid Fund - TP - IP - Growth 4,45,03,090 10 100.00<br />
Reliance Liquid Fund - TP - IP - Weekly Dividend 6,85,79,360 10 105.03<br />
Religare Liquid Fund - Super IP - Daily Dividend 2,05,83,942 100 80.00<br />
SBI Magnum Insta Cash - Dividend Plan 10,20,42,710 10 <strong>11</strong>0.00<br />
SBI Magnum Insta Cash - Daily Dividend 41,49,17,942 10 695.00<br />
SBI Magnum Insta Cash - Dividend Plan 18,09,48,728 10 195.06<br />
SBI Premier Liquid Fund - Super IP - Daily Dividend 75,95,31,523 10 762.00<br />
SBI Premier Liquid Fund - Super IP - Weekly Dividend <strong>11</strong>,79,60,234 10 125.00<br />
SBI Premier Liquid Fund - Super IP - Growth 6,90,70,791 10 100.00<br />
Sundaram Money Fund - Super IP - Daily Dividend 18,32,53,593 10 185.00<br />
Sundaram Money Fund - Super IP - Weekly Dividend 8,38,27,619 10 90.00<br />
<strong>Tata</strong> Liquid Fund - SHIP - Daily Dividend 2,33,10,483 1,000 2,598.00<br />
<strong>Tata</strong> Liquid Fund - SHIP - Growth 2,94,121 1,000 50.00<br />
<strong>Tata</strong> Liquid Fund - SHIP - Weekly Dividend 25,49,655 1,000 293.42<br />
Templeton India TMA - Super IP - Daily Dividend 2,07,86,0<strong>11</strong> 1,000 2,080.00<br />
Templeton India TMA - Super IP - Weekly Dividend 9,30,016 1,000 95.00<br />
Templeton India TMA - Super IP - Weekly Dividend 82,81,899 1,000 845.78<br />
Templeton India Ultra Short Bond Fund - Super IP - Weekly Dividend 9,41,10,671 10 95.01<br />
UTI Liquid Fund - Cash Plan - IP - Growth 9,68,967 1,000 100.00<br />
UTI Liquid Fund - Cash Plan - IP - Daily Dividend 54,44,135 1,000 555.00<br />
UTI Money Market Fund- Daily Dividend 10,46,457 1,000 105.00<br />
UTI Money Market Fund- Weekly Dividend 9,47,863 1,000 95.<strong>11</strong><br />
78
Schedules forming part of the Balance Sheet<br />
(` in crores)<br />
“7” [Item no. 8 (b)]<br />
As at<br />
As at<br />
March 31, March 31,<br />
20<strong>11</strong> <strong>2010</strong><br />
INVENTORIES<br />
(as valued and certified by the Management)<br />
(a) Stores and spare parts (at or below cost) <strong>11</strong>7.65 95.76<br />
(b) Consumable tools (at cost) 17.75 13.01<br />
(c) Raw materials and components 1,487.94 887.25<br />
(d) Work-in-progress 423.80 342.92<br />
(e) Stock-in-trade 1,662.87 1,389.53<br />
(f) Goods-in-transit (at cost) 181.38 207.12<br />
3,891.39 2,935.59<br />
Note : Items (c), (d) and (e) above are valued at lower of cost and net realisable value.<br />
“8” [Item no. 8(c)]<br />
As at<br />
As at<br />
March 31, March 31,<br />
20<strong>11</strong> <strong>2010</strong><br />
SUNDRY DEBTORS<br />
(a) Over six months : (unsecured)<br />
Considered good 501.37 62.48<br />
Considered doubtful 135.66 94.56<br />
637.03 157.04<br />
(b) Others (unsecured)<br />
Considered good 2,101.51 2,329.44<br />
2,738.54 2,486.48<br />
Less : Provision for doubtful debts 135.66 94.56<br />
2,602.88 2,391.92<br />
“9” [Item no. 8(d)]<br />
As at As at<br />
March 31, March 31,<br />
20<strong>11</strong> <strong>2010</strong><br />
CASH AND BANK BALANCES<br />
(a) Cash on hand 3.22 7.90<br />
(b) Current Accounts with Scheduled Banks # 635.57 604.26<br />
(c) Deposits with Scheduled Banks * 1,336.06 531.40<br />
(d) Margin Money / Cash Collateral with Scheduled Banks 454.07 609.70<br />
2,428.92 1,753.26<br />
# Includes :<br />
- In foreign currencies 34.17 55.22<br />
- Cheques on hand 173.23 186.66<br />
- Remittances in transit 318.55 239.34<br />
* Includes unutilised proceeds from Qualified Institutional Placement issue 505.00 -<br />
79
Sixty-sixth annual report <strong>2010</strong>-20<strong>11</strong><br />
<strong>Tata</strong> <strong>Motors</strong> Limited<br />
Schedules forming part of the Balance Sheet<br />
“10” [Item no. 8(e)] (` in crores)<br />
LOANS AND ADVANCES<br />
(A) Secured<br />
As at<br />
As at<br />
March 31, March 31,<br />
20<strong>11</strong> <strong>2010</strong><br />
Vehicle loans [Note 1, page 81 and [Note (A) 4, page 88]]*<br />
Considered good 246.91 613.32<br />
Considered doubtful 291.48 304.35<br />
538.39 917.67<br />
Less: Provision for doubtful loans # 291.48 304.35<br />
246.91 613.32<br />
* Includes ` 257.07 crores (as at March 31, <strong>2010</strong> ` 350.98 crores) on<br />
account of overdue Securitised Receivables<br />
# Includes ` 154.57 crores (as at March 31, <strong>2010</strong> ` 185.88 crores)<br />
towards Securitised Receivables<br />
(B) Unsecured - considered good<br />
(a) Claims / incentives recoverable, advances / loans to suppliers,<br />
contractors, employees and others, rent deposits and<br />
other amount due (Notes 2 and 3, page 81) 1,843.58 1,345.29<br />
(b) Dues from subsidiary companies [Note 4, page 81] 109.23 106.56<br />
(c) Loans and inter-corporate deposits [net of provision of ` 25.17 crores<br />
(as at March 31, <strong>2010</strong> ` 33.19 crores )] [Note 5, page 81] 735.13 581.01<br />
(d) Deposits with government, public bodies and others :<br />
(i) Balances with Customs, Port Trust, Excise, etc. 298.58 152.49<br />
(ii) Others [net of provision of ` 0.10 crore<br />
(as at March 31, <strong>2010</strong> ` 0.10 crore)] [Note 6, page 81] 98.64 177.99<br />
397.22 330.48<br />
(e) Prepaid expenses 65.08 135.94<br />
(f) Income tax refundable (net of provision) [Note 7, page 81] 1,770.19 1,313.13<br />
4,920.43 3,812.41<br />
5,167.34 4,425.73<br />
80
Schedules forming part of the Balance Sheet<br />
(` in crores)<br />
“10” [Item no. 8(e)] (contd.)<br />
As at<br />
As at<br />
March 31, March 31,<br />
20<strong>11</strong> <strong>2010</strong><br />
LOANS AND ADVANCES (contd.)<br />
Notes: (1) Loans are secured against hypothecation of vehicles.<br />
(2) Include :<br />
Loans and advances due from Directors and Officers 0.10 0.10<br />
Maximum during the year 0.10 0.<strong>11</strong><br />
(3) Net of advances considered doubtful which have been<br />
provided for 61.14 63.44<br />
(4) Dues from subsidiary companies :<br />
(i) HV Axles Ltd 2.34 9.51<br />
(ii) HV Transmissions Ltd 4.22 9.88<br />
(iii) <strong>Tata</strong> Daewoo Commercial Vehicle Company Ltd 1.00 -<br />
(iv) <strong>Tata</strong> Marcopolo <strong>Motors</strong> Ltd 59.86 57.62<br />
(v) <strong>Tata</strong> <strong>Motors</strong> (Thailand) Ltd 15.28 8.86<br />
(vi) TML Distribution Company Ltd 8.96 4.10<br />
(vi) TML Holdings Pte. Ltd, Singapore 2.13 2.15<br />
(viii) TAL Manufacturing Solutions Ltd 0.27 1.20<br />
(ix) <strong>Tata</strong> Hispano <strong>Motors</strong> Carrocera S.A. 15.17 13.24<br />
109.23 106.56<br />
(5) Includes given to subsidiaries :<br />
(i) <strong>Tata</strong> Hispano <strong>Motors</strong> Carrocera S.A. 236.27 147.73<br />
(ii) <strong>Tata</strong> <strong>Motors</strong> (Thailand) Ltd 138.04 60.68<br />
(iii) <strong>Tata</strong> <strong>Motors</strong> European Technical Centre Plc, UK 48.51 32.59<br />
(iv) <strong>Tata</strong> <strong>Motors</strong> (SA) (Proprietary) Ltd 6.41 -<br />
(v) <strong>Tata</strong> <strong>Motors</strong> Insurance Broking and Advisory Services Ltd 0.70 -<br />
(vi) Concorde <strong>Motors</strong> (India) Ltd - 31.00<br />
(vii) <strong>Tata</strong> Marcopolo <strong>Motors</strong> Ltd 5.00 10.00<br />
(viii) TAL Manufacturing Solutions Ltd 12.00 5.50<br />
446.93 287.50<br />
(6) Includes Deposits given as collateral security to subsidiary :<br />
- <strong>Tata</strong> <strong>Motors</strong> Finance Ltd - 20.00<br />
(7) Includes MAT credit entitlement 1,158.16 731.80<br />
81
Sixty-sixth annual report <strong>2010</strong>-20<strong>11</strong><br />
<strong>Tata</strong> <strong>Motors</strong> Limited<br />
Schedules forming part of the Balance Sheet<br />
“<strong>11</strong>” [Item no. 9(a)] (` in crores)<br />
As at<br />
As at<br />
March 31, March 31,<br />
20<strong>11</strong> <strong>2010</strong><br />
CURRENT LIABILITIES<br />
(a) Acceptances 4,864.17 6,428.09<br />
(b) Sundry creditors<br />
(i) Micro, Small and Medium Enterprises [Note 8, page 94] 254.41 233.70<br />
(ii) Others* 5,228.63 5,162.90<br />
(c) Advance and progress payments 596.70 826.40<br />
(d) Liability towards premium on redemption of Non-convertible Debentures 1,673.83 1,745.79<br />
[Note (A) 2(ii), page 87]<br />
(e) Liability towards Investors Education and Protection Fund under Section 205C<br />
of the Companies Act, 1956 not due<br />
(i) Unpaid dividends 12.55 10.82<br />
(ii) Application money pending refund Rs. Nil (as at March 31, <strong>2010</strong> ` 1,140) - -<br />
(iii) Unclaimed matured deposits 9.66 23.13<br />
(iv) Unclaimed matured debentures 0.21 0.25<br />
(v) Unclaimed interest on deposits and debentures 0.92 0.38<br />
23.34 34.58<br />
(f) Interest / commitment charges accrued on loans but not due 391.45 177.70<br />
13,032.53 14,609.16<br />
* Includes payable to subsidiary companies :<br />
Concorde <strong>Motors</strong> (India) Ltd - 5.13<br />
Sheba Properties Ltd 0.52 -<br />
TAL Manufacturing Solutions Ltd 37.45 15.96<br />
<strong>Tata</strong> <strong>Motors</strong> European Technical Centre Plc 10.35 24.21<br />
<strong>Tata</strong> <strong>Motors</strong> Finance Ltd 62.05 34.14<br />
<strong>Tata</strong> Technologies Ltd 21.05 9.99<br />
Jaguar Cars Ltd 14.32 3.22<br />
Land Rover 24.51 4.51<br />
Trilix Srl. 2.30 -<br />
<strong>Tata</strong> Daewoo Commercial Vehicle Co. Ltd - 9.38<br />
“12” [Item no. 9(b)] As at As at<br />
March 31, March 31,<br />
20<strong>11</strong> <strong>2010</strong><br />
PROVISIONS<br />
(a) Proposed dividend 1,274.23 859.05<br />
(b) Provision for tax on dividend 192.80 132.89<br />
(c) Provision for Taxation (net of payments) 160.42 199.82<br />
(d) Provision for retirement and other employee benefit schemes [Note B (5), page 96] 385.96 329.89<br />
(e) Provision for Warranty [Note B (6)(a), page 97] 398.25 248.63<br />
(f) Provision for premium on redemption of Foreign Currency Convertible Notes (FCCN)<br />
and Convertible Alternative Reference Securities (CARS) [Note B (6)(b), page 97] 801.09 993.15<br />
(g) Other Provisions 9.96 -<br />
3,222.71 2,763.43<br />
82
(a)<br />
(b)<br />
(c)<br />
(d)<br />
(e)<br />
(f)<br />
Basis of preparation<br />
Schedules forming part of the Balance Sheet and Profit and Loss Account<br />
Significant Accounting Policies<br />
The financial statements are prepared under the historical cost convention on an accrual basis of accounting in accordance with the generally accepted accounting<br />
principles, Accounting Standards notified under Section 2<strong>11</strong> (3C) of the Companies Act, 1956 and the relevant provisions thereof.<br />
Use of estimates<br />
The preparation of financial statements requires management to make judgments, estimates and assumptions, that affect the application of accounting<br />
policies and the reported amounts of assets and liabilities and disclosures of contingent liabilities at the date of these financial statements and the reported<br />
amounts of revenues and expenses for the years presented. Actual results may differ from these estimates.<br />
Estimates and underlying assumptions are reviewed on an ongoing basis. Revisions to accounting estimates are recognised in the period in which the estimate<br />
is revised and future periods affected.<br />
Sales<br />
The Company recognises revenue on the sale of products, net of discounts, when the products are delivered to the dealer / customer or when delivered to the<br />
carrier for export sales, which is when risks and rewards of ownership pass to the dealer / customer.<br />
Sales include income from services, transfer of technology relating to automotive products and exchange fluctuations relating to export receivables. Sales<br />
include export and other recurring and non-recurring incentives from the Government at the national and state levels. Sale of products is presented gross of<br />
excise duty where applicable, and net of other indirect taxes.<br />
Revenues are recognised when collectibility of the resulting receivables is reasonably assured.<br />
Dividend from investments is recognized when the right to receive the payment is established and when no significant uncertainty as to measurability or<br />
collectability exits.<br />
Interest income is recognized on the time basis determined by the amount outstanding and the rate applicable and where no significant uncertainty as to<br />
measurability or collectability exists.<br />
Depreciation and Amortisation<br />
(i) Depreciation is provided on straight line method (SLM), at the rates and in the manner prescribed in Schedule XIV to the Companies Act, 1956 except in<br />
the case of :<br />
• Leasehold Land – amortised over the period of the lease<br />
• Technical Know-how – at 16.67% (SLM)<br />
• Laptops – at 23.75% (SLM)<br />
• Cars – at 23.75% (SLM)<br />
• Assets acquired prior to April 1, 1975 – on Written Down Value basis at rates specified in Schedule XIV to the Companies Act, 1956.<br />
• Software in excess of Rs. 25,000 is amortised over a period of sixty months or on the basis of estimated useful life whichever is lower.<br />
• Assets taken on lease are amortised over the period of lease.<br />
(ii) Product development cost are amortised over a period of 36 months to 120 months or on the basis of actual production to planned production volume<br />
over such period.<br />
(iii) In respect of assets whose useful life has been revised, the unamortised depreciable amount has been charged over the revised remaining useful life<br />
(iv) Depreciation is not recorded on capital work-in-progress until construction and installation are complete and asset is ready for its intended use. Capitalwork-in-progress<br />
includes capital advances.<br />
Fixed Assets<br />
(i) Fixed assets are stated at cost of acquisition or construction less accumulated depreciation / amortization.<br />
(ii) The product development cost incurred on new vehicle platform, engines, transmission and new products are recognised as fixed assets, when feasibility<br />
has been established, the Company has committed technical, financial and other resources to complete the development and it is probable that asset<br />
will generate probable future benefits.<br />
(iii) Cost includes purchase price, taxes and duties, labour cost and directly attributable costs for self constructed assets and other direct costs incurred upto<br />
the date the asset is ready for its intended use. Borrowing cost incurred for qualifying assets is capitalised up to the date the asset is ready for intended<br />
use, based on borrowings incurred specifically for financing the asset or the weighted average rate of all other borrowings, if no specific borrowings<br />
have been incurred for the asset. The cost of acquisition is further adjusted for exchange differences relating to long term foreign currency borrowings<br />
attributable to the acquisition of depreciable asset w.e.f. April 1, 2007.<br />
(iv) Software not exceeding Rs. 25,000 and product development costs relating to minor product enhancements, facelifts and upgrades are charged off to<br />
the Profit and Loss Account as and when incurred.<br />
Impairment<br />
At each balance sheet date, the Company assesses whether there is any indication that the fixed assets have suffered an impairment loss. If any such indication<br />
exists, the recoverable amount of the asset is estimated in order to determine the extent of the impairment, if any. Where it is not possible to estimate the<br />
recoverable amount of individual asset, the Company estimates the recoverable amount of the cash-generating unit to which the asset belongs.<br />
As per the assessment conducted by the Company at March 31, 20<strong>11</strong>, there were no indications that the fixed assets have suffered an impairment<br />
loss.<br />
83
Sixty-sixth annual report <strong>2010</strong>-20<strong>11</strong><br />
<strong>Tata</strong> <strong>Motors</strong> Limited<br />
Significant Accounting Policies - (contd.)<br />
(g)<br />
(h)<br />
(i)<br />
(j)<br />
(k)<br />
Leases<br />
(i) Finance Lease<br />
Assets acquired under finance leases are recognised at the lower of the fair value of the leased assets at inception and the present value of minimum<br />
lease payments. Lease payments are apportioned between the finance charge and the outstanding liability. The finance charge is allocated to periods<br />
during the lease term at a constant periodic rate of interest on the remaining balance of the liability. Assets given under finance leases are recognised as<br />
receivables at an amount equal to the net investment in the lease and the finance income is based on a constant rate of return on the outstanding net<br />
investment.<br />
(ii) Operating Lease<br />
Leases other than finance lease, are operating leases, and the leased assets are not recognised on the Company’s balance sheet. Payments under<br />
operating leases are recognised in statement of operations on a straight-line basis over the term of the lease.<br />
Transactions in Foreign Currencies and Accounting of Derivatives<br />
(i) Exchange differences<br />
Transactions in foreign currencies are recorded at the exchange rates prevailing on the date of the transaction. Foreign currency monetary assets and<br />
liabilities are translated at year end exchange rates.<br />
(1) Exchange differences arising on settlement of transactions and translation of monetary items other than those covered by (2) below are recognized<br />
as income or expense in the year in which they arise. Exchange differences considered as borrowing cost are capitalized to the extent these relate<br />
to the acquisition / construction of qualifying assets and the balance amount is recognized in the Profit and Loss account.<br />
(2) Exchange differences relating to long term foreign currency monetary assets / liabilities are accounted for with effect from April 1, 2007 in the<br />
following manner:<br />
- Differences relating to borrowings attributable to the acquisition of the depreciable capital asset are added to / deducted from the cost of<br />
such capital assets.<br />
- Other differences are accumulated in Foreign Currency Monetary Item Translation Difference Account, to be amortized over the period,<br />
beginning April 1, 2007 or date of inception of such item, as applicable, and ending on March 31, 20<strong>11</strong> or the date of its maturity, whichever<br />
is earlier.<br />
(ii) Hedge Accounting<br />
The Company uses foreign currency forward contracts to hedge its risks associated with foreign currency fluctuations relating to highly probable forecast<br />
transactions. With effect from April 1, 2008, the Company designates such forward contracts in a cash flow hedging relationship by applying the hedge<br />
accounting principles set out in Accounting Standard 30- Financial Instruments: Recognition and Measurement.<br />
These forward contracts are stated at fair value at each reporting date. Changes in the fair value of these forward contracts that are designated and<br />
effective as hedges of future cash flows are recognized directly in Hedging Reserve Account under Reserves and Surplus, net of applicable deferred<br />
income taxes and the ineffective portion is recognised immediately in the Profit and Loss Account.<br />
Amounts accumulated in Hedging Reserve Account are reclassified to profit and loss in the same periods during which the forecasted transaction affects<br />
profit and loss.<br />
Hedge accounting is discontinued when the hedging instrument expires or is sold, terminated, or exercised, or no longer qualifies for hedge accounting.<br />
For forecasted transactions, any cumulative gain or loss on the hedging instrument recognised in Hedging Reserve Account is retained there until the<br />
forecasted transaction occurs.<br />
If the forecasted transaction is no longer expected to occur, the net cumulative gain or loss recognised in Hedging Reserve Account is immediately<br />
transferred to the Profit and Loss Account.<br />
(iii) Premium or discount on forward contracts other than those covered in (ii) above is amortised over the life of such contracts and is recognised as income<br />
or expense. Foreign currency options and other derivatives are stated at fair value as at the year end with changes in fair value recognized in the Profit<br />
and Loss Account.<br />
Product Warranty Expenses<br />
The estimated liability for product warranties is recorded when products are sold. These estimates are established using historical information on the nature,<br />
frequency and average cost of warranty claims and management estimates regarding possible future incidence based on corrective actions on product failures.<br />
The timing of outflows will vary as and when warranty claim will arise - being typically upto three years.<br />
Income on Vehicle Loan / Hire-Purchase Income / Finance Income from Lease<br />
Interest income from hire purchase and loan contracts and finance income in respect of vehicles are accounted for by using the Internal Rate of Return method.<br />
Consequently, a constant rate of return on the net outstanding amount is accrued over the period of contract. The Company provides an allowance for hire<br />
purchase and loan receivables that are in arrears for more than <strong>11</strong> months, to the extent of an amount equivalent to the outstanding principal and amounts<br />
due but unpaid, considering probable inherent loss including estimated realisation based on past performance trends. In respect of loan contracts that are in<br />
arrears for more than 6 months but not more than <strong>11</strong> months, allowance is provided to the extent of 10% of the outstanding and amount due but unpaid.<br />
Inventories<br />
Inventories are valued at the lower of cost and net realisable value. Cost of raw materials and consumables are ascertained on a moving weighted average /<br />
monthly moving weighted average basis. Cost, including variable and fixed overheads, are allocated to work-in-progress and stock-in-trade determined on full<br />
absorption cost basis. Net realisable value is estimated selling price in the ordinary course of business less estimated cost of completion and selling expenses.<br />
84
Significant Accounting Policies - (contd.)<br />
(l)<br />
(m)<br />
(n)<br />
(o)<br />
(p)<br />
Employee Benefits<br />
(i) Gratuity<br />
The Company has an obligation towards gratuity, a defined benefit retirement plan covering eligible employees. The plan provides for a lump sum<br />
payment to vested employees at retirement, death while in employment or on termination of employment of an amount equivalent to 15 to 30 days<br />
salary payable for each completed year of service. Vesting occurs upon completion of five years of service. The Company makes annual contributions<br />
to gratuity fund established as trust. The Company accounts for the liability for gratuity benefits payable in future based on an independent actuarial<br />
valuation.<br />
(ii) Superannuation<br />
The Company has two superannuation plans, a defined benefit plan and a defined contribution plan. An eligible employee on April 1, 1996 could elect<br />
to be a member of either plan.<br />
Employees who are members of the defined benefit superannuation plan are entitled to benefits depending on the years of service and salary drawn.<br />
The monthly pension benefits after retirement range from 0.75% to 2% of the annual basic salary for each year of service. The Company accounts for the<br />
liability for superannuation benefits payable in future under the plan based on an independent actuarial valuation.<br />
With effect from April 1, 2003, this plan was amended and benefits earned by covered employees have been protected as at March 31, 2003. Employees<br />
covered by this plan are prospectively entitled to benefits computed on a basis that ensures that the annual cost of providing the pension benefits would<br />
not exceed 15% of salary.<br />
The Company maintains a separate irrevocable trust for employees covered and entitled to benefits. The Company contributes up to 15% of the eligible<br />
employees’ salary to the trust every year. The Company recognizes such contributions as an expense when incurred. The Company has no further<br />
obligation beyond this contribution.<br />
(iii) Bhavishya Kalyan Yojana (BKY)<br />
Bhavishya Kalyan Yojana is an unfunded defined benefit plan. The benefits of the plan include pension in certain case, payable upto the date of normal<br />
superannuation had the employee been in service, to an eligible employee at the time of death or permanent disablement, while in service, either as a<br />
result of an injury or as certified by the Company’s Medical Board. The monthly payment to dependents of the deceased / disabled employee under the<br />
plan equals 50% of the salary drawn at the time of death or accident or a specified amount, whichever is higher. The Company accounts for the liability<br />
for BKY benefits payable in future based on an independent actuarial valuation.<br />
(iv) Post-retirement Medicare Scheme<br />
Under this scheme, employees get medical benefits subject to certain limits of amount, periods after retirement and types of benefits, depending on<br />
their grade and location at the time of retirement. Employees separated from the Company as part of Early Separation Scheme, on medical grounds<br />
or due to permanent disablement are also covered under the scheme. The liability for post-retirement medical scheme is based on an independent<br />
actuarial valuation.<br />
(v) Provident fund<br />
The eligible employees of the Company are entitled to receive benefits under the provident fund, a defined contribution plan, in which both employees<br />
and the Company make monthly contributions at a specified percentage of the covered employees’ salary (currently 12% of employees’ salary). The<br />
contributions as specified under the law are paid to the provident fund and pension fund set up as irrevocable trust by the Company or to respective<br />
Regional Provident Fund Commissioner and the Central Provident Fund under the State Pension scheme. The Company is generally liable for annual<br />
contributions and any shortfall in the fund assets based on the government specified minimum rates of return or pension and recognises such<br />
contributions and shortfall, if any, as an expense in the year incurred.<br />
(vi) Compensated absences<br />
The Company provides for the encashment of leave or leave with pay subject to certain rules. The employees are entitled to accumulate leave subject to<br />
certain limits, for future encashment. The liability is provided based on the number of days of unutilised leave at each balance sheet date on the basis<br />
of an independent actuarial valuation.<br />
Investments<br />
Long term investments are stated at cost less other than temporary diminution in value, if any. Current investments are stated at lower of cost and fair value.<br />
Fair value of investments in mutual funds are determined on a portfolio basis.<br />
Income Tax Expenses<br />
Income tax expenses comprises current and deferred taxes.<br />
Current tax is the amount of tax payable on the taxable income for the year as determined in accordance with the provisions of the Income Tax Act, 1961.<br />
Current tax is net of credit for entitlement for Minimum Alternative tax.<br />
Deferred tax is recognised, on timing differences, being the difference between taxable income and accounting income that originate in one period and are<br />
capable of reversal in one or more subsequent periods.<br />
Deferred tax assets in respect of unabsorbed depreciation and carry forward of losses are recognised if there is virtual certainty that there will be sufficient<br />
future taxable income available to realise such losses.<br />
Deferred tax assets and liabilities are measured based on the tax rates that are expected to apply in the period when asset is realised or the liability is settled,<br />
based on tax rates and tax laws that have been enacted or substantially enacted by the balance sheet date.<br />
Redemption premium / discount on Foreign Currency Convertible Notes (FCCN) / Convertible Alternative Reference Securities (CARS) / Non Convertible<br />
Debentures (NCD)<br />
Premium payable on redemption of FCCN / CARS / NCD as per the terms of issue, is provided fully in the year of issue by adjusting against the Securities Premium<br />
Account (SPA). Any change in the premium payable, consequent to conversion or exchange fluctuations is adjusted to the SPA. Discount on redemption of<br />
FCCN, if any, will be recognised on redemption.<br />
Business Segments<br />
The Company is engaged mainly in the business of automobile products consisting of all types of commercial and passenger vehicles including financing of the<br />
vehicles sold by the Company. These, in the context of Accounting Standard 17 on Segment Reporting, as specified in the Companies (Accounting Standards)<br />
Rules, 2006, are considered to constitute one single primary segment. Further, there is no reportable secondary segment i.e. Geographical Segment.<br />
85
Sixty-sixth annual report <strong>2010</strong>-20<strong>11</strong><br />
<strong>Tata</strong> <strong>Motors</strong> Limited<br />
Schedules forming part of the Balance Sheet and Profit and Loss Account<br />
“13” [Item no. 13]<br />
(A) Notes to Balance Sheet<br />
1 I. The Issued and subscribed capital includes :<br />
(a) Ordinary Shares allotted as fully paid up shares for consideration other than cash:<br />
- 7,53,470 Ordinary Shares allotted to Daimler – Benz AG in consideration of materials supplied to the Company in the financial year 1956-57,<br />
- 3,00,000 Ordinary Shares allotted to the Shareholders of erstwhile Investa Machine Tools and Engineering Company Limited in terms of the<br />
Scheme of Amalgamation sanctioned by the Bombay High Court in the financial year 1966-67,<br />
- 7,59,510 Ordinary Shares allotted to the Shareholders of the erstwhile Central Bank of India in terms of the Scheme of Amalgamation in the<br />
financial year 1970-71,<br />
- 1,83,823 Ordinary Shares issued to the Shareholders of the erstwhile Noduron Founders Maharashtra Limited in terms of the merger in the<br />
financial year 1992-93,<br />
- 15,24,30,083 Ordinary Shares issued to Financial Institutions and holders of convertible debentures / bonds on conversion of term loans /<br />
debentures / bonds,<br />
- 1,45,04,949 Ordinary Shares issued to the Shareholders of the erstwhile <strong>Tata</strong> Finance Limited in terms of the merger in the financial year 2005-<br />
06.<br />
(b) <strong>11</strong>,12,92,760 Ordinary Shares issued as fully paid up Bonus Shares by utilising Securities Premium Account, Capital Reserve, Capital Redemption<br />
Reserve, Amalgamation Reserve, contribution for Capital Expenditure Account and General Reserve.<br />
(c) 2,55,02,678 (as at March 31, <strong>2010</strong> 2,55,02,622) Ordinary Shares allotted against the exercise of equivalent number of warrants pertaining to the<br />
rights issue of 2001 at Rs.120/- per share.<br />
(d) 7,60,78,654 (as at March 31, <strong>2010</strong> 5,25,08,228) Ordinary Shares issued upon conversions of Foreign Currency Convertible Notes (FCCNs). Details are<br />
as follows:<br />
(i) 1% FCCN due 2008 :<br />
1,83,98,095 (as at March 31, <strong>2010</strong> : 1,83,98,095) Ordinary Shares issued against 99,940 (as at March 31, <strong>2010</strong> : 99,940) Notes.<br />
(ii) 0% FCCN due 2009 :<br />
74,66,867 (as at March 31, <strong>2010</strong> : 74,66,867) Ordinary Shares issued against 97,590 (as at March 31, <strong>2010</strong> : 97,590) Notes.<br />
(iii) 1% FCCN due 20<strong>11</strong> :<br />
2,29,50,915 (as at March 31, <strong>2010</strong> : 1,88,16,152) Ordinary Shares issued against 2,99,102 (as at March 31, <strong>2010</strong> : 2,29,634) Notes.<br />
(iv) 0% FCCN due 20<strong>11</strong><br />
78,39,043 (as at March 31, <strong>2010</strong> : 78,27,<strong>11</strong>4) Ordinary Shares issued against 1,074 (as at March 31, <strong>2010</strong> : 1,071) Notes.<br />
(v) 4% FCCN due 2014 :<br />
1,94,23,734 (as at March 31, <strong>2010</strong> : Nil) Ordinary Shares issued against 2,576 (as at March 31, <strong>2010</strong> : Nil) Notes.<br />
(e) 6,42,77,215 (as at March 31, <strong>2010</strong> : 6,42,76,883) Ordinary Shares at ` 340 per share and 6,42,77,215 (as at March 31, <strong>2010</strong> : 6,42,76,883) ‘A’ Ordinary<br />
Shares at ` 305 per share were allotted on exercising of options pertaining to Rights issue of 2008.<br />
(f) 2,99,04,306 Global Depository Shares (GDS) each representing one share at a price of US$ 12.54 per GDS, aggregating US$ 375 million (` 1794.19<br />
crores), issued in the year 2009-<strong>2010</strong>.<br />
(g) During the year, the Company has issued 8,320,300 Ordinary Shares at a price of ` 1,074 per Ordinary Share and 32,165,000 ‘A’ Ordinary Shares at a<br />
price of ` 764 per ‘A’ Ordinary Share through Qualified Institutional Placement (QIP).<br />
II. The entitlements to 99,310 (as at March 31, <strong>2010</strong> : 1,49,534) Ordinary Shares and 54,832 (as at March 31, <strong>2010</strong>: 99,790) ‘A’ Ordinary Shares are subject matter<br />
of various suits filed in the courts / forums by third parties for which final order is awaited and hence kept in abeyance.<br />
The application for 49,836 Ordinary Shares and 44,626 ‘A’ Ordinary Shares have been received, to be issued out of shares kept in abeyance as on March<br />
31, 20<strong>11</strong>, for which allotment is pending.<br />
2 Secured Loans :<br />
(i) Nature of Security (on loans including interest accrued thereon) :<br />
(a)<br />
Rated, Listed, Secured, Credit Enhanced, 2% Coupon, Premium Redemption Non-Convertible Debentures amounting to ` 3,400 crores are secured<br />
by a second charge in favour of Vijaya Bank , Debenture Trustee and first ranking parri passu charge in favour of State Bank of India as Security<br />
trustee on behalf of the Guarantors, by way of English mortgage of the Company’s lands, freehold and leasehold, together with all buildings,<br />
constructions and immovable and movable properties situated at Chinchwad, Pimpri, Chikhali and Maval in Pune District and plant and machinery<br />
and other movable assets situated at Pantnagar in the State of Uttarakhand and at Jamshedpur in the state of Jharkhand.<br />
86
Schedules forming part of the Balance Sheet and Profit and Loss Account<br />
“13“[Item no 13] (contd.)<br />
(A)<br />
Notes to Balance Sheet (contd.)<br />
(b)<br />
(c)<br />
(d)<br />
Rated, Listed, Secured, 9.95% Coupon, Non-Convertible Debentures amounting to ` 200 crores is being secured by first ranking charge by way<br />
of an English mortgage of the Company’s freehold land together with immovable properties, plant and machinery and other movable assets<br />
(excluding stock and book debts) situated at Sanand in the State of Gujarat.<br />
Rated, Listed, Secured, 10.25% Coupon, Non-Convertible Debentures amounting to ` 500 crores is being secured by first ranking charge by way<br />
of an English mortgage of the Company’s freehold land together with immovable properties, plant and machinery and other movable assets<br />
(excluding stock and book debts) situated at Sanand in the State of Gujarat.<br />
Loans, Cash Credits, Overdrafts and Buyers line of credit from Banks are secured by hypothecation of existing current assets of the Company<br />
viz. stock of raw materials, stock in process, semi-finished goods, stores and spares not relating to plant and machinery (consumable stores and<br />
spares), bills receivable and book debts including receivable from Hire Purchase / Leasing and all other moveable current assets except cash and<br />
bank balances, loans and advances of the Company both present and future.<br />
(ii) Schedule of repayment and redemption for Non-Convertible Debentures :<br />
(` in crores)<br />
Non Convertible Debentures (NCD’s) Redeemable on Principal Premium Total<br />
(a) Secured :<br />
2% Non-Convertible Debentures (2013) March 31, 2013 350.00 96.55 446.55<br />
2% Non-Convertible Debentures (2014) March 31, 2014 1,800.00 658.05 2,458.05<br />
2% Non-Convertible Debentures (2016) March 31, 2016 1,250.00 919.23 2,169.23<br />
9.95% Non-Convertible Debentures (2020) March 2, 2020 200.00 - 200.00<br />
10.25% Non-Convertible Debentures (2022) # April 30, 2022 100.00 - 100.00<br />
10.25% Non-Convertible Debentures (2023) # April 30, 2023 100.00 - 100.00<br />
10.25% Non-Convertible Debentures (2024) # April 30, 2024 150.00 - 150.00<br />
10.25% Non-Convertible Debentures (2025) # April 30, 2025 150.00 - 150.00<br />
# The Company has a call option to redeem, either in part or full, at the end of 8th year from the date of allotment i.e. April 30, 2018.<br />
(b) Unsecured :<br />
9.90% Non-Convertible Debentures (2020) May 7, 2020 150.00 - 150.00<br />
9.75% Non-Convertible Debentures (2020) May 24, 2020 100.00 - 100.00<br />
9.70% Non-Convertible Debentures (2020) June 18, 2020 150.00 - 150.00<br />
(iii)<br />
The Buyers line of credit from Banks is repayable within a maximum period of three years from the drawdown dates. All the repayments are due from<br />
20<strong>11</strong>-12 to 2013-14.<br />
(` in crores)<br />
3 (a) Major components of deferred tax arising on account of timing differences are [Item 3, Page 62]:<br />
As at<br />
As at<br />
March 31, March 31,<br />
20<strong>11</strong> <strong>2010</strong><br />
Liabilities:<br />
Depreciation (1,176.14) (980.72)<br />
Product Development Cost (1,530.73) (1,317.78)<br />
Others (1.29) (1.64)<br />
(2,708.16) (2,300.14)<br />
Assets:<br />
Employee Benefits / Expenses allowable on payment basis 92.54 76.12<br />
Provision for Doubtful Debts 157.69 147.48<br />
Premium on Redemption of CARS<br />
(including exchange fluctuation on premium) <strong>11</strong>1.13 251.<strong>11</strong><br />
Unabsorbed Depreciation and Business Losses 281.83 286.48<br />
Others 41.81 30.31<br />
685.00 791.50<br />
Net Deferred Tax Liability (2,023.16) (1,508.64)<br />
(b)<br />
Deferred Tax charge for the year<br />
<strong>2010</strong>-20<strong>11</strong> 2009-<strong>2010</strong><br />
Opening Deferred Tax Liability 1,508.64 865.81<br />
Debited / (Credited) to securities premium account 138.22 8.31<br />
Debited / (Credited) to hedging reserve account - 45.06<br />
1,646.86 919.18<br />
Less : Closing Deferred Tax Liability 2,023.16 1,508.64<br />
Deferred Tax charge for the year 376.30 589.46<br />
(c) Tax expense [Item 10, Page 63] :<br />
<strong>2010</strong>-20<strong>11</strong> 2009-<strong>2010</strong><br />
(i) Current Tax (net of credit for Minimum Alternate Tax) 8.40 -<br />
(ii) Deferred Tax 376.30 589.46<br />
384.70 589.46<br />
87
Sixty-sixth annual report <strong>2010</strong>-20<strong>11</strong><br />
<strong>Tata</strong> <strong>Motors</strong> Limited<br />
Schedules forming part of the Balance Sheet and Profit and Loss Account<br />
“13” [Item no. 13] (contd.) (` in crores)<br />
(A) Notes to Balance Sheet (contd.)<br />
4. Future instalments receivable in respect of vehicle loans [Schedule 10 (A), page 80] includes ` 452.13 crores (as at March 31, <strong>2010</strong><br />
` 595.71 crores) in respect of instalments that have become due but have not been recovered. Out of these ` 337.85 crores (as at<br />
March 31, <strong>2010</strong> ` 351.50 crores) are due for over six months. There is an aggregate provision of ` 245.77 crores (as at March 31, <strong>2010</strong><br />
` 269.29 crores) made in respect of overdue instalments.<br />
As at<br />
As at<br />
March 31, March 31,<br />
20<strong>11</strong> <strong>2010</strong><br />
5. I Disclosure in respect of finance leases :<br />
Assets taken on Lease :<br />
(a) (i) Total of minimum lease payments 18.24 25.87<br />
Total of minimum lease payments for a period :<br />
Not later than one year 6.85 13.70<br />
Later than one year and not later than five years <strong>11</strong>.39 12.17<br />
(ii) Present value of the minimum lease payments payable 16.70 24.<strong>11</strong><br />
Present Value of the minimum lease payments payable :<br />
Not later than one year 6.21 12.63<br />
Later than one year and not later than five years 10.49 <strong>11</strong>.48<br />
(b) A general description of significant leasing arrangements -<br />
The Company has entered into Finance lease arrangements for computers and data<br />
processing equipments from a vendor.<br />
II Disclosure in respect of operating leases :<br />
Assets given on Lease :<br />
(a) Total of minimum lease payments receivable 59.18 65.35<br />
The total of minimum lease payments receivable for a period:<br />
Not later than one year 3.81 3.86<br />
Later than one year and not later than five years 15.23 15.46<br />
Later than five years 40.14 46.03<br />
(b) Gross block 75.78 74.54<br />
Accumulated depreciation 10.43 6.89<br />
Depreciation for the year ` 3.63 crores (2009-<strong>2010</strong> ` 3.52 crores)<br />
(c) A general description of significant leasing arrangements -<br />
The Company has entered into Operating lease arrangements for buildings and plant &<br />
machinery.<br />
88
Schedules forming part of the Balance Sheet and Profit and Loss Account<br />
(A) Notes to Balance Sheet (contd.) “13” [Item no. 13] (contd.)<br />
6 i) Related party disclosures for the year ended March 31, 20<strong>11</strong><br />
a) Related Party and their relationship<br />
1. Subsidiaries :<br />
<strong>Tata</strong> Technologies Ltd<br />
INCAT International Plc.<br />
TAL Manufacturing Solutions Ltd<br />
<strong>Tata</strong> Technologies Europe Ltd<br />
H V Axles Ltd INCAT SAS (liquidated w.e.f. April 30, <strong>2010</strong>)<br />
H V Transmissions Ltd<br />
INCAT GmbH<br />
Sheba Properties Ltd<br />
<strong>Tata</strong> Technologies Inc<br />
Concorde <strong>Motors</strong> (India) Ltd<br />
<strong>Tata</strong> Technologies de Mexico, S.A. de CV<br />
<strong>Tata</strong> Daewoo Commercial Vehicle Co. Ltd<br />
<strong>Tata</strong> Technologies (Canada) Inc<br />
<strong>Tata</strong> <strong>Motors</strong> Insurance Broking & Advisory Services Ltd <strong>Tata</strong> Technologies (Thailand) Ltd<br />
<strong>Tata</strong> <strong>Motors</strong> European Technical Centre Plc<br />
<strong>Tata</strong> Technologies Pte Ltd<br />
<strong>Tata</strong> <strong>Motors</strong> Finance Ltd<br />
Miljobil Grenland AS<br />
<strong>Tata</strong> Marcopolo <strong>Motors</strong> Ltd<br />
<strong>Tata</strong> Hispano <strong>Motors</strong> Carrocerries Maghreb<br />
<strong>Tata</strong> <strong>Motors</strong> (Thailand) Ltd<br />
(Formerly known as Carrocerries Hispano Maghreb, Morocco)<br />
<strong>Tata</strong> <strong>Motors</strong> (SA) (Proprietary) Ltd<br />
<strong>Tata</strong> Daewoo Commercial Vehicles Sales and Distribution Co. Ltd<br />
TML Holdings Pte. Ltd, Singapore (Incorporated on April 9, <strong>2010</strong>)<br />
TML Distribution Company Ltd <strong>Tata</strong> Engineering Services (Pte) Ltd (from February 15, 20<strong>11</strong>)<br />
<strong>Tata</strong> Hispano <strong>Motors</strong> Carrocera S.A.<br />
Jaguar Land Rover North America LLC<br />
Trilix S.r.l (w.e.f September 29, <strong>2010</strong>)<br />
Land Rover Belux SA/NV<br />
<strong>Tata</strong> Precision Industries Pte. Ltd<br />
Land Rover Ireland Ltd<br />
(w.e.f February 15, 20<strong>11</strong>)<br />
Jaguar Land Rover Nederland BV<br />
JaguarLandRover Ltd<br />
Jaguar Land Rover Portugal - Veiculos e Pecas, LDA<br />
Jaguar Cars Overseas Holdings Ltd<br />
Jaguar Land Rover Australia Pty Ltd<br />
Jaguar Land Rover Austria GmbH<br />
Land Rover Exports Ltd<br />
Jaguar Belux NV<br />
Land Rover Italia SpA<br />
Jaguar Cars Ltd<br />
Land Rover Espana SL<br />
Jaguar Land Rover Japan Ltd<br />
Land Rover Deutschland GmbH<br />
Jaguar Cars South Africa (pty) Ltd Jaguar Land Rover Mexico SA de CV (upto July 12, <strong>2010</strong>)<br />
Jaguar Italia SpA<br />
Jaguar Land Rover Korea Co. Ltd<br />
Jaguar Cars Exports Ltd<br />
Jaguar Land Rover Automotive Trading (Shanghai) Co. Ltd<br />
The Daimler Motor Company Ltd<br />
Jaguar Land Rover Canada ULC<br />
The Jaguar Collection Ltd<br />
Jaguar Land Rover France, SAS<br />
Daimler Transport Vehicles Ltd<br />
Jaguar Land Rover (South Africa) (Pty) Limited<br />
S.S. Cars Ltd<br />
Jaguar Land Rover Brazil LLC<br />
The Lanchester Motor Company Ltd<br />
Limited Liability Company “Jaguar Land Rover” (Russia)<br />
Jaguar Hispania Sociedad<br />
Land Rover Parts Ltd<br />
Jaguar Deutschland GmbH<br />
Land Rover Parts US LLC<br />
Land Rover<br />
Land Rover Group Ltd<br />
2. Associates :<br />
<strong>Tata</strong> AutoComp Systems Ltd<br />
<strong>Tata</strong> Cummins Ltd<br />
<strong>Tata</strong> Precision Industries Pte. Ltd (upto February 14, 20<strong>11</strong>)<br />
(subsidiary from February 15, 20<strong>11</strong>)<br />
<strong>Tata</strong> Precision Industries (India) Ltd<br />
(w.e.f. February 15, 20<strong>11</strong>)<br />
Nita Company Ltd<br />
<strong>Tata</strong> Sons Ltd (Investing Party)<br />
Automobile Corporation of Goa Ltd<br />
Telco Construction Equipment Co. Ltd<br />
Jaguar Cars Finance Ltd<br />
3. Joint Ventures : 4. Key Management Personnel<br />
Fiat India Automobiles Ltd Mr. Carl-Peter Forster (w.e.f. April 1, <strong>2010</strong>)<br />
TATA HAL Technologies Ltd Mr. P M Telang<br />
89
Sixty-sixth annual report <strong>2010</strong>-20<strong>11</strong><br />
<strong>Tata</strong> <strong>Motors</strong> Limited<br />
Schedules forming part of the Balance Sheet and Profit and Loss Account<br />
“13” [Item no. 13] (contd.)<br />
(A) Notes to Balance Sheet (contd.)<br />
b) Transactions with the related parties (` in crores)<br />
<strong>2010</strong>-20<strong>11</strong><br />
Subsidiaries<br />
Joint Associates<br />
Key<br />
Total<br />
Venture<br />
Management<br />
Personnel<br />
Purchase of goods 1,819.45 4,400.87 3,232.28 - 9,452.60<br />
786.99 3,190.61 2,445.98 - 6,423.58<br />
90<br />
Sale of goods (inclusive of sales tax) 19,152.65 456.33 371.31 - 19,980.29<br />
14,889.04 285.60 271.14 - 15,445.78<br />
Purchase of fixed assets 45.28 - - - 45.28<br />
41.73 - - - 41.73<br />
Purchese of Investment - - 5.86 - 5.86<br />
- - - - -<br />
Sale of Investments - - - - -<br />
- - 693.39 - 693.39<br />
Sale of fixed assets (including transfer<br />
of technology) - - - - -<br />
1.34 - - - 1.34<br />
Services received 1,681.03 - 56.70 19.19 1,756.92<br />
1,226.18 - 55.82 8.90 1,290.90<br />
Services rendered 109.32 0.02 15.84 - 125.18<br />
74.60 1.53 8.31 - 84.44<br />
Finance given (including loans and equity) 2,087.49 200.00 126.42 - 2,413.91<br />
12,268.71 395.00 38.81 - 12,702.52<br />
Finance taken (including loans and equity) 1,451.77 - 83.00 - 1,534.77<br />
1,640.01 265.00 67.00 - 1,972.01<br />
Interest / Dividend paid / (received) (net) (83.33) (21.29) 177.93 - 73.31<br />
836.91 (39.90) 86.40 - 883.41<br />
Amount receivable 1,159.70 2.09 56.29 - 1,218.08<br />
809.21 - 47.78 - 856.99<br />
Amount payable 172.56 - <strong>11</strong>1.49 - 284.05<br />
106.52 213.03 102.84 - 422.39<br />
Amount receivable (in respect of loans,<br />
interest and dividend) 459.75 289.89 30.83 0.10 780.57<br />
293.81 275.59 32.07 0.10 601.57<br />
Amount payable (in respect of loans,<br />
interest and dividend) 4.00 - - - 4.00<br />
60.01 - 13.01 - 73.02<br />
Bank Guarantee / Other assets given as security 194.89 - 3.00 - 197.89<br />
318.16 - - - 318.16
Schedules forming part of the Balance Sheet and Profit and Loss Account<br />
(` in crores)<br />
“13” [Item no. 13] (contd.)<br />
(A) Notes to Balance Sheet (contd.)<br />
(c) Disclosure in respect of material transactions with related parties<br />
<strong>2010</strong>-20<strong>11</strong> 2009-<strong>2010</strong><br />
(i) Purchase of goods Fiat India Automobiles Ltd 4,400.87 3,190.61<br />
<strong>Tata</strong> Cummins Ltd 2,472.84 1,809.42<br />
TML Distribution Company Ltd 1,337.71 359.38<br />
<strong>Tata</strong> AutoComp Systems Ltd 455.51 446.19<br />
Automobile Corporation of Goa Ltd 300.09 190.37<br />
(ii) Sale of goods TML Distribution Company Ltd 18,752.36 14,518.42<br />
Fiat India Automobiles Ltd 456.33 285.60<br />
<strong>Tata</strong> Cummins Ltd 227.49 156.02<br />
Concorde <strong>Motors</strong> (India) Ltd 168.30 243.47<br />
Telco Construction Equipment Co. Ltd 38.56 30.54<br />
(iii) Purchase of fixed assets <strong>Tata</strong> Technologies Ltd 27.42 10.27<br />
TAL Manufacturing Solutions Ltd 17.85 31.46<br />
(iv) Purchase of Investments <strong>Tata</strong> Sons Ltd. 5.86 -<br />
(v) Sale of Investments <strong>Tata</strong> Sons Ltd. - 693.39<br />
(vi)<br />
Sale of fixed assets<br />
(including transfer of technology) HV Transmissions Ltd - 1.31<br />
(vii) Services received HV Axles Ltd 569.68 398.44<br />
HV Transmissions Ltd 367.20 247.44<br />
<strong>Tata</strong> Technologies Ltd 301.08 235.54<br />
<strong>Tata</strong> <strong>Motors</strong> European Technical Centre Plc 144.80 170.56<br />
<strong>Tata</strong> <strong>Motors</strong> Finance Ltd <strong>11</strong>7.72 <strong>11</strong>9.51<br />
<strong>Tata</strong> Sons Ltd. 56.70 55.82<br />
(viii) Services rendered TML Distribution Company Ltd 25.97 25.47<br />
HV Axles Ltd 19.86 12.43<br />
HV Transmissions Ltd 17.37 12.37<br />
<strong>Tata</strong> Marcopolo <strong>Motors</strong> Ltd 15.20 6.22<br />
<strong>Tata</strong> Hispano <strong>Motors</strong> Carrocera S.A. 12.02 2.93<br />
Telco Construction Equipment Co. Ltd 9.76 10.20<br />
<strong>Tata</strong> Cummins Ltd 6.03 4.64<br />
Fiat India Automobiles Ltd 0.02 1.53<br />
(ix) Finance given (including loans and equity)<br />
Investment in Equity <strong>Tata</strong> <strong>Motors</strong> Finance Ltd 400.00 -<br />
Investment in Equity TML Holdings Pte Ltd, (Singapore) - 10,575.61<br />
Investment in Equity Fiat India Automobiles Ltd 200.00 130.00<br />
Investment in Equity <strong>Tata</strong> <strong>Motors</strong> (Thailand) Ltd - 89.69<br />
Investment in Equity <strong>Tata</strong> Precision Industries Pte Ltd 37.42 -<br />
Inter Corporate Deposit TML Distribution Company Ltd 585.00 1,014.96<br />
Inter Corporate Deposit <strong>Tata</strong> Technologies Ltd 326.00 216.00<br />
Inter Corporate Deposit HV Axles Ltd 222.00 57.65<br />
Inter Corporate Deposit <strong>Tata</strong> <strong>Motors</strong> Finance Ltd 140.57 100.00<br />
Inter Corporate Deposit Automobile Corporation of Goa Ltd 89.00 -<br />
Loan <strong>Tata</strong> <strong>Motors</strong> (Thailand) Ltd 74.34 46.85<br />
Subordinated loan # Fiat India Automobiles Ltd - 265.00<br />
# The loan of ` 265.00 crores to Fiat India Automobile Ltd (FIAL) is subordinated for all principal, interest, costs, fees, charges and<br />
expenses and other amounts incurred or to be incurred or at any time due and owing under the said subordinated loan to the<br />
repayments to be made by FIAL to certain specified lenders.<br />
91
Sixty-sixth annual report <strong>2010</strong>-20<strong>11</strong><br />
<strong>Tata</strong> <strong>Motors</strong> Limited<br />
Schedules forming part of the Balance Sheet and Profit and Loss Account<br />
“13” [Item no. 13] (contd.) (` in crores)<br />
(A) Notes to Balance Sheet (contd.)<br />
(c) Disclosure in respect of material transactions with related parties (contd.)<br />
<strong>2010</strong>-20<strong>11</strong> 2009-<strong>2010</strong><br />
(x) Finance taken (including loans and equity)<br />
Inter Corporate Deposit TML Distribution Company Ltd 585.00 1,014.96<br />
Inter Corporate Deposit <strong>Tata</strong> Technologies Ltd 271.00 229.00<br />
Inter Corporate Deposit HV Axles Ltd 221.00 60.55<br />
Inter Corporate Deposit HV Transmissions Ltd 169.00 29.00<br />
Inter Corporate Deposit <strong>Tata</strong> <strong>Motors</strong> Finance Ltd 160.57 100.00<br />
Inter Corporate Deposit Automobile Corporation of Goa Ltd 83.00 -<br />
Loan <strong>Tata</strong> <strong>Motors</strong> (Thailand) Ltd - 89.69<br />
Inter Corporate Deposit Sheba Properties Ltd - 5.00<br />
Inter Corporate Deposit Fiat India Automobiles Ltd - 265.00<br />
(xi)<br />
(xii)<br />
Interest / Dividend paid / (received)<br />
Dividend paid <strong>Tata</strong> Sons Ltd 240.86 108.50<br />
Dividend received <strong>Tata</strong> Technologies Ltd (42.99) (6.06)<br />
Dividend received Telco Construction Equipment Co. Ltd (23.86) -<br />
Dividend received <strong>Tata</strong> Cummins Ltd (22.50) (6.75)<br />
Dividend received HV Axles Ltd (19.13) -<br />
Dividend received HV Transmissions Ltd (17.00) -<br />
Dividend received <strong>Tata</strong> Daewoo Commercial Vehicle Co. Ltd (12.23) -<br />
Dividend received <strong>Tata</strong> Sons Ltd (9.36) (9.36)<br />
Interest paid Fiat India Automobiles Ltd 45.30 10.10<br />
Interest paid TML Distribution Company Ltd 6.53 -<br />
Interest paid <strong>Tata</strong> Technologies Ltd 5.53 5.81<br />
Interest paid HV Axles Ltd 5.43 0.52<br />
Interest paid HV Transmissions Ltd 1.65 0.15<br />
Interest received Fiat India Automobiles Ltd (66.59) (49.99)<br />
Interest received <strong>Tata</strong> Hispano <strong>Motors</strong> Carrocera S.A. (4.58) (4.81)<br />
Bank Guarantee / other assets given as security<br />
Bank Guarantee / other assets given<br />
for Securitisation of debts <strong>Tata</strong> <strong>Motors</strong> Finance Ltd 194.89 318.16<br />
Deposits given <strong>Tata</strong> Sons Ltd 3.00 -<br />
92
(A)<br />
Schedules forming part of the Balance Sheet and Profit and Loss Account<br />
Notes to Balance Sheet (contd.)<br />
(ii) Disclosures required by Clause 32 of the Listing Agreement<br />
Amount of loans / advances in nature of loans outstanding from Subsidiaries and Associates during <strong>2010</strong>-20<strong>11</strong><br />
Name of the Company<br />
Outstanding as at<br />
March 31, 20<strong>11</strong><br />
Maximum amount<br />
outstanding during<br />
the year<br />
“13” [Item no. 13] (contd.)<br />
Investment in shares<br />
of the Company<br />
Direct Investment in<br />
shares of subsidiaries<br />
of the Company<br />
` in crores ` in crores No. of Shares No. of Shares<br />
a) Subsidiaries<br />
HV Transmissions Ltd - - - -<br />
- 13.50 - -<br />
Sheba Properties Ltd - - - 8,<strong>11</strong>,992<br />
[Note (i) below] - 5.00 - -<br />
TAL Manufacturing Solutions Ltd 12.00 16.00 - -<br />
5.50 9.50 - -<br />
Concorde <strong>Motors</strong> (India) Ltd - 31.00 - -<br />
31.00 35.00 - -<br />
HV Axles Ltd - - - -<br />
- 9.00 - -<br />
<strong>Tata</strong> <strong>Motors</strong> European Technical Centre Plc., UK 48.51 48.51 - 9,498<br />
[Note (ii) below] 32.59 38.06 - 9,498<br />
<strong>Tata</strong> Marcopolo <strong>Motors</strong> Ltd 5.00 10.00 - -<br />
10.00 21.00 - -<br />
<strong>Tata</strong> <strong>Motors</strong> (Thailand) Ltd 138.04 138.04 - -<br />
60.68 106.95 - -<br />
<strong>Tata</strong> <strong>Motors</strong> Finance Ltd - - - -<br />
- 100.00 - -<br />
TML Distribution Company Ltd - 100.00 - -<br />
- 200.00 - -<br />
<strong>Tata</strong> Hispano <strong>Motors</strong> Carrocera S.A. 236.27 236.27 - 40,000<br />
[Note (iii) below] 147.73 147.73 - 19,996<br />
<strong>Tata</strong> Precision Industries Pte. Ltd. (Singapore) - 8.02 - -<br />
(Subsidiary company w.e.f. February 15, 20<strong>11</strong>) - - - -<br />
<strong>Tata</strong> <strong>Motors</strong> Insurance Broking and Advisory Services Ltd 0.70 0.70 - -<br />
- - - -<br />
<strong>Tata</strong> <strong>Motors</strong> (SA) Proprietary Ltd 6.41 6.41 - -<br />
- - - -<br />
b) Associates<br />
<strong>Tata</strong> Precision Industries Pte. Ltd. (Singapore) - - - -<br />
(Subsidiary company w.e.f. February 15, 20<strong>11</strong>) 8.02 8.48 - -<br />
<strong>Tata</strong> AutoComp Systems Ltd 23.83 23.83 - -<br />
23.83 23.83 - -<br />
c) Joint Ventures :<br />
Fiat India Automobiles Ltd 265.00 265.00 - -<br />
265.00 265.00 - -<br />
Note :<br />
(i) Shares in <strong>Tata</strong> Technologies Ltd<br />
(ii) Shares in Miljobil Grenland AS<br />
(iii) Shares in <strong>Tata</strong> Hispano <strong>Motors</strong> Carrocerries Maghreb<br />
7. The Company has a joint venture with Fiat Group Automobiles S.p.A., Italy, Fiat India Automobiles Limited (FIAL), for manufacturing passenger cars, engines and<br />
transmissions at Ranjangaon in India. The Company has an investment of ` 1,199.54 crores as at March 31, 20<strong>11</strong>, representing 50% shareholding in FIAL .<br />
The proportionate share of assets and liabilities as at March 31, 20<strong>11</strong> and income and expenditure for the year <strong>2010</strong>-<strong>11</strong> of FIAL are given below :<br />
(` in crores)<br />
As on<br />
As on<br />
March 31, March 31,<br />
20<strong>11</strong> <strong>2010</strong> <strong>2010</strong>-20<strong>11</strong> 2009-<strong>2010</strong><br />
(Unaudited) (Audited) (Unaudited) (Audited)<br />
RESERVES AND SURPLUS<br />
INCOME<br />
Reserves and Surplus (607.19) (484.31) Sale of products and services 2,039.97 1,614.85<br />
Less : Excise duty (324.04) (192.92)<br />
Other operating income 198.61 146.31<br />
ASSETS<br />
Net Block (including CWIP) 1,651.76 1,769.34 1,914.54 1,568.24<br />
Investments (Rs. 50.00) - -<br />
Current Assets 962.57 983.88<br />
2,614.33 2,753.22<br />
LIABILITIES<br />
EXPENDITURE<br />
Loan Funds 1,150.51 1,337.90 Manufacturing and other expenses 1,766.43 1,437.93<br />
Current Liabilities 997.99 1,028.20 Expenditure transferred to capital<br />
Provisions <strong>11</strong>.29 9.71 and other accounts - -<br />
2,159.79 2,375.81 Product Development Cost 3.46 0.48<br />
Depreciation 160.47 140.79<br />
Interest 107.06 124.18<br />
Claims not acknowledged as debts 4.15 3.14 Tax expenses - -<br />
2,037.42 1,703.38<br />
Capital Commitments 7.70 50.01<br />
93
Sixty-sixth annual report <strong>2010</strong>-20<strong>11</strong><br />
<strong>Tata</strong> <strong>Motors</strong> Limited<br />
Schedules forming part of the Balance Sheet and Profit and Loss Account<br />
“13” [Item no. 13] (contd.) (` in crores)<br />
(A) Notes to Balance Sheet (contd.)<br />
8. Micro, Small and Medium Enterprise Development Act, 2006 :<br />
The information as required to be disclosed under the Micro, Small and Medium Enterprises Development Act, 2006 has been<br />
determined to the extent such parties have been identified on the basis of information available with the Company. The amount of<br />
principal and interest outstanding during <strong>2010</strong>-20<strong>11</strong> is given below :<br />
<strong>2010</strong>-20<strong>11</strong> 2009-<strong>2010</strong><br />
(i) Amounts due but unpaid as at year end - Principal 0.06 -<br />
(ii) Amounts paid after appointed date during the year - Principal 339.71 350.51<br />
(iii) Amount of interest accrued and unpaid as at year end - Interest 1.58 1.00<br />
9. Foreign Currency Monetary Item Translation Difference Account (Net) [Item 7, Page 62]:<br />
As at<br />
As at<br />
March 31, March 31,<br />
20<strong>11</strong> <strong>2010</strong><br />
Opening Balance [ loss / (gain)] 161.69 (164.12)<br />
Exchange loss / (gain) during the year (14.08) 400.33<br />
Amortisation of exchange fluctuation for the year (147.61) (74.52)<br />
Closing Balance [loss] - 161.69<br />
As at<br />
As at<br />
March 31, March 31,<br />
20<strong>11</strong> <strong>2010</strong><br />
10. Claims against the Company not acknowledged as debts -<br />
(i) Sales Tax - Gross 1,003.68 460.47<br />
- Net of Tax 670.28 307.51<br />
(ii) Excise Duty - Gross 492.55 178.96<br />
- Net of Tax 328.94 <strong>11</strong>9.51<br />
(iii) Others - Gross 156.92 145.<strong>11</strong><br />
- Net of Tax 104.80 96.92<br />
(iv) Income tax (exclusive of the effect of similar matters in respect of assessments remaining to be<br />
completed) in respect of matters :<br />
(a) Decided in the Company’s favour by Appellate authorities and for which the<br />
Department is in further appeal 222.08 100.79<br />
(b) Pending before Appellate authorities in respect of which the Company is<br />
in appeal and expects to succeed, based on decision in earlier assessment years 1.42 132.86<br />
(c) Pending in appeal / other matters 177.69 162.12<br />
<strong>11</strong>. The claims / liabilities in respect of excise duty, sales tax and other matters where the<br />
issues were decided in favour of the Company for which the Department is in further appeal 31.28 35.74<br />
12. Other money for which the Company is contingently liable -<br />
(i) In respect of bills discounted and export sales on deferred credit 170.60 1.78<br />
(ii) The Company has given guarantees for liability in respect of receivables assigned by<br />
way of securitisation 634.34 1,075.69<br />
(iii) Cash Margins / Collateral [Schedule 9 (d), page 79] 428.82 604.94<br />
(iv) In respect of subordinate receivables 37.16 89.76<br />
(v) Deposits given as collateral security - 20.00<br />
(vi) Others 13.68 26.61<br />
13. Estimated amount of contracts remaining to be executed on capital account and not<br />
provided for 1,857.43 1,278.44<br />
94
Schedules forming part of the Balance Sheet and Profit and Loss Account<br />
(` in crores)<br />
“13” [Item no. 15] (contd.)<br />
<strong>2010</strong>-20<strong>11</strong> 2009-<strong>2010</strong><br />
(B) Notes to Profit and Loss Account :<br />
(1) Purchase of products for sale etc. include [Also refer Schedule 13(E) and 14, page 100]:<br />
(a) Spare parts and accessories for sale 1,350.25 1,054.40<br />
(b) Bodies and trailers for mounting on chassis 956.50 719.66<br />
(c) Vehicles 82,563 nos. (2009-<strong>2010</strong> : 52,891 nos.) 5,056.38 2,739.17<br />
7,363.13 4,513.23<br />
(2) The total expenditure incurred on Research and Development :<br />
<strong>2010</strong>-20<strong>11</strong> 2009-<strong>2010</strong><br />
(a) Expenditure charged to profit and loss account 121.86 78.36<br />
(b) Expenditure capitalised during the year 897.16 1,002.13<br />
(c) Fixed Assets 168.19 86.18<br />
1,187.21 1,166.67<br />
<strong>2010</strong>-20<strong>11</strong> 2009-<strong>2010</strong><br />
`<br />
`<br />
(3) (a) Auditors’ Remuneration (excluding service tax) :<br />
(i) Audit Fees 4,00,00,000 3,75,00,000<br />
(ii) Audit Fees for financial statements as per IFRS / US GAAP (including SOX certification) # 3,75,00,000 5,00,00,000<br />
(iii) In other Capacities :<br />
Company Law Matters 35,000 35,000<br />
Tax Audit 45,00,000 37,50,000<br />
Transfer Pricing Audit * <strong>11</strong>,00,000 -<br />
Taxation Matters 22,33,500 <strong>11</strong>,26,500<br />
(iv) Other Services @ 8,25,000 5,27,000<br />
(v) Reimbursement of travelling and out-of-pocket expenses 13,99,491 4,60,889<br />
(b) Cost Auditors’ Remuneration (excluding service tax) :<br />
(i) Cost Audit Fees 10,00,000 10,00,000<br />
(ii) Reimbursement of travelling and out-of-pocket expenses 46,700 36,700<br />
Notes :<br />
@ Excludes audit fees debited to Securities Premium Account related to :<br />
(i) GDS and FCCN Issue - 40,00,000<br />
(ii) QIP Issue 50,00,000 -<br />
# Represents amount paid for earlier years 3,75,00,000 5,00,00,000<br />
* Includes amount paid for earlier years 7,00,000 -<br />
(4) Interest and Discounting Charges [Item 7, page 63] : (` in crores)<br />
<strong>2010</strong>-20<strong>11</strong> 2009-<strong>2010</strong><br />
(A) Interest :<br />
(a) On Debentures and fixed loans 948.65 880.53<br />
(b) Others <strong>11</strong>6.30 <strong>11</strong>3.01<br />
1,064.95 993.54<br />
Less : (i) Transferred to Capital account 148.00 237.28<br />
(ii)<br />
Interest received on bank and other accounts [tax deducted<br />
at source ` 12.09 crores (2009-<strong>2010</strong> ` 5.00 crores)] 239.71 142.39<br />
677.24 613.87<br />
(B) Discounting charges (net) 466.75 489.97<br />
1,143.99 1,103.84<br />
95
Sixty-sixth annual report <strong>2010</strong>-20<strong>11</strong><br />
<strong>Tata</strong> <strong>Motors</strong> Limited<br />
Schedules forming part of the Balance Sheet and Profit and Loss Account<br />
“13” [Item no. 15] (contd.) (` in crores)<br />
(B) Notes to Profit and Loss Account : (contd.)<br />
(5) Defined benefit plans / Long term compensated absences - As per actuarial valuations as on March 31, 20<strong>11</strong><br />
Gratuity, Superannuation and BKY Compensated Absences Post-retirement Medicare scheme<br />
20<strong>11</strong> <strong>2010</strong> 2009 2008 2007 20<strong>11</strong> <strong>2010</strong> 2009 2008 2007 20<strong>11</strong> <strong>2010</strong> 2009 2008 2007<br />
i Components of employer expense<br />
Current Service cost 29.63 24.97 25.24 21.60 16.40 18.41 14.68 14.85 12.80 10.42 2.88 2.53 1.97 1.80 2.15<br />
Interest cost 42.32 38.09 37.42 34.65 27.44 12.49 10.30 10.69 9.60 5.96 6.15 5.86 4.72 4.19 2.73<br />
Expected return on plan assets (39.56) (35.46) (32.56) (30.70) (25.41) - - - - - - - - - -<br />
Actuarial (Gains) / Losses 53.84 46.23 (4.26) 39.41 66.35 34.05 22.92 (9.80) 12.47 31.48 4.21 (1.74) 10.00 3.90 14.00<br />
Total expense recognised in the<br />
86.23 73.83 25.84 64.96 84.78 64.95 47.90 15.74 34.87 47.86 13.24 6.65 16.69 9.89 18.88<br />
Statement of Profit & Loss Account in<br />
Schedule B, page 67 under item :<br />
4(b) & 4(c) 4(a) 4(c)<br />
ii Actual Contribution and Benefit<br />
Payments for year ended March 31,<br />
Actual benefit payments 55.21 54.15 57.20 54.98 58.26 25.93 18.24 22.49 21.42 17.72 3.10 3.17 3.43 3.75 3.66<br />
Actual Contributions 78.<strong>11</strong> 75.80 22.18 87.98 100.43 25.93 18.24 22.49 21.42 17.72 3.10 3.17 3.43 3.75 3.66<br />
iii Net liability recognised in Balance<br />
Sheet as at March 31,<br />
Present Value of Defined Benefit<br />
606.73 534.60 485.95 474.36 440.14 198.97 159.95 130.29 137.04 123.59 84.13 73.99 70.51 57.25 51.14<br />
Obligation<br />
Fair value of plan assets 547.03 483.02 432.39 424.45 367.21 N/A N/A N/A N/A N/A N/A N/A N/A N/A N/A<br />
Net liability recognised in Balance Sheet (59.70) (51.58) (53.56) (49.91) (72.93) (198.97) (159.95) (130.29) (137.04) (123.59) (84.13) (73.99) (70.51) (57.25) (51.14)<br />
iv Change in Defined Benefit Obligations<br />
(DBO) during the year ended March 31,<br />
Present Value of DBO at the beginning of 534.60 485.95 474.36 440.14 385.20 159.95 130.29 137.04 123.59 93.45 73.99 70.51 57.25 51.<strong>11</strong> 35.92<br />
the year<br />
Current Service cost 29.63 24.97 25.24 21.60 16.40 18.41 14.68 14.85 12.80 10.42 2.88 2.53 1.97 1.80 2.15<br />
Interest cost 42.32 38.09 37.42 34.65 27.44 12.49 10.30 10.69 9.60 5.96 6.15 5.86 4.72 4.19 2.73<br />
Actuarial losses 55.39 39.74 6.13 32.95 69.36 34.05 22.92 (9.80) 12.47 31.48 4.21 (1.74) 10.00 3.90 14.00<br />
Benefits paid (55.21) (54.15) (57.20) (54.98) (58.26) (25.93) (18.24) (22.49) (21.42) (17.72) (3.10) (3.17) (3.43) (3.75) (3.66)<br />
Present Value of DBO at the end of the 606.73 534.60 485.95 474.36 440.14 198.97 159.95 130.29 137.04 123.59 84.13 73.99 70.51 57.25 51.14<br />
year<br />
v Change in Fair Value of Assets during<br />
the year ended March 31,<br />
Plan assets at the beginning of the year 483.02 432.39 424.45 367.21 296.62 N/A N/A N/A N/A N/A N/A N/A N/A N/A N/A<br />
Actual return on plan assets 41.<strong>11</strong> 28.98 42.96 24.24 28.42 N/A N/A N/A N/A N/A N/A N/A N/A N/A N/A<br />
Actual Company contributions 78.<strong>11</strong> 75.80 22.18 87.98 100.43 25.93 18.24 22.49 21.42 17.72 3.10 3.17 3.43 3.75 3.66<br />
Benefits paid (55.21) (54.15) (57.20) (54.98) (58.26) (25.93) (18.24) (22.49) (21.42) (17.72) (3.10) (3.17) (3.43) (3.75) (3.66)<br />
Plan assets at the end of the year 547.03 483.02 432.39 424.45 367.21 N/A N/A N/A N/A N/A N/A N/A N/A N/A N/A<br />
vi Actuarial Assumptions<br />
Discount Rate (%) 6.75- 6.75- 6.75- 7.75- 8.00- 8.50 8.50 8.50 8.50 8.50 8.50 8.50 8.50 8.50 8.50<br />
8.50 8.50 8.50 8.50 8.50<br />
Expected Return on plan assets (%) 8.00 8.00 8.00 8.00 8.00 N/A N/A N/A N/A N/A N/A N/A N/A N/A N/A<br />
Medical cost inflation (%) N/A N/A N/A N/A N/A N/A N/A N/A N/A N/A 4.00 4.00 4.00 4.00 4.00<br />
vii The major categories of plan assets as<br />
percentage of total plan assets<br />
Debt securities 75% 74% 76% 68% 63% N/A N/A N/A N/A N/A N/A N/A N/A N/A N/A<br />
Balances with banks 25% 26% 24% 32% 37% N/A N/A N/A N/A N/A N/A N/A N/A N/A N/A<br />
viii<br />
Effect of one percentage point change<br />
in assumed Medical inflation rate<br />
One percentage point increase in<br />
Medical inflation rate<br />
One percentage point decrease in<br />
Medical inflation rate<br />
20<strong>11</strong> <strong>2010</strong> 2009 2008 2007 20<strong>11</strong> <strong>2010</strong> 2009 2008 2007<br />
Revised DBO as at March 31, 91.65 81.48 77.68 58.<strong>11</strong> 56.39 77.57 67.49 64.29 52.10 46.55<br />
Revised service cost for the year 3.37 2.95 2.30 1.95 2.38 2.48 2.17 1.69 1.42 1.96<br />
Revised interest cost for the year 6.79 6.47 4.79 4.63 3.01 5.60 5.33 4.28 3.80 2.48<br />
(a) Defined Contribution Plans-<br />
The Company’s contribution to defined contribution plan aggregated ` 144.97 crores (2009-<strong>2010</strong> ` <strong>11</strong>9.24 crores) for the year ended March 31, 20<strong>11</strong> has been recognised in the<br />
statement of Profit and Loss Account under item 4 (b) in Schedule B on page 67.<br />
(b) The expected rate of return on plan assets is based on market expectation, at the beginning of the year, for returns over the entire life of the related obligation.<br />
(c) The assumption of future salary increases, considered in actuarial valuation, takes into account of inflation, seniority, promotion and other relevant factors, such as supply and<br />
demand in the employment market.<br />
(d) The Company expects to contribute ` 85.23 crores to the funded pension plans in the year 20<strong>11</strong>-12.<br />
96
(B)<br />
Schedules forming part of the Balance Sheet and Profit and Loss Account<br />
(` in crores)<br />
“13” [Item no. 15] (contd.)<br />
Notes to Profit and Loss Account (contd.)<br />
<strong>2010</strong>-20<strong>11</strong> 2009-<strong>2010</strong><br />
(6) (a) Product warranty [Schedule 12(e), page 82] [Note (i), page 84] :<br />
Opening Balance 248.63 134.19<br />
Provision during the year (net) 376.47 316.24<br />
Payments / debits (net of recoveries from suppliers) (226.85) (201.80)<br />
Closing Balance 398.25 248.63<br />
(b) Premium on redemption of Foreign Currency Convertible Notes (FCCN) and<br />
Convertible Alternative Reference Securities (CARS) [Schedule 12(f), page 82]<br />
[Note (o), page 85 and Note (C)(i), page 98]:<br />
Opening Balance 993.15 1,094.57<br />
Provision for premium on redemption of FCCN (including withholding tax) - 257.46<br />
Foreign currency exchange gain (3.22) (133.38)<br />
Reversal of provision for premium due to conversion of FCCN (168.57) (225.50)<br />
Reversal of provision for WHT due to redemption of FCCN (20.27) -<br />
Closing Balance 801.09 993.15<br />
<strong>2010</strong>-20<strong>11</strong> 2009-<strong>2010</strong><br />
(7) Earnings Per Share :<br />
(a) Profit after tax ` crores 1,8<strong>11</strong>.82 2,240.08<br />
(b) The weighted average number of Ordinary<br />
Shares for Basic EPS Nos. 51,77,60,138 46,37,36,463<br />
(c) The weighted average number of ‘A’ Ordinary<br />
Shares for Basic EPS Nos. 7,93,33,840 6,41,76,028<br />
(d) The nominal value per Share (Ordinary and ‘A’ Ordinary) ` 10.00 10.00<br />
(e) Share of Profit for Ordinary Shares for Basic EPS ` crores 1,567.65 1,964.94<br />
(f) Share of Profit for ‘A’ Ordinary Shares for Basic EPS * ` crores 244.17 275.14<br />
(g) Earnings Per Ordinary Share (Basic) ` 30.28 42.37<br />
(h) Earnings Per ‘A’ Ordinary Share (Basic) ` 30.78 42.87<br />
(i) Profit after tax for Basic EPS ` crores 1,8<strong>11</strong>.82 2,240.08<br />
(j) Add: Interest payable on outstanding Foreign Currency<br />
Convertible Notes ` crores 53.98 41.93<br />
(k) Profit after tax for Diluted EPS ` crores 1,865.80 2,282.01<br />
(l) The weighted average number of Ordinary<br />
Shares for Basic EPS Nos. 51,77,60,138 46,37,36,463<br />
(m) Add: Adjustment for Options relating to warrants, Ordinary<br />
Shares held in abeyance, Foreign Currency Convertible<br />
Notes and Convertible Alternative Reference Securities Nos. 4,65,77,982 5,66,43,723<br />
(n) The weighted average number of Ordinary<br />
Shares for Diluted EPS Nos. 56,43,38,120 52,03,80,186<br />
(o) The weighted average number of ‘A’ Ordinary<br />
Shares for Basic EPS Nos. 7,93,33,840 6,41,76,028<br />
(p) Add: Adjustment for ‘A’ Ordinary Shares<br />
held in abeyance Nos. 99,530 1,00,136<br />
(q) The weighted average number of ‘A’ Ordinary<br />
Shares for Diluted EPS Nos. 7,94,33,370 6,42,76,164<br />
(r) Share of Profit for Ordinary Shares for Diluted EPS ` crores 1,632.10 2,028.27<br />
(s) Share of Profit for ‘A’ Ordinary Shares for Diluted EPS * ` crores 233.70 253.74<br />
(t) Earnings Per Ordinary Share (Diluted) ` 28.92 38.98<br />
(u) Earnings Per ‘A’ Ordinary Share (Diluted) ` 29.42 39.48<br />
* ‘A’ Ordinary Share holders are entitled to receive dividend @ 5% points more than the aggregate rate of dividend determined by the Company<br />
on Ordinary Shares for the financial year.<br />
97
Sixty-sixth annual report <strong>2010</strong>-20<strong>11</strong><br />
<strong>Tata</strong> <strong>Motors</strong> Limited<br />
Schedules forming part of the Balance Sheet and Profit and Loss Account<br />
“13” [Item no. 13] (contd.)<br />
(C) (i) Foreign Currency Convertible Notes (FCCN) and Convertible Alternative Reference Securities (CARS) :<br />
The Company issued the FCCN and CARS which are convertible into Ordinary Shares or ADRs. Additionally, CARS can be converted into Qualifying Securities* in case<br />
there has been a Qualifying Issue as per the terms of Issue. The particulars, terms of issue and the status of conversion as at March 31, 20<strong>11</strong> are given below :<br />
Issue 1% FCCN (due 20<strong>11</strong>) 0% FCCN (due 20<strong>11</strong>) 0% CARS (due 2012) 4% FCCN (due 2014)<br />
Issued on April 27, 2004 March 20, 2006 July <strong>11</strong>, 2007 October 15, 2009<br />
Issue Amount (in INR at the<br />
time of the issue)<br />
US $ 300 million<br />
(` 1,315.50 crores)<br />
JP ¥ <strong>11</strong>,760 million<br />
(` 450.03 crores)<br />
US $ 490 million<br />
(` 1,992.71 crores)<br />
US $ 375 million<br />
(` 1,794.19 crores)<br />
Face Value US $ 1,000 JP ¥ 10,000,000 US $ 100,000 US $ 100,000<br />
Conversion Price per share<br />
at fixed exchange rate<br />
` 780.400<br />
US $ 1 = ` 43.85<br />
` 1,001.39<br />
` 1 = JP ¥ 2.66<br />
` 960.96<br />
US $ 1 = ` 40.59<br />
` 623.88<br />
US $ 1 = ` 46.28<br />
Reset Conversion Price (Due<br />
to Rights Issue and GDS Issue)<br />
Exercise Period<br />
Early redemption at the<br />
option of the Company<br />
subject to certain conditions<br />
` 736.72<br />
US $ 1 = ` 43.85<br />
June 7, 2004 to<br />
March 28, 20<strong>11</strong><br />
any time (in whole but not in<br />
part) in the event of certain<br />
changes affecting taxation<br />
in India<br />
` 945.34<br />
` 1 = JP ¥ 2.66<br />
May 2, 2006 to<br />
February 19, 20<strong>11</strong><br />
i) after March 20, 2009<br />
but prior to February<br />
8, 20<strong>11</strong> (in whole or in<br />
part) subject to certain<br />
conditions<br />
ii)<br />
any time (in whole but<br />
not in part) in the event<br />
of certain changes<br />
affecting taxation in<br />
India<br />
` 907.17<br />
US $ 1 = ` 40.59<br />
October <strong>11</strong>, 20<strong>11</strong><br />
to June 12, 2012<br />
i) after October <strong>11</strong>, 20<strong>11</strong> at<br />
our option (in whole but<br />
not in part)<br />
` 613.77<br />
US $ 1 = ` 46.28<br />
November 25, 2009 (for<br />
conversion into shares or<br />
GDSs) and October 15, <strong>2010</strong><br />
(for conversion into ADSs) to<br />
October 9, 2014<br />
i) any time on or after<br />
October 15, 2012 (in<br />
whole but not in part) at<br />
our option<br />
or or or<br />
ii) any time (in whole but ii)<br />
not in part) in the event<br />
of certain changes<br />
affecting taxation in<br />
India<br />
any time (in whole but<br />
not in part) in the event<br />
of certain changes<br />
affecting taxation in<br />
India<br />
Redeemable on April 27, 20<strong>11</strong> March 21, 20<strong>11</strong> July 12, 2012 October 16, 2014<br />
Redemption percentage of 121.781% 99.253% 131.820% 108.505%<br />
the Principal Amount<br />
Amount converted US $ 299.10 million JP ¥ 10,740 million Nil US $ 257.60 million<br />
Aggregate conversion into 2,29,50,915 78,39,043 1,94,23,734<br />
Shares / ADRs<br />
Aggregate Notes Redeemed Nil 72 Nil Nil<br />
Aggregate Notes Bought Back Nil 30 170 Nil<br />
Notes Outstanding as at 898 Nil 4,730 1,174<br />
March 31, 20<strong>11</strong><br />
Amount outstanding as at<br />
March 31, 20<strong>11</strong><br />
US $ 0.898 million<br />
(` 4.00 crores)<br />
Nil<br />
US $ 473.00 million<br />
(` 2,109.<strong>11</strong> crores)<br />
US $ <strong>11</strong>7.40 million<br />
(` 523.49 crores)<br />
Aggregate amount of shares Nil Nil 2,<strong>11</strong>,63,696 88,52,293 @<br />
that could be issued on<br />
conversion of outstanding<br />
notes<br />
* Qualifying Securities holders will have no or differential voting rights in comparison to the existing shareholders and will have no rights to withdraw the<br />
underlying Shares except upon certain conditions as per the terms of issue.<br />
@ Increased due to cash dividend distribution antidilution adjustment as per terms of issue.<br />
(ii) During the year, the Company has issued shares aggregating US$ 750 million, comprising ‘A’ Ordinary Shares aggregating US$ 550 million and Ordinary Shares<br />
aggregating US$ 200 million. Consequently, the Company has allotted 32,165,000 ‘A’ Ordinary Shares at a price of ` 764 per ‘A’ Ordinary Share (including a<br />
premium of ` 754 per ‘A’ Ordinary Share) and 8,320,300 Ordinary Shares at a price of ` 1,074 per Ordinary Share (including a premium of ` 1,064 per Ordinary<br />
Share) aggregating to a total issue size of ` 3,351.01 crores.<br />
(iii) During the year the Company has acquired 80% stake in Trilix Srl., Turin (Italy), a design and engineering company, for a consideration of Euro 1.85 million (Rs.<br />
<strong>11</strong>.94 crores). The acquisition is in line with the Company’s objective to enhance its styling /design capabilities to global standards.<br />
(iv) On March 30, <strong>2010</strong>, the Company sold 20% stake in Telco Construction Equipment Company Limited (Telcon) to Hitachi Construction Machinery Co. Ltd for a<br />
consideration of ` <strong>11</strong>59.50 crores. Consequently the Company holds 39.75% stake in Telcon.<br />
(v) On March 23, <strong>2010</strong>, the Company had offered to Non-U.S. Noteholders of outstanding 0% JPY <strong>11</strong>,760 million (due 20<strong>11</strong>) and 1% USD 300 million (due 20<strong>11</strong>)<br />
Convertible Notes, an option to convert their Notes into Ordinary Shares during a limited offer period. During this period, as per the terms of Invitation<br />
Memorandum, Noteholders could opt to receive shares at enhanced conversion terms. Noteholders, who did not participate, would continue with all the terms of<br />
their notes as applicable prior to this limited period offer. Noteholders representing 93.62% of the JPY Notes (i.e. JPY10,710 million) and 76.54% of USD Notes (i.e.<br />
USD 229.63 million), outstanding prior to the offering, opted to convert their Notes into Ordinary Shares. As a result, the company has allotted 2,66,43,266 equity<br />
shares to the Noteholders, who exercised the option.<br />
(vi) Subsequent to March 31, 20<strong>11</strong>, a subsidiary of the Company has redeemed 40,75,000 6.25% Cumulative Redeemable Preference Shares of USD 100 each at par,<br />
resulting in part redemption of the investment of the Company of ` 1,816.84 crores.<br />
(vii) Previous year’s figures have been regrouped where necessary.<br />
(viii) Current year figures are shown in bold print.<br />
98
(D)<br />
Schedules forming part of the Balance Sheet and Profit and Loss Account<br />
“13” [Item no. 13] (contd.)<br />
Derivative transactions<br />
The Company uses forward exchange contracts, principal only swaps, interest rate swaps, currency swaps and currency options to<br />
hedge its exposure in foreign currency and interest rates. The information on derivative instruments is as follows :<br />
(a) Derivative Instruments outstanding as at March 31, 20<strong>11</strong><br />
Currency Amount Buy / Sell Amount<br />
(Foreign Currency<br />
(` in crores)<br />
in millions)<br />
(i)<br />
Forward exchange contracts (net)<br />
US $ / IN ` US $ 106.57 Buy 475.17<br />
US $ 1.41 Sold 6.33<br />
GBP / IN ` - - -<br />
£ 5.31 Buy 36.18<br />
EUR / IN ` - - -<br />
€ 4.67 Buy 28.27<br />
EUR / US $ - - -<br />
€ 4.00 Buy 24.23<br />
(ii) Options (net)<br />
US $ / IN ` US $ 39.00 To Sell 173.89<br />
US $ 43.00 To Sell 193.17<br />
(iii) Cross Currency Swaps<br />
US $ / IN ` US $ 31.00 To Buy 138.22<br />
- - -<br />
(b) Foreign exchange currency exposures not covered by derivative instruments as at March 31, 20<strong>11</strong><br />
Amount<br />
(Foreign Currency<br />
in millions)<br />
(i)<br />
(ii)<br />
Amount<br />
(` in crores)<br />
Amount receivable on account of sales of goods, investment in<br />
preference shares, loan and interest charges US $ 1,076.74 4,800.71<br />
US $ 1,081.13 4,856.69<br />
€ 39.00 247.04<br />
€ 28.39 171.95<br />
£ 8.52 61.34<br />
£ 6.51 44.35<br />
- -<br />
SGD 2.51 8.04<br />
THB 949.00 139.66<br />
THB 449.54 62.31<br />
ZAR 10.33 6.78<br />
- -<br />
Creditors payable on account of loan and interest charges and<br />
other foreign currency expenditure US $ 1,281.55 5,714.43<br />
US $ 1,445.99 6,495.75<br />
€ <strong>11</strong>.23 71.27<br />
€ 13.62 82.48<br />
£ 7.67 54.81<br />
£ 1.18 8.01<br />
¥ 574.08 30.79<br />
¥ 1,949.81 0.94<br />
THB 89.83 13.24<br />
- -<br />
Others 1.87<br />
Others 12.25<br />
99
Sixty-sixth annual report <strong>2010</strong>-20<strong>11</strong><br />
<strong>Tata</strong> <strong>Motors</strong> Limited<br />
Schedules forming part of the Profit and Loss Account<br />
“13” [Item no. 15] (contd.) (` in crores)<br />
(E) Information in regard to opening stock and closing stock :<br />
<strong>2010</strong>-20<strong>11</strong> 2009-<strong>2010</strong><br />
Quantity Value Quantity Value<br />
Nos.<br />
Nos.<br />
(a) Opening Stock -<br />
Light, medium and heavy commercial vehicles, jeep type<br />
vehicles,<br />
passenger cars, utility vehicles etc. and bodies thereon # 12,545 983.31 8,188 581.85<br />
Vehicles purchased for resale 973 83.86 715 39.47<br />
Manufactured and purchased components for sale :<br />
Spare Parts for Vehicles<br />
Scrap 316.22 253.77<br />
6.14 4.78<br />
1,389.53 879.87<br />
(b) Closing Stock -<br />
Light, medium and heavy commercial vehicles, jeep type<br />
vehicles,<br />
passenger cars, utility vehicles etc. and bodies thereon # 13,537 * 957.25 12,545 * 983.31<br />
Vehicles purchased for resale 3,402 303.98 973 83.86<br />
Manufactured and purchased components for sale : Spare<br />
Parts for Vehicles<br />
Scrap 397.71 316.22<br />
3.93 6.14<br />
1,662.87 1,389.53<br />
# Includes chassis mounted with bodies / trailers.<br />
* Excluding :<br />
(i) Capitalised / transferred for internal use 874 vehicles (2009-<strong>2010</strong> : 1000 vehicles) including 4 vehicles (2009-<strong>2010</strong> : 4<br />
vehicles) for homologation / testing.<br />
(ii) Transferred on settlement of insurance claims for damaged vehicles : 70 vehicles (2009-<strong>2010</strong> : 56 vehicles).<br />
(iii) Donated Nil vehicles (2009-<strong>2010</strong> : 6 vehicles).<br />
(iv) Sent for exhibition 4 vehicles (2009-<strong>2010</strong> : 4 vehicles)<br />
“14” [Item no. 15] (` in crores)<br />
Information in regard to Sales effected by the Company (excluding inter-divisional transfers,<br />
settlements for damaged goods and goods capitalised) :<br />
<strong>2010</strong>-20<strong>11</strong> 2009-<strong>2010</strong><br />
Quantity Value Quantity Value<br />
Nos.<br />
Nos.<br />
1. Light, medium and heavy commercial vehicles, jeep type<br />
vehicles, passenger cars, utility vehicles etc. and bodies<br />
thereon [including export and other incentives of ` 803.57<br />
crores (2009-<strong>2010</strong> ` 561.55 crores)] 836,629 47,507.65 667,971 34,677.40<br />
2. Spare Parts for Vehicles 2,827.10 2,263.54<br />
3. Diesel Engines <strong>11</strong>,157 125.<strong>11</strong> 8,970 95.43<br />
4. Scrap 150.34 <strong>11</strong>1.68<br />
5. Castings and Forgings 1,052.27 695.39<br />
6. Income from Services 125.96 81.73<br />
51,788.43 37,925.17<br />
100
Schedules forming part of the Profit and Loss Account<br />
“15” [Item no.15]<br />
Quantitative information in regard to installed capacity and the goods manufactured by the Company :<br />
Unit of Installed Actual<br />
measurement capacity* production**<br />
1. On road automobiles having four or more wheels such as light,<br />
medium and heavy commercial vehicles, jeep type vehicles,<br />
passenger cars and chassis thereof (Jamshedpur Works) Nos. 1,44,000 1,03,445<br />
1,26,000 89,215<br />
2. Motor Vehicles for transport of ten or more persons including the<br />
driver, motor cars and other motor vehicles for transport of persons,<br />
motor vehicles for transport of goods, chassis fitted with engine for<br />
motor vehicles (Pune Works) Nos. 5,44,000 3,22,299<br />
5,44,000 2,99,251<br />
3. Motor Vehicles for transport of ten or more persons including the<br />
driver, motor cars and other motor vehicles for transport of persons,<br />
motor vehicles for transport of goods, chassis fitted with engine for<br />
motor vehicles (Lucknow Works) Nos. 90,000 51,093<br />
90,000 34,893<br />
4. Motor Vehicles for transport of ten or more persons including the<br />
driver, motor cars and other motor vehicles for transport of persons,<br />
motor vehicles for transport of goods, chassis fitted with engine for<br />
motor vehicles (Uttarakhand Works) Nos. 5,00,000 2,24,712<br />
5,00,000 1,97,402<br />
5. Motor Cars and other Motor Vehicles for transport of less than ten<br />
persons, jeep type vehicles and station wagons, special purpose<br />
motor cars (Sanand Works) Nos. 2,50,000 56,886<br />
- -<br />
6. Diesel Engines for Industrial and Marine applications Nos. *** <strong>11</strong>,157<br />
*** 8,970<br />
7. S. G. Iron Castings Tonnes 12,000 14,454<br />
12,000 13,001<br />
8. Power Generation 21.95 MW 2,92,60,986 kWh<br />
(21.95) MW 3,19,58,127 kWh<br />
9. Manufactured Components for Sale **** ` in crores 380.71<br />
322.41<br />
* On double shift basis for all plants (except Uttarakhand plant for which capacity is on three shift basis) including capacity for<br />
manufacture of replacement parts as certified by the management and relied upon by the Auditors.<br />
** Includes production for internal use.<br />
*** These are manufactured against spare capacity under (1) and (2) above.<br />
**** The production disclosed against manufactured components is the value (as this is more meaningful than quantity) of such<br />
components transferred during the year to the warehouses for sale.<br />
NOTE :<br />
1. As per Industrial Entrepreneurs Memoranda (IEM), in respect of item (1) to (5) above, the licensed capacity for Jamshedpur<br />
works is 1,32,000 nos., Pune works is 6,12,000 nos., Lucknow works is 1,92,000 nos., Uttarakhand works is 5,00,000 nos. and<br />
Sanand works is 5,00,000 nos.<br />
2. In addition to the above, the Company holds following industrial licenses / IEM for which there is no production during the year.<br />
(a) Special Purpose Motor Vehicle, other than those principally designed for the transport of persons or goods, Truck and<br />
(b)<br />
Bus Bodies: 1,55,000 nos. (Dharwad Works)<br />
Motor Cars & other Motor Vehicles for transport of less than 10 persons, jeep type vehicles & station wagons, special<br />
purpose motor cars: 3,50,000 nos. (Singur Works)<br />
3. In addition to the above, the Company holds following industrial licences / IEM.<br />
- Automotive equipment for various defence applications such as different types of armoured vehicles, heavy tank carriers,<br />
shelters, containers, tactical floating bridges and ferries, bullet proof vehicles, high mobility vehicles, mechanised<br />
material handling and bridging equipment, mine protected vehicles, etc.<br />
101
Sixty-sixth annual report <strong>2010</strong>-20<strong>11</strong><br />
<strong>Tata</strong> <strong>Motors</strong> Limited<br />
Schedules forming part of the Profit and Loss Account<br />
“16” [Item no. 15] (` in crores)<br />
Information regarding exports and imports and other matters :<br />
<strong>2010</strong>-20<strong>11</strong> 2009-<strong>2010</strong><br />
1. Earnings in foreign exchange :<br />
(i) F.O.B. value of goods exported [including sales through Export House, Exports to Nepal,<br />
Bhutan and local sales eligible for export incentives and exchange differences (net) -<br />
gain of ` 3.00 crores (2009-<strong>2010</strong> loss of ` 36.01 crores)] 3,339.03 1,921.48<br />
(ii) Profit on sale of investment - 1,<strong>11</strong>9.50<br />
(iii) Interest and Dividend 19.61 6.58<br />
2. C.I.F. value of imports<br />
(i) Raw Materials and Components 1,825.30 1,189.89<br />
(ii) Machinery spares and tools 46.80 33.33<br />
(iii) Capital goods 158.71 374.16<br />
(iv) Spare Parts for sale 8.63 20.99<br />
(v) Jaguar and Land Rover Vehicles and Spare Parts for Sale 265.04 79.48<br />
(vi) Other items 12.39 2.61<br />
3. (a) Value of imported and indigenous raw materials and components consumed :<br />
(i) Imported at Rupee cost 1,598.91 1,212.29<br />
(ii) Indigenously obtained 25,459.56 19,180.31<br />
(b) Percentage to total consumption :<br />
(i) Imported % 5.91 5.94<br />
(ii) Indigenously obtained % 94.09 94.06<br />
Note :<br />
In giving the above information, the Company has taken the view that spares and components as referred to in Clause 4D(c)<br />
of Part II of Schedule VI covers only such items as consumed directly in production.<br />
102
Schedules forming part of the Profit and Loss Account<br />
(` in crores)<br />
“16” [Item no. 15] (contd.)<br />
<strong>2010</strong>-20<strong>11</strong> 2009-<strong>2010</strong><br />
4. Expenditure in foreign currency (subject to deduction of tax where applicable) :<br />
(i) Technical Know-how / services / consultancy fees 223.39 217.59<br />
(ii) Interest 136.57 74.22<br />
(iii) Consultancy / Professional charges 52.80 <strong>11</strong>3.44<br />
(iv) Payments on Other Accounts [including Exchange differences (net)] 177.55 216.34<br />
5. Remittances in foreign currencies for dividends :<br />
The Company does not have complete information as to the extent to which<br />
remittances in foreign currencies on account of dividends have been made by or on<br />
behalf of non-resident shareholders. The particulars of dividends declared during<br />
the year and payable to non - resident shareholders for the year 2009-<strong>2010</strong> are as<br />
under :<br />
(i)<br />
(ii)<br />
(iii)<br />
Number of non-resident shareholders<br />
(a) For 2009-<strong>2010</strong> Nos. 7,406 -<br />
(b) For 2008-2009 Nos. - 7,647<br />
Number of shares held by them<br />
(a) For 2009-<strong>2010</strong> Nos. 18,19,96,551 -<br />
(b) For 2008-2009 Nos. - 12,77,51,829<br />
Gross amount of dividend<br />
(a) For 2009-<strong>2010</strong> 272.99 -<br />
(b) For 2008-2009 - 76.65<br />
“17” [Item no. 15]<br />
Information in regard to raw materials and components consumed :<br />
<strong>2010</strong>-20<strong>11</strong> 2009-<strong>2010</strong><br />
Unit of Quantity Value Quantity Value<br />
Measurement<br />
Steel Tonnes 2,20,133 943.58 1,85,205 717.08<br />
Steel Tubes Tonnes 82 0.63 30 0.18<br />
Non-ferrous alloys/metals Tonnes 5,040 75.29 3,339 43.99<br />
Ferro Alloys Tonnes 1,716 23.93 1,372 15.59<br />
Steel Melting Scrap Tonnes 62,195 228.15 53,418 152.93<br />
Paints, Oils and Lubricants Tonnes 12,151 80.57 7,684 43.79<br />
Kilo liters 13,349 167.12 10,024 140.18<br />
Tyres, Tubes and Flaps Nos. 72,43,420 2,031.98 45,55,<strong>11</strong>1 1,484.40<br />
Engines Nos. 1,35,181 2,<strong>11</strong>5.33 1,04,309 1,549.56<br />
Other components 21,391.88 16,244.90<br />
27,058.47 20,392.60<br />
Note :<br />
The Consumption figures shown above are after adjusting excesses and shortages ascertained on physical count, unserviceable<br />
items, etc. The figures of other components is a balancing figure based on the total consumption shown in the profit and loss<br />
account.<br />
103
Sixty-sixth annual report <strong>2010</strong>-20<strong>11</strong><br />
<strong>Tata</strong> <strong>Motors</strong> Limited<br />
Additional Information as required under Part IV of Schedule VI<br />
to the Companies Act, 1956<br />
Balance Sheet Abstract and Company’s General Business Profile:<br />
I. Registration Details:<br />
Registration No 4520<br />
State Code <strong>11</strong><br />
Balance Sheet Date 31.03.20<strong>11</strong><br />
II.<br />
III.<br />
Capital Raised during the Year<br />
(Amount in ` Thousand)<br />
Public Issue<br />
Nil<br />
Rights Issue<br />
Nil<br />
Bonus Issue<br />
Nil<br />
Private Placement 4,04,853<br />
Position of Mobilisation and Deployment of Funds<br />
(Amount in ` Thousand)<br />
Total Liabilities 54,19,04,470<br />
Total Assets 54,19,04,470<br />
Sources of Funds:<br />
Paid-up Capital 63,77,104<br />
Reserves & Surplus 19,37,55,883<br />
Secured Loans 7,76,60,539<br />
Unsecured Loans 8,13,26,958<br />
Deferred Tax Liability 2,02,31,542<br />
Application of Funds:<br />
Net Fixed Assets 17,47,56,377<br />
Investments 22,62,42,127<br />
Net Current Assets (2,16,46,478)<br />
IV.<br />
Performance of Company<br />
(Amount in ` Thousand)<br />
Turnover 48,22,37,192<br />
Total Expenditure 45,73,29,496<br />
Profit Before Tax 2,49,07,697<br />
Profit after Tax 1,81,18,232<br />
Earning Per Share - Basic (Rs.):<br />
(i) Ordinary Share 30.28<br />
(ii) ‘A’ Ordinary Share 30.78<br />
Dividend Rate:<br />
(i) Ordinary Share 200%<br />
(ii) ‘A’ Ordinary Share 205%<br />
V. Generic Names of Three Principal Products/Services of Company (as per monetary terms)<br />
Item Code No. (ITC Code) 8702 to 8708 except 8707<br />
Product Description<br />
Chasis and Vehicles for transport of<br />
goods and passengers, including<br />
motor car and parts thereof.<br />
RESEARCH AND DEVELOPMENT EXPENDITURE<br />
(` in crores)<br />
2008-09 2007-08 2006-07 2005-06 2004-05<br />
The total expenditure incurred on Research and Development :<br />
(a) Expenditure charged to profit and loss account 23.61 135.26 159.57 130.00 128.44<br />
(b) Expenditure capitalised during the year 1,223.23 875.04 508.36 261.75 138.06<br />
(c) Fixed Assets 190.52 182.6 129.95 87.04 126.83<br />
Total 1,437.36 1,192.90 797.88 478.79 393.33<br />
Note: For Research and Development Expenditure for the year <strong>2010</strong>-<strong>11</strong> and 2009-10, refer Note (B)(2), page 95.<br />
104
AUDITORS’ REPORT<br />
TO THE BOARD OF DIRECTORS OF<br />
TATA MOTORS LIMITED<br />
1. We have audited the attached Consolidated Balance Sheet of TATA MOTORS LIMITED (“the Company”), its subsidiaries and jointly<br />
controlled entities (the Company, its subsidiaries and jointly controlled entities constitute “the Group”) as at March 31, 20<strong>11</strong>, the<br />
Consolidated Profit and Loss Account and the Consolidated Cash Flow Statement of the Group for the year ended on that date, both<br />
annexed thereto. The Consolidated Financial Statements include investments in associates accounted on the equity method in accordance<br />
with Accounting Standard 23 (Accounting for Investments in Associates in Consolidated Financial Statements) and the jointly controlled<br />
entities accounted in accordance with Accounting Standard 27 (Financial Reporting of Interests in Joint Ventures) as notified under the<br />
Companies (Accounting Standards) Rules, 2006. These financial statements are the responsibility of the Company’s Management and<br />
have been prepared on the basis of the separate financial statements and other information regarding components. Our responsibility<br />
is to express an opinion on these Consolidated Financial Statements based on our audit.<br />
2. We conducted our audit in accordance with the auditing standards generally accepted in India. Those Standards require that we plan<br />
and perform the audit to obtain reasonable assurance about whether the financial statements are free of material misstatements. An<br />
audit includes examining, on a test basis, evidence supporting the amounts and the disclosures in the financial statements. An audit<br />
also includes assessing the accounting principles used and the significant estimates made by the Management, as well as evaluating<br />
the overall financial statement presentation. We believe that our audit provides a reasonable basis for our opinion.<br />
3. (a) Attention is invited to Note k (i) under Significant Accounting Policies. As stated in the note, the actuarial losses and restriction on<br />
pension assets (net) amounting to `3,998.70 crores have been accounted in “Reserves and Surplus” in respect of a group of subsidiary<br />
companies.<br />
(b) We did not audit the financial statements of certain subsidiaries, whose financial statements reflect total assets (net) of `12,959.17<br />
crores as at March 31, 20<strong>11</strong>, total revenues of `74,367.77 crores and net cash inflows amounting to `1,826.13 crores; and of certain<br />
associates whose financial statements reflect the Group’s share of profit of `31.95 crores for the year then ended and Group’s share<br />
of loss (net) of `16.30 crores up to March 31, 20<strong>11</strong>. These financial statements and other financial information have been audited<br />
by other auditors whose reports have been furnished to us by the Company’s Management, and our opinion in so far as it relates<br />
to the amounts included in respect of these subsidiaries and associates is based solely on the reports of the other auditors.<br />
(c) As stated in note [C(3)(a), C(1) and C(3)(b)] of Schedule 13, the financial statements of certain subsidiaries, whose financial statements<br />
reflect total assets (net) of `19.82 crores as at March 31, 20<strong>11</strong>, total revenues of `9.86 crores and net cash inflows amounting to<br />
`<strong>11</strong>.82 crores; the financial statements of a joint venture, whose financial statements reflect the Group’s share of total assets (net)<br />
of `454.54 crores as at March 31, 20<strong>11</strong>, total revenues of `1,914.54 crores and net cash inflows amounting to `103.52 crores and<br />
financial statements of certain associates, whose financial statements reflect the Group’s share of profit for the year ended March 31,<br />
20<strong>11</strong> of `14.71 crores and Group’s share of profit (net) of `155.69 crores upto March 31, 20<strong>11</strong>, are incorporated in the Consolidated<br />
Financial Statements based on management’s estimates and are not audited by their auditors.<br />
4. Subject to the matters referred to in paragraph 3(c) and read with our comments in paragraph 3(a) above:<br />
(a) we report that the Consolidated Financial Statements have been prepared by the Company’s management in accordance with the<br />
requirements of Accounting Standard 21 (Consolidated Financial Statements), Accounting Standard 23 (Accounting for Investment<br />
in Associates in Consolidated Financial Statements) and Accounting Standard 27 (Financial Reporting of Interests in Joint Ventures)<br />
as notified under the Companies (Accounting Standards) Rules, 2006;<br />
(b) based on our audit and on consideration of the separate audit reports on individual financial statements of the Company, its<br />
aforesaid subsidiaries, joint ventures and associates and to the best of our information and according to the explanations given<br />
to us, in our opinion, the Consolidated Financial Statements give a true and fair view in conformity with the accounting principles<br />
generally accepted in India:<br />
(i) in the case of the Consolidated Balance Sheet, of the state of affairs of the Group as at March 31, 20<strong>11</strong>;<br />
(ii) in the case of the Consolidated Profit and Loss Account, of the profit of the Group for the year ended on that date; and<br />
(iii) in the case of the Consolidated Cash Flow Statement, of the cash flows of the Group for the year ended on that date.<br />
For DELOITTE HASKINS & SELLS<br />
Chartered Accountants<br />
(Registration No. <strong>11</strong>7366W)<br />
MUMBAI, May 26, 20<strong>11</strong><br />
N. VENKATRAM<br />
Partner<br />
(Membership No.71387)<br />
105
Sixty-sixth annual report <strong>2010</strong>-20<strong>11</strong><br />
<strong>Tata</strong> <strong>Motors</strong> Limited<br />
Consolidated Balance Sheet as at March 31, 20<strong>11</strong><br />
(` in crores)<br />
As at<br />
March 31,<br />
SOURCES OF FUNDS Schedule Page <strong>2010</strong><br />
1. SHAREHOLDERS’ FUNDS<br />
(a) Share Capital 1 <strong>11</strong>2 637.71 570.60<br />
(b) Reserves and Surplus 2 <strong>11</strong>2 18,533.76 7,635.88<br />
19,171.47 8,206.48<br />
2. MINORITY INTEREST 246.60 213.51<br />
3. LOAN FUNDS<br />
(a) Secured 3 <strong>11</strong>4 19,927.13 21,290.03<br />
(b) Unsecured 4 <strong>11</strong>4 12,864.28 13,818.33<br />
32,791.41 35,108.36<br />
4. FOREIGN CURRENCY MONETARY ITEM<br />
TRANSLATION DIFFERENCE ACCOUNT (NET) - 191.15<br />
[Note A (1)] 124<br />
5. DEFERRED TAX LIABILITY 2,096.13 1,579.60<br />
[Note A (7) (a) & (b)] 124<br />
6. TOTAL 54,305.61 45,299.10<br />
APPLICATION OF FUNDS<br />
7. FIXED ASSETS 5 <strong>11</strong>5<br />
(a) Gross Block 71,462.93 63,822.80<br />
(b) Less - Depreciation 39,698.67 34,232.39<br />
(c) Net Block 31,764.26 29,590.41<br />
(d) Capital Work-in-Progress <strong>11</strong>,728.86 8,915.92<br />
43,493.12 38,506.33<br />
8. GOODWILL (On Consolidation) 125 3,584.79 3,422.87<br />
[Note A (8)]<br />
9. INVESTMENTS 6 <strong>11</strong>6 2,544.26 2,219.12<br />
10. DEFERRED TAX ASSETS 124 632.34 425.97<br />
[Note A (7) (a) & (b)]<br />
<strong>11</strong>. CURRENT ASSETS, LOANS AND ADVANCES<br />
(a) Interest accrued on investments 1.90 2.43<br />
(b) Inventories 7 <strong>11</strong>7 14,070.51 <strong>11</strong>,312.03<br />
(c) Sundry Debtors 8 <strong>11</strong>7 6,877.36 7,191.18<br />
(d) Cash and Bank Balances 9 <strong>11</strong>7 10,947.93 8,743.32<br />
(e) Loans and Advances 10 <strong>11</strong>8 19,137.22 15,196.68<br />
51,034.92 42,445.64<br />
12. CURRENT LIABILITIES AND PROVISIONS<br />
(a) Current Liabilities <strong>11</strong> <strong>11</strong>8 37,<strong>11</strong>4.65 34,077.33<br />
(b) Provisions 12 <strong>11</strong>8 9,869.17 7,643.50<br />
46,983.82 41,720.83<br />
13. NET CURRENT ASSETS [(<strong>11</strong>) LESS (12)] 4,051.10 724.81<br />
14 TOTAL 54,305.61 45,299.10<br />
15 BASIS OF CONSOLIDATION AND SIGNIFICANT<br />
ACCOUNTING POLICIES <strong>11</strong>9<br />
16 NOTES TO BALANCE SHEET 13 124<br />
As per our report attached<br />
For DELOITTE HASKINS & SELLS<br />
Chartered Accountants<br />
N VENKATRAM<br />
Partner<br />
RATAN N TATA<br />
Chairman<br />
RAVI KANT<br />
Vice-Chairman<br />
J J IRANI<br />
N N WADIA<br />
S M PALIA<br />
S BHARGAVA<br />
For and on behalf of the Board<br />
CARL- PETER FORSTER<br />
Managing Director & Group CEO<br />
P M TELANG<br />
Managing Director - India Operations<br />
N MUNJEE C RAMAKRISHNAN<br />
V K JAIRATH<br />
Chief Financial Officer<br />
R SEN<br />
R SPETH<br />
H K SETHNA<br />
Company Secretary<br />
Directors<br />
Mumbai, May 26, 20<strong>11</strong> Mumbai, May 26, 20<strong>11</strong><br />
106
Consolidated Profit and Loss Account for the year ended March 31, 20<strong>11</strong><br />
(` in crores )<br />
Schedule Page 2009-<strong>2010</strong><br />
INCOME<br />
1. Sale of Products and Other Income from Operations A (1) <strong>11</strong>0 1,27,419.62 95,567.42<br />
Less: Excise Duty 4,286.32 3,048.17<br />
1,23,133.30 92,519.25<br />
2. Dividend and Other Income A (2) <strong>11</strong>0 89.61 1,793.12<br />
1,23,222.91 94,312.37<br />
EXPENDITURE<br />
3. Manufacturing and Other Expenses B <strong>11</strong>1 1,<strong>11</strong>,094.58 88,483.51<br />
4. Expenditure Transferred to Capital and Other Accounts (5,741.25) (4,578.42)<br />
1,05,353.33 83,905.09<br />
PROFIT BEFORE DEPRECIATION, INTEREST, AMORTISATION,<br />
EXCEPTIONAL ITEMS AND TAX 17,869.58 10,407.28<br />
5. Product Development Expenses 962.49 498.20<br />
6. Depreciation/Amortisation 4,655.51 3,887.13<br />
7. Interest and Discounting Charges(net) [Note B (1)] 128 2,045.42 2,239.71<br />
PROFIT BEFORE EXCEPTIONAL ITEMS AND TAX 10,206.16 3,782.24<br />
8. (a) Exchange Gain (net) on Revaluation of Foreign Currency Borrowings,<br />
Deposits and Loans 231.01 84.47<br />
(b) Others - (344.07)<br />
PROFIT BEFORE TAX 10,437.17 3,522.64<br />
9. Tax Expense [Note A (7)(d)] 124 (1,216.38) (1,005.75)<br />
PROFIT AFTER TAX 9,220.79 2,516.89<br />
10. Share of Minority Interest (48.52) (30.33)<br />
<strong>11</strong>. Share of Profit in respect of Investments in Associate Companies 101.35 84.50<br />
PROFIT FOR THE YEAR 9,273.62 2,571.06<br />
12. Balance brought forward from Previous Year (1,017.85) (1,553.66)<br />
AMOUNT AVAILABLE FOR APPROPRIATION 8,255.77 1,017.40<br />
13. APPROPRIATIONS<br />
(a) Tax on Interim Dividend by subsidiaries (including Group’s share of subsidiaries’<br />
3.61 -<br />
dividend tax)<br />
(b) Proposed Dividend 1,274.23 859.05<br />
(c) Tax on Proposed Dividend (including Group’s share of subsidiaries’ dividend<br />
203.46 142.80<br />
tax)<br />
(d) Debenture Redemption Reserve - 500.00<br />
(e) General Reserve 228.78 520.32<br />
(f) Special Reserve 26.80 9.72<br />
(g) Earned Surplus Reserve 1.21 2.97<br />
(h) Restricted Reserve - 0.39<br />
(i) Reserve on Research and Human Resource Development 56.19 -<br />
(j) Balance carried to Balance Sheet 6,461.49 (1,017.85)<br />
8,255.77 1,017.40<br />
14. EARNINGS PER SHARE [Note B (3)] 132<br />
I. Ordinary Shares<br />
(a) Basic ` 155.25 48.64<br />
(b) Diluted ` 144.83 44.64<br />
II. ‘A’ Ordinary Shares<br />
(a) Basic ` 155.75 49.14<br />
(b) Diluted ` 145.33 45.14<br />
15. BASIS OF CONSOLIDATION AND SIGNIFICANT<br />
ACCOUNTING POLICIES <strong>11</strong>9<br />
16. NOTES TO PROFIT AND LOSS ACCOUNT 13 127<br />
As per our report attached<br />
For DELOITTE HASKINS & SELLS<br />
Chartered Accountants<br />
N VENKATRAM<br />
Partner<br />
RATAN N TATA<br />
Chairman<br />
RAVI KANT<br />
Vice-Chairman<br />
J J IRANI<br />
N N WADIA<br />
S M PALIA<br />
S BHARGAVA<br />
For and on behalf of the Board<br />
CARL- PETER FORSTER<br />
Managing Director & Group CEO<br />
P M TELANG<br />
Managing Director - India Operations<br />
N MUNJEE C RAMAKRISHNAN<br />
V K JAIRATH<br />
Chief Financial Officer<br />
R SEN<br />
R SPETH<br />
H K SETHNA<br />
Company Secretary<br />
Directors<br />
Mumbai, May 26, 20<strong>11</strong> Mumbai, May 26, 20<strong>11</strong><br />
107
Sixty-sixth annual report <strong>2010</strong>-20<strong>11</strong><br />
<strong>Tata</strong> <strong>Motors</strong> Limited<br />
Consolidated Cash Flow Statement for the year ended March 31, 20<strong>11</strong><br />
(` in crores)<br />
<strong>2010</strong>-20<strong>11</strong> 2009-<strong>2010</strong><br />
A. Cash flow from Operating Activities<br />
Profit for the year 9,273.62 2,571.06<br />
Adjustments for:<br />
Depreciation (including Lease Equalisation adjusted in income) 4,651.00 3,882.62<br />
Loss on sale of assets (including assets scrapped/written off) 21.96 74.48<br />
Relocation expenses 0.58 67.17<br />
Profit on sale of controlling stake in a subsidiary - (1,057.92)<br />
Profit on sale of investments (net) (17.35) (693.62)<br />
Impairment of goodwill 19.37 40.00<br />
Reversal of provision for inter corporate deposits (net) (8.02) (0.16)<br />
Gain on settlement of deferred sales tax liability (194.36) (143.95)<br />
Share of profit in respect of investments in associate companies (101.35) (84.50)<br />
Share of minority interest 48.52 30.33<br />
Tax expenses 1,216.38 1,005.75<br />
Interest / Dividend (net) 1,978.14 2,305.54<br />
Exchange difference (208.74) (448.90)<br />
Amortisation of Miscellaneous Expenditure / Employee Separation Cost - 77.59<br />
7,406.13 5,054.43<br />
Operating Profit before Working Capital Changes 16,679.75 7,625.49<br />
Adjustments for:<br />
Trade and other receivables (731.52) (4,342.63)<br />
Inventories (2,410.68) (1,244.53)<br />
Trade and other payables 1,447.95 8,709.<strong>11</strong><br />
(1,694.25) 3,121.95<br />
Vehicle loans and hire purchase receivables (2,354.15) (521.10)<br />
(4,048.40) 2,600.85<br />
Cash generated from Operations 12,631.35 10,226.34<br />
Direct Taxes Paid (net) (1,391.20) (1,229.21)<br />
Net Cash from Operating Activities <strong>11</strong>,240.15 8,997.13<br />
B. Cash Flow from Investing Activities<br />
Purchase of fixed assets (8,123.98) (8,475.43)<br />
Sale of fixed assets <strong>11</strong>.21 22.19<br />
Investments in associate companies (4.09) (1.44)<br />
Refund received against loan to associates 8.62 -<br />
Investments in Mutual funds made (32.14) (979.55)<br />
Investments in subsidiary companies (70.42) (56.30)<br />
Investments- others (<strong>11</strong>4.76) (10.14)<br />
Proceeds from Sale of stake in Telcon - 1,159.50<br />
Decrease in Investments in retained interests in securitisation transactions 4.52 51.38<br />
Sale/ redemption of investments-others 7.44 958.56<br />
Deposits of Margin Money / Cash Collateral (800.81) (613.95)<br />
Realisation of Margin Money / Cash Collateral 1,828.30 557.49<br />
Fixed deposits with scheduled banks made (1,091.00) (412.20)<br />
Fixed deposits with scheduled banks realised 890.33 2.15<br />
Increase/ (Decrease) in restricted deposits with scheduled banks 4.35 (7.08)<br />
Interest received 313.64 237.59<br />
Dividend received from associates 40.07 9.47<br />
Dividend / Income on investments received 57.75 31.51<br />
Increase/(Decrease) in short term Inter-corporate deposit 5.30 (6.80)<br />
Net Cash used in Investing Activities (7,065.67) (7,533.05)<br />
108
C. Cash Flow from Financing Activities<br />
Consolidated Cash Flow Statement for the year ended March 31, 20<strong>11</strong><br />
(` in crores)<br />
<strong>2010</strong>-20<strong>11</strong> 2009-<strong>2010</strong><br />
Expenses on Foreign Currency Convertible Notes (FCCN) conversion / Non-Convertible Debentures (3.59) (0.04)<br />
Brokerage and other expenses on Non-Convertible Debentures (NCD) (90.66) (150.75)<br />
Reimursement of expenses / (Expenses) incurred on issue of GDS and FCCN 0.51 (126.72)<br />
Proceeds from QIP issue (net of issue expenses) 3,249.80 -<br />
Proceeds from GDS issue (net of issue expenses) - 1,794.19<br />
Premium Paid on redemption of NCD (71.96) -<br />
Proceeds from issue of shares held in abeyance 3.08 0.05<br />
Proceeds from issue of shares by Joint venture - 17.68<br />
Proceeds from long term borrowings 5,413.62 26,857.49<br />
Repayment of long term borrowings (2,395.69) (20,917.40)<br />
Decrease in short term borrowings (net) (4,128.80) (3,445.50)<br />
Proceeds from Fixed Deposits 339.39 2,039.<strong>11</strong><br />
Repayment of Fixed Deposits (233.58) (75.96)<br />
Proceeds from issue of shares to minority shareholders 5.19 54.50<br />
Dividend paid (including Dividend Tax) (1,003.26) (346.24)<br />
Dividend paid to minority shareholders (16.27) (3.33)<br />
Interest paid [including discounting charges paid, ` 618.53 crores, (2009-<strong>2010</strong> ` 668.27 crores)] (2,469.07) (2,855.34)<br />
Net Cash/(used in)/ from Financing Activities (1,401.29) 2,841.74<br />
Net Increase in Cash and cash equivalents 2,773.19 4,305.82<br />
Cash and cash equivalents as at March 31 (Opening Balance) * # 6,529.96 2,381.60<br />
Add /(Less) : Cash and bank balance taken over on acquisition of stake in subsidiaries/joint ventures 2.47 3.41<br />
Add /(Less) : Cash and bank balance onsale of controlling stake of a subsidiary - (45.01)<br />
Add /(Less) : Translation adjustment on opening cash and bank balance of foreign subsidiaries 244.15 (60.67)<br />
Add /(Less) :Translation adjustment on reserves of foreign subsidiaries (0.49) (91.13)<br />
Add /(Less) : Exchange fluctuation on foreign currency bank balances 15.95 35.94<br />
Cash and cash equivalents as at March 31 (Closing Balance) * # 9,565.23 6,529.96<br />
* Excludes Cash Collateral ` 759.09 crores (as at March 31, <strong>2010</strong> ` 1,786.07 crores, as at March 31, 2009 ` 1,729.58<br />
crores)<br />
# Excludes Fixed / restricted deposits with scheduled banks ` 623.61 crores (as at March 31, <strong>2010</strong> ` 427.29 crores, as at March 31, 2009 ` 10.16 crores)<br />
Previous period’s /year’s figures have been restated, wherever necessary, to conform to this period’s / year’s classification.<br />
As per our report attached<br />
For DELOITTE HASKINS & SELLS<br />
Chartered Accountants<br />
N VENKATRAM<br />
Partner<br />
RATAN N TATA<br />
Chairman<br />
RAVI KANT<br />
Vice-Chairman<br />
J J IRANI<br />
N N WADIA<br />
S M PALIA<br />
S BHARGAVA<br />
For and on behalf of the Board<br />
CARL- PETER FORSTER<br />
Managing Director & Group CEO<br />
P M TELANG<br />
Managing Director - India Operations<br />
N MUNJEE C RAMAKRISHNAN<br />
V K JAIRATH<br />
Chief Financial Officer<br />
R SEN<br />
R SPETH<br />
H K SETHNA<br />
Company Secretary<br />
Directors<br />
Mumbai, May 26, 20<strong>11</strong> Mumbai, May 26, 20<strong>11</strong><br />
109
Sixty-sixth annual report <strong>2010</strong>-20<strong>11</strong><br />
<strong>Tata</strong> <strong>Motors</strong> Limited<br />
Schedules forming part of the Consolidated Profit and Loss Account<br />
(` in crores)<br />
“A” [Item no. 1 & 2]<br />
<strong>2010</strong>-20<strong>11</strong> 2009-<strong>2010</strong><br />
SALE OF PRODUCTS AND OTHER INCOME<br />
1. Sale of products and other income from operations<br />
(a) Sale of products / Services (Note 1 below) 1,25,244.28 93,6<strong>11</strong>.20<br />
(b) Income from Vehicle loan contracts (Note 2 below) 1,468.23 1,330.42<br />
Sales / Income from Operations 1,26,712.51 94,941.62<br />
(c) Other operating income 707.<strong>11</strong> 625.80<br />
1,27,419.62 95,567.42<br />
2. Dividend and other income (Note 3 below) 89.61 1,793.12<br />
1,27,509.23 97,360.54<br />
<strong>2010</strong>-20<strong>11</strong> 2009-<strong>2010</strong><br />
Notes: (1) Sale of products / Services includes :<br />
(i) Exchange gain (net) 61.42 106.24<br />
(ii) Net of variable marketing expenses of some subsidiaries 5,373.71 5,308.87<br />
(2) Income from Vehicle Loan contracts includes :<br />
(i) Income on securitisation / sale of receivables of Loan contracts (net) 75.56 151.33<br />
(ii) Interest income on Loan contracts (net) 1,264.94 1,098.32<br />
(3) Dividend and other income includes :<br />
(i) Profit on sale of current investments 17.35 693.62<br />
(ii) Profit on sale of controlling stake in a subsidiary - 1,057.92<br />
<strong>11</strong>0
Schedules forming part of the Consolidated Profit and Loss Account<br />
(` in crores)<br />
“B” [Item no. 3]<br />
<strong>2010</strong>-20<strong>11</strong> 2009-<strong>2010</strong><br />
MANUFACTURING AND OTHER EXPENSES<br />
1. Purchase of products for sale, etc. 10,390.84 8,538.52<br />
2. Consumption of raw materials and components 70,453.73 54,105.54<br />
3. Processing charges 1,172.48 878.99<br />
4. Payments to and provision for employees:<br />
(a) Salaries, wages and bonus 7,476.15 6,865.82<br />
(b) Contribution to provident and other funds 877.13 1,0<strong>11</strong>.66<br />
(c) Workmen and staff welfare expenses 989.39 874.29<br />
9,342.67 8,751.77<br />
5. Expenses for manufacture, administration and selling:<br />
(a) Stores, spare parts and tools consumed 1,189.24 1,050.61<br />
(b) Freight, transportation, port charges etc. 2,436.93 2,050.44<br />
(c) Repairs to buildings 69.85 57.05<br />
(d) Repairs to plant, machinery etc. 228.45 278.13<br />
(e) Power and fuel 851.60 689.45<br />
(f) Rent 104.72 106.71<br />
(g) Rates and taxes 192.58 181.63<br />
(h) Insurance 161.71 161.92<br />
(i) Publicity 4,089.95 2,974.18<br />
(j) Incentive / Commission to dealers 868.13 595.57<br />
(k) Works operation and other expenses ( Note 1 below ) <strong>11</strong>,238.84 9,124.72<br />
21,432.00 17,270.41<br />
6. Excise duty on change in Stock-in-trade 139.05 86.95<br />
7. Change in Stock-in-trade and Work-in-progress:<br />
A. Opening Stock<br />
(i) Work-in-progress 998.46 1,044.02<br />
(ii) Stock-in-trade 8,223.90 7,572.56<br />
9,222.36 8,616.58<br />
Stock acquired on acquisitions<br />
(i) Work-in-progress - 5.89<br />
(ii) Stock-in-trade - 30.56<br />
- 36.45<br />
Translation difference 363.69 (331.57)<br />
Sale of controlling stake in a subsidiary<br />
(i) Work-in-progress - 32.97<br />
(ii) Stock-in-trade - 214.80<br />
- 247.77<br />
B. Closing Stock<br />
(i) Work-in-progress 1,122.98 998.46<br />
(ii) Stock-in-trade 10,299.26 8,223.90<br />
<strong>11</strong>,422.24 9,222.36<br />
(1,836.19) (1,148.67)<br />
1,<strong>11</strong>,094.58 88,483.51<br />
<strong>2010</strong>-20<strong>11</strong> 2009-<strong>2010</strong><br />
Notes : (1) Works operation and other expenses include:<br />
(i) Warranty and product liability expenses 2,927.68 2,524.70<br />
(ii) Computer Expenses 881.06 592.91<br />
(iii) Lease rentals in respect of plant and machinery, buildings and equipment <strong>11</strong>7.62 <strong>11</strong>8.56<br />
(iv) Provision and write off of sundry debtors, vehicle loans and advances (net) 548.25 786.88<br />
(v) Reversal towards residual risk on vehicles sold (224.92) (439.20)<br />
(vi) Exchange Gain (78.06) (665.89)<br />
(vii) Loss on sale of assets <strong>11</strong>.96 29.29<br />
(viii) Loss on assets scrapped / written off 4.10 45.19<br />
<strong>11</strong>1
Sixty-sixth annual report <strong>2010</strong>-20<strong>11</strong><br />
<strong>Tata</strong> <strong>Motors</strong> Limited<br />
Schedules forming part of the Consolidated Balance Sheet<br />
(` in crores)<br />
“1” [Item no.1(a)]<br />
As at<br />
As at<br />
March 31, March 31,<br />
SHARE CAPITAL 20<strong>11</strong> <strong>2010</strong><br />
Authorised:<br />
70,00,00,000 Ordinary shares of `10 each (As at March 31, <strong>2010</strong>: 70,00,00,000 shares) 700.00 700.00<br />
20,00,00,000 ‘A’ Ordinary shares of ` 10 each (As at March 31, <strong>2010</strong>: 20,00,00,000 shares) 200.00 200.00<br />
30,00,00,000 Convertible Cumulative Preference shares of `100 each 3,000.00 3,000.00<br />
(As at March 31, <strong>2010</strong>: 30,00,00,000 shares)<br />
3,900.00 3,900.00<br />
Issued and subscribed:<br />
53,82,72,284 Ordinary shares of ` 10 each fully paid (As at March 31, <strong>2010</strong>: 50,63,81,170 shares) 538.27 506.38<br />
9,63,41,706 ‘A’ Ordinary shares of ` 10 each fully paid (As at March 31, <strong>2010</strong>: 6,41,76,374 shares) 96.34 64.18<br />
634.61 570.56<br />
Less: Calls in arrears - Ordinary Shares 0.01 0.01<br />
634.60 570.55<br />
Share Forfeiture - Ordinary Shares 0.05 0.05<br />
Amount received in respect of Ordinary shares pending allotment 3.06 -<br />
637.71 570.60<br />
“2” [Item no.1(b)]<br />
As at<br />
As at<br />
March 31, Deductions/ March 31,<br />
RESERVES AND SURPLUS <strong>2010</strong> Additions Adjustments 20<strong>11</strong><br />
(a) Securities Premium Account [Note (i) and (ii) Page <strong>11</strong>3] 6,714.59 4,829.80 193.71 <strong>11</strong>,350.68<br />
5,366.31 3,293.74 1,945.46 6,714.59<br />
(b) Capital Redemption Reserve 2.28 - - 2.28<br />
2.28 - - 2.28<br />
(c) Capital Reserve (on consolidation) [Note (iii) Page <strong>11</strong>3] 358.89 8.41 - 367.30<br />
336.01 22.88 - 358.89<br />
(d) Debenture Redemption Reserve 1,102.15 - - 1,102.15<br />
602.15 500.00 - 1,102.15<br />
(e) Amalgamation Reserve 0.05 - - 0.05<br />
0.05 - - 0.05<br />
(f) Special Reserve 68.96 26.80 - 95.76<br />
<strong>11</strong>4.29 9.72 55.05 68.96<br />
(g) Revaluation Reserve [Note (iv) Page <strong>11</strong>3] 185.73 - 41.10 144.63<br />
<strong>11</strong>0.75 75.42 0.44 185.73<br />
(h) Hedging Reserve Account - 208.76 - 208.76<br />
(87.51) 87.51 - -<br />
(i) Pension Reserve [Note (v) Page <strong>11</strong>3] (1,722.61) - 2,276.09 (3,998.70)<br />
(1,457.21) 481.33 746.73 (1,722.61)<br />
(j) General Reserve [Note (vi) Page <strong>11</strong>3] 4,582.91 234.48 - 4,817.39<br />
4,075.18 575.37 67.64 4,582.91<br />
(k) Earned Surplus Reserve [Note (vii) Page <strong>11</strong>3] 10.62 1.21 - <strong>11</strong>.83<br />
7.65 2.97 - 10.62<br />
(l) Reserve on Research and Human Resource Development 99.69 56.19 - 155.88<br />
99.69 - - 99.69<br />
(m) Restricted Reserve 0.39 - - 0.39<br />
- 0.39 - 0.39<br />
(n) Translation Reserve [Note (viii) Page <strong>11</strong>3] (2,749.92) 563.79 - (2,186.13)<br />
(2,189.39) - 560.53 (2,749.92)<br />
8,653.73 5,929.44 2,510.90 12,072.27<br />
6,980.25 5,049.33 3,375.85 8,653.73<br />
(o) Profit and Loss Account 6,461.49<br />
(1,017.85)<br />
18,533.76<br />
7,635.88<br />
<strong>11</strong>2
Schedules forming part of the Consolidated Balance Sheet<br />
(` in crores)<br />
“2” [Item no.1(b)] (contd)<br />
Notes: <strong>2010</strong>-20<strong>11</strong> 2009-<strong>2010</strong><br />
Additions Deductions Additions Deductions<br />
(i) The opening and closing balances of Securities Premium Account are<br />
net of calls in arrears of ` 0.03 crore<br />
(ii) Changes in Securities Premium Account :<br />
(a) Premium on shares issued on conversion of Foreign Currency<br />
Convertible Notes (FCCN) (including premium on shares issued<br />
which were held in abeyance out of Rights issue of shares) 1,466.70 - 1,529.<strong>11</strong> -<br />
(b) FCCN Conversion expenses - 3.59 - 25.57<br />
(c) Premium on issue of shares through Qualified Institutional<br />
3,310.52 - - -<br />
Placement (QIP)<br />
(d) QIP issue expenses - 101.21 - -<br />
(e) Premium on issue of Global Depository Shares (GDS) - - 1,764.28 -<br />
(f) Recovery of expenses/ Expenses on issue of GDS and FCCN 0.51 - - 126.82<br />
(g) Brokerage, stamp duty and other fees on Non-Convertible<br />
- 88.89 - 140.40<br />
Debentures [net of tax ` 1.77 crores (2009-<strong>2010</strong> ` Nil )]<br />
(h) Premium on redemption of Debentures / FCCN /Convertible<br />
Alternative Reference Securities (CARS) (net)(including exchange<br />
differences and withholding tax) [net of tax ` 139.99 crores<br />
(2009-<strong>2010</strong> ` 61.33 crores)] 52.07 - - 1,652.67<br />
(i) Others - 0.02 0.35 -<br />
4,829.80 193.71 3,293.74 1,945.46<br />
(iii) The addition to Capital Reserve represents exchange gain (net) of<br />
` 8.41 crores (2009-<strong>2010</strong> ` 22.88 crores) on opening balances in<br />
respect of foreign subsidiaries.<br />
(iv) Changes in Revaluation Reserve :<br />
(a) Depreciation on revalued portion of assets taken over on<br />
- 0.44 - 0.44<br />
amalgamation of a company<br />
(b) Revaluation of Jaguar and Land Rover assets - - 75.42 -<br />
(c) Depreciation on revalued portion of Jaguar and Land Rover assets - 40.66 - -<br />
- 41.10 75.42 0.44<br />
(v) Change in Pension Reserve : (Refer Note k(i), page 122)<br />
(a) Actuarial Losses - 1,387.42 - 644.60<br />
(b) Movement in restriction of pension assets - 888.67 481.33 -<br />
(c) Foreign Currency Translation - - - 102.13<br />
- 2,276.09 481.33 746.73<br />
(vi) Changes in General Reserve :<br />
(a) Amount recovered/paid (net) towards indemnity relating to<br />
0.28 - - 4.72<br />
business amalgamated in prior year<br />
(b) Impact of amount written off by an associate against Securities<br />
- - - 24.96<br />
Premium Account<br />
(c) Impact of amount written back by a subsidiary against Securities<br />
5.42 - - 37.96<br />
Premium Account<br />
(d) Amount transferred from Special Reserve - - 55.05 -<br />
(e) Amount transferred from Profit and loss account 228.78 - 520.32 -<br />
234.48 - 575.37 67.64<br />
(vii) <strong>Tata</strong> Daewoo Commercial Vehicle Company Ltd. (TDCV) under the Korean Commercial Code is required to appropriate annually at least 10% of cash<br />
dividend declared each year to a legal reserve until such reserve equals 50% of capital stock of TDCV. This reserve may not be utilized for cash dividends but<br />
may only be used to off-set against future deficit, if any, or may be transferred to capital stock of TDCV.<br />
(viii) Translation Reserves represents conversion of balances in functional currency of foreign subsidiaries (net of minority share) and associates.(Note<br />
2(f)(i) (3), page 121)<br />
(ix) Profit and Loss Account balance is after considering the proportionate share of post acquisition loss of ` 607.19 crores (as at March 31, <strong>2010</strong><br />
` 484.31 crores) of the Joint Venture, Fiat India Automobiles Ltd and ` 2.16 crores (as at March 31, <strong>2010</strong> ` 1.86 crores) of the Joint Venture, <strong>Tata</strong> HAL<br />
Technologies Ltd. (Note (c) (1), Page 133).<br />
<strong>11</strong>3
Sixty-sixth annual report <strong>2010</strong>-20<strong>11</strong><br />
<strong>Tata</strong> <strong>Motors</strong> Limited<br />
Schedules forming part of the Consolidated Balance Sheet<br />
“3” [Item no.3 (a)] (` in crores)<br />
As at<br />
As at<br />
March 31, March 31,<br />
20<strong>11</strong> <strong>2010</strong><br />
LOANS - Secured<br />
(a) Privately placed Non - Convertible Debentures 5,225.00 5,417.20<br />
(b) Loans from Financial Institutions / Banks 3,<strong>11</strong>6.97 1,951.43<br />
(c) From Banks:<br />
(i) Buyers line of credit (long term) 488.10 619.97<br />
(ii) Loans, Cash Credit, Overdraft Accounts and Buyers line of credit (short term) 7,891.86 10,468.34<br />
(iii) Other Loans* 3,205.20 2,833.09<br />
19,927.13 21,290.03<br />
* Includes Loan from European Investment Bank 2,415.72 2,300.79<br />
“4” [Item no.3(b)]<br />
As at<br />
As at<br />
March 31, March 31,<br />
20<strong>11</strong> <strong>2010</strong><br />
LOANS - Unsecured<br />
(a) Loans from Banks 3,152.04 3,007.39<br />
(b) Commercial Paper 2,432.03 2,841.00<br />
(c) Inter Corporate Deposit / Call Deposit 57.00 94.00<br />
(d) Foreign Currency Convertible Notes (FCCN) / Convertible Alternative Reference Securities<br />
(CARS) 2,636.60 4,161.86<br />
(e) Fixed Deposits:<br />
(i) From Public 2,435.51 2,333.05<br />
(ii) From Shareholders 856.84 840.40<br />
(f) Privately placed Non - Convertible Debentures 899.95 288.95<br />
(g) Subordinated Perpetual Debentures 150.00 -<br />
(h) Loans from others 244.31 251.68<br />
12,864.28 13,818.33<br />
<strong>11</strong>4
FIXED ASSETS Cost as at<br />
March 31,<br />
<strong>2010</strong><br />
Schedules forming part of the Consolidated Balance Sheet<br />
Acquisitions Additions /<br />
Adjustments<br />
[Note (ii)]<br />
Translation<br />
Adjustment<br />
Deductions/<br />
Adjustments<br />
Cost as at<br />
March 31,<br />
20<strong>11</strong><br />
Depreciation<br />
for the<br />
period Note<br />
(vi)]<br />
Accumulated<br />
Depreciation<br />
on<br />
acquisitions<br />
during the<br />
period [Note<br />
(iii)]<br />
Translation<br />
Adjustment-<br />
Accumulated<br />
Depreciation<br />
Accumulated<br />
Depreciation<br />
up to March<br />
31, 20<strong>11</strong><br />
[Note (iii)<br />
and (vi) ]<br />
(` in crores)<br />
“5” [Item No. 7]<br />
Net Book<br />
Value as at<br />
March 31,<br />
20<strong>11</strong><br />
(a) Land and Lease Hold Land 1,748.76 - 24.67 47.84 2.48 1,818.79 9.58 - 1.02 46.33 1,772.46<br />
1,440.25 - 465.26 (48.82) 107.93 1,748.76 14.48 - (9.19) 35.69 1,713.07<br />
(b) Buildings 6,932.66 - 615.90 226.49 24.68 7,750.37 165.33 - 161.27 3,946.04 3,804.33<br />
7,063.65 - 612.88 (285.37) 458.50 6,932.66 168.27 - (154.05) 3,644.34 3,288.32<br />
(c) Plant, Machinery and Equipment 43,237.44 2.50 4,146.41 1,401.43 453.29 48,334.49 2,874.96 0.82 1,086.31 31,524.06 16,810.43<br />
[Note (i)] 42,137.49 77.67 4,254.50 (1,882.96) 1,349.26 43,237.44 2,794.93 63.19 (1,581.46) 27,953.64 15,283.80<br />
(d) Furniture, Fixtures and 426.52 0.01 79.21 8.99 49.59 465.14 55.94 - 9.90 308.80 156.34<br />
Office Appliances 479.58 5.28 69.98 (47.66) 80.66 426.52 57.23 4.88 (38.53) 283.96 142.56<br />
[Note (i)]<br />
(e) Technical Know how 36.87 - 0.83 - 0.41 37.29 0.81 - - 26.29 <strong>11</strong>.00<br />
38.56 - 1.77 0.07 3.53 36.87 <strong>11</strong>.98 - - 26.29 10.58<br />
(f) Vehicles and Transport 169.49 - 107.87 2.48 23.87 255.97 38.36 - 1.08 122.53 133.44<br />
[Note (i)] 179.39 - 26.58 0.30 36.78 169.49 21.91 - (0.02) 99.82 69.67<br />
(g) Assets taken on Lease 155.12 0.30 14.80 0.29 23.59 146.92 22.77 0.26 0.07 78.42 68.50<br />
[Note (v)] 174.15 - 4.68 1.49 25.20 155.12 26.34 - 0.54 77.77 77.35<br />
(h) Assets given on Lease 398.96 - - - - 398.96 4.86 - - 382.24 16.72<br />
4<strong>11</strong>.50 - - 1.91 14.45 398.96 4.86 - - 381.90 17.06<br />
(i) Product Development Cost 5,785.27 0.01 908.52 142.16 7.55 6,828.41 1,056.57 0.01 26.33 1,948.45 4,879.96<br />
1,552.75 58.93 4,526.91 (346.07) 7.25 5,785.27 592.41 49.72 (46.69) 857.06 4,928.21<br />
(j) Trade Marks and Brand 2,706.53 - - 135.20 - 2,841.73 - - - - 2,841.73<br />
2,889.47 - - (182.94) - 2,706.53 - - - - 2,706.53<br />
(k) Developed Technologies 859.72 - - 39.07 - 898.79 101.07 - 7.59 259.30 639.49<br />
946.91 0.09 - (38.71) 48.57 859.72 73.23 - (<strong>11</strong>.82) 150.00 709.72<br />
(l) Software 1,365.46 3.00 313.13 53.04 48.56 1,686.07 325.23 1.91 26.42 1,056.21 629.86<br />
974.56 6.48 516.07 (109.59) 22.06 1,365.46 121.49 5.73 (32.97) 721.92 643.54<br />
Total 63,822.80 5.82 6,2<strong>11</strong>.34 2,056.99 634.02 71,462.93 4,655.48 3.00 1,319.99 39,698.67 31,764.26<br />
58,288.26 148.45 10,478.63 (2,938.35) 2,154.19 63,822.80 3,887.13 123.52 (1,874.19) 34,232.39 29,590.41<br />
(m) Capital Work In progress <strong>11</strong>,728.86<br />
[Note (iv)] 8,915.92<br />
43,493.12<br />
38,506.33<br />
Notes:<br />
(i) Includes Plant, Machinery and Equipment, Furniture, Fixtures and Office Appliances and Vehicles and Transport having Gross block of ` 296.08 crores, ` 0.67 crore and ` 0.58 crores<br />
(as at March 31, <strong>2010</strong> `165.40 crores, ` 0.73 crore and ` 0.57 crore) and net block of ` 6.78 crores, ` 0.02 crore and ` 0.02 crore (as at March 31, <strong>2010</strong> ` 5.21 crores, ` 0.02 crore and<br />
` 0.13 crore) respectively, held for disposal.<br />
(ii) Additions / Adjustments include :<br />
(a) capitalisation of exchange Loss (net of loss on derivative contract) of ` 53.49 crores (2009-<strong>2010</strong> decapitalisation of exchange gain of ` 308.48 crores).<br />
(b) Deletion / Adjustments includes value of ` Nil due to sale of controlling stake in Telco Construction Equipment Company Limited. (as at March 31, <strong>2010</strong> ` 838.74 crores)<br />
(iii) Accumulated Depreciation includes :<br />
(a) an adjustment of ` 543.87 crores (as at March 31, <strong>2010</strong> ` 726.00 crores) on Assets transferred/sold/discarded during the year.<br />
(b) lease equalisation of ` 4.51 crores (as at March 31, <strong>2010</strong> ` 4.51 crores) adjusted in lease rental income.<br />
(c) depreciation of ` 41.10 crores (2009-<strong>2010</strong> ` 51.63 crores) on revalued portion of gross block transferred / credited to Revaluation Reserve.<br />
(d) an adjustment of ` Nil ( as at March 31, <strong>2010</strong> ` 261.16 crores) due to sale of controlling stake in Telco Construction Equipment Company Ltd.<br />
(iv) Capital Work in Progress includes :<br />
(a) Product Development Cost ` 9,212.25 crores (as at March 31, <strong>2010</strong> ` 4,910.07 crores).<br />
(b) advances for capital expenditure of ` 272.06 crores (as at March 31, <strong>2010</strong> ` 294.31 crores).<br />
(c) exchange loss of ` <strong>11</strong>.58 crores (as at March 31, <strong>2010</strong> Exchange loss of ` 58.55 crores).<br />
(v) The Plant and Equipment taken on lease are under renewable secondary lease.<br />
(vi) Depreciation for the year/accumulated depreciation includes amortization, diminution in value of assets and write down of assets net of reversals.<br />
<strong>11</strong>5
Sixty-sixth annual report <strong>2010</strong>-20<strong>11</strong><br />
<strong>Tata</strong> <strong>Motors</strong> Limited<br />
Schedules forming part of the Consolidated Balance Sheet<br />
“6” [Item no. 9] (` in crores)<br />
As at<br />
As at<br />
INVESTMENTS (at cost) March 31, March 31,<br />
20<strong>11</strong> <strong>2010</strong><br />
(A) In Associates<br />
(a) Carrying amount of investments in Associates (Note 7 below) 664.64 584.25<br />
(b) Fully paid Cumulative Redeemable Preference shares (Unquoted) 21.00 21.00<br />
(B) Others<br />
(I) Long Term Investments<br />
Quoted<br />
(a) Fully paid Ordinary/Equity shares 285.64 275.61<br />
(b) Bonds 2.44 2.38<br />
(II)<br />
Unquoted<br />
(a) Fully paid Ordinary/Equity shares 344.00 231.26<br />
(b) Fully paid Cumulative Redeemable Preference Shares 12.00 12.00<br />
(c) Non Convertible Debentures 5.00 5.75<br />
(d) Optionally Convertible Debentures 8.04 9.61<br />
(e) Bonds - 6.15<br />
(f) Retained interest in securitisation transactions 0.81 5.33<br />
Current Investments<br />
Quoted<br />
(a) Fully paid Ordinary/Equity shares 6.49 6.47<br />
(b) Investment in Securities 0.02 0.02<br />
Unquoted<br />
(a) Fully paid Cumulative Redeemable Preference Shares 3.00 3.00<br />
(b) Mutual Fund 1,122.67 1,064.62<br />
(c) Fully paid Ordinary/Equity shares ( Note 6 below) 76.60 -<br />
2,552.35<br />
2,227.45<br />
Less: Provision for diminution in value of Investments (net)<br />
8.09<br />
8.33<br />
2,544.26 2,219.12<br />
Notes:<br />
(1) Book value of quoted investments (other than in associates) 294.59 284.48<br />
(2) Book value of unquoted investments (other than in associates) 1,564.04 1,329.39<br />
(3) Market value of quoted investments (other than in associates) 364.56 360.85<br />
(4) Investment in Mutual funds reinvested - 8.08<br />
(5) As per the shareholders agreement dated March 30, <strong>2010</strong>, between Hitachi Construction Machinery Co. Ltd and the Company, Shares of Telcon<br />
Construction Equipment Company Limited owned by the Company are under restriction for sale, assign or transfer for a period of three years from<br />
the date of the agreement.<br />
(6) One of the subsidiary company has exercised its right to transfer equity shares which were held as collateral towards trade receivables.The shares<br />
are in process of being sold.<br />
(7) The particulars of investments in associate companies as of March 31, 20<strong>11</strong> are as follows:<br />
Sr.<br />
No.<br />
Name of the Associates<br />
Country of<br />
Incorporation<br />
Ownership Interest<br />
(%)<br />
Original Cost of<br />
Investment **<br />
Amount of<br />
Goodwill/<br />
(Capital Reserve) in<br />
Original Cost<br />
Share of post<br />
acquisition<br />
Reserves and<br />
Surplus<br />
Carrying<br />
amount of<br />
Investments<br />
1) <strong>Tata</strong> Cummins Ltd. India 50.00 90.00 - 155.09 245.09<br />
50.00 90.00 - <strong>11</strong>9.20 209.20<br />
2) <strong>Tata</strong> AutoComp Systems Ltd. India 26.00 77.47 - (22.97) 54.50<br />
26.00 77.47 - (50.72) 26.75<br />
3) NITA Company Ltd. Bangladesh 40.00 1.27 (0.43) 6.67 7.94<br />
40.00 1.27 (0.43) 3.01 4.28<br />
4) <strong>Tata</strong> Precision Industries Pte. Ltd. Singapore - - - - -<br />
(Upto Feburary 15, 20<strong>11</strong>,thereafter subsidiary) 49.99 3.<strong>11</strong> - (3.<strong>11</strong>) * -<br />
5) Automobile Corporation of Goa Ltd. India 44.21 103.76 54.01 16.95 120.71<br />
42.37 99.67 52.78 7.71 107.38<br />
6) Jaguar Cars Finance Ltd UK 49.90 0.51 - - 0.51<br />
49.90 0.51 - - 0.51<br />
7) Telco Construction Equipment Company Ltd. India 40.00 80.20 0.20 155.69 235.89<br />
40.00 80.20 0.20 155.93 236.13<br />
Total 353.21 53.78 3<strong>11</strong>.43 664.64<br />
352.23 52.55 232.02 584.25<br />
* Share of loss restricted to the original cost of Investment as per the equity method of accounting for associates under AS -23 ‘Accounting for Investments in Associates<br />
in Consolidated Financial Statements’.<br />
<strong>11</strong>6
Schedules forming part of the Consolidated Balance Sheet<br />
(` in crores)<br />
“7” [Item no.<strong>11</strong> (b)]<br />
As at As at<br />
March 31,<br />
20<strong>11</strong><br />
March 31,<br />
<strong>2010</strong><br />
INVENTORIES<br />
(a) Stores and spare parts (at or below cost) 172.36 221.52<br />
(b) Consumable tools (at cost) 68.30 66.56<br />
(c) Raw materials and components 1,964.57 1,381.67<br />
(d) Work-in-progress 1,122.98 998.46<br />
(e) Stock-in-trade 10,299.26 8,223.90<br />
(f) Goods-in-transit (at cost) 443.04 419.92<br />
14,070.51 <strong>11</strong>,312.03<br />
Note: Items (c), (d) and (e) above are valued at lower of cost and net realisable value.<br />
“8” [Item no. <strong>11</strong> (c)]<br />
As at As at<br />
March 31,<br />
20<strong>11</strong><br />
March 31,<br />
<strong>2010</strong><br />
SUNDRY DEBTORS<br />
(a) Over six months : (unsecured) 946.16 242.35<br />
(b) Others : (unsecured) 6,167.97 7,209.46<br />
7,<strong>11</strong>4.13 7,451.81<br />
Less: Provision for doubtful debts 236.77 260.63<br />
6,877.36 7,191.18<br />
“9” [Item no. <strong>11</strong> (d)]<br />
As at As at<br />
March 31,<br />
20<strong>11</strong><br />
March 31,<br />
<strong>2010</strong><br />
CASH AND BANK BALANCES<br />
(a) Cash on hand 24.61 32.54<br />
(b) Current accounts with Banks # 3,604.68 2,784.44<br />
(c) Deposits with Banks * 6,559.55 4,140.27<br />
(d) Margin Money / Cash Collateral with Scheduled Banks 759.09 1,786.07<br />
10,947.93 8,743.32<br />
# Includes :<br />
Cheques on hand 231.55 264.90<br />
Remittances in transit 386.34 398.06<br />
* Includes unutilised proceeds from Qualified Institutional Placement issue 505.00 -<br />
Restricted deposits 623.61 427.29<br />
<strong>11</strong>7
Sixty-sixth annual report <strong>2010</strong>-20<strong>11</strong><br />
<strong>Tata</strong> <strong>Motors</strong> Limited<br />
Schedules forming part of the Consolidated Balance Sheet<br />
(` in crores)<br />
“10” [Item no. <strong>11</strong> (e)] As at As at<br />
March 31,<br />
20<strong>11</strong><br />
March 31,<br />
<strong>2010</strong><br />
LOANS AND ADVANCES<br />
(A) SECURED<br />
Vehicle loans (Note 1 and 2 below) 10,859.83 8,466.50<br />
Less: Provision for doubtful loans (Note 3 below) 847.32 808.14<br />
Total (A) 10,012.51 7,658.36<br />
(B) UNSECURED - considered good<br />
(a) Claims / incentive recoverable, advances / loans to suppliers, contractors,<br />
employees and others, rent deposits and other amount due (Notes 4 to 6 below) 3,090.30 2,379.43<br />
(b) Loan to Joint Venture and Associates[net of provision of ` Nil (as at March 31, <strong>2010</strong> ` 8.03 crores)] 132.50 132.50<br />
(c) Deposits with government, public bodies and others 3,107.50 2,562.94<br />
(d) Prepaid expenses 749.44 928.95<br />
(e) Income tax refundable (net of provision) (Note 7 below) 2,044.97 1,534.50<br />
Total (B) 9,124.71 7,538.32<br />
Total (A) and (B) 19,137.22 15,196.68<br />
Notes: (1) Loans are secured against hypothecation of vehicles<br />
(2) Includes on account of overdue Securitised Receivables 477.41 681.32<br />
(3) Includes on account of Securitised Receivables 272.62 322.00<br />
(4) Net of advances considered doubtful which have been provided for 62.70 64.68<br />
(5) Includes amount due from customers in respect of contract works 61.55 45.09<br />
(6) UK and other pension Plan (net) 6.71 2.98<br />
(7) Includes MAT credit entitlement 1,158.16 731.80<br />
“<strong>11</strong>” [Item no. 12 (a)]<br />
As at<br />
March 31,<br />
20<strong>11</strong><br />
As at<br />
March 31,<br />
<strong>2010</strong><br />
CURRENT LIABILITIES<br />
(a) Acceptances 5,389.03 7,184.29<br />
(b) Sundry creditors 26,684.78 21,982.32<br />
(c) Liabilities for buyback arrangement 867.80 915.57<br />
(d) Advance and progress payments 1,967.20 1,981.80<br />
(e) Liability towards premium on redemption of Non-Convertible Debentures 1,673.83 1,745.79<br />
(f) Interest / commitment charges accrued on loans but not due 508.17 232.72<br />
(g) Liability towards Investors Education and Protection Fund under<br />
Section 205C of the Companies Act, 1956 not due 23.84 34.84<br />
37,<strong>11</strong>4.65 34,077.33<br />
“12” [Item no. 12 (b)] As at As at<br />
March 31,<br />
20<strong>11</strong><br />
March 31,<br />
<strong>2010</strong><br />
PROVISIONS<br />
(a) Proposed dividends 1,274.23 859.05<br />
(b) Provision for tax on dividends 205.20 144.66<br />
(c) Provision for Income tax (net of payments) 506.90 358.06<br />
(d) Provision for retirement and other employee benefit schemes [Note B(2),page 129,130 &131] 2,747.93 1,297.15<br />
(e) Provisions for Redemption of Foreign Currency Convertible Notes (FCCN) and Convertible Alternative<br />
Reference Securities( CARS) [Note B(4),page 132] 801.09 993.15<br />
(f) Provision for Warranty and product liability [Note B(4),page 132] 4,126.19 3,743.37<br />
(g) Other provisions [Note B(4),page 132] 207.63 248.06<br />
9,869.17 7,643.50<br />
<strong>11</strong>8
Schedules forming part of the Consolidated Balance Sheet and Profit and Loss Account<br />
Basis of Consolidation and Significant Accounting Policies<br />
(1) Basis of Consolidation:<br />
The consolidated financial statements relate to <strong>Tata</strong> <strong>Motors</strong> Limited (the Company), its subsidiary companies, joint ventures and associates. The Company and its<br />
subsidiaries constitute the Group.<br />
a) Basis of Accounting:<br />
I. The financial statements of the subsidiary companies / joint ventures used in the consolidation are drawn upto the same reporting date as of the Company<br />
i.e. year ended March 31, 20<strong>11</strong>.<br />
II.<br />
The financial statements of the Group have been prepared in accordance with the Accounting Standards issued by the Institute of Chartered Accountants of<br />
India / notified under the Companies (Accounting Standards) Rules, 2006 and other generally accepted accounting principles in India.<br />
b) Basis of preparation:<br />
The financial statements are prepared under the historical cost convention on an accrual basis of accounting in accordance with the generally accepted accounting<br />
principles, Accounting Standards notified under Section 2<strong>11</strong> (3C) of the Companies Act, 1956 and the relevant provisions thereof.<br />
c) Use of estimates:<br />
The preparation of financial statements requires management to make judgments, estimates and assumptions, that affect the application of accounting policies<br />
and the reported amounts of assets and liabilities and disclosures of contingent liabilities at the date of these financial statements and the reported amounts of<br />
revenues and expenses for the years presented. Actual results may differ from these estimates. Estimates and underlying assumptions are reviewed on an ongoing<br />
basis. Revisions to accounting estimates are recognised in the year in which the estimate is revised and future years affected.<br />
d) Principles of consolidation:<br />
The consolidated financial statements have been prepared on the following basis:<br />
I. The financial statements of the Company and its subsidiary companies have been combined on a line-by-line basis by adding together like items of assets,<br />
liabilities, income and expenses. The intra-group balances and intra-group transactions and unrealised profits or losses have been fully eliminated.<br />
II. The consolidated financial statements include the share of profit / loss of the associate companies which has been accounted as per the ‘Equity method’, and<br />
accordingly, the share of profit / loss of each of the associate companies (the loss being restricted to the cost of investment) has been added to / deducted<br />
from the cost of investments.<br />
An associate is an enterprise in which the investor has significant influence and which is neither a Subsidiary nor a joint venture of the investor.<br />
III. The financial statements of the joint venture companies have been combined by using proportionate consolidation method and accordingly, venturer’s<br />
share of each of the assets, liabilities, income and expenses of jointly controlled entity is reported as separate line items in the Consolidated Financial<br />
Statements. (Note C (1), Page 133)<br />
IV. The excess of cost to the Company of its investments in the subsidiary companies / joint ventures over its share of equity of the subsidiary companies /<br />
joint ventures, at the dates on which the investments in the subsidiary companies / joint ventures are made, is recognised as ‘Goodwill’ being an asset in<br />
the consolidated financial statements. Alternatively, where the share of equity in the subsidiary companies / joint ventures as on the date of investment is<br />
in excess of cost of investment of the Company, it is recognised as ‘Capital Reserve’ and shown under the head ‘Reserves and Surplus’, in the consolidated<br />
financial statements.<br />
V. Minority interest in the net assets of consolidated subsidiaries consists of the amount of equity attributable to the minority shareholders at the dates on<br />
which investments are made by the Company in the subsidiary companies and further movements in their share in the equity, subsequent to the dates of<br />
investments as stated above.<br />
e) The following subsidiary companies are considered in the consolidated financial statements:<br />
Sr<br />
No.<br />
Country of<br />
incorporation<br />
% of holding either directly<br />
or through subsidiaries as<br />
at March 31,<br />
20<strong>11</strong> <strong>2010</strong><br />
Name of the Subsidiary Company<br />
Direct Subsidiaries<br />
1 <strong>Tata</strong> Daewoo Commercial Vehicle Co. Ltd. South Korea 100 100<br />
2 HV Axles Ltd. India 85 85<br />
3 HV Transmissions Ltd. India 85 85<br />
4 TAL Manufacturing Solutions Ltd. India 100 100<br />
5 Sheba Properties Ltd. India 100 100<br />
6 Concorde <strong>Motors</strong> (India) Ltd. India 100 100<br />
7 <strong>Tata</strong> <strong>Motors</strong> Insurance Broking & Advisory Services Ltd India 100 100<br />
8 <strong>Tata</strong> <strong>Motors</strong> European Technical Centre Plc. UK 100 100<br />
9 <strong>Tata</strong> Technologies Ltd. India 83.38 81.36<br />
10 <strong>Tata</strong> <strong>Motors</strong> Finance Ltd. India 100 100<br />
<strong>11</strong> <strong>Tata</strong> Marcopolo <strong>Motors</strong> Ltd. India 51 51<br />
12 <strong>Tata</strong> <strong>Motors</strong> (Thailand) Ltd. Thailand 86.78 86.78<br />
13 TML Holdings Pte Ltd, Singapore Singapore 100 100<br />
14 TML Distribution Company Ltd. India 100 100<br />
15 <strong>Tata</strong> <strong>Motors</strong> (SA) (Proprietary) Ltd. South Africa 60 60<br />
16 <strong>Tata</strong> Hispano <strong>Motors</strong> Carrocera S.A Spain 100 100<br />
17 Trilix S.r.l (w.ef. September 29, <strong>2010</strong>) Italy 80 -<br />
18 <strong>Tata</strong> Precision Industries Pte Ltd (w.e.f February 15, 20<strong>11</strong>) Singapore 78.39 -<br />
Indirect Subsidiaries **<br />
19 <strong>Tata</strong> Technologies (Thailand) Ltd Thailand 83.38 81.36<br />
20 <strong>Tata</strong> Technologies Pte. Ltd. Singapore 83.38 81.36<br />
21 INCAT International PLC. UK 83.38 81.36<br />
22 <strong>Tata</strong> Technologies Europe Ltd UK 83.38 81.36<br />
<strong>11</strong>9
Sixty-sixth annual report <strong>2010</strong>-20<strong>11</strong><br />
<strong>Tata</strong> <strong>Motors</strong> Limited<br />
Basis of Consolidation and Significant Accounting Policies (contd.)<br />
Sr<br />
Country of<br />
% of holding either directly<br />
or through subsidiaries as<br />
at March 31,<br />
No. Name of the Subsidiary Company<br />
incorporation<br />
20<strong>11</strong> <strong>2010</strong><br />
23 INCAT SAS (Liquidated w.e.f April 30,<strong>2010</strong> ) France - 81.36<br />
24 INCAT GmbH. Germany 83.38 81.36<br />
25 <strong>Tata</strong> Technologies Inc USA 83.51 81.50<br />
26 <strong>Tata</strong> Technologies de Mexico, S.A. de C.V. Mexico 83.51 81.50<br />
27 <strong>Tata</strong> Technologies Canada Inc. Canada 83.51 81.50<br />
28 Miljobil Greenland AS Norway 71.69 71.69<br />
29 JaguarLandRover Ltd Plc ( formely known as JaguarLandRover Ltd) UK 100 100<br />
30 Jaguar Cars Overseas Holdings Ltd UK 100 100<br />
31 Jaguar Land Rover Austria GmbH Austria 100 100<br />
32 Jaguar Belux NV Belgium 100 100<br />
33 Jaguar Cars Ltd UK 100 100<br />
34 Jaguar Land Rover Japan Ltd Japan 100 100<br />
35 Jaguar Cars South Africa (pty) Ltd South Africa 100 100<br />
36 Jaguar Italia SpA Italy 100 100<br />
37 Jaguar Cars Exports Ltd UK 100 100<br />
38 The Daimler Motor Company Ltd UK 100 100<br />
39 The Jaguar Collection Ltd UK 100 100<br />
40 Daimler Transport Vehicles Ltd UK 100 100<br />
41 S.S. Cars Ltd UK 100 100<br />
42 The Lanchester Motor Company Ltd UK 100 100<br />
43 Jaguar Hispania Sociedad Spain 100 100<br />
44 Jaguar Deutschland GmbH Germany 100 100<br />
45 Land Rover UK 100 100<br />
46 Land Rover Group Ltd Jersey 100 100<br />
47 Jaguar Land Rover North America LLC USA 100 100<br />
48 Land Rover Belux SA/NV Belgium 100 100<br />
49 Land Rover Ireland Ltd Ireland 100 100<br />
50 Jaguar Land Rover Nederland BV Netherlands 100 100<br />
51 Jaguar Land Rover Portugal - Veiculos e Pecas, LDA Portugal 100 100<br />
52 Jaguar Land Rover Australia Pty Ltd Australia 100 100<br />
53 Land Rover Exports Ltd UK 100 100<br />
54 Land Rover Italia SpA Italy 100 100<br />
55 Land Rover Espana SL Spain 100 100<br />
56 Land Rover Deutschland GmbH Germany 100 100<br />
57 Jaguar Land Rover Mexico SA de CV (Upto July 12, <strong>2010</strong>) Mexico – 100<br />
58 Jaguar Land Rover Korea Co. Ltd South Korea 100 100<br />
59 Jaguar Land Rover Automotive Trading (Shanghai) Co. Ltd China 100 100<br />
60 Jaguar Land Rover Canada ULC Canada 100 100<br />
61 Jaguar Land Rover France, SAS France 100 100<br />
62 Jaguar Land Rover South Africa (pty) Ltd South Africa 100 100<br />
63 Jaguar Land Rover Brazil LLC Brazil 100 100<br />
64 Limited Liability Company “Jaguar Land Rover” (Russia) Russia 100 100<br />
65 Land Rover Parts Ltd UK 100 100<br />
66 Land Rover Parts US LLC USA 100 100<br />
67 <strong>Tata</strong> Hispano <strong>Motors</strong> Crrosseries Hispano Maghreb (formely known as Crrosseries Hispano Maghreb, Morroco) Spain 100 100<br />
68 <strong>Tata</strong> Daewoo Commercial Vehicle Sales and Distribution Co. Ltd. South Korea 100 -<br />
(Incorporated on April 9, <strong>2010</strong>)<br />
69 <strong>Tata</strong> Engineering Services (Pte) Ltd Singapore 78.39 -<br />
(w.e.f February 15, 20<strong>11</strong>)<br />
** Effective holding % of the Company directly and through its subsidiaries.<br />
The following Joint Venture companies are considered in the consolidated financial statements:<br />
Sr.<br />
No. Name of the Joint Venture Company<br />
Country of<br />
incorporation<br />
% of holding as at<br />
March 31<br />
20<strong>11</strong> <strong>2010</strong><br />
1 Fiat India Automobiles Limited India 50.00 50.00<br />
2 <strong>Tata</strong> HAL Technologies Ltd India 41.69 * 40.68<br />
* Effective holding % of the Company as it is a Joint Venture of <strong>Tata</strong> Technologies Ltd<br />
(2) Significant Accounting Policies :<br />
(a) Revenue Recognition<br />
(i) Sale of products<br />
The Company recognises revenue on the sale of products,net of discounts, when the products are delivered to the dealer / customer or when delivered to the carrier for exports sales,<br />
which is when risks and rewards of ownership pass to the dealer / customer. Sales include income from services, transfer of technology relating to automotive products and exchange<br />
fluctuations relating to export receivables. Sales include export and other recurring and non-recurring incentives from the Government at the national and state levels. Sale of products<br />
is presented gross of excise duty where applicable, and net of other indirect taxes. Discount and variable marketing expenses pertaining to Jaguar and Land Rover group are netted<br />
off against sales. Revenues are recognised when collectibility of the resulting receivables is reasonably assured.<br />
(ii) Revenue from sale of vehicles with guaranteed repurchase option /repurchase arrangement<br />
Some of the subsidiary companies sell vehicles to daily rental car companies and other fleet customers subject to guaranteed repurchase options and to Ford Motor Group<br />
management employees, with repurchase arrangements. At the time of sale, the proceeds are recorded as deferred revenue in current liabilities and the cost of the vehicles are<br />
recorded as inventories. The difference between the proceeds and the guaranteed repurchase amount is recognised in Sales over the term of the arrangement, using a straight-line<br />
method. The difference between the cost of the vehicle and the estimated auction value is netted off against revenue over the term of the lease.<br />
(iii) Revenue from software consultancy on time and materials contracts is recognised based on certification of time sheet and billed to clients as per the terms of specific contracts. On<br />
fixed price contracts, revenue is recognised based on milestone achieved as specified in the contracts on the proportionate completion method on the basis of the work completed.<br />
Foreseeable losses on such contracts are recognized when probable. Revenue from rendering annual maintenance services is recognised proportionately over the period in which<br />
services are rendered. Revenue from third party software products and hardware sale is recognised upon delivery.<br />
(iv) Dividend from investments is recognized when the right to receive the payment is established and when no significant uncertainty as to measurability or collectability exits.<br />
(v) Interest income is recognized on the time basis determined by the amount outstanding and the rate applicable and where no significant uncertainty as to measurability or collectability<br />
exists.<br />
120
(b)<br />
(c)<br />
(d)<br />
(e)<br />
(f)<br />
Basis of Consolidation and Significant Accounting Policies (contd.)<br />
Depreciation and Amortisation<br />
i) Depreciation is provided on straight line method basis (SLM) over the estimated useful lives of the assets. Estimated useful<br />
lives of assets are as follows:<br />
Type of Asset<br />
Estimated useful life<br />
Leasehold Land<br />
amortised over the period of the lease<br />
Factory Building<br />
20 to 40 years<br />
Plant and Equipment<br />
9 to 30 years<br />
Computers<br />
3 to 6 years<br />
Vehicles<br />
3 to 10 years<br />
Furniture and Fixtures<br />
3 to 20 years<br />
Technical know-how<br />
2 to 10 years<br />
Developed Technologies<br />
10 years<br />
Software<br />
1 to 8 years<br />
Special tools are amortised on a straight line basis over the lives of the model concerned, which is 7 to 10 years.<br />
Capital assets, the ownership of which does not vest with the Company, other than leased assets, are depreciated over the estimated period of their utility or five years, whichever is less.<br />
ii) Product development cost are amortised over a period of 36 months to 120 months or on the basis of actual production to planned production volume over such period.<br />
iii) In respect of assets whose useful life has been revised, the unamortised depreciable amount has been charged over the revised remaining useful life.<br />
iv) Depreciation is not recorded on capital work-in-progress until construction and installation are complete and asset is ready for its intended use. Capital-work-in-progress includes capital advances.<br />
Fixed Assets<br />
(i) Fixed assets are stated at cost of acquisition or construction less accumulated depreciation / amortisation.<br />
(ii) The product development cost incurred on new vehicle platform, engines, transmission and new products are recognised as fixed assets, when feasibility has been established, the Company<br />
has committed technical, financial and other resources to complete the development and it is probable that asset will generate probable future benefits.<br />
(iii) Cost includes purchase price, taxes and duties, labour cost and directly attributable costs for self constructed assets and other direct costs incurred upto the date the asset is ready for its<br />
intended use. Borrowing cost incurred for qualifying assets is capitalised up to the date the asset is ready for intended use, based on borrowings incurred specifically for financing the asset or<br />
the weighted average rate of all other borrowings, if no specific borrowings have been incurred for the asset. The cost of acquisition is further adjusted for exchange differences relating to long<br />
term foreign currency borrowings attributable to the acquisition of depreciable asset w.e.f. April 1, 2007.<br />
(iv) Software not exceeding Rs. 25,000 and product development costs relating to minor product enhancements, facelifts and upgrades are charged off to the Profit and Loss Account as and<br />
when incurred.<br />
Impairment<br />
At each balance sheet date, the Company assesses whether there is any indication that the fixed assets have suffered an impairment loss. If any such indication exists, the recoverable amount of the<br />
asset is estimated in order to determine the extent of the impairment, if any. Where it is not possible to estimate the recoverable amount of individual asset, the Company estimates the recoverable<br />
amount of the cash-generating unit to which the asset belongs. As per the assessment conducted by the Company at March 31, 20<strong>11</strong>, there were no indications that the fixed assets have suffered an<br />
impairment loss.<br />
Leases<br />
(i) Finance Lease<br />
Assets acquired under finance leases are recognised at the lower of the fair value of the leased assets at inception and the present value of minimum lease payments. Lease payments are<br />
apportioned between the finance charge and the outstanding liability. The finance charge is allocated to periods during the lease term at a constant periodic rate of interest on the remaining<br />
balance of the liability. Assets given under finance leases except for those stated in (b)(ii) above, are recognised as receivables at an amount equal to the net investment in the lease and the<br />
finance income is based on a constant rate of return on the outstanding net investment.<br />
(ii) Operating Lease<br />
Leases other than finance lease ,are operating leases and the leased assets are not recognised on the Company’s balancesheet. Payments under operating leases are recognised in the Profit<br />
and Loss account on a straight line basis over the lease term.<br />
Accounting of Transactions in Foreign Currencies<br />
(i) Exchange differences<br />
Transactions in foreign currencies are recorded at the exchange rates prevailing on the date of the transaction. Foreign currency monetary assets and liabilities are translated at year end<br />
exchange rates.<br />
(1) Exchange differences arising on settlement of transactions and translation of monetary items other than those covered by (2) below are recognised as income or expense in the year<br />
in which they arise. Exchange differences considered as borrowing cost are capitalised to the extent these relate to the acquisition / construction of qualifying assets and the balance amount<br />
is recognised in the Profit & Loss account.<br />
(2) Exchange differences relating to long term foreign currency monetary assets / liabilities are accounted for with effect from April 1, 2007 in the following manner:<br />
- Differences relating to borrowings attributable to the acquisition of the depreciable capital asset are added to / deducted from the cost of such capital assets.<br />
- Other differences are accumulated in Foreign Currency Monetary Item Translation Difference Account, to be amortised over the period, beginning April 1, 2007 or date of inception of<br />
such item, as applicable, and ending on March 31, 20<strong>11</strong> or the date of its maturity, whichever is earlier.<br />
(3) On consolidation, the assets, liabilities and goodwill or capital reserve arising on the acquisition, of the Group’s overseas operations are translated at exchange rates prevailing on<br />
the balance sheet date. Income and expenditure items are translated at the average exchange rates for the year/month. Exchange differences arising in case of Integral Foreign operations<br />
are recognised in the Profit and Loss account and Exchange differences arising in case of Non integral Foreign Operations are recognised in the Group’s Translation Reserve classified under<br />
Reserves and Surplus.<br />
(ii) Hedge accounting<br />
The Company uses foreign currency forward contracts to hedge its risks associated with foreign currency fluctuations relating to highly probable forecast transactions. With effect from<br />
April 1, 2008, the Company designates such forward contracts in a cash flow hedging relationship by applying the hedge accounting principles set out in Accounting Standard 30- Financial<br />
Instruments: Recognition and Measurement.<br />
These forward contracts are stated at fair value at each reporting date. Changes in the fair value of these forward contracts that are designated and effective as hedges of future cash flows are<br />
recognised directly in Hedging Reserve Account under Reserves and Surplus, net of applicable deferred income taxes and the ineffective portion is recognised immediately in the Profit and<br />
Loss account.<br />
Amounts accumulated in Hedging Reserve Account are reclassified to profit and loss in the same periods during which the forecasted transaction affects profit and loss.<br />
Hedge accounting is discontinued when the hedging instrument expires or is sold, terminated, or exercised, or no longer qualifies for hedge accounting. For forecasted transactions, any<br />
cumulative gain or loss on the hedging instrument recognised in Hedging Reserve Account is retained there until the forecasted transaction occurs.<br />
If the forecasted transaction is no longer expected to occur, the net cumulative gain or loss recognised in Hedging Reserve Account is immediately transferred to the Profit and Loss account<br />
for the period.<br />
(iii) Premium or discount on forward contracts other than those covered in (ii) above is amortised over the life of such contracts and is recognised as income and expense. Foreign currency options<br />
and other derivatives are stated at fair value as at the year end with change in fair value recognised in the Profit & Loss Account.<br />
121
Sixty-sixth annual report <strong>2010</strong>-20<strong>11</strong><br />
<strong>Tata</strong> <strong>Motors</strong> Limited<br />
(g)<br />
Product Warranty Expenses<br />
Basis of Consolidation and Significant Accounting Policies (contd.)<br />
The estimated liability for product warranties is recorded when products are sold. These estimates are established using historical information on the nature, frequency and average cost of<br />
warranty claims and management estimates regarding possible future incidence based on corrective actions on product failures. The timing of outflows will vary as and when warranty claim<br />
will arise - being typically upto five years.<br />
(h)<br />
Income on Vehicle Loan / Hire-Purchase Income / Finance Income from Lease<br />
Interest income from hire purchase and loan contracts and finance income in respect of vehicles and income from plant given on lease, are accounted for by using the Internal Rate of Return<br />
method. Consequently, a constant rate of return on the net outstanding amount is accrued over the period of contract. The Company and its subsidiary provides an allowance for hire purchase<br />
and loan receivables that are in arrears for more than <strong>11</strong> months, to the extent of an amount equivalent to the outstanding principal and amounts due but unpaid considering probable<br />
inherent loss including estimated realisation based on past performance trends. In respect of loan contracts that are in arrears for more than 6 months but not more than <strong>11</strong> months, allowance<br />
is provided to the extent of 10% of the outstanding and amount due but unpaid.<br />
(i)<br />
Sale of Vehicle Loans<br />
The Company and its subsidiary sells Vehicle Loans to Special Purpose Entities (“SPE”) in securitisation transactions. Recourse is in the form of the Company and its subsidiary’s investment in<br />
subordinated securities issued by these special purpose entities, cash collateral and bank guarantees. The loans are derecognised in the balance sheet when they are sold and consideration<br />
has been received by the Company and its subsidiary. Sales and transfers that do not meet the criteria for surrender of control are accounted for as secured borrowings.<br />
Gains or losses from the sale of loans are recognised in the period the sale occurs based on the relative fair value of the portion sold and the portion allocated to retained interests, except for<br />
subsidiaries which are governed by prudential norms for income recognition issued by the Reserve Bank of India for Non Banking Financial Companies (NBFC), where gains or losses on sale<br />
are accounted for as per these norms.<br />
In case of a subsidiary, the estimated liability for servicing expenses in respect of assigned receivables is made based on the ratio between the cost incurred for servicing current receivables<br />
and the collection made during the year.<br />
(j)<br />
Inventories<br />
Inventories are valued at the lower of cost and net realisable value. Cost of raw materials and consumables are ascertained on a moving weighted average / monthly moving weighted average<br />
basis, except for Jaguar and Land Rover which is on FIFO basis. Cost, including variable and fixed overheads, are allocated to work-in-progress and stock-in-trade determined on full absorption<br />
cost basis. Net realisable value is estimated selling price in the ordinary course of business less estimated cost of completion and selling expenses.<br />
(k)<br />
Employee Benefits<br />
i) Pension Plans<br />
One of the major subsidiary group, Jaguar Land Rover, operates several defined benefit pension plan, which are contracted out of the second state pension scheme. The assets of the<br />
plan are held in separate trustee administered funds. The plans provide for monthly pension after retirement as per salary drawn and service period as set out in rules of each fund.<br />
Contributions to the plans by the subsidiary group take into consideration the results of actuarial valuations. The plans with a surplus position at the year end have been limited to the<br />
maximum economic benefit available from unconditional rights to refund from the scheme or reduction in future contributions. Where the subsidiary group is considered to have a<br />
contractual obligation to fund the pension plan above the accounting value of the liabilities, an onerous obligation is recognised.<br />
The actuarial losses (net) of ` 3,998.70 crores of pension plans of Jaguar Cars Ltd and Land Rover,UK, have been accounted in “Reserves and Surplus” in the consolidated financial<br />
statements in accordance with IFRS principles and permitted by AS21.<br />
A separate defined contribution plan is available to employees of a major subsidiary group, Jaguar Land Rover. Costs in respect of this plan are charged to the statement of operations<br />
as incurred.<br />
ii)<br />
Gratuity<br />
The Company and some of its subsidiaries in India have an obligation towards gratuity, a defined benefit retirement plan covering eligible employees. The plan provides for a lump<br />
sum payment to vested employees at retirement, death while in employment or on termination of employment of an amount equivalent to 15 to 30 days salary payable for each<br />
completed year of service. Vesting occurs upon completion of five years of service. The Company and the said subsidiaries make annual contributions to gratuity funds established as<br />
trusts. Some subsidiaries have obtained insurance policies with the Life Insurance Corporation of India. The Company and some of its subsidiaries account for the liability for gratuity<br />
benefits payable in future based on an independent actuarial valuation.<br />
iii)<br />
Superannuation<br />
The Company and some of its subsidiaries have two superannuation plans, a defined benefit plan and a defined contribution plan. An eligible employee on April 1, 1996 could elect<br />
to be a member of either plan.<br />
Employees who are members of the defined benefit superannuation plan are entitled to benefits depending on the years of service and salary drawn. The monthly pension benefits<br />
after retirement range from 0.75% to 2% of the annual basic salary for each year of service. The Company and the said subsidiaries account for superannuation benefits payable in<br />
future under the plan based on an independent actuarial valuation.<br />
With effect from April 1, 2003, this plan was amended and benefits earned by covered employees have been protected as at March 31, 2003. Employees covered by this plan are<br />
prospectively entitled to benefits computed on a basis that ensures that the annual cost of providing the pension benefits would not exceed 15% of salary.<br />
The Company and some of its subsidiaries maintain separate irrevocable trusts for employees covered and entitled to benefits. The Company and its subsidiaries contributes up to<br />
15% of the eligible employees’ salary to the trust every year. Such contributions are recognised as an expense when incurred. The Company and the said subsidiaries have no further<br />
obligation beyond this contribution.<br />
iv)<br />
Bhavishya Kalyan Yojana (BKY)<br />
Bhavishya Kalyan Yojana is an unfunded defined benefit plan. The benefits of the plan include pension in certain case, payable upto the date of normal superannuation had the<br />
employee been in service, to an eligible employee at the time of death or permanent disablement, while in service, either as a result of an injury or as certified by the Company’s<br />
Medical Board. The monthly payment to dependents of the deceased / disabled employee under the plan equals 50% of the salary drawn at the time of death or accident or a specified<br />
amount, whichever is higher. The Company accounts for the liability for BKY benefits payable in future based on an independent actuarial valuation.<br />
v) Severance indemnity<br />
<strong>Tata</strong> Daewoo Commercial Vehicle Company Limited, TDCV and <strong>Tata</strong> Daewoo Commercial Vehicle Service Company Limited, a subsidiary company incorporated in Korea has an<br />
obligation towards severance indemnity, a defined benefit retirement plan, covering eligible employees. The plan provides for a lump sum payment to all employees with more than<br />
one year of employment equivalent to 30 days’ salary payable for each completed year of service.<br />
122
vi)<br />
Basis of Consolidation and Significant Accounting Policies (contd.)<br />
Post-retirement Medicare Scheme<br />
Under this scheme, employees of the Company and some of its subsidiaries get medical benefits subject to certain limits of amount, periods after retirement and types of benefits,<br />
depending on their grade and location at the time of retirement. Employees separated from the Company as part of Early Separation Scheme, on medical grounds or due to permanent<br />
disablement are also covered under the scheme. The Company and the said subsidiaries account for the liability for post-retirement medical scheme based on an independent<br />
actuarial valuation.<br />
vii)<br />
Provident fund and family pension<br />
The eligible employees of the Company and some of its subsidiaries are entitled to receive benefits in respect of provident fund, a defined contribution plan, in which both employees<br />
and the company/subsidiaries make monthly/annual contributions at a specified percentage of the covered employees’ salary (currently 12% of employees’ salary). The contributions,<br />
as specified under the law, are made to the provident fund and pension fund set up as irrevocable trust by the Company and its subsidiaries or to respective Regional Provident Fund<br />
Commissioner and the Central Provident Fund under the State Pension scheme. The Company and some of its subsidiaries are generally liable for monthly/annual contributions and<br />
any shortfall in the fund assets based on the government specified minimum rates of return or pension and recognises such contributions and shortfall, if any, as an expense in the<br />
year incurred.<br />
viii)<br />
Compensated absences<br />
l) Investments<br />
The Company and some of its subsidiaries provides for the encashment of leave or leave with pay subject to certain rules. The employees are entitled to accumulate leave subject<br />
to certain limits, for future encashment. The liability is provided based on the number of days of unutilized leave at each balance sheet date on basis of an independent actuarial<br />
valuation.<br />
i. Long term investments are stated at cost less other than temporary diminution in value, if any.<br />
ii.<br />
iii.<br />
Investment in associate companies are accounted as per the ‘Equity method’, and accordingly, the share of post acquisition reserves of each of the associate companies has been added<br />
to / deducted from the cost of investments.<br />
Current investments are stated at lower of cost and fair value. Fair value of investments in mutual funds are determined on portfolio basis.<br />
m) Income Tax Expenses<br />
Income tax expenses comprises current and deferred taxes. Current taxes are determined based on respective taxable income of each taxable entity and tax rules applicable for respective tax<br />
jurisdictions. Current tax is net of credit for entitlement for Minimum Alternative tax.<br />
Deferred tax is recognised, on timing differences, being the difference between taxable income and accounting income that originate in one period and are capable of reversal in one or more<br />
subsequent periods.Deferred tax assets in respect of unabsorbed depreciation and carry forward of losses are recognised if there is virtual certainty that there will be sufficient future taxable<br />
income available to realise such losses.Such deferred tax assets and liabilities are computed separately for each taxable entity and for each taxable jurisdiction.<br />
Deferred tax assets and liabilities are measured based on the tax rates that are expected to apply in the period when asset is realised or the liability is settled, based on tax rates and tax laws<br />
that have been enacted or substantially enacted by the balance sheet date.<br />
n) Issue expenses / Redemption premium / discount on Foreign Currency Convertible Notes (FCCN) / Convertible Alternative Reference Securities (CARS) / Non Convertible Debentures<br />
(NCD)<br />
Issue expenses and premium payable on redemption of FCCN / CARS / NCD as per the terms of issue, is provided fully in the year of issue by adjusting against the Securities Premium<br />
Account (SPA). Any change in the premium payable, consequent to conversion or exchange fluctuations is adjusted to the SPA. Discount on redemption of FCCN, if any, will be recognised on<br />
redemption.<br />
o) Borrowing costs<br />
Fees towards structuring / arrangements and underwriting and other incidental costs incurred in connection with borrowings are amortised over the period of the loan.<br />
123
Sixty-sixth annual report <strong>2010</strong>-20<strong>11</strong><br />
<strong>Tata</strong> <strong>Motors</strong> Limited<br />
Schedules forming part of the Consolidated Balance Sheet and Profit and Loss Account<br />
“13” [Item no. 16] (` in crores)<br />
(A) Notes to Balance Sheet<br />
As at<br />
As at<br />
(1) Foreign Currency Monetary Item Translation Difference Account (Item 4 , Page 106) March 31,<br />
20<strong>11</strong><br />
March 31,<br />
<strong>2010</strong><br />
Opening Balance [loss/(gain)] (191.15) 636.48<br />
(a) Exchange loss/(gain) during the year (83.90) (613.08)<br />
(b) Amortisation of exchange fluctuation for the year 275.05 (214.55)<br />
Closing Balance [gain] - (191.15)<br />
As at<br />
March 31,<br />
20<strong>11</strong><br />
As at<br />
March 31,<br />
<strong>2010</strong><br />
(2) (a) Claims not acknowledged as debts 1,807.28 1,039.81<br />
(b) Provision not made for income tax matters in dispute 452.05 425.38<br />
(3) The claims / liabilities in respect of excise duty, sales tax and other matters where the issues were decided in favour of the Company for which<br />
department is in further appeal 133.82 39.54<br />
(4) Estimated amount of contracts remaining to be executed on capital account and not provided for 5,025.31 2,720.87<br />
(5) Other money for which the Company is contingently liable:<br />
(a) In respect of bills discounted and export sales on deferred credit 181.46 3.49<br />
(b) The Company has given guarantees for liability in respect of receivables assigned by way of securitisation 3,416.43 2,970.56<br />
(c) Cash Margin / Collateral 731.93 1,779.91<br />
(d) In respect of retained interest in securitisation transactions 0.81 1.32<br />
(e) In respect of subordinated receivables 69.91 139.30<br />
(f) Inter corporate deposits placed as collateral security - 20.00<br />
(g) Others 93.09 55.19<br />
(6) Concorde <strong>Motors</strong> (India) Limited (CMIL), a subsidiary company acquired certain immovable properties pursuant to a scheme of Arrangement in the year 2004. Stamp duty is payable on conveyance<br />
of properties in favour of CMIL.The stamp duty adjudication order has been passed by District Registrar (DUS) for Bangalore property fixing the market value of the immovable property situated<br />
at Bangalore as on the date of acquisition at `<strong>11</strong>.65 crores on which Stamp duty @ 7% amounting to ` 0.82 crore has been paid by CMIL during the year 2007-08 and has been capitalised under<br />
Land & Building. CMIL is in the process of completing similar formalities in respect of the Hyderabad Property that was acquired by CMIL pursuant to the scheme referred above . It is not possible<br />
to quantify the amount of duty payable, and adjustments, as and when effected, will be carried out to the cost of land and building relating the property at Hyderabad.<br />
(7) (a) Major components of deferred tax arising on account of timing differences are: As at As at<br />
March 31,<br />
20<strong>11</strong><br />
March 31,<br />
<strong>2010</strong><br />
Liabilities:<br />
Depreciation (1,271.81) (1,085.26)<br />
Intangibles (1,375.52) (1,<strong>11</strong>4.80)<br />
Product development cost and Reserves for Research and Development Expenses (1,545.93) (1,332.47)<br />
Others (30.17) (20.69)<br />
(4,223.43) (3,553.22)<br />
Assets:<br />
Depreciation 1,376.50 1,092.07<br />
Unabsorbed depreciation/ business loss 301.98 315.56<br />
Employee benefits / Expenses allowable on payment basis 543.75 315.58<br />
Provision for doubtful debts 346.53 327.51<br />
Premium on redemption of CARS (net of exchange fluctuation on premium) <strong>11</strong>1.13 251.<strong>11</strong><br />
Others 79.75 97.76<br />
2,759.64 2,399.59<br />
Net Deferred Tax Liability (1,463.79) (1,153.63)<br />
(b) Classified on a company wise basis :<br />
As at As at<br />
March 31,<br />
March 31,<br />
20<strong>11</strong><br />
<strong>2010</strong><br />
(i) Deferred Tax Asset 632.34 425.97<br />
(ii) Deferred Tax Liability (2,096.13) (1,579.60)<br />
Net Deferred Tax Liability (1,463.79) (1,153.63)<br />
<strong>2010</strong>-20<strong>11</strong> 2009-<strong>2010</strong><br />
(c) Deferred Tax (charge) / credit for the year<br />
Opening net Deferred Tax Liability 1,153.63 680.21<br />
Debited/(Credited) to Securities Premium Account 138.22 8.31<br />
Debited /(Credited) to Hedging Reserve - 45.06<br />
Translation differences on opening balances in respect of foreign subsidiaries (13.24) 4.98<br />
Sale of controlling stake in a subsidiary - (18.88)<br />
1,278.61 719.68<br />
Less:- Closing net Deferred Tax Liability (1,463.79) (1,153.63)<br />
(185.18) (433.95)<br />
Deferred Tax (charge) / credit for the year<br />
As at March 31, 20<strong>11</strong> temporary differences, unused tax losses and tax credits for which no deferred tax asset is recognised amount to GBP 594.0 million ( `4,245.12 crores) in relation<br />
to accelerated capital allowances GBP 85.0 million(` 607.47 crores), accruals GBP 14.0 million ( `100.05 crores), employee benefits GBP 87.2 million (` 623.19 crores) and carried tax<br />
losses GBP 407.8million (` 2,914.41 crores). The deferred tax asset has not been recognised on the basis that its recovery is not virtually certain.<br />
<strong>2010</strong>-20<strong>11</strong> 2009-<strong>2010</strong><br />
(d) Tax expense [Item 9, Page 107] :<br />
i) Current Tax (net of credit for Minimum Alternate Tax) 1,031.20 571.80<br />
ii) Deferred Tax 185.18 433.95<br />
1,216.38 1,005.75<br />
124
Schedules forming part of the Consolidated Balance Sheet and Profit and Loss Account<br />
“13” [Item no. 16] (contd.)<br />
(A) Notes to Balance Sheet (contd.) (` in crores)<br />
(8) Disclosure of Goodwill (On Consolidation)<br />
As at<br />
As at<br />
March 31,<br />
20<strong>11</strong><br />
March 31,<br />
<strong>2010</strong><br />
Opening Balance 3,422.87 3,718.65<br />
Add: Goodwill on acquisitions 27.67 187.90<br />
Less: Sale of controlling stake in a subsidiary - (212.90)<br />
Less: Impairment (19.37) (40.00)<br />
Less: Impact of Foreign Currency Translation 153.62 (230.78)<br />
Closing Balance 3,584.79 3,422.87<br />
As at<br />
As at<br />
March 31,<br />
20<strong>11</strong><br />
March 31,<br />
<strong>2010</strong><br />
(9). (A) Disclosure in respect of finance leases:<br />
Assets taken on lease:<br />
(a) (i) Total of minimum lease payments 21.04 35.26<br />
The total of minimum lease payments for a period :<br />
Not later than one year 7.34 20.72<br />
Later than one year and not later than five years 13.16 13.64<br />
Later than five years 0.54 0.90<br />
(ii) Present value of minimum lease payments 18.92 32.61<br />
Present value of minimum lease payments for a period :<br />
Not later than one year 6.54 19.24<br />
Later than one year and not later than five years <strong>11</strong>.90 12.57<br />
Later than five years 0.48 0.80<br />
(b) A general description of the significant leasing arrangements -<br />
The Company has entered into Finance lease arrangements for computers and<br />
data processing equipments from a vendor<br />
(B)<br />
Disclosure in respect of operating leases:<br />
(a) Assets taken on lease:<br />
(i) Total of minimum lease payments 255.64 196.14<br />
The total of minimum lease payments for a period :<br />
Not later than one year 91.88 67.82<br />
Later than one year and not later than five years 162.54 128.32<br />
Later than five years 1.22 -<br />
(ii) A general description of significant leasing arrangements-<br />
The Company has entered into Finance lease arrangements for computers<br />
and data processing equipments from a vendor<br />
125
Sixty-sixth annual report <strong>2010</strong>-20<strong>11</strong><br />
<strong>Tata</strong> <strong>Motors</strong> Limited<br />
Schedules forming part of the Consolidated Balance Sheet and Profit and Loss Account<br />
“13” [Item no. 16] (contd.)<br />
(A) Notes to Balance Sheet (contd.)<br />
(10) Related party disclosures for the year ended March 31, 20<strong>11</strong><br />
(A) Related Party and their relationship<br />
(B)<br />
Associates<br />
Key Management Personnel<br />
<strong>Tata</strong> AutoComp Systems Ltd<br />
Mr. P M Telang<br />
<strong>Tata</strong> Cummins Ltd Mr. Carl Peter Forster (w.e.f. April 1, <strong>2010</strong>)<br />
<strong>Tata</strong> Precision Industries Pte. Ltd (Upto February 14,20<strong>11</strong>,thereafter subsidiary)<br />
In Subsidiary Companies<br />
<strong>Tata</strong> Hispano <strong>Motors</strong> Carrocera S.A. (Upto October 15, 2009)<br />
Dr. Ralf Speth<br />
<strong>Tata</strong> Sons Ltd (Investing Party)<br />
Nita Company Ltd<br />
<strong>Tata</strong> Precision Industries (India) Ltd. (w.e.f. February 15, 20<strong>11</strong>)<br />
Automobile Corporation of Goa Ltd<br />
Jaguar Cars Finance Limited<br />
Telco Construction Equipment Co Ltd (w.e.f. March 30, <strong>2010</strong>)<br />
Joint Ventures<br />
Fiat India Automobiles Ltd.<br />
<strong>Tata</strong> HAL Technologies Ltd<br />
Transactions with the related parties<br />
(` in crores)<br />
Key <strong>2010</strong>-20<strong>11</strong><br />
Joint Venture Associates Management Total<br />
Personnel<br />
Purchase of goods 2,200.44 3,232.32 - 5,432.76<br />
1,595.31 2,463.58 - 4,058.89<br />
Sale of goods (inclusive of sales tax) 228.46 371.37 - 599.83<br />
142.98 271.64 - 414.62<br />
Sale of Investments - - - -<br />
- 693.39 - 693.39<br />
Purchase of Investments - 5.86 - 5.86<br />
- - - -<br />
Services received 1.35 63.36 29.02 93.73<br />
0.08 62.66 8.90 71.64<br />
Services rendered 1.53 21.85 - 23.38<br />
2.59 9.59 - 12.18<br />
Finance given (including loans and equity) - 89.00 - 89.00<br />
132.50 42.08 - 174.58<br />
Finance taken (including loans and equity) - 83.00 - 83.00<br />
132.50 67.00 - 199.50<br />
Interest / Dividend paid/(received) (net) (10.65) 177.93 - 167.28<br />
(19.95) 86.05 - 66.10<br />
Amount Receivable 1.33 57.01 - 58.34<br />
0.22 49.20 - 49.42<br />
Amount Payable 0.36 <strong>11</strong>7.82 - <strong>11</strong>8.18<br />
106.56 <strong>11</strong>3.19 - 219.75<br />
Amount Receivable (in respect of loans, interest & dividend) 149.27 30.83 0.10 180.20<br />
140.53 33.79 0.10 174.42<br />
Amount Payable (in respect of loans, interest & dividend) - - - -<br />
- 13.01 - 13.01<br />
Deposits given - 3.00 - 3.00<br />
- - - -<br />
(C)<br />
Disclosure in respect of material transactions with related parties<br />
<strong>2010</strong>-20<strong>11</strong> 2009-<strong>2010</strong><br />
i) Purchase of Goods <strong>Tata</strong> Cummins Ltd 2,472.84 1,809.42<br />
Fiat India Automobiles Ltd 2,200.44 1,595.31<br />
Automobile Corporation of Goa Ltd 300.13 190.37<br />
<strong>Tata</strong> AutoComp Systems Ltd. 455.51 446.19<br />
ii) Sale of Goods <strong>Tata</strong> Cummins Ltd 227.49 156.02<br />
Fiat India Automobiles Ltd 228.17 142.80<br />
Nita Company Ltd 105.24 <strong>11</strong>0.46<br />
Telco Construction Equipment Co. Ltd 38.62 -<br />
iii) Sale of Investments <strong>Tata</strong> Sons Ltd - 693.39<br />
iv) Purchase of Investments <strong>Tata</strong> Sons Ltd 5.86 -<br />
v) Services received <strong>Tata</strong> Sons Ltd 63.06 62.66<br />
<strong>Tata</strong> HAL Technologies Ltd. 1.35 0.08<br />
vi) Services rendered <strong>Tata</strong> Cummins Ltd 6.03 4.65<br />
<strong>Tata</strong> AutoComp Systems Ltd. 3.29 1.27<br />
Telco Construction Equipment Co. Ltd 12.49 -<br />
<strong>Tata</strong> Hispano <strong>Motors</strong> Carrocera S.A. - 3.61<br />
Fiat India Automobiles Ltd 1.52 0.77<br />
vii) Finance given including Loan and Equity Fiat India Automobiles Ltd - 132.50<br />
<strong>Tata</strong> Hispano <strong>Motors</strong> Carrocera S.A. - 38.81<br />
Automobile Corporation of Goa Ltd 89.00 -<br />
viii) Finance taken including Loan and Equity Fiat India Automobiles Ltd - 132.50<br />
Automobile Corporation of Goa Ltd 83.00 67.00<br />
ix) Interest/Dividend paid/(received)<br />
Dividend paid <strong>Tata</strong> Sons Ltd. 240.86 108.50<br />
Dividend received <strong>Tata</strong> Cummins Ltd (22.50) (6.75)<br />
Dividend received <strong>Tata</strong> Sons Limited (9.36) (9.36)<br />
Dividend received Telco Construction Equipment Co. Ltd (23.86) -<br />
Interest received <strong>Tata</strong> AutoComp Systems Ltd. (2.44) (2.72)<br />
Interest received Fiat India Automobiles Ltd (33.29) (25.00)<br />
Interest received <strong>Tata</strong> Hispano <strong>Motors</strong> Carrocera S.A. - (2.80)<br />
Interest paid Fiat India Automobiles Ltd 22.65 5.05<br />
Deposits given <strong>Tata</strong> Sons Ltd 3.00 -<br />
126
Schedules forming part of the Consolidated Balance Sheet and Profit and Loss Account<br />
“13”[Item no.16](contd.)<br />
8. Consolidated Segment Information for the year ended March 31, 20<strong>11</strong> (` in crores)<br />
Primary segment<br />
<strong>Tata</strong><br />
Vehicles /<br />
spares and<br />
financing<br />
thereof*<br />
Jaguar and<br />
Land Rover<br />
Automotive<br />
Intra<br />
Segment<br />
Eliminations<br />
Total<br />
Others<br />
Inter-<br />
Segment<br />
Eliminations Total<br />
a) Revenue<br />
External sales and income from other operations 52,297.12 69,941.66 - 1,22,238.78 894.52 - 1,23,133.30<br />
40,320.59 49,255.78 - 89,576.37 2,942.88 - 92,519.25<br />
Inter segment/Intra segment sales and other income 33.65 276.97 (305.75) 4.87 635.97 (640.84) -<br />
38.70 88.43 (88.43) 38.70 495.08 (533.78) -<br />
Total Revenue 52,330.77 70,218.63 (305.75) 1,22,243.65 1,530.49 (640.84) 1,23,133.30<br />
40,359.29 49,344.21 (88.43) 89,615.07 3,437.96 (533.78) 92,519.25<br />
b) Segment results before other income, interest,<br />
tax and exceptional items 4,342.44 7,699.84 (17.40) 12,024.88 203.48 (66.39) 12,161.97<br />
3,758.12 53.84 (9.77) 3,802.19 288.99 (101.38) 3,989.80<br />
c) (i) Dividend and other income 89.61<br />
1,793.12<br />
(ii) Interest and discounting charges (2,045.42)<br />
(2,239.71)<br />
(iii) Exceptional items<br />
Exchange gain (net) on revaluation of 231.01<br />
foreign currency borrowings, deposits and loans 84.47<br />
Others- debt prepayment cost -<br />
(105.04)<br />
d) Profit before tax 10,437.17<br />
3,522.64<br />
Tax expense (1,216.38)<br />
(1,005.75)<br />
e) Profit / (Loss) after tax 9,220.79<br />
2,516.89<br />
f) Segment assets 44,365.44 46,954.90 (83.06) 91,237.28 1,244.97 (436.30) 92,045.95<br />
39,008.50 39,651.28 (<strong>11</strong>.90) 78,647.88 1,090.97 (295.82) 79,443.03<br />
g) Segment liabilities 14,932.69 26,368.16 (55.59) 41,245.26 407.83 (128.01) 41,525.08<br />
16,369.38 20,245.43 (2.13) 36,612.68 381.87 (68.59) 36,925.96<br />
h) Other information<br />
(i) Depreciation 1,709.86 2,925.67 - 4,635.53 19.98 - 4,655.51<br />
1,324.94 2,515.86 - 3,840.80 46.33 - 3,887.13<br />
(ii) Capital expenditure 2,701.77 6,355.56 - 9,057.33 33.22 (66.27) 9,024.28<br />
3,477.94 5,440.37 - 8,918.31 70.25 (127.01) 8,861.55<br />
i) Segment assets exclude:<br />
(i) Deferred Tax Assets 632.34<br />
425.97<br />
(ii) Investments 2,544.26<br />
2,219.12<br />
(iii) Short Term deposits with Banks 2,261.49<br />
897.30<br />
(iv) Margin Money / Cash Collateral with Scheduled Banks 759.09<br />
1,786.07<br />
(v) Loans to Employees 67.32<br />
76.75<br />
(vi) Income tax refundable 2,044.97<br />
1,534.50<br />
(vii) Interest accrued on Investments 1.90<br />
2.43<br />
(viii) Interest receivable and interest accrued on employee loans 2.00<br />
2.74<br />
(iX) Prepaid debt issue cost and loans given 488.16<br />
576.25<br />
(x) Interest accrued on deposit and loans 69.31<br />
41.67<br />
(xi) Marked to Market Derivative Assets and Others 372.64<br />
14.10<br />
9,243.48<br />
7,576.90<br />
* <strong>Tata</strong> Vehicles includes <strong>Tata</strong> Daewoo and Fiat traded vehicles<br />
127
Sixty-sixth annual report <strong>2010</strong>-20<strong>11</strong><br />
<strong>Tata</strong> <strong>Motors</strong> Limited<br />
Schedules forming part of the Consolidated Balance Sheet and Profit and Loss Account<br />
“13”[Item no.16] (contd.)<br />
(A) Notes to Balance Sheet (contd.)<br />
8. Consolidated Segment Information for the year ended March 31, 20<strong>11</strong> (contd.) (` in crores)<br />
Primary segment (contd.)<br />
j) Segment liabilities exclude:<br />
(i) Minority interest 246.60<br />
213.51<br />
(ii) Loans secured 19,927.13<br />
21,290.03<br />
(iii) Loans unsecured 12,864.28<br />
13,818.33<br />
(iv) Foreign Currency Monetary Item Translation Difference Account -<br />
191.15<br />
(v) Deferred tax liability 2,096.13<br />
1,579.60<br />
(vi) Liability for purchase of fixed assets 403.61<br />
433.75<br />
(vii) Liability towards premium on redemption of Non-Convertible Debentures 1,673.83<br />
1,745.79<br />
(viii) Provision for premium on redemption of Foreign Currency Convertible Notes (FCCN) /<br />
Convertible Alternative Reference Securities (CARS) 801.09<br />
993.15<br />
(ix) Proposed dividend and tax thereon 1,479.43<br />
1,003.71<br />
(x) Provision for Income Tax 506.90<br />
358.06<br />
(xi) Marked to market on Derivatives liability and others 61.88<br />
(7.15)<br />
(xii) Interest / commitment charges accrued on loans but not due 508.17<br />
232.72<br />
(xiii) Liability towards Investors Education and Protection Fund under Section 205C<br />
of the Companies Act, 1956 not due 23.84<br />
34.84<br />
40,592.89<br />
41,887.49<br />
(B) Secondary segment United States UK Rest of Europe India Rest of World Total<br />
Revenue from external customers 14,765.34 13,850.20 15,060.59 45,990.78 33,466.39 123,133.30<br />
10,106.57 <strong>11</strong>,569.61 13,146.08 37,760.63 19,936.36 92,519.25<br />
Carrying amount of segment assets 2,302.41 37,920.36 1,987.31 40,982.08 8,853.79 92,045.95<br />
2,453.54 33,203.90 1,926.49 36,146.74 5,712.36 79,443.03<br />
Capital expenditure 16.42 6,305.72 74.42 2,410.34 217.38 9,024.28<br />
32.99 5,382.48 64.76 3,215.01 166.31 8,861.55<br />
Notes:<br />
(1) The Company has disclosed business segment as primary segment. Automotive segment consists of business of automobile products consisting of all types of<br />
commercial and passenger vehicles including financing of the vehicles sold by the Company, wherever applicable. Others primarily include construction equipment,<br />
engineering solutions and software operations.<br />
(2) Segment revenues, expenses and results include transfer between business segments. Such transfers are undertaken either at competitive market prices charged to<br />
unaffiliated customers for similar goods or at contracted rates. These transfers are eliminated on consolidation.<br />
(B)<br />
Notes to the Profit and Loss Account<br />
<strong>2010</strong>-20<strong>11</strong> 2009-<strong>2010</strong><br />
(1) Interest and Discounting Charges<br />
(a) Interest 2,229.72 2,126.34<br />
Less : (i) Transferred to Capital Account 5<strong>11</strong>.23 332.32<br />
(ii) Interest received on bank and other accounts 339.85 225.61<br />
851.08 557.93<br />
(b) Discounting Charges (net) 666.78 671.30<br />
2,045.42 2,239.71<br />
128
Schedules forming part of the Consolidated Balance Sheet and Profit and Loss Account<br />
(B) Notes to the Profit and Loss account: (contd.) “13’’ [Item no.16]<br />
(2) (a) Defined benefit plans / Long term compensated absences (` in crores)<br />
Particulars Gratuity, Superannuation and BKY / PSY Compensated Absences Post-retirement Medicare scheme<br />
i<br />
ii<br />
iii<br />
iv<br />
v<br />
vi<br />
vii<br />
As at / for the year ended on March 31, 20<strong>11</strong> <strong>2010</strong> 2009 2008 2007 20<strong>11</strong> <strong>2010</strong> 2009 2008 2007 20<strong>11</strong> <strong>2010</strong> 2009 2008 2007<br />
Components of employer expense<br />
Current Service cost 35.79 31.60 31.60 26.75 20.06 22.29 18.66 18.31 15.22 12.83 3.67 3.27 2.79 2.93 2.69<br />
Interest cost 47.96 44.96 43.98 40.55 32.14 14.07 12.16 12.53 <strong>11</strong>.22 7.17 7.23 7.05 5.80 5.03 3.22<br />
Expected return on plan assets (44.70) (42.18) (38.49) (36.09) (29.66) - - - - - - - - - -<br />
Past Service Cost 0.07 0.57 3.07 - - - - - - (0.25) - - - - -<br />
Actuarial Losses/(Gains) 59.49 50.90 (5.57) 52.77 68.40 40.45 29.16 (8.89) 18.34 36.77 3.80 (0.14) 10.57 5.74 16.89<br />
Total expense recognised in the Statement<br />
of Profit & Loss Account in Schedule B,<br />
Page <strong>11</strong>1 under item :<br />
98.61 85.85 34.59 83.98 90.94 76.81 59.98 21.95 44.78 56.52 14.70 10.18 19.16 13.70 22.80<br />
4 (b) 4 (a)<br />
Actual Contribution and Benefit Payments<br />
Actual benefit payments 64.43 63.95 67.01 68.43 69.02 33.00 23.60 29.55 28.77 20.47 4.13 4.38 4.51 4.65 3.34<br />
Actual Contributions 84.77 86.78 37.10 104.37 109.51 33.00 23.60 29.55 28.77 20.47 4.13 4.38 4.51 4.65 3.34<br />
Net asset/(liability) recognised in balance<br />
sheet<br />
Present value of Defined Benefit Obligation 688.63 607.16 574.18 558.32 513.74 225.76 181.95 154.81 162.41 146.40 97.74 87.17 85.18 70.53 61.48<br />
Fair value of plan assets 616.<strong>11</strong> 548.41 515.83 497.46 433.21 - - - - - - - - - -<br />
Net asset/(liability) recognised in balance<br />
sheet (72.52) (58.75) (58.35) (60.86) (80.53) (225.76) (181.95) (154.81) (162.41) (146.40) (97.74) (87.17) (85.18) (70.53) (61.48)<br />
Change in Defined Benefit Obligations<br />
(DBO)<br />
Present Value of DBO at beginning of year 607.16 574.18 558.32 513.74 451.08 181.95 154.81 162.41 146.40 <strong>11</strong>0.35 87.17 85.18 70.53 61.48 42.02<br />
Liability on Acquisitions - - - 0.73 - - - - - - - - - - -<br />
Current Service cost 35.79 31.60 31.60 26.75 20.06 22.29 18.66 18.31 15.22 12.83 3.67 3.27 2.79 2.93 2.69<br />
Interest cost 47.96 44.96 43.98 40.55 32.14 14.07 12.16 12.53 <strong>11</strong>.22 7.17 7.23 7.05 5.80 5.03 3.22<br />
Plan amendments - 0.65 3.07 - - - - - - (0.72) - - - - -<br />
Actuarial (gains)/ losses 62.15 46.15 4.22 44.98 79.48 40.45 29.16 (8.89) 18.34 37.24 3.80 (0.14) 10.57 5.74 16.89<br />
Benefits paid (64.43) (63.95) (67.01) (68.43) (69.02) (33.00) (23.60) (29.55) (28.77) (20.47) (4.13) (4.38) (4.51) (4.65) (3.34)<br />
Sale of stake in Subsidiary - (26.43) - - - - (9.24) - - - - (3.81) - - -<br />
Present Value of DBO at the end of year 688.63 607.16 574.18 558.32 513.74 225.76 181.95 154.81 162.41 146.40 97.74 87.17 85.18 70.53 61.48<br />
Change in Fair Value of Assets<br />
Plan assets at beginning of year 548.41 515.83 497.46 433.21 351.98 - - - - - - - - - -<br />
Actual return on plan assets 47.36 37.43 48.28 28.31 40.74 - - - - - - - - - -<br />
Actual Company contributions 84.77 86.78 37.10 104.37 109.51 33.00 23.60 29.55 28.77 20.47 4.13 4.38 4.51 4.65 3.34<br />
Benefits paid (64.43) (63.95) (67.01) (68.43) (69.02) (33.00) (23.60) (29.55) (28.77) (20.47) (4.13) (4.38) (4.51) (4.65) (3.34)<br />
Sale of stake in Subsidiary - (27.68) - - - - - - - - - - - - -<br />
Plan assets at the end of year 616.<strong>11</strong> 548.41 515.83 497.46 433.21 - - - - - - - - - -<br />
Actuarial Assumptions<br />
Discount Rate (%) 6.75-8.50 6.75-8.50 6.75-8.50 7.75-8.50 8.00-8.50 8.50 8.50 8.50 8.50 8.50 8.50 8.50 8.50 8.50 8.50<br />
Expected Return on plan assets (%) 8.00 8.00 8.00 8.00 8.00 N/A N/A N/A N/A N/A N/A N/A N/A N/A N/A<br />
Medical cost inflation (%) N/A N/A N/A N/A N/A N/A N/A N/A N/A N/A 4.00 4.00 4.00 4.00 4.00<br />
The major categories of plan assets as<br />
percentage to total plan assets<br />
Debt securities 75% 76% 78% 69% 64% N/A N/A N/A N/A N/A N/A N/A N/A N/A N/A<br />
Balances with banks 25% 24% 22% 31% 36% N/A N/A N/A N/A N/A N/A N/A N/A N/A N/A<br />
viii<br />
Effect of one percentage point change in<br />
assumed Medical inflation rate<br />
One percentage point increase in Medical<br />
inflation rate<br />
One percentage point decrease in Medical<br />
inflation rate<br />
20<strong>11</strong> <strong>2010</strong> 2009 2008 2007 20<strong>11</strong> <strong>2010</strong> 2009 2008 2007<br />
Revised DBO 104.57 100.15 93.68 72.10 67.78 88.49 82.98 77.74 64.68 56.00<br />
Revised service cost 4.30 3.78 3.21 3.12 2.97 3.16 2.80 2.50 2.35 2.47<br />
Revised interest cost 7.97 7.78 5.96 5.54 3.55 6.59 6.42 5.30 4.54 2.93<br />
(a) Defined Contribution Plans-<br />
The Company’s contribution to defined contribution plan aggregated ` 193.23 crores (2009-<strong>2010</strong> ` 215.90 crores) for the year ended March 31, 20<strong>11</strong> has been recognised<br />
in the statement of Profit and Loss Account under item 4 (b) in Schedule B on page <strong>11</strong>1.<br />
(b) The expected rate of return on plan assets is based on market expectation, at the beginning of the year, for returns over the entire life of the related obligation.<br />
(c) The assumption of future salary increases, considered in actuarial valuation, take account of inflation, seniority, promotion and other relevant factors, such as supply and<br />
demand in the employment market.<br />
(d) The Company expects to contribute ` 89.<strong>11</strong> crores to the funded pension plans in the year 20<strong>11</strong>-2012.<br />
129
Sixty-sixth annual report <strong>2010</strong>-20<strong>11</strong><br />
<strong>Tata</strong> <strong>Motors</strong> Limited<br />
Schedules forming part of the Consolidated Balance Sheet and Profit and Loss Account<br />
(B) Notes to the Profit and Loss account: (contd.)<br />
“13’’ [Item no.16] (contd.)<br />
(2) (b) Details of Severance Indemnity plan applicable to <strong>Tata</strong> Daewoo Commercial Vehicle Co. Ltd.and <strong>Tata</strong> Daewoo Service<br />
Vehicle Co. Ltd., Korea.<br />
(` in crores)<br />
Particulars<br />
As at / for the year ended on March 31, 20<strong>11</strong> <strong>2010</strong> 2009 2008 2007<br />
i Components of employer expense<br />
Current Service cost 20.32 17.54 14.75 18.90 15.88<br />
Interest cost 10.28 8.85 7.64 6.87 6.25<br />
Actuarial losses (23.38) 19.75 19.96 7.69 23.51<br />
Total expense recognised in the Statement of Profit &<br />
Loss Account in Schedule B, Page <strong>11</strong>1 under item 4 (b) 7.22 46.14 42.35 33.46 45.64<br />
ii<br />
iii<br />
iv<br />
v<br />
vi<br />
Actual Contribution and Benefit Payments<br />
Actual benefit payments 8.96 16.26 10.16 7.87 9.43<br />
Actual Contributions 8.96 16.26 10.16 7.87 9.43<br />
Net liability recognised in Balance Sheet<br />
Present value of Defined Benefit Obligation 220.62 217.23 174.83 156.50 149.63<br />
Fair value of plan assets - - - - -<br />
Net liability recognised in Balance Sheet (220.62) (217.23) (174.83) (156.50) (149.63)<br />
Change in Defined Benefit Obligations<br />
Present Value of DBO at the beginning of the year 217.23 174.83 156.50 149.63 <strong>11</strong>3.73<br />
Current Service cost 20.32 17.54 14.75 18.90 15.88<br />
Interest cost 10.28 8.85 7.64 6.87 6.25<br />
Actuarial losses (23.38) 19.75 19.96 7.69 23.51<br />
Benefits paid (8.96) (16.26) (10.16) (7.87) (9.43)<br />
Exchange fluctuation 5.13 12.52 (13.86) (18.72) (0.31)<br />
Present Value of DBO at the end of the year 220.62 217.23 174.83 156.50 149.63<br />
Change in Fair Value of Assets<br />
Plan assets at the beginning of the year N/A N/A N/A N/A N/A<br />
Acquisition Adjustment N/A N/A N/A N/A N/A<br />
Actual return on plan assets N/A N/A N/A N/A N/A<br />
Actual Company Contributions 8.96 16.26 10.16 7.87 9.43<br />
Benefits paid (8.96) (16.26) (10.16) (7.87) (9.43)<br />
Plan assets at the end of the year - - - - -<br />
Actuarial Assumptions<br />
Discount Rate 4.53% 4.84% 5.00% 5.38% 5.00%<br />
Expected return on plan assets N/A N/A N/A N/A N/A<br />
Medical cost inflation N/A N/A N/A N/A N/A<br />
The assumption of future salary increases, considered in actuarial valuation, take account of inflation, seniority, promotion and<br />
other relevant factors, such as supply and demand in the employment market.<br />
130
Schedules forming part of the Consolidated Balance Sheet and Profit and Loss Account<br />
(B) Notes to the Profit and Loss account: (contd.) “13’’ [Item no.16]<br />
(2) (c) Details of Defined benefit plans applicable to Jaguar and Land Rover group.<br />
(` in crores)<br />
Particulars Post-retirement Pension scheme Post-retirement Medicare scheme<br />
i<br />
ii<br />
iii<br />
iv<br />
v<br />
vi<br />
vii<br />
viii<br />
As at / for the year ended on March 31, 20<strong>11</strong> <strong>2010</strong> 2009 20<strong>11</strong> <strong>2010</strong> 2009<br />
Components of employer expense<br />
Current Service cost 752.63 480.03 483.89 0.64 0.53 0.47<br />
Interest cost 1,529.40 1,555.04 1,263.37 0.71 0.61 0.47<br />
Expected return on plan assets (1,7<strong>11</strong>.20) (1,314.87) (1,713.44) - - -<br />
Amortisation of past service cost 35.41 13.63 - - - -<br />
Curtailment - (5.45) - - - -<br />
Settlement (1.20) - - - - -<br />
Asset restriction - - (14.62) - - -<br />
Actuarial Losses - - 16.25 - - -<br />
Total expense recognised in the Statement of Profit & Loss<br />
Account in Schedule B, Page <strong>11</strong>1 under item 4 (b):<br />
605.04 728.38 35.45 1.35 1.14 0.94<br />
Actual Contribution and Benefit Payments<br />
Actual benefit payments 910.70 826.05 563.68 - - -<br />
Actual Contributions 1,545.97 398.06 552.64 - - -<br />
Amount recognised in Pension Reserve<br />
Actuarial loss 1,391.86 642.93 2,585.69 (4.39) 1.67 -<br />
Movement in restriction of pension assets 888.67 (481.33) (959.22) - - -<br />
Exchange Fluctuation - 102.13 (169.26) - - -<br />
Amount recognised in Pension Reserve 2,280.53 263.73 1,457.21 (4.39) 1.67 -<br />
Net liability recognised in balance sheet<br />
Present value of Defined Benefit Obligation 30,723.35 26,340.24 22,<strong>11</strong>9.55 7.69 10.76 8.65<br />
Fair value of plan assets 29,816.<strong>11</strong> 25,908.86 22,591.74 - - -<br />
Restriction of pension asset (235.84) (17.64) (290.37) - - -<br />
Unrecognised actuarial gains and losses - - (3.42) - - -<br />
Onerous Obligation (902.99) (233.72) (436.01) - - -<br />
Exchange Fluctuation (15.28) 5.10 - - - -<br />
Net asset recognised in balance sheet 6.72 3.06 261.67 - - -<br />
Net (Liability) recognised in balance sheet (2,068.07) (680.70) (519.28) (7.69) (10.76) (8.65)<br />
Change in Defined Benefit Obligations (DBO)<br />
Present Value of DBO at beginning of year 26,340.24 22,<strong>11</strong>9.55 - 10.76 8.65 -<br />
Liability on Acquisition - - 26,595.<strong>11</strong> - - 7.59<br />
Current Service cost 752.63 480.03 483.89 0.64 0.53 0.47<br />
Interest cost 1,529.40 1,555.04 1,263.37 0.71 0.61 0.47<br />
Amendments 35.41 12.25 - - - -<br />
Actual Member Contributions 46.39 147.81 237.87 - - -<br />
Actuarial losses 1,608.01 4,902.21 (2,462.41) (4.39) 1.67 (1.02)<br />
Benefits paid (910.70) (826.05) (563.69) - - -<br />
Expenses paid (0.99) (0.15) (0.07) - - -<br />
Plan combinations - 2.72 57.41 - - -<br />
Plan curtailment - (5.45) - - - -<br />
Plan settlement (9.42) (0.68) - - - -<br />
Exchange Fluctuation 1,332.38 (2,047.05) (3,491.93) (0.03) (0.70) 1.14<br />
Present Value of DBO at the end of year 30,723.35 26,340.23 22,<strong>11</strong>9.55 7.69 10.76 8.65<br />
Change in Fair Value of Assets<br />
Plan assets at beginning of year 25,908.88 22,591.74 - N/A N/A N/A<br />
Plan assets on Acquisition - - 29,341.88 N/A N/A N/A<br />
Actual return on plan assets 1,927.28 5,574.15 (3,520.28) N/A N/A N/A<br />
Actual Company Contributions 1,545.97 398.06 552.64 N/A N/A N/A<br />
Actual Member Contributions 46.39 147.81 237.87 N/A N/A N/A<br />
Benefits paid (910.70) (826.04) (563.68) N/A N/A N/A<br />
Expenses paid (0.99) (0.15) (0.07) N/A N/A N/A<br />
Plan combinations - - 54.50 N/A N/A N/A<br />
Plan settlement (8.22) (0.68) - N/A N/A N/A<br />
Exchange Fluctuation 1,307.50 (1,976.01) (3,5<strong>11</strong>.12) N/A N/A N/A<br />
Plan assets at the end of year 29,816.<strong>11</strong> 25,908.88 22,591.74 N/A N/A N/A<br />
Actuarial Assumptions<br />
Discount Rate (%) 5.19- 5.50 5.50- 5.60 6.70-7.16 5.74 6.22 7.77<br />
Inflation (%) 2.00-3.40 2.00-3.50 2.52-3.30 N/A N/A N/A<br />
Expected Return on plan assets (%) 5.75-6.57 6.50 5.80-6.40 N/A N/A N/A<br />
Medical cost inflation (%) N/A N/A N/A 4.20 7.80 4.90-8.10<br />
The major categories of plan assets as percentage to total plan<br />
assets<br />
Equity securities 20%-40% 39%-53% 27%-36% N/A N/A N/A<br />
Debt securities 40%-63% 39%-56% 36%-62% N/A N/A N/A<br />
Other 2.4%-20% 1%-23% 3%-29% N/A N/A N/A<br />
(a) Defined Contribution Plans-<br />
Jaguar and Land Rover group’s contribution to defined contribution plan aggregated ` 24.03 crores (`1.70 crores for the year ended March 31, <strong>2010</strong>) has been recognised in<br />
the statement of Profit and Loss Account under item 4 (b) in Schedule B on Page <strong>11</strong>1<br />
(b) The expected rate of return on plan assets is based on market expectation, at the beginning of the year, for returns over the entire life of the related obligation.<br />
(c) The assumption of future salary increases, considered in actuarial valuation, take account of inflation, seniority, promotion and other relevant factors, such as supply and<br />
demand in the employment market.<br />
(d) The Company expects to contribute ` 825.92 crores to the funded pension plans in the year 20<strong>11</strong>-2012.<br />
131
Sixty-sixth annual report <strong>2010</strong>-20<strong>11</strong><br />
<strong>Tata</strong> <strong>Motors</strong> Limited<br />
(B)<br />
Schedules forming part of the Consolidated Balance Sheet and Profit and Loss Account<br />
Notes to the Profit and Loss Account :(contd.)<br />
<strong>2010</strong>-20<strong>11</strong> 2009-<strong>2010</strong><br />
(3) Earnings Per Share:<br />
(a) Profit for the year ` crores 9,273.62 2,571.06<br />
(b) The weighted average number of Ordinary Shares for Basic EPS Nos. 51,77,60,138 46,37,36,463<br />
(c) The weighted average number of ‘A’ Ordinary Shares for Basic EPS Nos. 7,93,33,840 6,41,76,028<br />
(d) The nominal value per Share (Ordinary and ‘A’ Ordinary) ` 10.00 10.00<br />
(e) Share of Profit for Ordinary Shares for Basic EPS ` crores 8,038.03 2,255.69<br />
(f) Share of Profit for ‘A’ Ordinary Shares for Basic EPS* ` crores 1,235.59 315.37<br />
(g) Earnings Per Ordinary Share (Basic) ` 155.25 48.64<br />
(h) Earnings Per ‘A’ Ordinary Share (Basic) ` 155.75 49.14<br />
(i) Profit for the year for Basic EPS ` crores 9,273.62 2,571.06<br />
(j) Add: Interest payable on outstanding Foreign Currency Convertible Notes ` crores 53.98 41.93<br />
(k) Profit for the year for Diluted EPS ` crores 9,327.60 2,612.99<br />
(l) The weighted average number of Ordinary Shares for Basic EPS Nos. 51,77,60,138 46,37,36,463<br />
(m) Add: Adjustment for Options relating to warrants, Foreign Currency Convertible Notes<br />
and Convertible Alternative Reference Securities<br />
Nos. 4,65,77,982 5,66,43,723<br />
(n) The weighted average number of Ordinary Share for Diluted EPS Nos. 56,43,38,120 52,03,80,186<br />
(o) The weighted average number of ‘A’ Ordinary Share for Basic EPS Nos. 7,93,33,840 6,41,76,028<br />
(p) Add: Adjustment for ‘A’ Ordinary Shares held in abeyance Nos. 99,530 1,00,136<br />
(q) The weighted average number of ‘A’ Ordinary Share for Diluted EPS Nos. 7,94,33,370 6,42,76,164<br />
(r) Share of Profit for Ordinary Shares for Diluted EPS ` crores 8,173.21 2,322.86<br />
(s) Share of Profit for ‘A’ Ordinary Shares for Diluted EPS* ` crores 1,154.39 290.13<br />
(t) Earnings Per Ordinary Share (Diluted) ` 144.83 44.64<br />
(u) Earnings Per ‘A’ Ordinary Share (Diluted) ` 145.33 45.14<br />
* ‘A’ Ordinary Share Holders are entitled to receive dividend @ 5% points more than the aggregate rate of dividend determined by the Company on Ordinary<br />
Shares for the financial year<br />
( ` in crores)<br />
(4) Other provisions include: <strong>2010</strong>-20<strong>11</strong> 2009-<strong>2010</strong><br />
(a) Product warranty and Liability<br />
Opening Balance 3,743.37 4,384.91<br />
Add: On acquisition of subsidiaries - 0.95<br />
Add: Provision for the year (net) (including additional provision for earlier years) 2,927.68 2,524.70<br />
Less: Payments / debits (net of recoveries from suppliers) (2,690.66) (2,991.61)<br />
Less: Sale of controlling stake in a subsidiary - (23.52)<br />
Less: Reclassification (143.41) -<br />
Foreign currency translation 289.21 (152.06)<br />
Closing Balance 4,126.19 3,743.37<br />
The provision is expected to be utilized for settlement of warranty claims within a period of 2 to 4 years.<br />
(b) Provision for Residual Risk:<br />
Opening Balance 106.91 693.25<br />
Add: Provision for the year (net) (221.83) (439.20)<br />
Less: Payments / debits 166.03 (<strong>11</strong>5.39)<br />
Foreign currency translation (0.88) (31.75)<br />
Closing Balance 50.23 106.91<br />
(c) Provision towards Environmental Cost :<br />
Opening Balance 128.<strong>11</strong> 151.54<br />
Add: (Reversal ) / Provision for the year (net) - (13.79)<br />
Less: Payments / debits (3.54) (1.59)<br />
Foreign currency translation 6.33 (8.05)<br />
Closing Balance 130.90 128.<strong>11</strong><br />
(d)<br />
Premium on redemption of Foreign Currency Convertible Notes (FCCN) and<br />
Convertible Alternative Reference Securities (CARS):<br />
Opening Balance 993.15 1,094.57<br />
Foreign currency exchange gain (3.22) (133.38)<br />
Premium on redemption of FCCN (including withholding tax) - 257.46<br />
Reversal of provision for premium due to conversion of FCCN (168.57) (225.50)<br />
Reversal of provision for WHT due to redemption of FCCN (20.27) -<br />
Closing Balance 801.09 993.15<br />
(5) The additional disclosure as required by AS 7 (Revised) on Construction Contracts are as follows:<br />
(a) Advance received is `13.57 crores (as at March 31, <strong>2010</strong> `12.01 crores)<br />
(b) Retention money is `17.61 crores (as at March 31, <strong>2010</strong> ` 15.45 crores)<br />
(c) Contract revenue recognised during the year is ` <strong>11</strong>6.74 crores (2009-<strong>2010</strong> ` 81.03 crores)<br />
(d) Aggregate amount of costs incurred and recognised profits (less recognised losses) ` 305.63 crores ( as at March 31, <strong>2010</strong> ` 242.67 crores)<br />
132
Schedule forming part of the Consolidated Balance Sheet and Profit and Loss Account<br />
(C) Other notes: ( ` in crores)<br />
(1) The proportionate share of assets and liabilities as at March 31, 20<strong>11</strong> and income and expenditure for the year ended March 31, 20<strong>11</strong> of the joint venture<br />
companies based on financial statements are given below:<br />
As at<br />
As at<br />
March 31, 20<strong>11</strong> March 31, <strong>2010</strong> <strong>2010</strong>-20<strong>11</strong> 2009-<strong>2010</strong><br />
Unaudited Unaudited Unaudited Unaudited<br />
RESERVES AND SURPLUS<br />
INCOME<br />
Reserves and Surplus (609.35) (486.17)<br />
Sale of products and services 2,041.51 1,614.85<br />
Less : Excise duty (324.04) (192.92)<br />
Other Operating Income 198.75 146.31<br />
ASSETS<br />
Net Block (including CWIP) 1,652.46 1,769.90 1,916.22 1,568.24<br />
Investments (` 50) - - EXPENDITURE<br />
Current Assets 964.46 984.69<br />
Manufacturing and other expenses 1,768.24 1,437.93<br />
2,616.92 2,754.59 Product Development Cost 3.46 0.48<br />
LIABILITIES Depreciation 160.64 140.79<br />
Loan Funds 1,150.51 1,337.90 Interest 107.06 124.18<br />
Current Liabilities 998.32 1,028.62<br />
Provisions <strong>11</strong>.38 9.76<br />
2,160.21 2,376.28 2,039.40 1,703.38<br />
Claims not acknowledged as debts 4.15 3.14<br />
Capital Commitments 7.70 50.01<br />
(2) During the year ended March 31, 20<strong>11</strong>, the Company has issued shares aggregating US$ 750 million, comprising ‘A’ Ordinary Shares aggregating US$ 550 million<br />
and Ordinary Shares aggregating US$ 200 million.Consequently, the Company has allotted 32,165,000 ‘A’ Ordinary Shares at a price of ` 764 per ‘A’ Ordinary Share<br />
(including a premium of ` 754 per ‘A’ Ordinary Share) and 8,320,300 Ordinary Shares at a price of ` 1,074 per Ordinary Share (including a premium of ` 1,064 per<br />
Ordinary Share) aggregating to a total issue size of ` 3,351.01 crores.<br />
(3) The following subsidiaries/associate have been considered on Unaudited basis. Details for the same are as under :<br />
<strong>Tata</strong> Precision <strong>Tata</strong> <strong>Motors</strong> (SA) Trilix S.r. l<br />
Industries Pte Ltd (Proprietary Ltd.<br />
(a) As at March 20<strong>11</strong><br />
Net Worth 1.03 13.02 5.77<br />
For the year ended March 31, 20<strong>11</strong><br />
Total Revenue - - 9.86<br />
Net Increase/(Decrease) in Cash & Cash equivalent 1.<strong>11</strong> 7.89 2.82<br />
(b)<br />
The share of profit / (loss) in respect of investments in associate companies include figures which are considered as per unaudited financial statements/profit and<br />
loss account for the year ended March 31,20<strong>11</strong>, as per the details given :<br />
Name of the Associate<br />
Share in Post<br />
acquisition<br />
Reserves and<br />
Profit and Loss<br />
account upto<br />
March 31, 20<strong>11</strong><br />
Profit / (Loss) for<br />
the year ended<br />
March 31, 20<strong>11</strong><br />
Telco Construction Equipment Co Ltd 155.69 14.71<br />
(4) On March 23, <strong>2010</strong>, the Company had offered to Non-U.S. Noteholders of outstanding 0% JPY <strong>11</strong>,760 million (due 20<strong>11</strong>) and 1% USD 300 million (due 20<strong>11</strong>)<br />
Convertible Notes, an option to convert their Notes into Ordinary Shares during a limited offer period. During this period, as per the terms of Invitation<br />
Memorandum, Noteholders could opt to receive shares at enhanced conversion terms. Noteholders, who did not participate, would continue with all the terms of<br />
their notes as applicable prior to this limited period offer. Noteholders representing 93.62% of the JPY Notes (i.e. JPY 10,710 million) and 76.54% of USD Notes (i.e.<br />
USD 229.64 million), outstanding prior to the offering, opted to convert their Notes into Ordinary Shares. As a result, the company has allotted 2,66,43,266 equity<br />
shares to the Noteholders, who exercised the option.<br />
(5) Subsequent to the year ended March 31, 20<strong>11</strong>, Jaguar Land Rover Plc., an indirect subsidiary of the Company has issued GBP 1,000 million equivalent Senior Notes<br />
(Notes). The Notes issued includes GBP 500 million Senior Notes due 2018 at a coupon of 8.125% per annum, USD 410 million Senior Notes due 2018 at a coupon<br />
of 7.75% per annum and USD 410 million Senior Notes due 2021 at a coupon of 8.125% per annum. The proceeds will be used to refinance existing debt and for<br />
general corporate purposes.<br />
(6) Previous year figures have been re-grouped where necessary.<br />
(7) Current year figures are shown in bold prints.<br />
133
Sixty-sixth annual report <strong>2010</strong>-20<strong>11</strong><br />
<strong>Tata</strong> <strong>Motors</strong> Limited<br />
Sr.<br />
No<br />
I Details of Subsidiaries<br />
Subsidiary<br />
SUBSIDIARY COMPANIES : FINANCIAL HIGHLIGHTS- <strong>2010</strong>-<strong>11</strong><br />
Country of<br />
Incorporation<br />
Reporting<br />
currency #<br />
Share<br />
capital (incl.<br />
advances<br />
towards<br />
capital where<br />
applicable)<br />
Reserves<br />
and Surplus<br />
Total<br />
Assets<br />
Total<br />
Liabilities<br />
Turnover<br />
Profit/ (Loss)<br />
Before Tax<br />
Tax<br />
Expense/<br />
(Credit)<br />
Profit/(Loss)<br />
after tax<br />
Profit/<br />
(Loss)for<br />
the period/<br />
year *<br />
Proposed<br />
dividend<br />
and tax<br />
thereon<br />
(` in Crores)<br />
Investments<br />
(except in<br />
case<br />
of investment<br />
in the<br />
subsidiaries)<br />
1 TAL Manufacturing Solutions Ltd. India INR 65.00 34.96 288.63 188.67 249.59 18.51 3.81 14.70 14.70 5.67 -<br />
2 HV Axles Ltd. India INR 45.00 286.67 429.59 97.92 306.32 139.80 45.59 94.21 94.21 31.38 91.89<br />
3 HV Transmissions Ltd. India INR 40.00 202.87 343.78 100.91 293.12 135.07 44.31 90.76 90.76 27.89 5.00<br />
4 Concorde <strong>Motors</strong> (India) Ltd. India INR 46.80 25.46 236.02 163.76 879.58 3.98 1.19 2.79 2.79 2.27 -<br />
5 Sheba Properties Ltd. India INR 75.00 78.37 156.61 3.24 9.58 8.28 1.37 6.91 6.91 - 146.23<br />
6 <strong>Tata</strong> Daewoo Commercial Vehicle Co. Ltd. South Korea KRW 57.35 1,005.83 2,181.42 1,<strong>11</strong>8.24 2,890.12 86.18 13.23 72.95 72.95 - 79.04<br />
7 <strong>Tata</strong> Technologies Ltd. India INR 37.32 403.55 603.82 162.96 504.75 127.10 30.06 97.05 97.05 21.66 319.31<br />
8 <strong>Tata</strong> <strong>Motors</strong> Insurance Broking & Advisory Services Ltd India INR 2.50 1.31 10.23 6.41 23.16 0.85 - 0.85 0.85 - 0.77<br />
9 <strong>Tata</strong> <strong>Motors</strong> European Technical Centre Plc. UK GBP 29.60 (16.32) 259.34 246.07 191.70 (45.40) 3.04 (48.45) (48.45) - -<br />
10 TML Distribution Company Ltd. India INR 225.00 32.16 1,991.45 1,734.29 17,390.42 16.22 5.45 10.77 10.77 - -<br />
<strong>11</strong> <strong>Tata</strong> <strong>Motors</strong> (SA) (Proprietary) Ltd. South Africa ZAR 13.00 0.02 22.12 9.10 - (0.03) - (0.03) (0.03) - -<br />
12 <strong>Tata</strong> <strong>Motors</strong> Finance Ltd. India INR 1,050.00 808.12 <strong>11</strong>,461.79 9,603.67 1,428.47 202.60 75.49 127.<strong>11</strong> 127.<strong>11</strong> - 58.04<br />
13 <strong>Tata</strong> Marcopolo <strong>Motors</strong> Ltd. India INR 170.00 (57.15) 374.77 261.93 469.67 (8.56) - (8.56) (8.56) - -<br />
14 <strong>Tata</strong> <strong>Motors</strong> (Thailand) Ltd. Thailand THB 154.56 (254.96) 369.50 469.91 406.49 (63.93) - (63.93) (63.93) - -<br />
15 TML Holdings Pte Ltd, Singapore Singapore USD 17,304.38 671.08 17,977.21 1.75 - 269.28 - 269.28 269.28 - -<br />
16 <strong>Tata</strong> Hispano <strong>Motors</strong> Carrocera S.A Spain EURO 3.70 (260.37) 3<strong>11</strong>.66 568.33 208.05 (63.74) (3.13) (60.60) (60.60) - -<br />
17 Trilix S.r.l (w.ef. September 29, <strong>2010</strong>) Italy EURO 0.61 5.16 19.15 13.38 9.86 0.42 0.21 0.21 0.21 - 0.67<br />
18 <strong>Tata</strong> Precision Industries Pte Ltd (w.e.f February 15, 20<strong>11</strong>) Singapore SGD 74.21 (73.19) 1.37 0.34 - - - - - - -<br />
19 INCAT International PLC. U.K. GBP 1.73 33.59 48.14 12.82 - (0.89) (0.29) (0.61) (0.61) - -<br />
20 <strong>Tata</strong> Technologies Inc USA USD 199.26 (375.15) 140.39 316.28 441.02 18.54 5.96 12.58 12.58 - -<br />
21 <strong>Tata</strong> Technologies Canada Inc. Canada USD - (4.28) 5.25 9.52 2.72 0.21 - 0.21 0.21 - -<br />
22 <strong>Tata</strong> Technologies de Mexico, S.A. de C.V. Mexico USD 0.69 1.57 3.96 1.69 8.78 (0.10) (0.03) (0.07) (0.07) - -<br />
23 <strong>Tata</strong> Technologies Europe Ltd UK GBP 0.07 36.68 164.<strong>11</strong> 127.36 383.51 27.97 4.93 23.04 23.04 - -<br />
24 INCAT GmbH Germany EURO 1.04 12.82 14.40 0.54 0.95 1.06 - 1.06 1.06 - -<br />
25 INCAT SAS (Liquidated w.e.f April 30,<strong>2010</strong> ) France EURO - - - - - - - - - - -<br />
26 <strong>Tata</strong> Technologies (Thailand) Ltd Thailand THB 5.19 (3.44) 3.13 1.37 7.84 0.68 - 0.68 0.68 - -<br />
27 TATA Technologies Pte Ltd. Singapore SGD 310.71 286.03 608.70 <strong>11</strong>.97 34.31 10.99 0.17 10.82 10.82 - -<br />
28 Miljobil Greenland AS Norway NOK 6.83 (40.62) 53.23 87.02 15.89 (27.72) - (27.72) (27.72) - -<br />
29 JaguarLandRover Ltd Plc ( formely known as JaguarLandRover Ltd) UK USD 17,754.19 (1,933.69) 15,820.69 0.19 - 67.69 - 67.69 67.69 - -<br />
30 Jaguar Cars Limited UK GBP 15,502.20 (14,515.48) 5696.43 4,709.70 20,521.38 (550.90) (0.04) (550.86) (550.86) - -<br />
31 Land Rover UK GBP 4,809.72 2,377.69 16,9<strong>11</strong>.77 9,724.36 38,600.83 6,610.<strong>11</strong> - 6,610.<strong>11</strong> 6,610.<strong>11</strong> - 752.72<br />
32 Jaguar Cars Exports Limited UK GBP - (183.96) 974.94 1,158.90 8,962.82 16.54 0.65 15.90 15.90 - -<br />
33 The Jaguar Collection Limited UK GBP - - - - - - - - - - -<br />
34 Jaguar Land Rover North America, LLC. USA USD 195.98 (96.86) 2,656.34 2,557.22 13,443.40 137.82 29.04 108.78 108.78 - -<br />
35 Jaguar Hispania Sociedad Spain EUR 5.09 <strong>11</strong>.15 83.87 67.62 244.08 3.53 0.08 3.45 3.45 - -<br />
36 Jaguar Deutschland GmbH Germany EUR 14.45 106.31 157.25 36.50 244.03 (4.05) 2.01 (6.06) (6.06) - -<br />
37 Jaguar Belux NV Belgium EUR 7.08 21.15 58.20 29.97 264.77 7.60 (0.03) 7.62 7.62 - -<br />
38 Jaguar Land Rover Austria GmbH Austria EUR 0.82 6.73 140.72 133.17 526.26 (23.84) 0.76 (24.60) (24.60) - -<br />
39 Jaguar Cars Overseas Holdings Limited UK GBP - - - - - - - - - - -<br />
40 Jaguar Italia SpA Italy EUR 4.96 68.98 170.68 96.75 398.09 (16.06) 0.26 (16.32) (16.32) - -<br />
41 Land Rover Group Limited UK GBP - 162.69 412.06 249.38 - 2.31 - 2.31 2.31 - -<br />
42 Land Rover Ireland Limited Ireland EUR - 16.80 13.27 (3.53) - (1.76) (0.27) (1.49) (1.49) - -<br />
43 Jaguar Land Rover Australia Pty Limited Australia AUD - 95.42 802.56 707.14 1,859.77 58.98 20.51 38.47 38.47 - -<br />
44 Land Rover Exports Limited UK GBP - 1,140.71 7,781.77 6,641.05 35,134.44 (1,268.38) - (1,268.38) (1,268.38) - -<br />
45 Land Rover Espana SL Spain EUR 284.57 16.95 472.96 171.44 1,212.67 5.12 1.69 3.43 3.43 - -<br />
46 Land Rover Deutschland GmbH Germany EUR 73.55 153.42 617.85 390.89 1,876.82 28.32 2.79 25.53 25.53 - -<br />
47 Land Rover Nederland BV Netherlands EUR 0.31 49.26 145.92 96.34 538.42 88.62 2.49 86.12 86.12 - -<br />
48 Land Rover Belux SA/NV Belgium EUR 1.39 12.94 176.48 162.14 736.84 7.68 0.12 7.56 7.56 - -<br />
49 Land Rover Italia SpA Italy EUR 2.65 225.58 939.90 7<strong>11</strong>.67 2,625.85 78.14 (19.35) 97.49 97.49 - -<br />
50 Jaguar Land Rover Portugal-Veiculos e Pecas, Lda. Portugal EUR 81.81 (84.64) 66.84 69.67 143.50 12.28 2.13 10.15 10.15 - -<br />
51 Jaguar Land Rover Mexico, SA de CV Mexico USD - - - - 26.34 (7.18) (0.34) (6.84) (6.84) - -<br />
52 Jaguar Land Rover automotive trading (Shanghai) Co. Ltd) China CNY - 670.31 2,857.58 2,187.27 <strong>11</strong>,139.35 788.71 204.29 584.42 584.42 - -<br />
53 Jaguar Land Rover Japan Limited Japan JPY - 205.43 560.17 354.74 768.45 (15.94) 17.40 (33.34) (33.34) - -<br />
54 Jaguar Land Rover Korea Co. Ltd Korea KRW 0.19 35.17 221.33 185.96 613.85 3.44 1.09 2.35 2.35 - -<br />
55 Jaguar Land Rover Canada ULC Canada CAD <strong>11</strong>.87 5.57 371.86 354.43 1,163.09 16.77 6.82 9.95 9.95 - -<br />
56 Jaguar Land Rover France SAS France EUR 35.59 43.66 416.19 336.94 2,031.29 30.75 5.09 25.65 25.65 - -<br />
57 Jaguar Land Rover (South Africa) (Pty) Ltd South Africa ZAR - 306.28 668.25 361.96 1,918.40 317.29 106.88 210.41 210.41 - -<br />
58 The Lanchester Motor Company Ltd UK GBP - - - - - - - - - - -<br />
59 The Daimler Motor Company Ltd UK GBP 10.72 - 10.72 - - - - - - - -<br />
60 S.S. Cars Ltd UK GBP - - - - - - - - - - -<br />
61 Daimler Transport Vehicles Ltd UK GBP - - - - - - - - - - -<br />
62 Jaguar Land Rover Brazil LLC Brazil BRL - 90.20 308.24 218.04 1,834.22 252.10 54.62 197.49 197.49 - -<br />
63 Jaguar Land Rover Russia Russia RUR - 733.18 1,380.09 646.91 3,655.64 599.82 149.84 449.98 449.98 - -<br />
64 Land Rover Parts Ltd UK GBP - 151.49 483.68 332.19 3,799.49 85.30 - 85.30 85.30 - -<br />
65 Land Rover Parts North America LLC USA USD 202.60 25.40 313.14 85.15 788.18 14.25 - 14.25 14.25 - -<br />
66 Limited Liability Company “Jaguar Land Rover” (Russia) Russia RUR - - - - - - - - - - -<br />
67 <strong>Tata</strong> Hispano <strong>Motors</strong> Crrosseries Hispano Maghreb, Morroco Spain EUR 23.05 (26.38) 91.41 94.75 47.97 (8.81) - (8.81) (8.81) - -<br />
68 <strong>Tata</strong> Daewoo Commercial Vehicle Sales and Distribution Co. Ltd. Korea KRW 4.00 2.52 24.86 18.33 70.59 6.85 1.62 5.23 5.23 - -<br />
69 <strong>Tata</strong> Engineering Services (Pte) Limited Singapore SGD - - - - - - - - - - -<br />
Details of Direct subsidiaries, on consolidated basis including their<br />
respective subsidiaries included above<br />
1 <strong>Tata</strong> Technologies Limited (Note A, page 135) 37.32 430.45 1,041.93 574.16 1,256.45 179.92 40.90 139.02 139.02 21.66 96.09<br />
2 <strong>Tata</strong> <strong>Motors</strong> European Technical Centre Plc.(Note B, page 135) 29.60 (64.27) 219.32 253.99 196.49 (73.12) 3.04 (76.17) (76.17) 0.87 -<br />
3 <strong>Tata</strong> Hispano <strong>Motors</strong> Carrocera S.A. (Note C, page 135) 3.70 (260.37) 3<strong>11</strong>.38 568.33 208.05 (63.74) (3.13) (60.60) (60.60) - -<br />
4 <strong>Tata</strong> Daewoo Commercial Vehicle Co. Ltd. (Note D, page 135) 61.07 885.42 2,069.97 1,123.49 2,880.24 93.09 14.91 78.18 78.18 - 79.04<br />
5 TML Holdings Pte Ltd, Singapore ( Note E, page 135) 17,304.38 (1,146.89) 48,805.03 32,647.54 70,235.36 7,929.24 591.93 7,337.31 7,337.31 - 752.72<br />
134
Notes:<br />
Country of<br />
Incorporation<br />
(A) List of Subsidiaries of <strong>Tata</strong> Technologies Limited that have been consolidated<br />
1 INCAT International PLC. U.K.<br />
2 <strong>Tata</strong> Technologies Inc USA<br />
3 <strong>Tata</strong> Technologies Canada Inc. Canada<br />
4 <strong>Tata</strong> Technologies de Mexico, S.A. de C.V. Mexico<br />
5 <strong>Tata</strong> Technologies Europe Ltd UK<br />
6 INCAT GmbH Germany<br />
7 INCAT SAS (Liquidated w.e.f April 30,<strong>2010</strong> ) France<br />
8 <strong>Tata</strong> Technologies (Thailand) Ltd Thailand<br />
9 TATA Technologies Pte Ltd. Singapore<br />
(B) List of Subsidiaries of <strong>Tata</strong> <strong>Motors</strong> European Technical Centre Plc that have been consolidated<br />
1 Miljobil Greenland AS Norway<br />
(C) List of Subsidiaries of <strong>Tata</strong> Hispano <strong>Motors</strong> Carrocera S.A. that have been consolidated<br />
1 <strong>Tata</strong> Hispano <strong>Motors</strong> Crrosseries Hispano Maghreb, Morroco Spain<br />
(D) List of Subsidiaries of <strong>Tata</strong> Daewoo Commercial Vehicle Co. Ltd. that have been consolidated<br />
1 <strong>Tata</strong> Daewoo Commercial Sales and Distribution Co. Ltd. Korea<br />
(E) List of Subsidiaries of TML Holdings Pte Ltd, Singapore that have been consolidated<br />
1 JaguarLandRover Ltd Plc ( formely known as JaguarLandRover Ltd) UK<br />
2 Jaguar Cars Limited UK<br />
3 Land Rover UK<br />
4 Jaguar Cars Exports Limited UK<br />
5 The Jaguar Collection Limited UK<br />
6 Jaguar Land Rover North America, LLC. USA<br />
7 Jaguar Hispania Sociedad Spain<br />
8 Jaguar Deutschland GmbH Germany<br />
9 Jaguar Belux NV Belgium<br />
10 Jaguar Land Rover Austria GmbH Austria<br />
<strong>11</strong> Jaguar Cars Overseas Holdings Limited UK<br />
12 Jaguar Italia SpA Italy<br />
13 Land Rover Group Limited UK<br />
14 Land Rover Ireland Limited Ireland<br />
15 Jaguar Land Rover Australia Pty Limited Australia<br />
16 Land Rover Exports Limited UK<br />
17 Land Rover Espana SL Spain<br />
18 Land Rover Deutschland GmbH Germany<br />
19 Land Rover Nederland BV Netherlands<br />
20 Land Rover Belux SA/NV Belgium<br />
21 Land Rover Italia SpA Italy<br />
22 Jaguar Land Rover Portugal-Veiculos e Pecas, Lda. Portugal<br />
23 Jaguar Land Rover Mexico, SA de CV Mexico<br />
24 Jaguar Land Rover automotive trading (Shanghai) Co. Ltd China<br />
25 Jaguar Land Rover Japan Limited Japan<br />
26 Jaguar Land Rover Korea Co. Ltd Korea<br />
27 Jaguar Land Rover Canada ULC Canada<br />
28 Jaguar Land Rover France SAS France<br />
29 Jaguar Land Rover (South Africa) (Pty) Ltd South Africa<br />
30 The Lanchester Motor Company Ltd UK<br />
31 The Daimler Motor Company Ltd UK<br />
32 S.S. Cars Ltd UK<br />
33 Daimler Transport Vehicles Ltd UK<br />
34 Jaguar Land Rover Brazil LLC Brazil<br />
35 Jaguar Land Rover Russia Russia<br />
36 Land Rover Parts Ltd UK<br />
37 Land Rover Parts North America LLC USA<br />
38 Limited Liability Company “Jaguar Land Rover” (Russia) Russia<br />
# The financial statements of subdsidiaries whose reporting currency are other than INR are converted into Indian Rupees on the basis of<br />
appropriate exchange rates.<br />
* Profit for the year is after share of minority interest and share of profit/(loss) in respect of investment in associate companies.<br />
135
Sixty-sixth annual report <strong>2010</strong>-20<strong>11</strong><br />
<strong>Tata</strong> <strong>Motors</strong> Limited<br />
FINANCIAL STATISTICS<br />
Year Capital Reserves<br />
and Surplus<br />
CAPITAL ACCOUNTS (` in lakhs) REVENUE ACCOUNTS (` in lakhs) RATIOS<br />
Borrowings Gross Block Depreciation Net Block Turnover Depreciation Profit/ (Loss)<br />
Before<br />
Taxes<br />
Taxes Profit/ (Loss)<br />
After Taxes<br />
Dividend<br />
including<br />
tax<br />
PAT to Sales Earnings Per<br />
Share (Basic)*<br />
(`)<br />
1945-46 100 1 - 31 2 29 12 2 1 0 1 0 8.3% 0.07 - - - 10<br />
1949-50 200 <strong>11</strong> 94 233 44 189 167 15 <strong>11</strong> 5 6 0 3.6% 0.03 - - - 10<br />
1953-54 500 27 412 731 270 461 321 97 3 0 3 0 0.9% 0.<strong>11</strong> - - - <strong>11</strong><br />
1954-55 627 27 481 792 303 489 445 35 0 0 0 0 0.0% 0.00 - - - <strong>11</strong><br />
1955-56 658 120 812 1010 407 603 <strong>11</strong>98 105 125 32 93 59 7.8% 1.32 - 0.60 - 12<br />
1956-57 700 149 1382 1352 474 878 2145 70 <strong>11</strong>6 27 89 44 4.1% 1.64 - 0.80 - 13<br />
1957-58 700 <strong>11</strong>7 1551 1675 668 1007 2694 129 99 6 93 52 3.5% 1.72 - 0.90 - 12<br />
1958-59 1000 206 1245 2050 780 1270 2645 <strong>11</strong>3 155 13 142 56 5.4% 1.68 - 0.90 - 12<br />
1959-60 1000 282 1014 2201 940 1261 2825 161 222 93 129 108 4.6% 1.50 - 1.25 - 13<br />
1960-61 1000 367 1263 2593 <strong>11</strong>18 1475 3735 180 313 122 191 126 5.1% 2.26 - 1.45 - 14<br />
1961-62 1000 432 1471 2954 1336 1618 4164 220 378 188 190 124 4.6% 2.28 - 1.45 - 15<br />
1962-63 1000 450 1758 3281 1550 1731 4364 223 327 185 142 124 3.3% 1.68 - 1.45 - 15<br />
1963-64 <strong>11</strong>98 630 2470 3920 1802 2<strong>11</strong>8 5151 260 404 200 204 144 4.0% 1.97 - 1.45 - 16<br />
1964-65 1297 787 3275 4789 2144 2645 6613 345 479 208 271 157 4.1% 2.39 - 1.45 - 17<br />
1965-66 1640 995 3541 5432 2540 2892 7938 398 477 189 288 191 3.6% 2.20 - 1.45 - 18<br />
1966-67 1845 1027 4299 6841 3039 3802 9065 505 620 192 428 235 4.7% 2.80 - 1.45+ - 17<br />
1967-68 1845 <strong>11</strong>21 5350 7697 3608 4089 9499 572 395 66 329 235 3.5% 2.10 - 1.45 - 18<br />
1968-69 1845 1295 5856 8584 4236 4348 10590 630 582 173 409 235 3.9% 2.66 - 1.45 - 19<br />
1969-70 1845 1333 6543 9242 4886 4356 9935 662 274 0 274 221 2.8% 1.72 - 1.35 - 19<br />
1970-71 1845 1516 6048 10060 5620 4440 13624 749 673 270 403 251 3.0% 2.49 - 1.45 - 20<br />
1971-72 1949 2020 6019 10931 6487 4444 15849 758 885 379 506 273 3.2% 3.04 - 1.50 - 23<br />
1972-73 1949 2194 5324 12227 7491 4736 15653 820 832 360 472 266 3.0% 2.87 - 1.50 - 24<br />
1973-74 1949 2394 6434 13497 8471 5026 16290 902 1007 450 557 180 3.4% 3.43 - 0.93 - 26<br />
1974-75 1949 2827 9196 15838 9593 6245 22510 <strong>11</strong>34 677 136 541 266 2.4% 3.32 - 1.50 - 28<br />
1975-76 2013 3691 9399 18642 10625 8017 27003 1054 855 91 764 276 2.8% 4.60 - 1.50 - 33<br />
1976-77 2328 3833 <strong>11</strong>816 20709 <strong>11</strong>685 9024 28250 <strong>11</strong>45 1056 0 1056 323 3.7% 5.38 - 1.50+ - 30<br />
1977-78 2<strong>11</strong>8 4721 <strong>11</strong>986 22430 12723 9707 28105 <strong>11</strong>01 1044 0 1044 313 3.7% 5.37 - 1.50 - 35<br />
1978-79 3151 5106 <strong>11</strong>033 24900 13895 <strong>11</strong>005 37486 1200 1514 0 1514 467 4.0% 5.36 - 1.60+ - 27<br />
1979-80 3151 6263 17739 28405 15099 13306 44827 1300 1762 0 1762 605 3.9% 5.96 - 2.00 - 31<br />
1980-81 3151 8095 15773 33055 16496 16559 60965 1616 2437 0 2437 605 4.0% 8.27 - 2.00 - 38<br />
1981-82 4320 10275 25476 38819 18244 20575 79244 1993 4188 0 4188 839 5.3% 10.18 - 2.00+ - 35 $<br />
1982-83 4226 12458 23361 43191 20219 22972 86522 2187 3481 460 3021 827 3.5% 7.34 - 2.00 - 40<br />
1983-84 5421 14103 25473 46838 23078 23760 85624 2923 2163 235 1928 923 2.3% 3.61 - 2.00 - 37 @<br />
1984-85 5442 15188 30226 52819 26826 25993 93353 3895 2703 390 2313 1241 2.5% 4.32 - 2.30 - 39<br />
Ordinary<br />
Share<br />
‘A’ Ordinary<br />
Share<br />
Ordinary<br />
Share<br />
Dividend Per<br />
Share*#<br />
(`)<br />
‘A’ Ordinary<br />
Share<br />
Net Worth<br />
Per Share*<br />
(`)<br />
136
CAPITAL ACCOUNTS (` in lakhs) REVENUE ACCOUNTS (` in lakhs) RATIOS<br />
Net Worth<br />
Per Share*<br />
(`)<br />
Dividend Per<br />
Share*#<br />
(`)<br />
PAT to Sales Earnings Per<br />
Share (Basic)*<br />
(`)<br />
Dividend<br />
including<br />
tax<br />
Taxes Profit/ (Loss)<br />
After Taxes<br />
Borrowings Gross Block Depreciation Net Block Turnover Depreciation Profit/ (Loss)<br />
Before<br />
Taxes<br />
Year Capital Reserves<br />
and Surplus<br />
‘A’ Ordinary<br />
Share<br />
Ordinary<br />
Share<br />
‘A’ Ordinary<br />
Share<br />
Ordinary<br />
Share<br />
1985-86 5452 16551 44651 61943 29030 32913 102597 3399 1832 215 1617 1243 1.6% 3.00 - 2.30 - 41<br />
1986-87 5452 15886 53476 68352 30914 37438 <strong>11</strong>9689 2157 293 0 293 552 0.2% 0.51 - 1.00 - 40<br />
1987-88 6431 17491 44406 75712 34620 41092 140255 3822 3205 510 2695 1356 1.9% 4.25 - 2.30 - 38 @<br />
1988-89 10501 30740 32396 83455 38460 44995 167642 4315 8513 1510 7003 2444 4.2% 6.74 - 2.50 - 40 @<br />
1989-90 10444 37870 48883 91488 43070 48418 196910 4891 14829 4575 10254 3126 5.2% 9.87 - 3.00 - 47<br />
1990-91 10387 47921 48323 100894 48219 52675 259599 5426 23455 9250 14205 4154 5.5% 13.69 - 4.00 - 56<br />
1991-92 <strong>11</strong>765 61863 105168 123100 54609 68491 317965 6475 20884 7800 13084 4389 4.1% 12.45 - 4.00 - 67 @<br />
1992-93 12510 64207 144145 153612 61710 91902 309156 7456 3030 26 3004 3642 1.0% 2.47 - 3.00 - 63<br />
1993-94 12867 70745 141320 177824 70285 107539 374786 9410 10195 20 10175 5020 2.7% 7.91 - 4.00 - 65<br />
1994-95 13694 128338 <strong>11</strong>5569 217084 81595 135489 568312 <strong>11</strong>967 45141 13246 31895 8068 5.6% 23.29 - 6.00 - 104<br />
1995-96 24182 217400 128097 294239 96980 197259 790967 16444 76072 23070 53002 14300 6.7% 21.92 - 6.00 - 100<br />
1996-97 25588 339169 253717 385<strong>11</strong>6 <strong>11</strong>7009 268107 1012843 20924 100046 23810 76236 22067 7.5% 30.40 - 8.00 - 143<br />
1997-98 25588 349930 330874 487073 141899 345174 736279 25924 32880 3414 29466 15484 4.0% <strong>11</strong>.51 - 5.50 - 147<br />
1998-99 25590 350505 344523 569865 165334 404531 659395 28132 10716 970 9746 8520 1.5% 3.81 - 3.00 - 147<br />
1999-00 25590 349822 300426 581233 182818 398415 896<strong>11</strong>4 34261 7520 400 7120 7803 0.8% 2.78 - 2.50 - 147<br />
2000-01 25590 299788 299888 591427 209067 382360 816422 34737 (50034) 0 (50034) 0 - (18.45) - - - 127<br />
2001-02 31982 214524 230772 591006 243172 347834 891806 35468 (10921) (5548) (5373) 0 - (1.98) - - - 77 @<br />
2002-03 31983 227733 145831 608<strong>11</strong>4 271307 336807 1085874 36213 51037 21026 300<strong>11</strong> 14430 2.8% 9.38 - 4.00 - 81<br />
2003-04 35683 323677 125977 627149 302369 324780 1555242 38260 129234 48200 81034 31825 5.2% 24.68 - 8.00 - 102 @<br />
2004-05 36179 374960 249542 715079 345428 369651 2064866 45016 165190 41495 123695 51715 6.0% 34.38 - 12.50! - <strong>11</strong>4 @<br />
2005-06 38287 515420 293684 892274 440151 452123 2429052 52094 205338 52450 152888 56778 6.3% 40.57 - 13.00 - 145 @<br />
2006-07 38541 648434 400914 <strong>11</strong>28912 489454 639458 3206467 58629 257318 65972 191346 67639 6.0% 49.76 - 15.00 - 178 @<br />
2007-08 38554 745396 628052 1589579 544352 1045227 33577<strong>11</strong> 65231 257647 54755 202892 65968 6.0% 52.64 - 15.00 - 203 @<br />
2008-09 51405 <strong>11</strong>71610 1316556 2085206 625990 1459216 2949418 87454 101376 1250 100126 34570 3.4% 22.70 23.20 6.00 6.50 238 **<br />
2009-10 57060 1439487 1659454 2364896 721292 1643604 4021755 103387 282954 58946 224008 99194 5.6% 42.37 42.87 15.00 15.50 262 ^<br />
<strong>2010</strong>-<strong>11</strong> 63771 1937559 1589875 2594188 846625 1747563 5231923 136077 219652 38470 18<strong>11</strong>82 146703 3.5% 30.28 30.78 20.00 20.50 315 ^^<br />
Notes :<br />
@ On increased capital base due to conversion of Bonds / Convertible Debentures / Warrants / FCCN into shares.<br />
$ On increased capital base due to issue of Bonus Shares. Net Worth excludes ordinary dividends.<br />
`<br />
* Equivalent to a face value of `10/- per share.<br />
# Includes Interim Dividend where applicable.<br />
+ Including on Bonus Shares issued during the year.<br />
! Includes a special dividend of `2.50 per share for the Diamond Jubilee Year.<br />
++ On increased capital base due to Rights issue and conversion of FCCN into shares.<br />
^ On increased capital base due to GDS issue and conversion of FCCN into shares.<br />
^^ On increased capital base due to QIP issue and conversion of FCCN into shares.<br />
137
<strong>Tata</strong> <strong>Motors</strong> Awards list <strong>2010</strong>-<strong>11</strong><br />
1. <strong>Tata</strong> <strong>Motors</strong> broke into the Fortune Global<br />
500, an annual ranking of the world’s<br />
largest corporations, for the year <strong>2010</strong>,<br />
with a rank of 442.<br />
2. <strong>Tata</strong> <strong>Motors</strong> received The Most Respected<br />
Company of 20<strong>11</strong> in the Automobiles<br />
Sector Award from Union Finance Minister<br />
Pranab Mukherjee.<br />
3. <strong>Tata</strong> <strong>Motors</strong> was ranked the 2 nd among<br />
four- wheelers in The Economic Times<br />
Brand Equity ‘Most Trusted Brands’ survey<br />
<strong>2010</strong>.<br />
4. Mr. Ravi Kant received the Golden<br />
Peacock Corporate Award for Business<br />
Leadership – <strong>2010</strong> for his outstanding<br />
contribution in transforming <strong>Tata</strong> <strong>Motors</strong>.<br />
5. CNBC TV18 conferred Mr. C.<br />
Ramakrishnan with the award of Indian<br />
Industry’s Best CFO, in the CNBC TV18<br />
CFO Award <strong>2010</strong>.<br />
6. <strong>Tata</strong> Nano bagged the Gold Prize in the<br />
<strong>2010</strong> Edison Awards in the Best New<br />
Product segment under the<br />
Transportation category.<br />
7. <strong>Tata</strong> Nano’s design received world’s<br />
oldest and coveted GOOD DESIGN TM<br />
Award for <strong>2010</strong>, in the category of<br />
transportation.<br />
8. <strong>Tata</strong> Nano received the Best Car<br />
Advertisement of the year in the<br />
Bloomberg UTV | Autocar India Awards<br />
20<strong>11</strong>.<br />
9. <strong>Tata</strong> Aria bagged NDTV Viewers’ Choice<br />
Car of the Year Award in the NDTV Car<br />
and Bike Awards 20<strong>11</strong>.<br />
10. <strong>Tata</strong> Magic won Pitch’s India Top 50<br />
Marketers award.<br />
<strong>11</strong>. Indica Vista EVX, bagged the Most<br />
Economic Small Passenger EV and the<br />
Most Economical & Environment Friendly<br />
Small Passenger EV under the Small<br />
Passenger EV Category at the inaugural<br />
RAC (Royal Automobile Club) Brighton to<br />
London Future Car Challenge.<br />
12. <strong>Tata</strong> <strong>Motors</strong>, CVBU was awarded with the<br />
Golden Peacock Award for Occupational<br />
Health and Safety for the year <strong>2010</strong> by the<br />
Golden Peacock Award Jury, under the<br />
Chairmanship of Justice P. N. Bhagwati,<br />
former Chief Justice of India and Member<br />
of UN Human Rights Commission.<br />
13. <strong>Tata</strong> Hispano received the Silver Bus<br />
Award from the Spanish Public Transport<br />
Corporation in recognition of its long<br />
association as the best bodybuilder of its<br />
fleet, with almost 300 buses.<br />
14. CVBU Customer Support division won the<br />
prestigious Indian Achievers – Excellence<br />
in Customer Satisfaction Award 20<strong>11</strong> by<br />
the Indian Achievers Forum.<br />
15. Delhi Government appreciates <strong>Tata</strong><br />
<strong>Motors</strong> bus service during Commonwealth<br />
Games.<br />
16. Range Rover Evoque won the Best<br />
Production Car Award in the <strong>2010</strong> Car<br />
Design News, Car Design of the Year<br />
awards.<br />
17. Land Rover’s Freelander 2 and Discovery<br />
4 models won the Auto Express <strong>2010</strong> New<br />
Car Awards, with the Freelander 2 winning<br />
Best Compact SUV and the Discovery 4<br />
bagging Best Large SUV.<br />
18. Jaguar Land Rover was awarded<br />
National Standard of Excellence for<br />
community investment by Business in the<br />
Community, in recognition of Jaguar<br />
Land Rover’s considerable investment in<br />
community programmes, including five<br />
Education Business Partnership Centres,<br />
employee volunteering programmes,<br />
national educational initiatives and a<br />
wide range of community partnership.<br />
138
Registered Office: Bombay House, 24, Homi Mody Street, Mumbai - 400 001.<br />
Attendance Slip<br />
Members attending the Meeting in person or by Proxy are requested to complete the attendance slip and hand it over at the entrance<br />
of the meeting hall.<br />
I hereby record my presence at the SIXTY-SIXTH ANNUAL GENERAL MEETING of the Company at Birla Matushri Sabhagar, 19,<br />
Sir Vithaldas Thackersey Marg, Mumbai-400 020 at 3.00 p.m. on Friday, August 12, 20<strong>11</strong>.<br />
..................................................................................................................................................................................... .............................................................................<br />
Full name of the Member (in block letters)<br />
Signature<br />
Folio No.: ............................................................ DP ID No.* ................................................................... Client ID No.* ....................................................................<br />
*Applicable for member holding shares in electronic form<br />
..................................................................................................................................................................................... .............................................................................<br />
Full name of the proxy (in block letters)<br />
Signature<br />
NOTES : 1. Member/Proxyholder wishing to attend the meeting must bring the Attendance Slip to the meeting.<br />
2. Member/ Proxyholder desiring to attend the meeting should bring his copy of the Annual Report for reference at the meeting.<br />
Registered Office: Bombay House, 24, Homi Mody Street, Mumbai - 400 001.<br />
Proxy Form<br />
I/We ................................................................................................................................................................................................................................................................................<br />
of ......................................................................................................................... in the district of .............................................................................................................. being<br />
a Member/ Members of the above named Company hereby appoint ................................................................................................................................................<br />
.................................................................. of .................................................................. in the district of .............................................................................................or failing<br />
him/her .................................................................................... of ................................................................... in the district of ..........................................................................<br />
............. as my/our Proxy to attend and vote for me/us and on my/our behalf at the Sixty-sixth Annual General Meeting of the Company, to be<br />
held on Friday, August 12, 20<strong>11</strong> or at any adjournment thereof.<br />
Signed this .................................................. day of ...................................................... 20<strong>11</strong><br />
Folio No.: ............................................................ DP ID No.* ............................................................. Client ID No.* .........................................................................<br />
* Applicable for members holding shares in electronic form<br />
No. of Ordinary Shares ...................... Signature<br />
Affix<br />
Revenue<br />
Stamp<br />
No. of ‘A’ Ordinary Shares ......................<br />
This form is to be used<br />
** in favour<br />
** against<br />
of the resolution. Unless otherwise instructed, the Proxy will act as he thinks fit.<br />
**Strike out whichever is not desired.<br />
NOTES : (i) The Proxy must be returned so as to reach the Registered Office of the Company at Bombay House, 24, Homi Mody Street,<br />
Mumbai - 400 001, not less than FORTY-EIGHT HOURS before the time for holding the aforesaid meeting.<br />
(ii) Those members who have multiple folio with different jointholders may use copies of this Attendance Slip/Proxy.