Results Presentation Q4 FY 13 - Tata Motors
Results Presentation Q4 FY 13 - Tata Motors
Results Presentation Q4 FY 13 - Tata Motors

You also want an ePaper? Increase the reach of your titles
YUMPU automatically turns print PDFs into web optimized ePapers that Google loves.
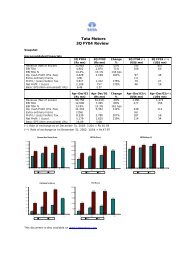
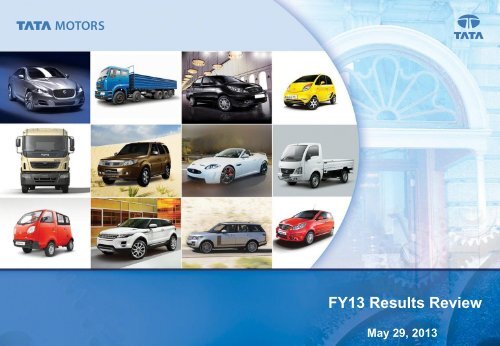
<strong>FY</strong><strong>13</strong> <strong>Results</strong> Review<br />
May 29, 20<strong>13</strong>
<strong>Tata</strong> <strong>Motors</strong><br />
Statements in this presentation describing the objectives, projections, estimates and expectations of the Company i.e.<br />
<strong>Tata</strong> <strong>Motors</strong> Ltd and its direct and indirect subsidiaries and its associates may be “forward looking statements” within<br />
the meaning of applicable securities laws and regulations. Actual results could differ materially from those expressed<br />
or implied. Important factors that could make a difference to the Company’s operations include, among others,<br />
economic conditions affecting demand / supply and price conditions in the domestic and overseas markets in which<br />
the Company operates, changes in Government regulations, tax laws and other statutes and incidental factors<br />
<strong>Q4</strong> <strong>FY</strong><strong>13</strong> represents the period from 1 st January 20<strong>13</strong> to 31 st March 20<strong>13</strong><br />
<strong>Q4</strong> <strong>FY</strong>12 represents the period from 1 st January 2012 to 31 st March 2012<br />
<strong>FY</strong> <strong>13</strong> represents the period from 1 st April 2012 to 31 st March 20<strong>13</strong><br />
<strong>FY</strong> 12 represents the period from 1 st April 2011 to 31 st March 2012<br />
Financials (other than JLR) contained in the presentation are as per Indian GAAP.<br />
JLR Financials contained in the presentation are as per IFRS as approved in the EU<br />
TDCV financials contained in the presentation are as per Korean GAAP<br />
2
Table of Contents :<br />
Consolidated Financials<br />
<strong>Tata</strong> <strong>Motors</strong> Standalone<br />
Jaguar Land Rover<br />
Other Subsidiaries<br />
Way Forward<br />
3
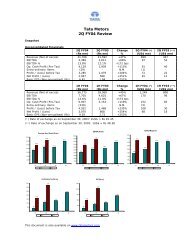
Consolidated Financials – P&L<br />
<strong>Tata</strong> <strong>Motors</strong> Consolidated<br />
Rs Crores <strong>FY</strong> <strong>13</strong> <strong>FY</strong> 12 % Change <strong>Q4</strong> <strong>FY</strong> <strong>13</strong> <strong>Q4</strong> <strong>FY</strong> 12 % Change<br />
Net Revenue 188,818 165,654 14% 56,002 50,908 10%<br />
EBITDA 26,569 23,700 12% 8,329 7,179 16%<br />
EBITDA % 14.1% 14.3% (20 bps) 14.9% 14.1% 80 bps<br />
PAT 9,893 <strong>13</strong>,517 (27%) 3,945 6,234 (37%)<br />
Jaguar Land Rover continues to drive improved business performance<br />
The Board of Directors recommended a dividend of Rs. 2 per Ordinary Share of Rs. 2/- each and Rs.<br />
2.10 per A Ordinary Share of Rs. 2/- each for <strong>FY</strong> 2012-<strong>13</strong> ( Rs 4.00 per Ordinary Share of Rs. 2/- each<br />
and Rs. 4.10 per A Ordinary Share of Rs. 2/- each in <strong>FY</strong> 2011-12 )<br />
4<br />
Net Revenue and EBITDA excludes other income<br />
Consolidated PAT is after minority interest and share of profit/(loss) in respect of associate companies.
Consolidated Financials - Balance Sheet<br />
<strong>Tata</strong> <strong>Motors</strong> Consolidated<br />
(Rs. In Crores) Mar-<strong>13</strong> Mar-12<br />
Equity and Liabilities 1,70,026 144,931<br />
Shareholders' Funds 38,007 33,006<br />
Long Term Liabilities 45,733 38,657<br />
Current Liabilities 86,286 73,268<br />
Assets 1,70,026 144,931<br />
Fixed Assets 69,484 56,2<strong>13</strong><br />
Long Term Investments 1,515 1,392<br />
Net Automotive Debt Equity as on<br />
Mar 31, 20<strong>13</strong> stood at 0.24:1<br />
Capex & product development spend<br />
Rs 20,698 crs<br />
Cash and bank balance (including<br />
mutual funds) as on Mar 31, 20<strong>13</strong> stood<br />
at Rs 28,610 crs<br />
Other Non-Current Assets 25,021 22,865<br />
Current Assets 74,006 64,461<br />
Increase in Net worth Rs 5,726 Crs,<br />
5
Standalone Business
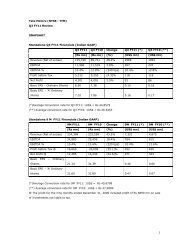
Standalone Financials – P&L<br />
<strong>Tata</strong> <strong>Motors</strong> Standalone<br />
Rs Crores <strong>FY</strong> <strong>13</strong> <strong>FY</strong> 12 % Change <strong>Q4</strong> <strong>FY</strong><strong>13</strong> <strong>Q4</strong> <strong>FY</strong>12 % Change<br />
Net Revenue 44,766 54,307 (18%) 11,068 16,391 (32%)<br />
EBITDA 2,144 4,412 (51%) 402 1,561 (74%)<br />
EBITDA % 4.8% 8.1% (330 bps) 3.6% 9.5% (590 bps)<br />
PAT 302 1,242 (76%) (312) 565 NM<br />
• Weak macro-economic environment and competitive pressures continued to impact operations<br />
• <strong>FY</strong> <strong>13</strong> Profit After Tax is after Dividend from Subsidiaries of Rs 1,584 crs (Rs 114 crores in <strong>FY</strong>12)<br />
7<br />
Net Revenue and EBITDA excludes other income.
Standalone Financials - Balance Sheet<br />
<strong>Tata</strong> <strong>Motors</strong> Standalone<br />
(Rs. In Crores) Mar-<strong>13</strong> Mar-12<br />
Equity and Liabilities 52,185 54,261<br />
Shareholders’ Funds 19,<strong>13</strong>5 19,368<br />
Net Debt Equity as on March 31, 20<strong>13</strong><br />
stood at 0.83:1<br />
Long Term Liabilities 11,945 12,755<br />
Current Liabilities 21,105 22,<strong>13</strong>8<br />
Assets 52,185 54,261<br />
Fixed Assets 20,208 19,056<br />
Long Term Investments 18,172 17,903<br />
Capex & product development spend<br />
Rs 2,991 crs<br />
Inventory days – 36<br />
Receivables days – 15<br />
Trade Payable days – 69<br />
Other Non Current Assets 3,670 3,589<br />
Current Assets 10,<strong>13</strong>5 <strong>13</strong>,7<strong>13</strong><br />
8
Commercial Vehicles :<br />
Our market share for <strong>FY</strong> <strong>13</strong><br />
stood at 59.5%<br />
<br />
Slowdown in economic activity, sluggish infrastructure<br />
spending and weak macro outlook coupled with higher<br />
operating costs for transport operators has adversely<br />
impacted demand in the MHCV industry.<br />
MHCV<br />
LCV<br />
1.1%<br />
530,204 536,232<br />
<br />
We have grown and consolidated our position in the LCV<br />
segment leading to expansion of our market share,<br />
specially in the Ace Segment<br />
<br />
Competitive intensity in a depressed market, has led to<br />
higher marketing costs<br />
(6.1)%<br />
155,672 146,206<br />
<strong>Q4</strong><strong>FY</strong>12 <strong>Q4</strong><strong>FY</strong><strong>13</strong> <strong>FY</strong>12 <strong>FY</strong><strong>13</strong><br />
Overall CV sales were supported by<br />
steep growth in the LCV segment<br />
<br />
<br />
<br />
We introduced several new products and variants across<br />
the traditional, Prima & Construck range focusing on ‘best<br />
in class performance, reliability, fuel efficiency ’.<br />
We also introduced the “<strong>Tata</strong> FleetMan Telematic<br />
Services”, an intelligent vehicle and driver management<br />
solution.<br />
We continue to focus on end customer requirements and<br />
upgrade our products and value added services and<br />
solutions.<br />
9
Passenger Vehicles :<br />
Micro<br />
Midsize<br />
Utility Vehicles<br />
Executive<br />
Compact<br />
Premium / Luxury<br />
Vans<br />
333,044<br />
(31.1)%<br />
<br />
<br />
<br />
Overall domestic Passenger vehicles industry declined<br />
Y-oY by <strong>13</strong>% during <strong>Q4</strong> <strong>FY</strong> <strong>13</strong>, and was flattish in <strong>FY</strong><br />
<strong>13</strong>,<br />
However, the SUV segment showed robust growth,<br />
mainly supported by new launches.<br />
Passenger Cars declined due to weak sentiments and<br />
high cost of ownership.<br />
229,325<br />
<br />
Pressures on marketing costs continued through the<br />
year.<br />
112,470<br />
(64.9)%<br />
Our Market share for <strong>FY</strong> <strong>13</strong> stood at 8.9%<br />
<br />
We have reduced our pipeline inventory through<br />
focused network actions.<br />
39,428<br />
<br />
We continued our focus on building brand strengths,<br />
refreshed products, enhanced sales and service<br />
experience.<br />
<strong>Q4</strong> <strong>FY</strong>12 <strong>Q4</strong> <strong>FY</strong><strong>13</strong> <strong>FY</strong>12 <strong>FY</strong><strong>13</strong><br />
10<br />
Source: SIAM & Company data.<br />
Note: Data includes JLR & Fiat; ‘Premium/Luxury’ includes Jaguar vehicles sold in India; ‘Utility Vehicles’ includes ‘Land Rover<br />
vehicles sold in India ,‘Vans’ - <strong>Tata</strong> Venture.
Exports :<br />
Exports were supported by markets like Nepal, Thailand, South Africa and MENA countries, while our<br />
larger markets, Sri Lanka & Bangladesh continued to decline.<br />
PVBU<br />
CVBU<br />
63,105<br />
(19.3)%<br />
50,938<br />
17,877<br />
(36.1)%<br />
11,422<br />
<strong>Q4</strong> <strong>FY</strong> 12 <strong>Q4</strong> <strong>FY</strong> <strong>13</strong> <strong>FY</strong> 12 <strong>FY</strong> <strong>13</strong><br />
11
<strong>Tata</strong> <strong>Motors</strong> Standalone – Highlights<br />
• Highest ever sales of the Ace family at over 325,000 during <strong>FY</strong> <strong>13</strong>. The <strong>Tata</strong> Ace family crossed<br />
1,000,000 sales since launch<br />
• Expansion of market share in the LCV segment by 200 basis points to 62.2% in <strong>FY</strong><strong>13</strong><br />
• Jamshedpur plant rolled out its 2,000,000 th truck<br />
• Introduced 6 first-of-its-kind Heavy trucks designed and built specifically to offer best-in-class<br />
performance, reliability, fuel efficiency<br />
• We introduced a new look, stylish, tech-savvy best-in-class flagship passenger vehicles<br />
showrooms, for superior customer experience at pilot dealerships in Mumbai and Delhi and will<br />
now be replicated to other setups across the country<br />
• Launch of the new Safari Storme, the Manza Club class and the Vista D90 focusing on moving<br />
the brand upwards while making it relevant for the younger buyer.<br />
12
Jaguar Land Rover
Jaguar Land Rover Financials – P&L<br />
Jaguar Land Rover<br />
£ millions <strong>FY</strong> <strong>13</strong> <strong>FY</strong> 12 Change <strong>Q4</strong> <strong>FY</strong><strong>13</strong> <strong>Q4</strong> <strong>FY</strong>12 Change<br />
Net Revenue 15,784 <strong>13</strong>,512 17% 5,053 4,144 22%<br />
EBITDA 2,402 2,027 19% 856 605 42%<br />
EBITDA % 15.2% 15.0% 20 bps 16.9% 14.6% 230 bps<br />
PBT 1,675 1,507 11% 508 530 (4%)<br />
PAT 1,215 1,481 (18%) 378 696 (46%)<br />
<strong>FY</strong> <strong>13</strong> demonstrated continued strong Revenue and EBITDA performance supported by volume growth, richer<br />
market mix and favourable operating foreign exchange<br />
Higher EBITDA is partially offset by increase in Depreciation and Amortisation and exchange revaluation on<br />
loans, resulting in a lower PBT growth<br />
PBT is offset by a higher tax charge, which is a consequence of the recognition of a deferred tax asset in <strong>FY</strong>12<br />
<strong>FY</strong> <strong>13</strong> positive free cash flow GBP 595 m after £2,048m after spending on Capex and Product development.<br />
As per IFRS<br />
Note : Net Revenue excludes other income<br />
14
Jaguar Land Rover Financials – Balance Sheet<br />
Jaguar Land Rover<br />
(GBP millions) Mar-<strong>13</strong> Mar-12<br />
Equity and Liabilities 12,837 10,217<br />
Shareholders’ Funds 3,539 2,924<br />
Non-Current Liabilities 3,301 2,252<br />
Current Liabilities 5,997 5,041<br />
Assets 12,837 10,217<br />
Non-Current Assets 6,628 4,982<br />
Current Assets 6,209 5,235<br />
Cash and financial deposits stood at<br />
GBP 2,847 m. Undrawn committed<br />
lines at GBP 865 m<br />
Gross Debt stood at GBP 2,167 m<br />
YTD Capex & product development<br />
spend GBP 2,048 m<br />
<strong>FY</strong><strong>13</strong> Positive free cash flow<br />
GBP 595 m post above spend<br />
As per IFRS<br />
15
Jaguar Land Rover – Wholesale Volumes and Market Mix :<br />
Continued strong overall<br />
volume growth<br />
18.3%<br />
314,433<br />
372,062<br />
<br />
<br />
<br />
<strong>FY</strong> <strong>13</strong> volume growth reflects<br />
strong demand, recent<br />
product actions and growth<br />
in China<br />
Recent Product actions<br />
contributing to volume growth<br />
are –<br />
All new Range Rover<br />
Overseas<br />
16.8%<br />
Asia Pacific<br />
4.9%<br />
China Region<br />
21.4%<br />
<strong>FY</strong><strong>13</strong><br />
North<br />
America<br />
17.5%<br />
Europe<br />
21.2%<br />
UK<br />
18.3%<br />
18.7%<br />
98,021<br />
116,340<br />
<br />
<br />
XF Sportbrake<br />
AWD and smaller engine<br />
options for XF and XJ<br />
<strong>FY</strong>12<br />
<strong>Q4</strong> <strong>FY</strong>12 <strong>Q4</strong> <strong>FY</strong><strong>13</strong> <strong>FY</strong>12 <strong>FY</strong><strong>13</strong><br />
Defender<br />
Freelander<br />
Range Rover Sport<br />
XF<br />
XK<br />
F Type<br />
Discovery<br />
Range Rover<br />
Range Rover Evoque<br />
XJ<br />
New Range Rover<br />
<br />
Range Rover Evoque<br />
continues to show strong<br />
momentum with <strong>FY</strong><strong>13</strong> sales<br />
116,291 units<br />
Overseas<br />
17.1%<br />
Asia Pacific<br />
4.6%<br />
China Region<br />
17.3%<br />
Europe<br />
22.8%<br />
North<br />
America<br />
18.5%<br />
UK<br />
19.7%<br />
16
Jaguar Land Rover - Highlights :<br />
Y-o-Y Revenue growth of 17% with continued strong demand from China.<br />
EBITDA margin at 15.2% for <strong>FY</strong><strong>13</strong> reflective of:<br />
- wholesale volume increase<br />
- more favourable foreign exchange (eg average $:£ rate from 1.60 in <strong>FY</strong>12 to 1.58 in <strong>FY</strong><strong>13</strong>)<br />
- richer product mix supported by launch of new Range Rover<br />
- richer market mix supported by continued growth in China<br />
Free cash flow for the <strong>FY</strong> <strong>13</strong> is £ 595 m, post capex and product development spend of £ 2,048 m<br />
Cash, bank balances and liquid mutual funds - £2.85 billion; Undrawn committed facilities of £ 0.9 billion<br />
as on March 31, 20<strong>13</strong><br />
Equity dividend of £150m was paid to <strong>Tata</strong> <strong>Motors</strong> during <strong>FY</strong> <strong>13</strong><br />
All New Range Rover received several awards including The Sunday Times – “Worlds Top SUV”; Top Gear<br />
- “Luxury Car of the Year 2012”; What Car? - “Luxury Car of the Year 20<strong>13</strong>”<br />
Jaguar F-TYPE was declared the 20<strong>13</strong> World Car Design of the Year at the New York International Auto<br />
Show.<br />
17
Other Subsidiaries
Other Key Subsidiaries :<br />
<strong>Tata</strong> <strong>Motors</strong> Finance *<br />
<strong>Tata</strong> Technologies<br />
(Rs. Crores) <strong>FY</strong><strong>13</strong> <strong>FY</strong>12<br />
Net Revenue 2,890 2,097<br />
Op. Margin % 16.0% 17.3%<br />
PAT 309 240<br />
(Rs. Crores) <strong>FY</strong><strong>13</strong> <strong>FY</strong>12<br />
Net Revenue 1,995 1,643<br />
EBITDA % 19.2% 17.1%<br />
PAT 301 208<br />
<strong>Tata</strong> Daewoo #<br />
(KRW bn) <strong>FY</strong><strong>13</strong> <strong>FY</strong>12<br />
Net Revenue 824 763<br />
EBITDA % 3.1% 4.2%<br />
PAT (9) 2<br />
TML Drivelines Ltd.<br />
(Rs. Crores) <strong>FY</strong><strong>13</strong> <strong>FY</strong>12<br />
Net Revenue 402 628<br />
EBITDA % 40.8% 56.0%<br />
PAT 79 190<br />
After considering a one time provision as required under Korean GAAP in<br />
consequence of a court judgment which is being contested.<br />
Further details on our subsidiaries are available in the Business review on our website<br />
Note: Net revenue excludes ‘Other Income’ except for <strong>Tata</strong> <strong>Motors</strong> Finance Ltd<br />
* For <strong>Tata</strong> <strong>Motors</strong> Finance Ltd, Operating Margin % is post Net Interest charges;<br />
# As per Korean Gaap<br />
19
Way Forward
Way Forward - <strong>Tata</strong> <strong>Motors</strong> :<br />
<br />
<br />
<br />
<br />
External environment and overall economic activities remain stressed, resulting in the overall demand<br />
continuing to remain under pressure, mainly for the MHCV segment<br />
Demand in the SCV segment remains strong<br />
Competitive intensity resulting in higher marketing costs.<br />
Continue to leverage on our strengths, which cover:<br />
<br />
<br />
<br />
<br />
<br />
Strong understanding of the domestic market<br />
Wide and compelling product portfolio<br />
Strong Brand and Customer support<br />
Wide spread distribution network,<br />
Economies of scale<br />
<br />
Continue to upgrade our products, value added services & solutions for our end customers.<br />
21
Way Forward - <strong>Tata</strong> <strong>Motors</strong> :<br />
<br />
Several initiatives under aggressive implementation in the passenger car business to achieve performance<br />
improvement<br />
<br />
<br />
<br />
<br />
Regular product refresh plans in pipeline<br />
Customer experience and engagement<br />
Distribution expansion and improving effectiveness<br />
Cost effectiveness and quality enhancement initiatives<br />
<br />
<br />
Future Products in pipeline during <strong>FY</strong><strong>13</strong> - Variants from Prima range, Ultra range of LCV, ACE variants,<br />
Nano variants, refreshed car models across the portfolio<br />
Extend export potential for our products<br />
22
Way Forward – Jaguar Land Rover :<br />
<br />
<br />
<br />
<br />
<br />
<br />
<br />
Continuing focus on both refreshed and new Jaguar and Land Rover products.<br />
Continuing to build sales momentum in <strong>FY</strong> 14 with the new Range Rover, Jaguar XF Sportbrake and other<br />
new derivatives, and successfully launching Jaguar F- TYPE and New Range Rover. Diesel hybrid Range<br />
Rover is currently being developed<br />
Continue to focus on profitable volume growth, managing costs and improving efficiencies to sustain the<br />
growth momentum<br />
Planned investments in future new products and technologies to meet customer aspirations and regulatory<br />
environmental standards.<br />
Grow our manufacturing footprint in China<br />
Generate strong operating cash flows to support capex and product development<br />
Capital spending for <strong>FY</strong> <strong>13</strong>-14 in the region of £2.75 billion<br />
The All-New Range Rover<br />
F-TYPE – World Car<br />
Design of the year<br />
All new Range Rover<br />
Sport<br />
Engines – investing in new<br />
engine facility<br />
23
<strong>Tata</strong> <strong>Motors</strong> - Contact Information :<br />
Analyst <strong>Presentation</strong> & Business Review is available on our website<br />
http://www.tatamotors.com/investors/investors.php<br />
For Institutional Investors :<br />
Vijay B Somaiya<br />
Head of Investor Relations & Treasury<br />
Tel : +91 22 6665 7258<br />
vbs@tatamotors.com;<br />
Or email us on ir_tml@tatamotors.com<br />
For Retail Investors & HNI :<br />
Hoshang Sethna<br />
Company Secretary<br />
Tel: +91 22 6665 7824<br />
hks@tatamotors.com<br />
Or email us on inv_rel@tatamotors.com<br />
24