Savills 12 Cities Report
Live/Work Index
Live/Work Index

Create successful ePaper yourself
Turn your PDF publications into a flip-book with our unique Google optimized e-Paper software.
A question of cost<br />
Which city has overtaken<br />
Hong Kong as the world’s<br />
most expensive? p6<br />
Passing ‘Go’<br />
Why getting people to<br />
and from work is key<br />
to economic growth. p8<br />
Relative values<br />
How the price of residential<br />
property affects the ability<br />
to attract the best staff. p<strong>12</strong><br />
<strong>Savills</strong> world<br />
research<br />
h2/2014<br />
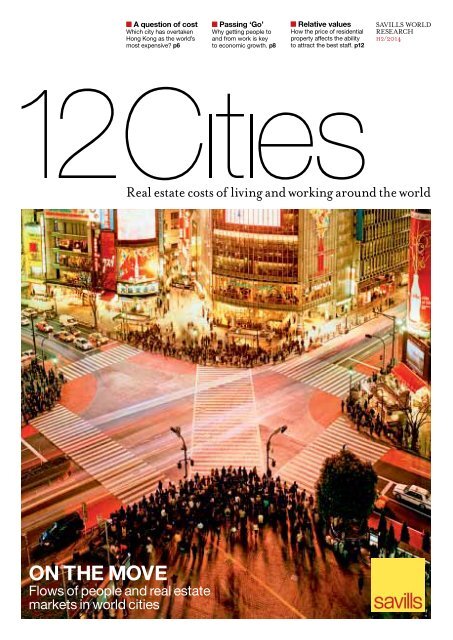
Real estate costs of living and working around the world<br />
On the move<br />
Flows of people and real estate<br />
markets in world cities
2<br />
welcome<br />
<strong>Cities</strong> on<br />
the move<br />
Understanding the real estate markets of our <strong>12</strong> cities<br />
means getting to know their physical natures and<br />
personalities as much as their pricing regimes. Each<br />
city contains numerous layers of infrastructure that<br />
help to create city character. In our last issue we started to<br />
examine one aspect of this infrastructure – street patterns and<br />
population densities of each city. In this issue, we have put the<br />
public transport systems of our cities under the microscope.<br />
Although just one aspect of a city’s personality, these arteries<br />
play a significant role in determining the way that people interact<br />
and how they can use a city.<br />
The extent, speed and cost of transport infrastructure can<br />
dictate very different lifestyles for citizens and shape the longerterm<br />
economy of a city, as well as affecting environmental health<br />
through factors such as air pollution, walkability and noise.<br />
Sometimes, lack of affordable transport creates long and difficult<br />
journeys to work and play. In other instances, good transport can<br />
shrink a city by putting people in touch with far-flung<br />
neighbourhoods and disparate workplaces, bringing them<br />
together and enabling a city to function at its full potential.<br />
As we turn our eyes toward 2020 and ponder the future<br />
trends that will shape our world cities, the legacy of past<br />
infrastructure investments will either cloud the horizon or<br />
brighten it. Those responsible for shaping cities now should be<br />
aware of how their strategies will affect urban life in the future.<br />
The cities that have turned their backs on walkable and intense<br />
streetscapes, common to most pre-automobile cities across the<br />
world, may find that compensating for this loss comes at great<br />
financial, human and environmental cost. There will be additional<br />
pressures on transit systems. The cost and adequacy of these<br />
could determine a city’s longer-term prosperity.<br />
The rest of this report looks at the shorter term. It examines<br />
how new forces have changed the ranking of real estate costs<br />
and values in our cities. It also shows what different economic,<br />
geopolitical and natural events have occurred over the time that<br />
we have been monitoring these markets, and identifies what<br />
factors may continue to shape them in the near future.<br />
‘Lack of<br />
affordable<br />
transport<br />
creates long<br />
and difficult<br />
journeys<br />
to work<br />
and play’<br />
YOLANDE BARNES<br />
Director, <strong>Savills</strong><br />
World Research<br />
ybarnes@savills.com<br />
Twitter: @Yolande_Barnes<br />
H2 2014<br />
savills.com
3<br />
contents<br />
4-5 6-7 8-11<br />
topline<br />
Real estate trends in different<br />
sectors: student, farmland<br />
and supercommuters<br />
savills live/work index<br />
The shifts in our live/work city<br />
rankings and why London is the<br />
world’s most expensive city<br />
transport infrastructure<br />
Why getting people to and from<br />
their work is essential to a city’s<br />
economic growth<br />
<strong>12</strong>-13<br />
14-15<br />
16-17<br />
residential values<br />
Often a city’s residential prices will<br />
be as much an attractor for the best<br />
staff as a company itself<br />
residential rents<br />
Vibrant city experiences and<br />
employment relocations are driving<br />
prime residential rental markets<br />
global trends<br />
The past 10 years have seen the<br />
real estate markets being interlinked<br />
and shaped by global forces<br />
18-25<br />
26<br />
city profiles<br />
An exclusive insight into what the<br />
future holds for the world’s most<br />
dynamic and influential cities<br />
outlook<br />
All the fun of the fair: Real estate<br />
prospects for the next five years<br />
fall into five categories<br />
<strong>12</strong> <strong>Cities</strong> online<br />
For additional content, please visit:<br />
www.savills.com/twelvecities<br />
cover: Gallery stock<br />
research methodology<br />
In order truly to compare the cost of residential and<br />
commercial real estate across different global cities,<br />
we use the <strong>Savills</strong> Executive Unit (SEU), which<br />
measures the cost of housing an identical group of<br />
people living and working in different countries.<br />
The people who make up our SEU include one<br />
middle-aged expat CEO, one senior expat director,<br />
a locally employed director and four locally employed<br />
administrative staff. They each live in different types of<br />
household and each member of the group chooses<br />
different types of locations and different types of property<br />
in which to live.<br />
To measure office costs, we place the same seven<br />
people in an office of a small financial services firm and<br />
again in a creative start-up – each located in the most<br />
appropriate district for their industry type.<br />
H2 2014<br />
savills.com
4 5<br />
topline<br />
Snapshot of three interesting global real estate trends<br />
student housing<br />
Student housing has grown into an<br />
exciting new global asset class<br />
Amobile and globalised student<br />
population spawns a new<br />
investment class in student<br />
accommodation. New wealth<br />
has fuelled the numbers of Asian students<br />
seeking an English-language education<br />
worldwide and there’s pressure for limited<br />
quality accommodation in many cities, which<br />
means attractive investor returns.<br />
In mature markets, student housing looks<br />
distinctly counter-cyclical; one of the bestperforming<br />
sectors during the global<br />
financial crisis (see fig. 1).<br />
The business of providing purpose-built,<br />
professionally rented student accommodation<br />
is established in the US and is maturing in<br />
the UK, but other countries are earlier on<br />
the investment curve. This offers investors<br />
new opportunities. Australia benefits from<br />
English language and proximity to fastgrowing<br />
Asian markets. So student housing<br />
has expanded rapidly in the past decade,<br />
but supply and vacancy rates are low, forcing<br />
rents up. Germany, France and the<br />
Fig. 1: Global investment into student<br />
housing (deals greater than $7.5m)<br />
Total investment into student housing (millions)<br />
US<br />
$8,000<br />
$7,000<br />
$6,000<br />
$5,000<br />
$4,000<br />
$3,000<br />
$2,000<br />
$1,000<br />
$0<br />
UK<br />
Global<br />
2007 2008 2009 2010 2011 2013 2013<br />
Source: RCA<br />
Below: The student<br />
accommodation<br />
sector is expanding.<br />
Above right: Global<br />
agricultural returns are<br />
set to continue.<br />
Fig. 2: Five major UHNWI city pairs<br />
Los Angeles<br />
New York<br />
Source: <strong>Savills</strong> World Research, Wealth X<br />
Netherlands are at an early stage of<br />
development with very limited quantities of<br />
student housing provision.<br />
We foresee the major emerging student<br />
housing markets of the Netherlands, France<br />
and Germany combined could eventually be<br />
worth an additional $0.75 billion per annum<br />
over the next 20 years.<br />
See: Spotlight on World Student Housing 2014<br />
www.savills.co.uk/research<br />
supercommuters<br />
Supercommuters are choosing to<br />
work and live in two locations<br />
Ultra high net worth individuals<br />
(UHNWIs) fall into two<br />
distinct groups when choosing<br />
where to live. There are the<br />
‘Dispersers’, who set up residence in glorious<br />
isolation or return to their various hometown<br />
roots. Then there are the ‘Agglomerators’,<br />
who cluster in particular hotspots around the<br />
globe, including world cities.<br />
Most ultra-wealthy households have<br />
more than one home and their international<br />
business and leisure interests mean that these<br />
very often span continents. Consequently,<br />
London<br />
Monaco<br />
Singapore<br />
Jakarta<br />
Sydney<br />
Alamy, Getty Images, Shutterstock<br />
commuting for this group takes on a whole<br />
new meaning.<br />
An analysis of UHNWI real estate<br />
holdings reveals that there are five main<br />
‘supercommuting’ routes that are well<br />
travelled by UHNWIs on a regular basis,<br />
often in private jets, as they move between<br />
homes (see fig. 2). London, thanks to its<br />
convenient time zone, culture and<br />
cosmopolitan character, is often the nexus of<br />
these home hubs.<br />
In Europe, the London to Monaco route<br />
is a well-worn one and likely to become<br />
more so as Monaco’s status as both tax haven<br />
and leisure destination increases. Meanwhile,<br />
historic and cultural ties are apparent in the<br />
Sydney to London and London to Mumbai<br />
(or Delhi) supercommutes.<br />
New York acts as a US hub between<br />
Europe, through London, and the Pacific<br />
rim, through LA. There are also many<br />
internal North American supercommutes<br />
between centres of leisure and business. That<br />
they are so contained within the US is<br />
testament to the sheer variety of environments<br />
and cities available there.<br />
Many Asian supercommute pairings<br />
combine leisure or homeland with a business<br />
safe haven for newly created wealth. The<br />
Singapore to Jakarta axis is a good example of<br />
this, while Shenzhen to Hong Kong provides<br />
residents with a foothold in both mainland<br />
China and trade-friendly Hong Kong.<br />
See: Spotlight on The World in London 2014<br />
www.savills.co.uk/research<br />
Global farmland<br />
Investors are looking for income in<br />
developing farmland markets<br />
Agricultural land has long been<br />
considered a ‘safe haven’ asset,<br />
like gold, resilient during times<br />
of economic uncertainty.<br />
Investors are now broadening their horizons<br />
to new global agriculture markets with an<br />
eye on greater income returns.<br />
Asian diets have become more westernised<br />
and this is also underpinning the demand for<br />
farmland globally.<br />
The <strong>Savills</strong> Global Farmland Index<br />
shows capital annualised growth since<br />
2002 of 20%, with the highest growth<br />
recorded in the emerging markets of<br />
Romania, Hungary, Poland, Zambia, Brazil<br />
and Mozambique. The star performer over<br />
the 10 years to 20<strong>12</strong> was Romania, where<br />
average farmland values grew by almost 40%<br />
per year (see fig. 3).<br />
These returns have encouraged investment<br />
but infrastructure is key to success. Values are<br />
highest where there is access to ports,<br />
highways and railroads, aiding distribution<br />
and maximising farm profits.<br />
Access to a natural water supply and<br />
irrigation systems is also a key factor as is the<br />
regulatory environment which varies<br />
significantly by country.<br />
Some western agricultural markets have<br />
been saturated with lifestyle investors and<br />
this has pushed pure agriculturalists to search<br />
for real income returns, underpinned by crop<br />
yield. We expect this search for global<br />
agricultural returns to continue.<br />
See: <strong>Savills</strong> Internationals Farmland Focus<br />
2014<br />
www.savills.co.uk/research<br />
Fig. 3: Annualised capital<br />
growth of farmland values by<br />
country (US$ per hectare,<br />
2002 to 20<strong>12</strong>)<br />
Annualised capital growth per ha<br />
0% 5% 10% 15% 20% 25% 30% 35% 40%<br />
FRANCE<br />
DENMARK<br />
GERMANY<br />
UNITED STATES<br />
IRELAND<br />
CANADA<br />
UNITED KINGDOM<br />
AUSTRALIA<br />
NEW ZEALAND<br />
GLOBAL INDEXED AVERAGE<br />
ZAMBIA<br />
POLAND<br />
BRAZIL<br />
MOZAMBIQUE<br />
HUNGARY<br />
ROMANIA<br />
Source: USDA, Eurostat and<br />
various data estimates<br />
H2 2014<br />
savills.com<br />
H2 2014<br />
savills.com
6<br />
7<br />
live<br />
WORK<br />
A question<br />
of cost<br />
London has overtaken Hong Kong as the<br />
most expensive world city<br />
The big story this year is that<br />
Hong Kong has ceased to be<br />
the most expensive of our <strong>12</strong><br />
cities in which to rent living<br />
and working space (see fig. 4). It had<br />
previously topped the ranking for the<br />
past five years. A combination of falling<br />
residential rents and, most importantly,<br />
a weakening currency, has increased cost<br />
competitiveness in the city. This means<br />
London is the most expensive city in<br />
which to accommodate staff. Working<br />
against London has primarily been<br />
sterling’s appreciation against the US<br />
dollar, up until June 2014. This, coupled<br />
with significant increases in office rents,<br />
has pushed up London’s total costs in<br />
dollar terms.<br />
Despite its climb in the rankings,<br />
London is still a way off the record<br />
live/work cost set by Hong Kong in<br />
2011 at $<strong>12</strong>8,000 per annum.<br />
New York stands third, up one spot<br />
over 2008. Modest falls in residential<br />
rents in the first part of 2014 have been<br />
offset by strong rental increases in the<br />
office markets. Paris, in spite of modest<br />
increases in costs since 2008, now sits<br />
fourth in the rankings, outperformed<br />
by London, Hong Kong and New York<br />
in recent years. However, Paris is still<br />
the most expensive city for tech<br />
companies, beating even London.<br />
Space for creatives in the French<br />
capital is simply in shorter supply than<br />
for the finance industry.<br />
In Tokyo, improving economic<br />
conditions in Japan have spurred rental<br />
rises, pushing up Tokyo’s live/work<br />
costs by 3.6% in dollar terms over the<br />
past six months.<br />
But Tokyo’s competitive position<br />
has been helped by the depreciation of<br />
the yen, so costs for our SEU are now<br />
on a par with Singapore. Compared to<br />
2008, Tokyo’s live/work costs have<br />
fallen 23%, pushing it from third to<br />
fifth in our rankings.<br />
The ‘golden confluence’ of<br />
improving economy, rising rents and<br />
better competitiveness makes the city<br />
increasingly attractive to investors,<br />
especially those seeking income.<br />
At the other end of the table,<br />
comparatively affordable Rio de Janeiro<br />
and Sydney have seen significant<br />
increases in live/work costs since 2008,<br />
up 86% and 58% respectively. Mumbai<br />
23 %<br />
Fall of Tokyo’s live/work costs<br />
since 2008<br />
has seen costs fall 21% in dollar terms,<br />
as India’s economic growth faltered<br />
over the period.<br />
Mid-table Dubai, meanwhile, has<br />
seen volatile live/work costs that are<br />
currently 16% below their 2008 levels.<br />
This makes the emirate more affordable<br />
on the global stage than it was at the<br />
height of the boom.<br />
As global interest in the city<br />
increases, total costs have grown by<br />
25% in the year to June 2014 alone, so<br />
Dubai’s advantages may be short-lived<br />
if this continues.<br />
<strong>Savills</strong><br />
Live/Work Index<br />
Businesses occupy<br />
different spaces in different<br />
buildings and these<br />
change from city to city<br />
– even if they are occupied<br />
by the same company.<br />
Similar-sized companies in<br />
different industries may<br />
also occupy very different<br />
spaces in the same city.<br />
This means that headline<br />
comparisons of grade A<br />
rents per square metre are<br />
inadequate. Office workers<br />
in the finance sector are<br />
more likely to be densely<br />
packed into a small unit in<br />
Tokyo, but take far greater<br />
space in Dubai, for<br />
example. To build a true<br />
picture, a variety of<br />
property and locations<br />
should be taken into<br />
consideration.<br />
Employers are also<br />
interested in the cost of<br />
living accommodation for<br />
their workers. This is<br />
particularly relevant as<br />
upward pressure on wages<br />
may be stronger in<br />
locations where the<br />
residential cost of<br />
accommodation is high. It<br />
will also be easier to attract<br />
the best staff in the most<br />
liveable, vibrant and<br />
stimulating living spaces.<br />
The <strong>Savills</strong> Executive<br />
Unit (SEU) measure of<br />
accommodation costs<br />
takes all this into account,<br />
as well as additional costs<br />
such as local taxes and<br />
rates. We think this is a<br />
more effective measure of<br />
city competitiveness and<br />
value for real estate.<br />
Gallery stock<br />
$130,000<br />
$<strong>12</strong>0,000<br />
$110,000<br />
$100,000<br />
$90,000<br />
$80,000<br />
$70,000<br />
$60,000<br />
$50,000<br />
$40,000<br />
$30,000<br />
$20,000<br />
$10,000<br />
$0<br />
Live/work cost per employee per year<br />
Fig. 4:<br />
savills<br />
live/work<br />
index<br />
The past six years have seen<br />
significant shifts in our<br />
live/work city rankings<br />
Rio de<br />
Janeiro<br />
Shanghai<br />
Mumbai<br />
Sydney<br />
Dubai<br />
Moscow<br />
Singapore<br />
London<br />
New York<br />
Tokyo<br />
Paris<br />
Hong Kong<br />
2008<br />
live/work<br />
cost<br />
change<br />
2008-2014<br />
39 % tokyo<br />
london<br />
hong<br />
0 %<br />
kong<br />
new<br />
18 % york<br />
5 % paris<br />
-23 % singapore<br />
-5 %<br />
-1 % mumbai<br />
58 % sydney<br />
-16 % moscow<br />
25 % dubai<br />
shanghai<br />
rio de<br />
86 % janeiro<br />
-21 %<br />
London<br />
Hong Kong<br />
New York<br />
2014<br />
Paris<br />
Tokyo<br />
Singapore<br />
Moscow<br />
Sydney<br />
Dubai<br />
Shanghai<br />
Rio de Janeiro<br />
Mumbai<br />
$130,000<br />
$<strong>12</strong>0,000<br />
$110,000<br />
$100,000<br />
$90,000<br />
$80,000<br />
$70,000<br />
$60,000<br />
$50,000<br />
$40,000<br />
$30,000<br />
$20,000<br />
$10,000<br />
$0<br />
H2 2014<br />
savills.com<br />
H2 2014<br />
savills.com
8 9<br />
special World<br />
report cities<br />
index<br />
On the move<br />
Transport is key to economic growth, especially<br />
when it comes to getting people to and from work<br />
More than 15 billion journeys<br />
per annum are made across<br />
the combined metro systems<br />
of our <strong>12</strong> cities. These are<br />
vital pieces of infrastructure that enable<br />
cities to function and grow. But the scale<br />
and function of transport systems, and the<br />
way they are used by local residents, varies<br />
significantly around the globe.<br />
Early stages of the metro<br />
The first underground railway in the<br />
world, the Metropolitan Railway, was<br />
opened in London in 1863 and<br />
revolutionised transport in the capital.<br />
The network has since expanded to 270<br />
stations over 402km of track. The system<br />
has shaped the urban fabric of London,<br />
with whole new suburbs created by the<br />
expansion of the underground into<br />
‘metroland’, putting central London<br />
employment within reach of homeowning<br />
classes. The mobility that<br />
London’s underground network provides<br />
has been integral in transforming London<br />
into a pre-eminent world city.<br />
Today’s metro<br />
Today, underground or metro networks,<br />
and associated transport infrastructure,<br />
are the oil in the cogs of the world’s great<br />
cities. These systems are constantly being<br />
expanded and updated to meet the needs<br />
of dynamic modern cities. Some, such as<br />
London, Paris and New York, have wellestablished<br />
systems, dating back 100<br />
years or more. Others have introduced<br />
this infrastructure in recent years as their<br />
populations have increased. Fast-growing<br />
Shanghai has only had a metro system<br />
since 1993 but is already the world’s<br />
largest by system length. The first phase of<br />
Mumbai’s metro only opened this year.<br />
Despite being one of the newest<br />
systems, Shanghai’s metro is the most<br />
heavily used, with 2.5 billion journeys<br />
taken each year. The highest ridership per<br />
kilometre of track is Rio de Janeiro’s<br />
metro, where 9.8 million ride each year<br />
per km (see fig. 5). However, this small<br />
network is focused on the high-volume<br />
central districts (the entire system is just<br />
41km in length).<br />
The development of technology and<br />
advances in engineering mean newer<br />
metros run faster than older ones.<br />
Commute times<br />
Based on the public transport commutes<br />
of our <strong>Savills</strong> Executive Unit (SEU), the<br />
average times on older transport networks<br />
are double that of the newest on a per<br />
kilometre basis (see fig. 6).<br />
These commute times say as much<br />
about the locations in which different<br />
employees choose to live as it does about<br />
the nature of the transport networks (see<br />
fig. 7). In New York, where staff favour<br />
living more centrally, the average commute<br />
is just 19 minutes. By contrast, the more<br />
dispersed nature of Rio, Mumbai and<br />
Shanghai means that people spend longer<br />
commuting, despite faster travel times on<br />
a per kilometre basis. Here, administration<br />
level staff live far from the centre, priced<br />
out of the best neighbourhoods and<br />
reflecting income inequality.<br />
Dubai is characterised by relatively<br />
long average travel distances (16km on<br />
average), but journeys take less than 45<br />
minutes on average. The Dubai metro,<br />
having opened in 2009, has significantly<br />
reduced commute times in the city.<br />
However, driving is still the favoured<br />
mode of transport because fuel is cheap.<br />
The way to work<br />
Not everyone in our world cities takes<br />
public transport. CEOs in Shanghai and<br />
Moscow are more likely to be chauffeur<br />
driven to the office, while their peers in<br />
New York may use a car service. Local<br />
employees in the early stages of their<br />
careers will commonly take public<br />
transport across all cities. Those working<br />
in creative industries, however, are more<br />
likely to cycle or take the bus than their<br />
counterparts in the finance sector, who<br />
tend to stick to the subway.<br />
Gallery stock, getty images<br />
421<br />
The number of stations on the<br />
New York metro network,<br />
more than any other city<br />
1863<br />
The year London’s Metropolitan<br />
Railway began operating,<br />
making it the world’s oldest<br />
underground system<br />
538km<br />
The operating route length of<br />
the Shanghai Metro – the<br />
world’s longest<br />
Fig. 5 Metro system<br />
City<br />
Shanghai<br />
London*<br />
New York<br />
Moscow<br />
Tokyo<br />
Paris<br />
Hong Kong<br />
Singapore<br />
Dubai<br />
Rio de Janeiro<br />
Mumbai<br />
Sydney<br />
System length<br />
(km)<br />
538<br />
436<br />
373<br />
325<br />
304<br />
214<br />
175<br />
153<br />
75<br />
41<br />
11<br />
0<br />
Annual ridership<br />
(billions)<br />
2.5<br />
1.3<br />
1.7<br />
2.5<br />
2.4<br />
1.5<br />
1.6<br />
1.0<br />
0.1<br />
0.4<br />
N/A**<br />
N/A***<br />
*Including the DLR<br />
**Mumbai’s metro system opened in 2014, full-year stats unavailable<br />
***Sydney does not have an underground rail system<br />
Source: City transport authorities / <strong>Savills</strong> World Research<br />
Ridership per<br />
km of track<br />
(millions)<br />
4.6<br />
2.8<br />
4.5<br />
7.6<br />
7.7<br />
7.2<br />
9.1<br />
6.6<br />
1.4<br />
9.7<br />
N/A**<br />
N/A***<br />
Began<br />
operation<br />
1993<br />
1863<br />
1904<br />
1935<br />
1927<br />
1900<br />
1979<br />
1987<br />
2009<br />
1979<br />
2014<br />
N/A***<br />
Fig. 6 Public transport travel times and age of system<br />
Average travel time per km of the SEU on<br />
public transport, minutes<br />
0<br />
1840 1860 1880 1900 1920 1940 1960 1980 2000 2020<br />
Source: <strong>Savills</strong> World Research<br />
Public transport (minutes)<br />
8<br />
7<br />
6<br />
5<br />
4<br />
3<br />
2<br />
1<br />
London<br />
Fig. 7 Average SEU public transport travel times<br />
Public transport travel time (minutes) Travel time per km (minutes)<br />
80 8<br />
Source: <strong>Savills</strong> World Research<br />
New York<br />
Paris<br />
Tokyo<br />
Moscow<br />
Metro system operation start date<br />
Shanghai<br />
Rio de Janeiro<br />
Singapore<br />
Hong Kong<br />
70 7<br />
60 6<br />
50 5<br />
40 4<br />
30 3<br />
20 2<br />
10 1<br />
0 0<br />
New York<br />
Paris<br />
Tokyo<br />
Hong Kong<br />
London<br />
Singapore<br />
Dubai<br />
Sydney<br />
Moscow<br />
Shanghai<br />
Mumbai<br />
Rio de Janeiro<br />
Mumbai<br />
Dubai<br />
Time per km (minutes)<br />
Spring H2 2014 <strong>Savills</strong>.com savills.com<br />
H2 Spring 2014 2014 savills.com <strong>Savills</strong>.com
10<br />
11<br />
special World<br />
report cities<br />
index<br />
Metro<br />
The operating transport<br />
networks and urban reach<br />
for our <strong>12</strong> world cities<br />
Hong Kong State<br />
population 7.2m<br />
Key<br />
Central transport network<br />
Secondary central network<br />
Tertiary central network<br />
Rail network<br />
Rail network terminates<br />
Scale<br />
6km<br />
Greater London<br />
population 8.3m<br />
Shanghai Municipality<br />
population 24.2m<br />
Île-de-France<br />
population 11.9m<br />
Rio de Janeiro City<br />
population 11.6m<br />
New York City<br />
population 8.4m<br />
Dubai Emirate<br />
population 2.2m<br />
Greater Mumbai<br />
population 13m<br />
Greater Sydney<br />
population 4.6m<br />
Tokyo Metropolis<br />
population 38m<br />
Singapore State<br />
population 5.4m<br />
Moscow City<br />
population <strong>12</strong>.1m<br />
Jason Pickersgill<br />
Spring H2 2014 <strong>Savills</strong>.com savills.com<br />
H2 2014 savills.com
<strong>12</strong><br />
13<br />
residential<br />
Capital<br />
values<br />
The price of residential property in world cities<br />
affects the ability of firms to attract the best staff<br />
The residential sectors of our <strong>12</strong><br />
global cities are shaped by a<br />
variety of factors. The value of<br />
mainstream residential real estate<br />
is more likely to be determined by the<br />
domestic economy, while prime property is<br />
more aligned to international forces.<br />
International businesses operating in<br />
world cities compete for a global pool of<br />
talent. For those looking to hold on to the best<br />
staff over the long term, the costs associated<br />
with purchasing or renting residential<br />
accommodation become highly relevant – as<br />
does the quality of life available in a city.<br />
Often a city will be as much an attractor<br />
of human capital as the company itself.<br />
The number, choice and characteristics of<br />
residential neighbourhoods, accessibility to<br />
work, and the cost and affordability of<br />
accommodation will all play a part in an<br />
organisation’s ability to attract staff. The<br />
price of residential accommodation will also<br />
help to determine the size of salaries and<br />
allowances needed to retain that talent.<br />
The first chart on the opposite page shows<br />
the average values for the homes occupied by<br />
different household members of the <strong>Savills</strong><br />
Executive Unit (SEU) on a square foot basis<br />
(see fig. 8). The homes of the CEO and<br />
directors are considered ‘Prime’, while those<br />
of the administrative, ‘Mainstream’.<br />
Our analysis highlights the difference<br />
between Hong Kong and ‘the rest’. Prime<br />
prices in Hong Kong, at just over $4,000psft,<br />
are four times those of Dubai and more than<br />
twice those of Singapore. Space, particularly<br />
prime space, is at such a premium in this<br />
high-rise city that units are particularly small<br />
and expensive. The pressure of Chinese<br />
money on the market has pushed prices to<br />
high levels in recent years – particularly in<br />
the prime markets. Although cooling<br />
measures have slowed the top end of the<br />
market recently, Hong Kong still hosts the<br />
world’s most expensive residential real estate.<br />
prime market entry level<br />
While Hong Kong tops the ranking for<br />
mainstream values at $1,300psft, the gap<br />
between it and other cities in this sector is<br />
22.8 %<br />
The price growth in Dubai’s<br />
residential markets for H1 2014<br />
less marked, with London ($1,100psft) and<br />
New York ($1,000psft) not far behind.<br />
It is notable that in most cities there is an<br />
entry level for prime markets at or around<br />
US$1,000. Prime values rarely fall below this<br />
in developed economies. It is as if the<br />
international market and elite workforce in<br />
world cities set their own international<br />
standards. This means that domestic markets<br />
can vary from prime markets to widely<br />
differing extents.<br />
In New York, for example, the mainstream<br />
markets are little different to prime, on the<br />
other hand mainstream values in Shanghai<br />
are relatively low by global city standards<br />
($400psft) but prime property values are on a<br />
Fig. 8 Prime and mainstream<br />
residential capital values psft<br />
Prime Mainstream Price per square foot<br />
0 $1,000 $2,000 $3,000<br />
Hong Kong<br />
London<br />
Singapore<br />
Paris<br />
Shanghai<br />
Tokyo<br />
New York<br />
Moscow<br />
Dubai<br />
Sydney<br />
Mumbai<br />
Rio de Janeiro<br />
$4,000<br />
Source: <strong>Savills</strong> World Research<br />
par with Tokyo and New York ($1,500psft).<br />
This means that different types of<br />
employers will find residential prices less<br />
critical than others when choosing cities in<br />
which to locate. Those employing or seeking<br />
to attract elite employees may find some<br />
cities little different compared to others,<br />
while those employing more administrative<br />
staff will find residential costs more critical.<br />
Rio de Janeiro offers the cheapest<br />
accommodation on a price per square foot<br />
basis in both the prime ($700psft) and<br />
mainstream (less than $100psft) sectors.<br />
Properties in Rio – along with other cheaper<br />
cities – tend to be larger, thereby diluting<br />
values on a square foot basis.<br />
Sydney ranks mid-table for mainstream<br />
values ($500psft) but ranks low for prime<br />
prices per square foot ($850), largely because<br />
prime Sydney properties tend to be much<br />
bigger than their international counterparts.<br />
Here the most desirable prime properties are<br />
often very large houses, rather than citycentre<br />
flats.<br />
reputation for volatility<br />
Mid-table Dubai continues to record<br />
extremely high price growth in its residential<br />
markets, with values up 22.8% in the first<br />
half of 2014 alone (see fig. 9). Mortgage caps<br />
and the doubling of property transfer taxes<br />
from 2% to 4% appear to be having little<br />
impact on the market, perhaps because<br />
investors are aware of the fact that prices in<br />
the emirate are still 28.2% below their 2008<br />
peak and, at the same time, rents are rising<br />
substantially (<strong>12</strong>% in H1 2014). As current<br />
price rises are taking place against a relatively<br />
recent backdrop of big price falls, Dubai is<br />
likely to retain its reputation for volatility.<br />
Over the first half of 2014, London and<br />
New York’s residential markets performed<br />
strongly as recovery in the UK and US<br />
economies continued. Residential markets in<br />
both cities have been driven by domestic<br />
purchasers taking advantage of low interest<br />
rates. In both cities, strong prime markets<br />
have abated somewhat offsetting the gains at<br />
the lower end of these markets.<br />
Tokyo’s residential sector continues to<br />
gain momentum after decades in the<br />
doldrums. Capital values here were up 3.1%<br />
in the first half of 2014, more than all the<br />
growth in the seven years since 2007. In Rio,<br />
residential property continues to show price<br />
growth, but at half the rates seen just four<br />
years ago. Meanwhile, inflation in Brazil is<br />
running at 6.5%, so house prices are falling in<br />
real terms.<br />
At the other end of the spectrum,<br />
Shanghai, Paris and Singapore all posted<br />
price falls over the first half of 2014. Shanghai<br />
and Singapore are both feeling the effects of<br />
government cooling measures (as is Hong<br />
Kong, but falls in the prime sector here have<br />
been offset by gains in the mainstream<br />
markets). Paris, meanwhile, continues to<br />
suffer from relatively low demand in a<br />
sluggish eurozone economy.<br />
Fig. 9 Residential price growth<br />
City capital values Rental values<br />
H1 2014 H1 2014<br />
Dubai 22.8% <strong>12</strong>.0%<br />
London 9.1% 0.9%<br />
New York 6.5% -0.1%<br />
Rio de Janeiro 5.1% 3.8%<br />
Hong Kong 3.7% -2.4%<br />
Mumbai 3.1% 2.0%<br />
Tokyo 3.1% 1.4%<br />
Moscow 1.4% 1.5%<br />
Sydney 1.1% 1.0%<br />
Shanghai -0.4% 0.6%<br />
Paris -1.7% 0.1%<br />
Singapore -4.2% -3.5%<br />
Source: <strong>Savills</strong> World Research<br />
Plainpicture<br />
H2 2014<br />
savills.com<br />
H2 2014<br />
savills.com
14<br />
15<br />
residential<br />
Yielding to<br />
change<br />
Vibrant city experiences and employment<br />
relocations are helping to drive prime<br />
residential rental markets<br />
Index 2005 = 100<br />
Rental markets are driven by<br />
occupier rather than investor<br />
demand and have had a far less<br />
turbulent time than the sales<br />
markets over recent years. The <strong>Savills</strong><br />
World City Rental Index has appreciated<br />
by 55.5% since 2005, less than half the<br />
growth seen in our Residential Capital<br />
Value Index over the same period, which<br />
is up by <strong>12</strong>1.8% (see fig. 10). Sustained<br />
levels of capital value growth over and<br />
above rental growth have reduced yields,<br />
from a global average of 5.3% in 2007 to<br />
4.4% at H1 2014.<br />
Income-seeking investors are now<br />
targeting their activity in select markets.<br />
New York has already enjoyed increased<br />
demand for investable stock, although<br />
Fig. 10 Residential rents and<br />
capital values of <strong>12</strong> cities<br />
240<br />
220<br />
200<br />
180<br />
160<br />
140<br />
<strong>12</strong>0<br />
100<br />
0<br />
World City Capital Values<br />
World City Rents<br />
Dec 05<br />
Jun 06<br />
Dec 06<br />
Jun 07<br />
Dec 07<br />
Jun 08<br />
Dec 08<br />
Jun 09<br />
Dec 09<br />
Jun 10<br />
Dec 10<br />
Jun 11<br />
Dec 11<br />
Jun <strong>12</strong><br />
Dec <strong>12</strong><br />
Jun 13<br />
Source: <strong>Savills</strong> World Research<br />
Dec 13<br />
Jun 14<br />
entry points are limited (given the<br />
dominance of cooperatives in this<br />
market). Yields in Paris are rising and<br />
canny foreign investors are taking<br />
advantage of a weak domestic market to<br />
snap up suitable properties.<br />
In London, yields are reducing as<br />
capital values outpace rents. However,<br />
higher-yielding outer London and<br />
secondary locations are growing in<br />
attractiveness due to huge occupier rental<br />
demand for this kind of stock.<br />
Sub-3% yields in Hong Kong and<br />
Singapore failed to deter investors who<br />
chased capital value growth that, until<br />
recent years, had been spectacular (see fig.<br />
11). With cooling measures now in full<br />
force, these days are over and we<br />
anticipate a modest upward movement in<br />
yields in coming years as occupier and<br />
investor demand re-aligns.<br />
Corporate demand<br />
Some rental demand results from<br />
corporate relocation, which can be a key<br />
driver of the prime rental markets of the<br />
world’s top-tier cities. In the prime<br />
London residential market, for example,<br />
nearly half of all tenants rent due to<br />
employment relocation. The corporate<br />
market is also important to cities such as<br />
Hong Kong and Singapore, which have<br />
large financial services sectors and attract<br />
a significant number of workers and<br />
residents from overseas. In Mumbai,<br />
where foreigners are not allowed to<br />
purchase residential property, the rental<br />
market is the only option for, and closely<br />
linked to the success of, international<br />
corporations in that city.<br />
Traditionally, the corporate relocation<br />
market has been fuelled by the financial<br />
and insurance services sector. In 2007, for<br />
example, 50% of tenants in London<br />
worked in this sector. But sector<br />
downsizing in the wake of the global<br />
financial crisis, coupled with reduced<br />
relocations budgets, has seen these<br />
occupiers fall to just 39% of the market.<br />
The same is true of Hong Kong, which<br />
has seen the rapid consolidation of<br />
international banks dampening demand<br />
for prime rental property. The result is<br />
falling prime rents, which are forecast to<br />
drop by 15% by the end of the year.<br />
55.5 %<br />
Appreciation of <strong>Savills</strong> World City<br />
Rental Index since 2005<br />
In the place of finance sector workers<br />
are tenants employed in the information,<br />
technology, telecommunications, media<br />
and advertising sectors. In London, the<br />
same trend is evident in the growth<br />
of the tech industry around Silicon<br />
Roundabout and the recent regeneration<br />
of King’s Cross (which has attracted<br />
Google as a major tenant). The same is<br />
true of New York, where there has been<br />
vibrant tech industry growth in and around<br />
the Flatiron District, SoHo, Tribeca<br />
and Dumbo.<br />
This has fuelled both office and<br />
residential rents in these areas (Tribeca is<br />
now more pricey than Manhattan’s upper<br />
east and west sides). For tenants in these<br />
creative industries, the live/work balance<br />
is often blurred. As a result, the whole city<br />
experience has become a major driver of<br />
the success of these tech and creative<br />
hubs. The continued attractiveness,<br />
vibrancy and lure of the urban<br />
environment, as well as the availability of<br />
cheap workspace, will remain critical to<br />
the continued success of these locations.<br />
Gallery stock<br />
World City luxury hotel rates<br />
For those working in world cities<br />
for shorter periods, hotels and<br />
serviced apartments are an<br />
important part of a city’s<br />
residential offering. Short stay and<br />
medium business trips are particularly<br />
important to the luxury hotel market, in<br />
some cases competing with the prime<br />
residential rental sector.<br />
Paris has the most expensive luxury<br />
hotel rates ($836 per day) (see fig. <strong>12</strong>). As<br />
the world’s number one tourist<br />
destination, hotel rooms here are at a<br />
premium and priced accordingly.<br />
Rio de Janeiro, which has the cheapest<br />
prime rents among our world cities, ranks<br />
Fig. 11 Residential yields<br />
Yield %<br />
Moscow<br />
5.8<br />
Tokyo<br />
New York<br />
London<br />
Dubai<br />
Rio de Janeiro<br />
5.7 5.5 5.1<br />
Yield % 4.6 4.0 3.9 3.3 2.7<br />
fourth by luxury hotel rates ($408 per<br />
day). Demand for hotel accommodation<br />
has been driven by a fast-growing offshore<br />
$<br />
836<br />
Average rate per day of luxury<br />
hotels in Paris<br />
oil industry, attracting large numbers of<br />
short-term employees. This, coupled with<br />
the city’s high-profile international<br />
Paris<br />
5.0 Sydney<br />
4.8<br />
Singapore Mumbai Hong Kong Shanghai<br />
2.3<br />
Source: <strong>Savills</strong> World Research<br />
Average luxury hotel rate per day (USD)<br />
sporting events, notably the World Cup,<br />
has inflated prices for quality hotels in<br />
recent times.<br />
The same is true of Dubai, which has a<br />
major tourism and conference industry,<br />
fuelling high luxury hotel rates, third only<br />
to Paris and London. Prime rents are low<br />
by global standards, reflecting the nascent<br />
nature of that sector.<br />
At the other end of the spectrum,<br />
Shanghai has both low prime rents and<br />
low luxury hotel rates ($234 per day).<br />
Tourism here is a small sector compared<br />
with our other world cities, and hotels are<br />
targeted mainly at the price-sensitive<br />
domestic market.<br />
Fig. <strong>12</strong> Average luxury hotel rate and prime rent<br />
$900<br />
$800<br />
$700<br />
$600<br />
$500<br />
$400<br />
$300<br />
$200<br />
$100<br />
Paris<br />
Average luxury hotel rate per day<br />
London<br />
Dubai<br />
Rio de Janeiro<br />
New York<br />
Hong Kong<br />
Prime residential rent for equivalent space<br />
$80<br />
$0 $0<br />
Tokyo<br />
Moscow<br />
Singapore<br />
Sydney<br />
Shanghai<br />
Mumbai<br />
$70<br />
$60<br />
$50<br />
$40<br />
$30<br />
$20<br />
$10<br />
Source: STR Global, <strong>Savills</strong> World Research<br />
Prime residential rent (USD)<br />
H2 2014<br />
savills.com<br />
H2 2014<br />
savills.com
16 17<br />
the<br />
briefing<br />
World cities do not operate in<br />
isolation but are interlinked<br />
and heavily influenced by<br />
macroeconomic, political and<br />
social trends. They are particularly responsive<br />
to global events because each of them has an<br />
active international real estate market.<br />
Our data on the top tier of global centres<br />
dates back almost 10 years. During this time<br />
we have witnessed some dramatic shifts in<br />
global real estate markets against a turbulent<br />
economic and geo-political backdrop.<br />
We saw markets peak in many western<br />
cities during the credit-fuelled boom of the<br />
Noughties and subsequently plunge after<br />
2008 as the global financial crisis took hold.<br />
Some recovered quickly when global<br />
uncertainty pushed investors towards stable<br />
world cities, where prime real estate was<br />
seen as a safe haven commodity.<br />
A few didn’t suffer any falls in the first<br />
place as their domestic economies continued<br />
to boom. In the ‘old world’, where domestic<br />
housing markets were particularly hard<br />
hit, some cities, most notably London<br />
and New York, held up better and<br />
outperformed their country’s domestic<br />
Global<br />
trends<br />
The past 10 years have seen the<br />
real estate markets being<br />
interlinked and shaped by global<br />
getty images<br />
markets in the early recovery phase. The<br />
other big story from the past decade has<br />
been the rise – and cooling – of Asia.<br />
The most globally significant cities in the<br />
region, namely Hong Kong, Singapore and<br />
Shanghai, experienced a huge property<br />
boom, fuelled by rapid wealth generation,<br />
particularly from mainland China, at rates<br />
never seen before.<br />
The rising moneyed class sought out real<br />
estate as a repository for its new-found<br />
wealth, driving some markets to record<br />
-59 %<br />
Fall in Brent oil prices in Q4 08<br />
highs. Hong Kong was a major recipient of<br />
this mainland wealth and saw residential<br />
values double between 2008 and 20<strong>12</strong>.<br />
Property market cooling measures,<br />
including additional stamp duties on foreign<br />
buyers, mortgage caps and restrictions on<br />
additional home ownership, have since<br />
slowed these former boom towns.<br />
The rise of Asia has coincided with a<br />
global real estate sector shaped increasingly<br />
by private wealth. This wealth has driven<br />
the prime residential markets of top global<br />
cities and it has shaped the commercial<br />
sectors, too. Private buyers and funders<br />
stepped in at a time when traditional forms<br />
of bank lending were unavailable.<br />
Private wealth (including privately<br />
funded property companies and REITs)<br />
is now the leading form of finance used<br />
in half of the world’s biggest property<br />
transactions – each worth at least<br />
US$10 million.<br />
Our timeline below sets out some<br />
seminal events in the real estate markets of<br />
the top tier of global cities over recent years<br />
(see fig. 13). It paints a picture of interlinked<br />
markets shaped by global forces – a trend<br />
that is set to continue.<br />
The following pages look at the future<br />
of the real estate markets in each of our<br />
<strong>12</strong> cities as we consider some of the<br />
factors that may be shaping them in the<br />
run-up to 2020.<br />
Fig. 13 <strong>12</strong> <strong>Cities</strong> timeline<br />
2005<br />
Moscow residential<br />
values double between<br />
2005 and 2007, driven<br />
by soaring oil prices<br />
2007<br />
Residential capital<br />
values peak in<br />
London, New York,<br />
Hong Kong, Paris,<br />
Mumbai and Sydney<br />
Dec 2008<br />
Brent oil prices fall<br />
59% in a quarter<br />
Dec 2009<br />
Dubai real estate bubble<br />
bursts – residential<br />
capital values fall by<br />
55% and office rents fell<br />
by 47% in a year<br />
Nov 2010<br />
Special Stamp<br />
Duty implemented<br />
in Hong Kong to<br />
curb excessive<br />
property<br />
speculation.<br />
Residential values<br />
stand 81% above<br />
London’s<br />
Jun 2011<br />
Shanghai residential<br />
yields reach a low of<br />
2.2% as market<br />
activity hits new highs<br />
Jun 20<strong>12</strong><br />
New York residential<br />
yields peak at 6.9%<br />
Jun 2013<br />
Singapore private home<br />
sales fall by more than<br />
80% in a year as cooling<br />
measures take effect<br />
$<br />
Mar 2013<br />
Dow Jones index<br />
exceeds 2007 peak<br />
1<br />
Jun 2014<br />
London tops <strong>Savills</strong><br />
Live/Work index for the<br />
first time since its<br />
inception.<br />
London office rents<br />
stand almost 50%<br />
above their 2009 lows<br />
2005 2006 2007 2008<br />
2009<br />
2010 2011 20<strong>12</strong> 2013<br />
2014<br />
KEY:<br />
Real estate events<br />
World events<br />
Sept 2008<br />
The global economy<br />
stalls, Lehman Brothers<br />
files for bankruptcy,<br />
US Federal takeover<br />
of Fannie Mae and<br />
Freddie Mac<br />
$<br />
Mar 2009<br />
Dow Jones<br />
index reaches a<br />
trough of 6,600<br />
Oct 2009<br />
Rio de Janeiro<br />
announced as<br />
host for 2016<br />
Olympic Games<br />
Dec 2010<br />
Rio de Janeiro records<br />
40% annual growth in<br />
house prices<br />
Mar 2011<br />
Tóhoku earthquake and<br />
tsunami hits Japan<br />
Dec 2011<br />
Singapore introduces<br />
additional stamp<br />
duty for foreign<br />
buyers, charged<br />
at up to 16%<br />
of the value<br />
of the property<br />
¥<br />
Dec 20<strong>12</strong><br />
‘Abenomics’, Japan’s<br />
economic recovery<br />
model, is initiated<br />
Aug 20<strong>12</strong><br />
London hosts the 20<strong>12</strong><br />
Olympic Games<br />
Dec 2013<br />
Dubai house prices rise<br />
26% in the first six<br />
months of 2013<br />
Sept 2013<br />
Tokyo announced as host<br />
of 2020 Olympic Games<br />
H2 2014<br />
savills.com<br />
H2 2014<br />
savills.com
18<br />
19<br />
World<br />
cities<br />
index<br />
2020 vision<br />
What does the future hold for the rapidly changing global real estate<br />
market? We take a look at how our world cities will perform in 2020<br />
1<br />
london<br />
Heart of the UK economic recovery, but<br />
rising rents put pressure on affordability<br />
London is arguably the most<br />
‘international’ of the <strong>12</strong> world cities<br />
we monitor, but it risks becoming<br />
less competitive due to strong<br />
sterling and high real estate costs.<br />
Residential prices have risen 18.4%<br />
in the past year, buoyed by a strong<br />
domestic market and buyers and<br />
investors from around the world.<br />
At the heart of the UK’s economic<br />
recovery, London’s outperformance<br />
is anticipated to continue.<br />
availability of low-cost office space<br />
in and around Silicon roundabout,<br />
coupled with affordable residential<br />
accommodation, helped put the<br />
capital on the technology map.<br />
18.4 %<br />
Rise in residential prices in<br />
last year alone, according<br />
to our World <strong>Cities</strong> Index<br />
EXPERT VIEW<br />
‘We expect<br />
greater interest<br />
in higher yielding<br />
secondary<br />
locations’<br />
paul tostevin<br />
<strong>Savills</strong> World Research<br />
ptostevin@savills.com<br />
H1 2014 Since 2008<br />
Residential capital values 9.1% 67.0%<br />
Residential rents 0.9% 19.4%<br />
Office rents 2.9% 31.1%<br />
2020 vision<br />
Saturation of prime: The safe<br />
haven credentials of London real<br />
estate are well rehearsed and its<br />
best residential and commercial<br />
assets have attracted investors<br />
seeking capital growth and/or the<br />
storage of wealth. But we anticipate<br />
that investors will be motivated by<br />
income returns as prime looks fully<br />
valued. This means greater interest<br />
in higher-yielding secondary<br />
locations in Greater London.<br />
Affordability: London now tops<br />
our live/work index by costs of<br />
renting commercial and residential<br />
property. Rising rents are putting<br />
pressures on affordability, which is<br />
a threat to London’s global<br />
competitiveness. For example, the<br />
But gentrification has priced out<br />
new start-ups and the vitality of<br />
central London locations are at risk<br />
as they become too expensive for<br />
the types of occupiers that made<br />
them attractive in the first place.<br />
Infrastructure: Crossrail 1 will<br />
provide a 10% increase in London’s<br />
transport capacity, but with<br />
London’s population set to grow by<br />
another million by 2021, Crossrail<br />
2 cannot come soon enough.<br />
Crossrail 1 has already unlocked a<br />
slew of large development sites in<br />
east London and Crossrail 2 will<br />
do the same for parts of north and<br />
south London.<br />
Jason Hawkes<br />
H2 2014 savills.com H2 2014 savills.com
20<br />
21<br />
World<br />
cities<br />
index<br />
Left: Paris real<br />
estate hampered.<br />
Below: Japan sees<br />
gain in momentum.<br />
Previous page: Pressure on<br />
affordability in London.<br />
Top: Hong Kong remains<br />
expensive. Below: New York<br />
rents exceed former highs.<br />
2<br />
Hong Kong<br />
Becoming more competitive as real estate<br />
costs and the HK$ fall<br />
4<br />
Paris<br />
Current market under-performance means<br />
opportunities for international buyers<br />
Top: Paris real estate<br />
H1<br />
hampered.<br />
2014 Since<br />
Above:<br />
2008<br />
Residential capital values 3.7%<br />
Japan sees<br />
113.3%<br />
gain in<br />
Residential rents -2.4% momentum. 21.0%<br />
Office rents 0.7% 32.3%<br />
Hong Kong remains by far the<br />
most expensive city in which to buy<br />
residential property – 40% more<br />
expensive than London – but the<br />
gap is narrowing. Prime residential<br />
values have been hit hardest as<br />
cooling measures take effect, while<br />
rents are sliding due to weakening<br />
demand from the corporate sector.<br />
In the office markets, financefocused<br />
Hong Kong has suffered as<br />
firms downsize and consolidate. As<br />
rents have risen much less than<br />
capital values, a period of<br />
consolidation is required if yields<br />
are to stabilise.<br />
2020 vision<br />
Saturation of prime: Despite a<br />
recent record listing of a Victoria<br />
Peak property, at $22,600psft, prime<br />
prices fell by 2.7% in H1 2014.<br />
However, the market is polarised<br />
and the value of mainstream<br />
property has increased by 8.5%, a<br />
trend we expect to continue.<br />
Infrastructure: The government’s<br />
capital spending between 2013 and<br />
2018 is estimated to reach more<br />
than HK$70 billion per year, far<br />
exceeding the average annual capital<br />
expenditure of about HK$40<br />
billion. A 26-mile Hong Kong-<br />
Zhuhai-Macao Bridge, subway<br />
extensions and a new high-speed<br />
rail link are planned.<br />
Economy: If and when China<br />
opens up economically, Hong Kong<br />
may lose its role as China’s bridge to<br />
the wider world. There are calls to<br />
diversify Hong Kong’s economic<br />
base, dominated by financial<br />
services, tourism, trading and<br />
logistics, and professional services.<br />
H1 2014 Since 2008<br />
Residential capital values -1.7% -15.5%<br />
Residential rents 0.1% 9.1%<br />
Office rents 4.3% 15.6%<br />
Real estate in Paris has been<br />
hampered as a euro-denominated<br />
asset in a country posting relatively<br />
poor economic performance.<br />
Unlike London, the city hasn’t<br />
been able to buck the trend of its<br />
hinterland and price growth has<br />
been subdued, although office rents<br />
have continued to increase due to a<br />
lack of supply in central locations.<br />
2020 vision<br />
Investment: Investor dislike of<br />
Hollande’s government continues<br />
to be a factor in current market<br />
under-performance, but this means<br />
there are significant opportunities<br />
for international buyers to take<br />
advantage of a weak domestic<br />
market. Prime property remains<br />
cheap compared to London and<br />
prices have room to grow. Limited<br />
development opportunities in<br />
historic central Paris will keep<br />
supply constrained.<br />
Economy: Challenges lie ahead<br />
in consolidating public finances,<br />
improving competitiveness and<br />
reducing unemployment. Weak<br />
economic growth is forecast, which<br />
will bear on the city’s commercial<br />
real estate markets.<br />
Tourism: Paris is one of the<br />
world’s most popular tourist<br />
destinations, attracting 32 million<br />
visitors per year, half from overseas.<br />
In 2013, 1.4 million Chinese<br />
tourists visited Paris, with 1.8<br />
million expected in 2014 and 47%<br />
of money spent during their stay<br />
being directly on shopping. This<br />
has fuelled huge investment in the<br />
luxury retail sector, which will<br />
remain important in coming years.<br />
3<br />
new york<br />
Rents exceed former highs, but rising<br />
taxes could be a burden<br />
Top: Paris real estate<br />
H1<br />
hampered.<br />
2014 Since<br />
Above:<br />
2008<br />
Residential capital values 6.5%<br />
Japan sees<br />
35.5%<br />
gain in<br />
Residential rents -0.1% momentum. 15.7%<br />
Office rents 5.4% 10.9%<br />
5<br />
tokyo<br />
Abenomics halted fall in asset prices and<br />
real estate gains momentum<br />
H1 2014 Since 2008<br />
Residential capital values 3.1% -11.4%<br />
Residential rents 1.4% -13.4%<br />
Office rents 5.4% -15.7%<br />
New York rode out the global<br />
financial crisis better than much of<br />
the rest of the US. Prime residential<br />
prices are back at 2007 levels, while<br />
rents have exceeded former highs,<br />
underpinned by solid occupier<br />
demand (68% of households rent).<br />
New York is a key global tech city<br />
and a shift in occupier demand is<br />
shaping its corporate office market.<br />
2020 vision<br />
Rising costs: In the medium<br />
term, rising mortgage rates will<br />
dampen price growth in the<br />
residential markets. Rising taxes<br />
will also put a burden on the city’s<br />
real estate sector. New York’s mayor,<br />
Bill de Blasio, has pledged to tackle<br />
income inequality in the city and is<br />
proposing overhauling the property<br />
tax system to shift the burden to<br />
higher value property.<br />
Land supply: With more people<br />
choosing to live and work in New<br />
York, the city faces growing pressure<br />
on its limited land. The Big Apple is<br />
investing in urban renewal,<br />
supported by investment in new<br />
infrastructure. Hudson Yards,<br />
providing <strong>12</strong>.7 million sqft of office,<br />
residential and retail space, is<br />
estimated to complete in 2018.<br />
Demographic change: New<br />
York’s population is changing as<br />
the city appeals to empty nesters<br />
and families, complementing the<br />
growing ranks of young<br />
professionals. No longer a stop-gap<br />
until a move to the suburbs,<br />
occupiers are now looking for<br />
new standards of amenities. For<br />
example, there is a growing trend<br />
toward dedicated space for pets in<br />
Manhattan’s new condo schemes.<br />
getty images, plainpicture<br />
Tokyo’s real estate markets continue<br />
to gain momentum after years in<br />
the doldrums. Residential capital<br />
values alone were up 3.1% in the<br />
first half of 2014 (more than all the<br />
growth in the previous seven years),<br />
while office rents grew 5.4% over<br />
the same period. Tokyo’s main<br />
attraction is still income streams<br />
rather than capital growth, the<br />
latter limited by global standards.<br />
2020 vision<br />
Foreign investment: Foreign<br />
investors, attracted by Japan’s<br />
revived growth, will help finance<br />
new projects in the city. Crossborder<br />
investment made up 14% of<br />
investment in Tokyo’s office market<br />
in 2013, up from just 5% in 2011.<br />
Residential schemes are also<br />
attracting higher levels of foreign<br />
investment from Asian neighbours.<br />
The number of these investors is<br />
set to grow and will remain focused<br />
on income.<br />
Urban renewal: The 2020 Tokyo<br />
Olympics will help to maintain the<br />
momentum of Abenomics through<br />
the medium term. The majority of<br />
new infrastructure will be located<br />
in the Tokyo Bay area, a local<br />
catalyst for new condominium and<br />
commercial development.<br />
Domestic market: The economy<br />
in Japan is projected to follow a<br />
moderate growth trend for the<br />
foreseeable future and demand for<br />
top-quality office space is expected<br />
to remain high. An upward trend in<br />
rents is supported by robust demand<br />
across all the major industry sectors,<br />
coupled with restricted availability<br />
in many submarkets.<br />
H2 2014<br />
savills.com<br />
H2 2014<br />
savills.com
22<br />
23<br />
World<br />
cities<br />
index<br />
Below: Challenging<br />
outlook for Singapore.<br />
Right: Russia finds<br />
itself marginalised.<br />
Far right: Sydney’s<br />
prime sector values.<br />
EXPERT VIEW<br />
‘Moscow will<br />
face an<br />
increasing<br />
reliance on<br />
local money’<br />
8<br />
Sydney<br />
Investor speculation continues to<br />
push values in the prime sector<br />
H1 2014 Since 2008<br />
Residential capital values -4.2% 44.6%<br />
Residential rents -3.5% 4.6%<br />
Office rents 7.3% -31.2%<br />
6<br />
Singapore<br />
Like Hong Kong, Singapore’s<br />
prime residential markets have<br />
slowed, while the mainstream<br />
market has continued to grow,<br />
driven by domestic owner-occupier<br />
demand. Economic growth has<br />
slowed in the city state, but<br />
Singapore’s diversified economic<br />
base underpins a robust office<br />
sector. Rents increased by 7.3% in<br />
H1 2014, second only to Dubai<br />
among the cities we monitor.<br />
2020 vision<br />
Market controls: Cooling<br />
measures continue to bear on<br />
Singapore’s prime residential<br />
markets and the outlook remains<br />
challenging for the rest of 2014.<br />
Market controls are set to be a<br />
feature of Singapore over the<br />
coming years as it battles market<br />
affordability in a bid to remain<br />
competitive on the global stage.<br />
7.3 %<br />
Percentage of Singapore<br />
rent increases in H1 2014<br />
Outlook remains challenging for rest of<br />
2014 as market controls set to feature<br />
Restricted land: Limited space,<br />
increasing wealth and a growing<br />
workforce will put pressure on<br />
land. There may be more relocation<br />
of lower value industry to Malaysia,<br />
where land, property and wages are<br />
cheaper. Singapore is set to become<br />
more rarefied, with Singaporeans<br />
protected by government access to<br />
housing. Employers will find it<br />
more difficult to attract and retain<br />
young talent from abroad because<br />
of the high cost of real estate.<br />
High-tech infrastructure: With<br />
high-tech infrastructure and close<br />
proximity to some of Asia’s key<br />
growth markets, Singapore is a<br />
world leader in business and has a<br />
growing reputation in the biotech<br />
and energy sectors. According to<br />
the World Bank, Singapore<br />
ranks as number one for the ease of<br />
doing business.<br />
YOLANDE BARNES<br />
<strong>Savills</strong> World Research<br />
ybarnes@savills.com<br />
7<br />
moscow<br />
Dependence on local<br />
ultra rich market<br />
Moscow’s real estate markets are increasingly<br />
reliant on domestic demand and investment as<br />
Russia finds itself marginalised. The residential<br />
markets posted modest price increases, while<br />
the office sector, hit by falling demand from<br />
foreign occupiers, saw price falls of 8.6% in the<br />
first part of 2014.<br />
2020 vision<br />
Domestic demand: Moscow will face an<br />
increasing reliance on local money at a time<br />
when wealth generation in the country is slowing.<br />
A small pool of static, domestic, ultra rich may<br />
result in stagnation in the real estate markets.<br />
Regeneration: The legacy of industrial areas<br />
in central parts of Moscow present opportunity<br />
for redevelopment to both residential and office<br />
use. This will help to support an expansion of<br />
the city’s prime residential markets.<br />
Sporting events: The 2018 FIFA World Cup<br />
will put international eyes on Moscow and will<br />
be a catalyst for some major infrastructure<br />
improvements in the city. Nevertheless,<br />
opportunities for overseas inward investment<br />
will remain limited.<br />
H1 2014 Since 2008<br />
Residential capital values 1.4% 9.4%<br />
Residential rents 1.5% -3.9%<br />
Office rents -8.6% -2.3%<br />
Sydney’s real estate markets enjoyed<br />
growth at a time when many other<br />
western markets were falling. As a<br />
consequence, recent price<br />
movements are off a high base.<br />
Office markets were flat in the first<br />
half of 2014, after a strong 2013.<br />
Affordability in the mainstream<br />
residential markets is stretched,<br />
dampening price growth but<br />
continue to record small increases.<br />
Meanwhile, investor speculation<br />
continues to push values in the<br />
prime sector, with strength in the<br />
super-prime market.<br />
2020 vision<br />
Demographic change: While<br />
apartments have been a popular<br />
choice with downsizing and empty<br />
33.4 %<br />
Rise in Sydney’s residential<br />
rents since 2008<br />
H1 2014 Since 2008<br />
Residential capital values 1.1% 36.9%<br />
Residential rents 1.0% 33.4%<br />
Office rents 0.0% 3.1%<br />
nesters seeking to release equity,<br />
Generations X and Y are seeing<br />
apartments as a more permanent<br />
living option, supporting the rise of<br />
owner-occupier demand.<br />
Densification: ‘City’ Sydney, or<br />
high-rise property, is set to perform<br />
best over the next five years. A<br />
strong residential market is creating<br />
the expectation of capital gains,<br />
buoyed by low vacancy rates,<br />
historically low interest rates and<br />
relatively attractive yields for<br />
investors. Development investment<br />
opportunities will be focused on an<br />
intensification of the centre.<br />
Economy: Australia’s economy<br />
has cooled in recent years as Asia<br />
has slowed and global demand for<br />
raw materials has declined. Interest<br />
rate rises are on the horizon and,<br />
coupled with a slowdown in<br />
occupier demand, the market is<br />
likely to see lower levels of growth.<br />
The test will be whether Sydney<br />
opens up its real estate market<br />
further to attract overseas money.<br />
Corbis, getty images<br />
H2 2014<br />
savills.com<br />
Autumn H2 2014 2014 savills.com savills.com
24 25<br />
World<br />
cities<br />
index<br />
9<br />
dubai<br />
City’s long-term prospects more positive<br />
after a decade of boom and bust<br />
Dubai has had a turbulent time<br />
over the past decade, experiencing<br />
a boom and bust of an almost<br />
unparalleled scale. But as the city<br />
matures and finds itself better<br />
established on the world stage, its<br />
long-term prospects are looking<br />
more positive.<br />
2020 vision<br />
Geopolitics: Dubai is establishing<br />
itself as a safe haven in the Middle<br />
East. In the office sector, general<br />
political instability in the region<br />
has pushed more occupiers to<br />
Dubai, resulting in lower vacancy<br />
rates in the prime districts. But the<br />
emirate also benefits from<br />
investment from the west and is a<br />
popular second-home destination.<br />
Market regulation: Dubai may<br />
have experienced extraordinary<br />
price growth in recent years, but<br />
property values are still substantially<br />
less than in other major world<br />
Top: Paris real estate<br />
H1<br />
hampered.<br />
2014 Since<br />
Above:<br />
2008<br />
Residential capital values -0.4%<br />
Japan sees<br />
61.6%<br />
gain in<br />
Residential rents 0.6% momentum. 21.4%<br />
Office rents 0.9% 5.0%<br />
centres. The Federal Mortgage Cap<br />
(off-plan purchases are now limited<br />
to 50% of loan-to-value), coupled<br />
with a doubling of the property<br />
registration fee (albeit to a still<br />
modest 4%) is translating into a<br />
slowdown in the number of<br />
transactions recorded, bringing<br />
some market stability.<br />
Mega projects: Dubai will host<br />
World Expo 2020, which is<br />
anticipated to generate 277,000<br />
new jobs and inject US$40 billion<br />
into the economy. This has instilled<br />
confidence in the real estate markets<br />
and has kick-started major projects<br />
shelved during the global economic<br />
downturn. Palm Deira has been<br />
reborn as Deira Island, providing<br />
residential, hospitality and retail<br />
development opportunities. New<br />
schemes will be supported by major<br />
infrastructure investment, including<br />
an extension to the Dubai metro<br />
and new river crossings.<br />
10<br />
Top: Dubai is<br />
better established<br />
on world stage.<br />
Below: Price<br />
growth flat in<br />
Shanghai.<br />
Shanghai’s real estate markets have<br />
been in limbo between huge<br />
demand from domestic investors,<br />
tighter credit conditions and<br />
cooling measures designed to<br />
check the rate of price growth. As a<br />
consequence, price growth has<br />
been flat.<br />
2020 vision<br />
Economic liberalisation: A free<br />
trade zone has been established as a<br />
testing ground for a number of<br />
social and economic reforms.<br />
Change has been slow to materialise<br />
and questions remain as to how it<br />
will develop longer term. Economic<br />
growth is reliant on construction<br />
and waning activity in this sector is<br />
a risk. Longer term, the taming of<br />
Top: Paris real estate<br />
H1<br />
hampered.<br />
2014 Since<br />
Above:<br />
2008<br />
Residential capital values 22.8%<br />
Japan sees<br />
-28.2%<br />
gain in<br />
Residential rents <strong>12</strong>.0% momentum. -10.9%<br />
Office rents 14.0% -38.1%<br />
Shanghai<br />
Waning construction activity means an<br />
era of slower expansion<br />
construction ‘monster’ will bring<br />
with it a slower rate of expansion.<br />
Maturing wealth: Demand for<br />
branded luxury goods in China is<br />
showing signs of decline as tastes<br />
mature and ‘logo fatigue’ sets in. In<br />
Shanghai’s real estate market, big,<br />
bold and bling are still seen as<br />
desirable. In the longer term a<br />
demand for property that focuses<br />
on more authentically Chinese<br />
architecture may develop.<br />
City-led policy: Chinese central<br />
government is allowing local<br />
government to play a bigger part in<br />
deciding city policy. We expect to<br />
see more of this as China tests the<br />
waters with economic reform.<br />
Gallery stock, plainpicture<br />
11<br />
The real estate market in Rio de<br />
Janeiro experienced stratospheric<br />
levels of price growth in the past<br />
decade (residential values increased<br />
by more than 200% since 2008<br />
alone), fuelled by an expansion of<br />
the credit markets, growing middle<br />
classes, new employment and<br />
foreign investment. But this has<br />
slowed and government discontent<br />
is increasingly visible.<br />
2020 vision<br />
Social change: Brazil saw 40<br />
million people join the middle<br />
classes between 2005 and 2011,<br />
bringing with them huge demand<br />
for products, services and real<br />
estate. The success of the next<br />
decade will depend on meeting the<br />
needs of this group and their<br />
demands on healthcare, education,<br />
city services and, importantly,<br />
Top right: Brazil<br />
growth runs out<br />
of steam.<br />
Below: Stability<br />
returns to<br />
Mumbai.<br />
Rio de Janeiro<br />
The excitement of the World Cup is over,<br />
property markets wait for 2016 Olympic fever<br />
H1 2014 Since 2008<br />
Residential capital values 3.1% 116.4%<br />
Residential rents 2.0% 30.0%<br />
Office rents 1.2% -37.9%<br />
housing. Crowded Rio is finding<br />
new development land in its<br />
pacified favelas, but at the expense<br />
of existing residents.<br />
Infrastructure: With the World<br />
Cup over, Rio is looking to the<br />
Olympics in 2016. Accelerated<br />
infrastructure projects, which<br />
include a revitalisation of the city’s<br />
historic port district, extension of<br />
the metro system and sanitation<br />
improvements, will be a benefit.<br />
Economy: Brazil continues to<br />
suffer inflation and stagnant<br />
growth. Rising interest rates will<br />
stretch affordability in the<br />
residential markets and limit price<br />
growth. However, substantial price<br />
falls would appear unlikely given<br />
strong credit control and low levels<br />
of mortgaged indebtedness.<br />
<strong>12</strong><br />
mumbai<br />
Stability is returning to the<br />
Mumbai real estate market<br />
following May’s election. The<br />
Bharatiya Janata Party’s prodevelopment<br />
stance has brought<br />
solidity to the markets and eased<br />
uncertainty among the ex-pat<br />
community. This has translated<br />
into confidence in the real estate<br />
markets and modest price increases.<br />
2020 vision<br />
Supply: The Mumbai market has<br />
been characterised by high levels of<br />
new supply in recent years. We<br />
anticipate a rebalancing as occupier<br />
demand picks up with an<br />
improving economic outlook.<br />
Infrastructure: The first phase of<br />
the Mumbai metro opened in June<br />
2014 and carried 18.5 million<br />
passengers in its first two months.<br />
H1 2014 Since 2008<br />
Residential capital values 5.1% 218.5%<br />
Residential rents 3.8% 116.4%<br />
Office rents 0.0% 32.8%<br />
Improved confidence in real estate markets<br />
stems recent price focus<br />
When complete, the system will<br />
comprise three high-capacity<br />
metro railway lines, spanning a<br />
total of 63km. The scheme has the<br />
potential to change the dynamics<br />
of real estate in the city, and there<br />
has already been an impact on<br />
prices in neighbourhoods that will<br />
benefit from improved connectivity.<br />
Market liberalisation: The<br />
government is attempting to make<br />
India a more appealing investment<br />
destination. Limits on foreign<br />
investment in some sectors are to<br />
be lifted, while privatisation of<br />
state-held companies may be on<br />
the cards. The Indian finance<br />
ministry may introduce a regulatory<br />
framework to enable REITs to be<br />
listed in India. This would bring<br />
a new wave of capital into<br />
commercial real estate markets.<br />
H2 2014<br />
savills.com<br />
H2 2014<br />
savills.com
26<br />
outlook<br />
All the fun of the fair<br />
Will the next five years be a white-knuckle ride or a gentle circulation<br />
for real estate owners and investors?<br />
Our World <strong>Cities</strong> have had some very different<br />
experiences over the past five years and stand at<br />
different points in the property market cycle. Some<br />
‘Old World’ cities like London and New York<br />
crashed after the North Atlantic financial crisis while others,<br />
like Sydney and Singapore continued to grow steadily. Others<br />
still, like Shanghai and Rio, were not only unaffected but<br />
positively boomed. This variety of market experiences means<br />
that there are a variety of prospects for real estate owners and<br />
investors in each city. These prospects vary between commercial<br />
and residential property and between prime and mainstream<br />
residential but in general, real estate prospects for the next five<br />
years fall into five categories of varying price movements and<br />
degrees of volatility.<br />
roller<br />
coasters<br />
big wheels<br />
waltzers<br />
roundabouts<br />
swings<br />
Potentially over-valued<br />
with weak or falling<br />
rents, trending down,<br />
volatile. Some further<br />
price falls expected in<br />
next few years but<br />
following very strong<br />
recent growth.<br />
Capable of further<br />
significant rental and<br />
capital growth in the<br />
long term – provided<br />
the fundamentals<br />
of economic<br />
growth return.<br />
Shanghai<br />
Moscow<br />
Mumbai<br />
Fully valued,<br />
static prices or<br />
trending down but<br />
fundamentally stable.<br />
Lower and slower<br />
growth expected over<br />
next five years,<br />
especially in locations<br />
held back by cooling<br />
measures or weak<br />
economy/currency.<br />
London<br />
Singapore<br />
Hong Kong<br />
Paris<br />
Becoming fully valued<br />
but still rising – at<br />
slowing rates, stable.<br />
Slower growth<br />
expected over next<br />
five years.<br />
New York<br />
Sydney<br />
Recovering, still<br />
trending modestly<br />
upward. Stable.<br />
Good income returns<br />
expected over next<br />
five years with some,<br />
but not spectacular,<br />
capital growth.<br />
Tokyo......<br />
Growing strongly<br />
but volatile. Gains in<br />
the short term but<br />
risk of falls over the<br />
next five years.<br />
Dubai<br />
Rio de Janeiro<br />
Gallerystock, getty images<br />
alamy, gallery stock, getty images<br />
H2 2014<br />
savills.com
27<br />
<strong>Savills</strong> global presence<br />
over 500 offices and associates worldwide<br />
AMERICAS<br />
50<br />
OFFICES AND<br />
ASSOCIATES<br />
AMERICAS<br />
UNITED<br />
KINGDOM<br />
& IRELAND<br />
103<br />
OFFICES AND<br />
ASSOCIATES<br />
EUROPE<br />
AFRICA<br />
EUROPE<br />
57<br />
OFFICES AND<br />
ASSOCIATES<br />
MIDDLE EAST<br />
& AFRICA<br />
270<br />
OFFICES AND<br />
ASSOCIATES<br />
ASIA PACIFIC<br />
<strong>12</strong>0<br />
OFFICES AND<br />
ASSOCIATES<br />
asia pacific<br />
UNITED<br />
KINGDOM<br />
& IRELAND<br />
ENGLAND<br />
GUERNSEY<br />
IRELAND<br />
JERSEY<br />
NORTHERN<br />
IRELAND<br />
SCOTLAND<br />
WALES<br />
AMERICAS<br />
CARIBBEAN<br />
MEXICO<br />
PANAMA<br />
USa<br />
ASIA PACIFIC<br />
AUSTRALIA<br />
CHINA<br />
HONG KONG<br />
INDIA<br />
INDONESIA<br />
JAPAN<br />
MACAU<br />
MALAYSIA<br />
myanmar<br />
NEW<br />
ZEALAND<br />
PHILIPPINES<br />
SINGAPORE<br />
SOUTH KOREA<br />
TAIWAN<br />
THAILAND<br />
VIETNAM<br />
EUROPE<br />
AUSTRIA<br />
BELGIUM<br />
CROATIA<br />
FINLAND<br />
FRANCE<br />
GERMANY<br />
GIBRALTAR<br />
GREECE<br />
ITALY<br />
LUXEMBOURG<br />
MONACO<br />
MONTENEGRO<br />
NETHERLANDS<br />
NORWAY<br />
POLAND<br />
PORTUGAL<br />
RUSSIA<br />
SERBIA<br />
SPAIN<br />
SWEDEN<br />
SWITZERLAND<br />
MIDDLE EAST<br />
& AFRICA<br />
BAHRAIN<br />
KENYA<br />
MAURITIUS<br />
MOZAMBIQUE<br />
NAMIBIA<br />
OMAN<br />
QATAR<br />
SEYCHELLES<br />
SOUTH AFRICA<br />
ZAMBIA<br />
ZIMBABWE<br />
savills world research team<br />
Yolande Barnes<br />
Director<br />
+44 (0) 20 7409 8899<br />
ybarnes@savills.com<br />
Paul Tostevin<br />
Associate Director<br />
+44 (0) 20 7016 3883<br />
ptostevin@savills.com<br />
For more information, please visit: www.savills.com<br />
The <strong>12</strong> <strong>Cities</strong> report is published on behalf of <strong>Savills</strong> plc by Seven, seven.co.uk. This report is for general informative purposes only.<br />
It may not be published, reproduced or quoted in part or in whole, nor may it be used as a basis for any contract, prospectus, agreement<br />
or other document without prior consent. While every effort has been made to ensure its accuracy, neither <strong>Savills</strong> plc nor the publisher<br />
assume responsibility for effects arising from this publication. <strong>Savills</strong> and the publisher accept no liability whatsoever for any direct or<br />
consequential loss arising from its use. The content is strictly copyright and reproduction of the whole or in part in any form is prohibited<br />
without written permission from <strong>Savills</strong> research. Investment advice: The information and opinions contained in this magazine do not<br />
constitute professional advice and should not be relied upon. Specific advice relating to your individual circumstances should be obtained.<br />
H2 2014<br />
savills.com