Savills 12 Cities Report
Live/Work Index
Live/Work Index

You also want an ePaper? Increase the reach of your titles
YUMPU automatically turns print PDFs into web optimized ePapers that Google loves.
8 9<br />
special World<br />
report cities<br />
index<br />
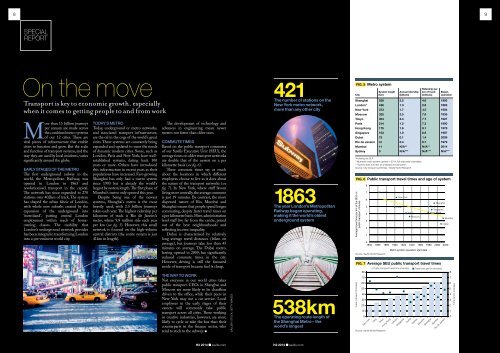
On the move<br />
Transport is key to economic growth, especially<br />
when it comes to getting people to and from work<br />
More than 15 billion journeys<br />
per annum are made across<br />
the combined metro systems<br />
of our <strong>12</strong> cities. These are<br />
vital pieces of infrastructure that enable<br />
cities to function and grow. But the scale<br />
and function of transport systems, and the<br />
way they are used by local residents, varies<br />
significantly around the globe.<br />
Early stages of the metro<br />
The first underground railway in the<br />
world, the Metropolitan Railway, was<br />
opened in London in 1863 and<br />
revolutionised transport in the capital.<br />
The network has since expanded to 270<br />
stations over 402km of track. The system<br />
has shaped the urban fabric of London,<br />
with whole new suburbs created by the<br />
expansion of the underground into<br />
‘metroland’, putting central London<br />
employment within reach of homeowning<br />
classes. The mobility that<br />
London’s underground network provides<br />
has been integral in transforming London<br />
into a pre-eminent world city.<br />
Today’s metro<br />
Today, underground or metro networks,<br />
and associated transport infrastructure,<br />
are the oil in the cogs of the world’s great<br />
cities. These systems are constantly being<br />
expanded and updated to meet the needs<br />
of dynamic modern cities. Some, such as<br />
London, Paris and New York, have wellestablished<br />
systems, dating back 100<br />
years or more. Others have introduced<br />
this infrastructure in recent years as their<br />
populations have increased. Fast-growing<br />
Shanghai has only had a metro system<br />
since 1993 but is already the world’s<br />
largest by system length. The first phase of<br />
Mumbai’s metro only opened this year.<br />
Despite being one of the newest<br />
systems, Shanghai’s metro is the most<br />
heavily used, with 2.5 billion journeys<br />
taken each year. The highest ridership per<br />
kilometre of track is Rio de Janeiro’s<br />
metro, where 9.8 million ride each year<br />
per km (see fig. 5). However, this small<br />
network is focused on the high-volume<br />
central districts (the entire system is just<br />
41km in length).<br />
The development of technology and<br />
advances in engineering mean newer<br />
metros run faster than older ones.<br />
Commute times<br />
Based on the public transport commutes<br />
of our <strong>Savills</strong> Executive Unit (SEU), the<br />
average times on older transport networks<br />
are double that of the newest on a per<br />
kilometre basis (see fig. 6).<br />
These commute times say as much<br />
about the locations in which different<br />
employees choose to live as it does about<br />
the nature of the transport networks (see<br />
fig. 7). In New York, where staff favour<br />
living more centrally, the average commute<br />
is just 19 minutes. By contrast, the more<br />
dispersed nature of Rio, Mumbai and<br />
Shanghai means that people spend longer<br />
commuting, despite faster travel times on<br />
a per kilometre basis. Here, administration<br />
level staff live far from the centre, priced<br />
out of the best neighbourhoods and<br />
reflecting income inequality.<br />
Dubai is characterised by relatively<br />
long average travel distances (16km on<br />
average), but journeys take less than 45<br />
minutes on average. The Dubai metro,<br />
having opened in 2009, has significantly<br />
reduced commute times in the city.<br />
However, driving is still the favoured<br />
mode of transport because fuel is cheap.<br />
The way to work<br />
Not everyone in our world cities takes<br />
public transport. CEOs in Shanghai and<br />
Moscow are more likely to be chauffeur<br />
driven to the office, while their peers in<br />
New York may use a car service. Local<br />
employees in the early stages of their<br />
careers will commonly take public<br />
transport across all cities. Those working<br />
in creative industries, however, are more<br />
likely to cycle or take the bus than their<br />
counterparts in the finance sector, who<br />
tend to stick to the subway.<br />
Gallery stock, getty images<br />
421<br />
The number of stations on the<br />
New York metro network,<br />
more than any other city<br />
1863<br />
The year London’s Metropolitan<br />
Railway began operating,<br />
making it the world’s oldest<br />
underground system<br />
538km<br />
The operating route length of<br />
the Shanghai Metro – the<br />
world’s longest<br />
Fig. 5 Metro system<br />
City<br />
Shanghai<br />
London*<br />
New York<br />
Moscow<br />
Tokyo<br />
Paris<br />
Hong Kong<br />
Singapore<br />
Dubai<br />
Rio de Janeiro<br />
Mumbai<br />
Sydney<br />
System length<br />
(km)<br />
538<br />
436<br />
373<br />
325<br />
304<br />
214<br />
175<br />
153<br />
75<br />
41<br />
11<br />
0<br />
Annual ridership<br />
(billions)<br />
2.5<br />
1.3<br />
1.7<br />
2.5<br />
2.4<br />
1.5<br />
1.6<br />
1.0<br />
0.1<br />
0.4<br />
N/A**<br />
N/A***<br />
*Including the DLR<br />
**Mumbai’s metro system opened in 2014, full-year stats unavailable<br />
***Sydney does not have an underground rail system<br />
Source: City transport authorities / <strong>Savills</strong> World Research<br />
Ridership per<br />
km of track<br />
(millions)<br />
4.6<br />
2.8<br />
4.5<br />
7.6<br />
7.7<br />
7.2<br />
9.1<br />
6.6<br />
1.4<br />
9.7<br />
N/A**<br />
N/A***<br />
Began<br />
operation<br />
1993<br />
1863<br />
1904<br />
1935<br />
1927<br />
1900<br />
1979<br />
1987<br />
2009<br />
1979<br />
2014<br />
N/A***<br />
Fig. 6 Public transport travel times and age of system<br />
Average travel time per km of the SEU on<br />
public transport, minutes<br />
0<br />
1840 1860 1880 1900 1920 1940 1960 1980 2000 2020<br />
Source: <strong>Savills</strong> World Research<br />
Public transport (minutes)<br />
8<br />
7<br />
6<br />
5<br />
4<br />
3<br />
2<br />
1<br />
London<br />
Fig. 7 Average SEU public transport travel times<br />
Public transport travel time (minutes) Travel time per km (minutes)<br />
80 8<br />
Source: <strong>Savills</strong> World Research<br />
New York<br />
Paris<br />
Tokyo<br />
Moscow<br />
Metro system operation start date<br />
Shanghai<br />
Rio de Janeiro<br />
Singapore<br />
Hong Kong<br />
70 7<br />
60 6<br />
50 5<br />
40 4<br />
30 3<br />
20 2<br />
10 1<br />
0 0<br />
New York<br />
Paris<br />
Tokyo<br />
Hong Kong<br />
London<br />
Singapore<br />
Dubai<br />
Sydney<br />
Moscow<br />
Shanghai<br />
Mumbai<br />
Rio de Janeiro<br />
Mumbai<br />
Dubai<br />
Time per km (minutes)<br />
Spring H2 2014 <strong>Savills</strong>.com savills.com<br />
H2 Spring 2014 2014 savills.com <strong>Savills</strong>.com