Savills 12 Cities Report
Live/Work Index
Live/Work Index

You also want an ePaper? Increase the reach of your titles
YUMPU automatically turns print PDFs into web optimized ePapers that Google loves.
6<br />
7<br />
live<br />
WORK<br />
A question<br />
of cost<br />
London has overtaken Hong Kong as the<br />
most expensive world city<br />
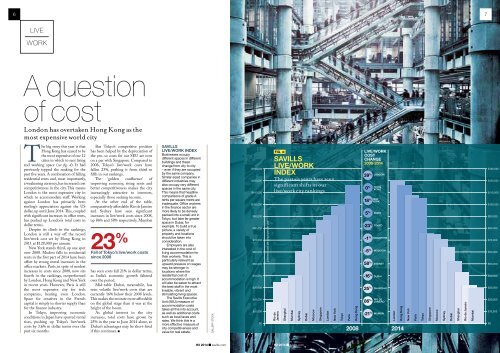
The big story this year is that<br />
Hong Kong has ceased to be<br />
the most expensive of our <strong>12</strong><br />
cities in which to rent living<br />
and working space (see fig. 4). It had<br />
previously topped the ranking for the<br />
past five years. A combination of falling<br />
residential rents and, most importantly,<br />
a weakening currency, has increased cost<br />
competitiveness in the city. This means<br />
London is the most expensive city in<br />
which to accommodate staff. Working<br />
against London has primarily been<br />
sterling’s appreciation against the US<br />
dollar, up until June 2014. This, coupled<br />
with significant increases in office rents,<br />
has pushed up London’s total costs in<br />
dollar terms.<br />
Despite its climb in the rankings,<br />
London is still a way off the record<br />
live/work cost set by Hong Kong in<br />
2011 at $<strong>12</strong>8,000 per annum.<br />
New York stands third, up one spot<br />
over 2008. Modest falls in residential<br />
rents in the first part of 2014 have been<br />
offset by strong rental increases in the<br />
office markets. Paris, in spite of modest<br />
increases in costs since 2008, now sits<br />
fourth in the rankings, outperformed<br />
by London, Hong Kong and New York<br />
in recent years. However, Paris is still<br />
the most expensive city for tech<br />
companies, beating even London.<br />
Space for creatives in the French<br />
capital is simply in shorter supply than<br />
for the finance industry.<br />
In Tokyo, improving economic<br />
conditions in Japan have spurred rental<br />
rises, pushing up Tokyo’s live/work<br />
costs by 3.6% in dollar terms over the<br />
past six months.<br />
But Tokyo’s competitive position<br />
has been helped by the depreciation of<br />
the yen, so costs for our SEU are now<br />
on a par with Singapore. Compared to<br />
2008, Tokyo’s live/work costs have<br />
fallen 23%, pushing it from third to<br />
fifth in our rankings.<br />
The ‘golden confluence’ of<br />
improving economy, rising rents and<br />
better competitiveness makes the city<br />
increasingly attractive to investors,<br />
especially those seeking income.<br />
At the other end of the table,<br />
comparatively affordable Rio de Janeiro<br />
and Sydney have seen significant<br />
increases in live/work costs since 2008,<br />
up 86% and 58% respectively. Mumbai<br />
23 %<br />
Fall of Tokyo’s live/work costs<br />
since 2008<br />
has seen costs fall 21% in dollar terms,<br />
as India’s economic growth faltered<br />
over the period.<br />
Mid-table Dubai, meanwhile, has<br />
seen volatile live/work costs that are<br />
currently 16% below their 2008 levels.<br />
This makes the emirate more affordable<br />
on the global stage than it was at the<br />
height of the boom.<br />
As global interest in the city<br />
increases, total costs have grown by<br />
25% in the year to June 2014 alone, so<br />
Dubai’s advantages may be short-lived<br />
if this continues.<br />
<strong>Savills</strong><br />
Live/Work Index<br />
Businesses occupy<br />
different spaces in different<br />
buildings and these<br />
change from city to city<br />
– even if they are occupied<br />
by the same company.<br />
Similar-sized companies in<br />
different industries may<br />
also occupy very different<br />
spaces in the same city.<br />
This means that headline<br />
comparisons of grade A<br />
rents per square metre are<br />
inadequate. Office workers<br />
in the finance sector are<br />
more likely to be densely<br />
packed into a small unit in<br />
Tokyo, but take far greater<br />
space in Dubai, for<br />
example. To build a true<br />
picture, a variety of<br />
property and locations<br />
should be taken into<br />
consideration.<br />
Employers are also<br />
interested in the cost of<br />
living accommodation for<br />
their workers. This is<br />
particularly relevant as<br />
upward pressure on wages<br />
may be stronger in<br />
locations where the<br />
residential cost of<br />
accommodation is high. It<br />
will also be easier to attract<br />
the best staff in the most<br />
liveable, vibrant and<br />
stimulating living spaces.<br />
The <strong>Savills</strong> Executive<br />
Unit (SEU) measure of<br />
accommodation costs<br />
takes all this into account,<br />
as well as additional costs<br />
such as local taxes and<br />
rates. We think this is a<br />
more effective measure of<br />
city competitiveness and<br />
value for real estate.<br />
Gallery stock<br />
$130,000<br />
$<strong>12</strong>0,000<br />
$110,000<br />
$100,000<br />
$90,000<br />
$80,000<br />
$70,000<br />
$60,000<br />
$50,000<br />
$40,000<br />
$30,000<br />
$20,000<br />
$10,000<br />
$0<br />
Live/work cost per employee per year<br />
Fig. 4:<br />
savills<br />
live/work<br />
index<br />
The past six years have seen<br />
significant shifts in our<br />
live/work city rankings<br />
Rio de<br />
Janeiro<br />
Shanghai<br />
Mumbai<br />
Sydney<br />
Dubai<br />
Moscow<br />
Singapore<br />
London<br />
New York<br />
Tokyo<br />
Paris<br />
Hong Kong<br />
2008<br />
live/work<br />
cost<br />
change<br />
2008-2014<br />
39 % tokyo<br />
london<br />
hong<br />
0 %<br />
kong<br />
new<br />
18 % york<br />
5 % paris<br />
-23 % singapore<br />
-5 %<br />
-1 % mumbai<br />
58 % sydney<br />
-16 % moscow<br />
25 % dubai<br />
shanghai<br />
rio de<br />
86 % janeiro<br />
-21 %<br />
London<br />
Hong Kong<br />
New York<br />
2014<br />
Paris<br />
Tokyo<br />
Singapore<br />
Moscow<br />
Sydney<br />
Dubai<br />
Shanghai<br />
Rio de Janeiro<br />
Mumbai<br />
$130,000<br />
$<strong>12</strong>0,000<br />
$110,000<br />
$100,000<br />
$90,000<br />
$80,000<br />
$70,000<br />
$60,000<br />
$50,000<br />
$40,000<br />
$30,000<br />
$20,000<br />
$10,000<br />
$0<br />
H2 2014<br />
savills.com<br />
H2 2014<br />
savills.com