Annual Report 2010–2011, Part 2: Financial (1.8 ... - Tourism Victoria
Annual Report 2010–2011, Part 2: Financial (1.8 ... - Tourism Victoria
Annual Report 2010–2011, Part 2: Financial (1.8 ... - Tourism Victoria

You also want an ePaper? Increase the reach of your titles
YUMPU automatically turns print PDFs into web optimized ePapers that Google loves.
NOTES TO THE FINANCIAL STATEMENTS CONTINUED<br />
30 JUNE 2011<br />
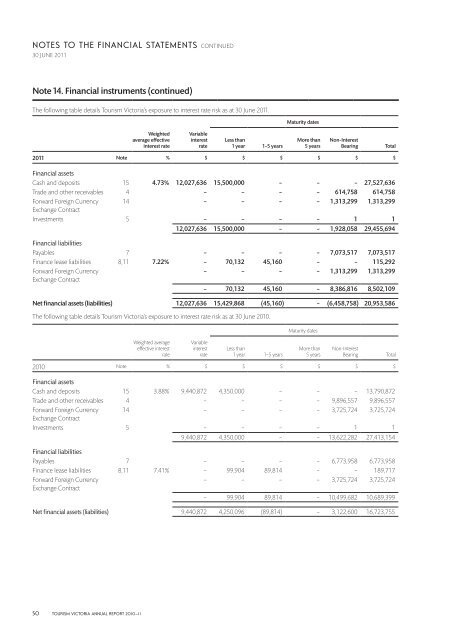
Note 14. <strong>Financial</strong> instruments (continued)<br />
The following table details <strong>Tourism</strong> <strong>Victoria</strong>’s exposure to interest rate risk as at 30 June 2011.<br />
Maturity dates<br />
Weighted<br />
average effective<br />
interest rate<br />
Variable<br />
interest<br />
rate<br />
Less than<br />
1 year 1–5 years<br />
More than<br />
5 years<br />
Non-Interest<br />
Bearing<br />
Total<br />
2011 Note % $ $ $ $ $ $<br />
<strong>Financial</strong> assets<br />
Cash and deposits 15 4.73% 12,027,636 15,500,000 – – – 27,527,636<br />
Trade and other receivables 4 – – – – 614,758 614,758<br />
Forward Foreign Currency 14 – – – – 1,313,299 1,313,299<br />
Exchange Contract<br />
Investments 5 – – – – 1 1<br />
12,027,636 15,500,000 – – 1,928,058 29,455,694<br />
<strong>Financial</strong> liabilities<br />
Payables 7 – – – – 7,073,517 7,073,517<br />
Finance lease liabilities 8,11 7.22% – 70,132 45,160 – – 115,292<br />
Forward Foreign Currency<br />
– – – – 1,313,299 1,313,299<br />
Exchange Contract<br />
– 70,132 45,160 – 8,386,816 8,502,109<br />
Net financial assets (liabilities) 12,027,636 15,429,868 (45,160) – (6,458,758) 20,953,586<br />
The following table details <strong>Tourism</strong> <strong>Victoria</strong>’s exposure to interest rate risk as at 30 June 2010.<br />
Maturity dates<br />
Weighted average<br />
effective interest<br />
rate<br />
Variable<br />
interest<br />
rate<br />
Less than<br />
1 year 1–5 years<br />
More than<br />
5 years<br />
Non-Interest<br />
Bearing<br />
Total<br />
2010 Note % $ $ $ $ $ $<br />
<strong>Financial</strong> assets<br />
Cash and deposits 15 3.88% 9,440,872 4,350,000 – – – 13,790,872<br />
Trade and other receivables 4 – – – – 9,896,557 9,896,557<br />
Forward Foreign Currency 14 – – – – 3,725,724 3,725,724<br />
Exchange Contract<br />
Investments 5 – – – – 1 1<br />
9,440,872 4,350,000 – – 13,622,282 27,413,154<br />
<strong>Financial</strong> liabilities<br />
Payables 7 – – – – 6,773,958 6,773,958<br />
Finance lease liabilities 8,11 7.41% – 99,904 89,814 – – 189,717<br />
Forward Foreign Currency<br />
– – – – 3,725,724 3,725,724<br />
Exchange Contract<br />
– 99,904 89,814 – 10,499,682 10,689,399<br />
Net financial assets (liabilities) 9,440,872 4,250,096 (89,814) – 3,122,600 16,723,755<br />
50 TOURISM VICTORIA ANNUAL REPORT 2010–11