Annual Report 2010–2011, Part 2: Financial (1.8 ... - Tourism Victoria
Annual Report 2010–2011, Part 2: Financial (1.8 ... - Tourism Victoria
Annual Report 2010–2011, Part 2: Financial (1.8 ... - Tourism Victoria

You also want an ePaper? Increase the reach of your titles
YUMPU automatically turns print PDFs into web optimized ePapers that Google loves.
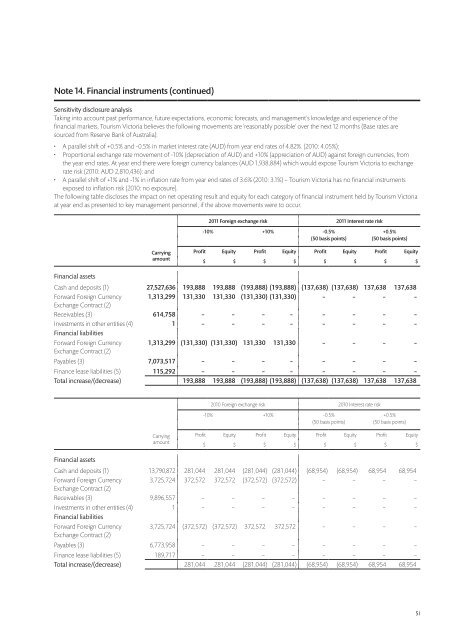
Note 14. <strong>Financial</strong> instruments (continued)<br />
Sensitivity disclosure analysis<br />
Taking into account past performance, future expectations, economic forecasts, and management’s knowledge and experience of the<br />
financial markets, <strong>Tourism</strong> <strong>Victoria</strong> believes the following movements are ‘reasonably possible’ over the next 12 months (Base rates are<br />
sourced from Reserve Bank of Australia):<br />
• A parallel shift of +0.5% and -0.5% in market interest rate (AUD) from year end rates of 4.82%. (2010: 4.05%);<br />
• Proportional exchange rate movement of -10% (depreciation of AUD) and +10% (appreciation of AUD) against foreign currencies, from<br />
the year end rates. At year end there were foreign currency balances (AUD 1,938,884) which would expose <strong>Tourism</strong> <strong>Victoria</strong> to exchange<br />
rate risk (2010: AUD 2,810,436); and<br />
• A parallel shift of +1% and -1% in inflation rate from year end rates of 3.6% (2010: 3.1%) – <strong>Tourism</strong> <strong>Victoria</strong> has no financial instruments<br />
exposed to inflation risk (2010: no exposure).<br />
The following table discloses the impact on net operating result and equity for each category of financial instrument held by <strong>Tourism</strong> <strong>Victoria</strong><br />
at year end as presented to key management personnel, if the above movements were to occur.<br />
2011 Foreign exchange risk 2011 Interest rate risk<br />
-10% +10% -0.5% +0.5%<br />
(50 basis points) (50 basis points)<br />
Carrying<br />
amount<br />
Profit Equity Profit Equity Profit Equity Profit Equity<br />
$ $ $ $ $ $ $ $<br />
<strong>Financial</strong> assets<br />
Cash and deposits (1) 27,527,636 193,888 193,888 (193,888) (193,888) (137,638) (137,638) 137,638 137,638<br />
Forward Foreign Currency 1,313,299 131,330 131,330 (131,330) (131,330) – – – –<br />
Exchange Contract (2)<br />
Receivables (3) 614,758 – – – – – – – –<br />
Investments in other entities (4) 1 – – – – – – – –<br />
<strong>Financial</strong> liabilities<br />
Forward Foreign Currency<br />
Exchange Contract (2)<br />
1,313,299 (131,330) (131,330) 131,330 131,330 – – – –<br />
Payables (3) 7,073,517 – – – – – – – –<br />
Finance lease liabilities (5) 115,292 – – – – – – – –<br />
Total increase/(decrease) 193,888 193,888 (193,888) (193,888) (137,638) (137,638) 137,638 137,638<br />
2010 Foreign exchange risk 2010 Interest rate risk<br />
-10% +10% -0.5% +0.5%<br />
(50 basis points) (50 basis points)<br />
Carrying<br />
amount<br />
Profit Equity Profit Equity Profit Equity Profit Equity<br />
$ $ $ $ $ $ $ $<br />
<strong>Financial</strong> assets<br />
Cash and deposits (1) 13,790,872 281,044 281,044 (281,044) (281,044) (68,954) (68,954) 68,954 68,954<br />
Forward Foreign Currency 3,725,724 372,572 372,572 (372,572) (372,572) – – – –<br />
Exchange Contract (2)<br />
Receivables (3) 9,896,557 – – – – – – – –<br />
Investments in other entities (4) 1 – – – – – – – –<br />
<strong>Financial</strong> liabilities<br />
Forward Foreign Currency<br />
Exchange Contract (2)<br />
3,725,724 (372,572) (372,572) 372,572 372,572 – – – –<br />
Payables (3) 6,773,958 – – – – – – – –<br />
Finance lease liabilities (5) 189,717 – – – – – – – –<br />
Total increase/(decrease) 281,044 281,044 (281,044) (281,044) (68,954) (68,954) 68,954 68,954<br />
51