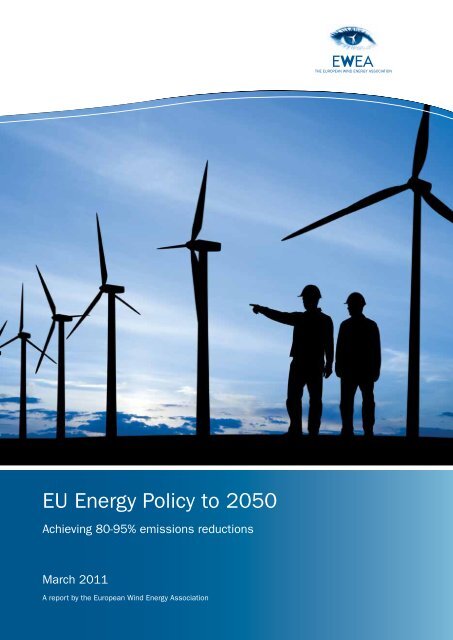
EU Energy Policy to 2050 - The European Wind Energy Association
EU Energy Policy to 2050 - The European Wind Energy Association
EU Energy Policy to 2050 - The European Wind Energy Association

Create successful ePaper yourself
Turn your PDF publications into a flip-book with our unique Google optimized e-Paper software.
<strong>EU</strong> <strong>Energy</strong> <strong>Policy</strong> <strong>to</strong> <strong>2050</strong><br />
Achieving 80-95% emissions reductions<br />
March 2011<br />
A report by the <strong>European</strong> <strong>Wind</strong> <strong>Energy</strong> <strong>Association</strong><br />
<strong>EU</strong> <strong>Energy</strong> <strong>Policy</strong> <strong>to</strong> <strong>2050</strong> - Achieving 80-95% emissions reductions<br />
1
<strong>EU</strong> <strong>Energy</strong> <strong>Policy</strong> <strong>to</strong> <strong>2050</strong><br />
Achieving 80-95% emissions reductions<br />
Contribu<strong>to</strong>rs:<br />
Justin Wilkes (<strong>Policy</strong> Direc<strong>to</strong>r, EWEA)<br />
Jacopo Moccia (Head of <strong>Policy</strong> Analysis, EWEA)<br />
Paul Wilczek (Senior Regula<strong>to</strong>ry Affairs Advisor – Grids and Internal Market, EWEA)<br />
Rémi Gruet (Senior Regula<strong>to</strong>ry Affairs Advisor – Environment and Climate Change, EWEA)<br />
Vilma Radvilaitė (Regula<strong>to</strong>ry Affairs Advisor – <strong>EU</strong> Budget & Research, EWEA)<br />
Mihaela Dragan (Regula<strong>to</strong>ry Affairs and Research Assistant, EWEA)<br />
Revision and editing: Julian Scola (Communication Direc<strong>to</strong>r, EWEA), Sarah Azau (Senior Communication Officer,<br />
EWEA)<br />
Project coordina<strong>to</strong>rs: Raffaella Bianchin (Head of IT, Web and Design, EWEA), Sarah Azau (Senior Communication<br />
Officer, EWEA)<br />
Design: www.megaluna.be<br />
Print: www.ar<strong>to</strong>os.be<br />
Cover pho<strong>to</strong>: www.iS<strong>to</strong>ckpho<strong>to</strong>.com<br />
Published in March 2011<br />
<strong>EU</strong> <strong>Energy</strong> <strong>Policy</strong> <strong>to</strong> <strong>2050</strong> - Achieving 80-95% emissions reductions<br />
3
XXX<br />
4<br />
March 2011<br />
Pho<strong>to</strong>: Gamesa
xxx<br />
Contents<br />
Executive Summary........................................................................................................................6<br />
Introduction.................................................................................................................................. 10<br />
Developing Europe’s renewable energy sec<strong>to</strong>r 1997 - 2010.................................................. 14<br />
<strong>The</strong> 1997 White Paper........................................................................................................................... 15<br />
<strong>The</strong> 2001 Renewable Electricity Directive................................................................................................ 15<br />
Renewable power installations continue <strong>to</strong> increase................................................................................ 16<br />
<strong>The</strong> decarbonisation of Europe’s energy supply........................................................................................ 17<br />
<strong>The</strong> immediate future for renewable energy in Europe <strong>to</strong> 2020............................................ 18<br />
<strong>The</strong> 2009 Renewable <strong>Energy</strong> Directive.................................................................................................... 19<br />
Converging expectations for 2020.......................................................................................................... 19<br />
<strong>The</strong> SET-Plan: the <strong>European</strong> <strong>Wind</strong> Initiative.............................................................................................. 23<br />
Beyond 2020: <strong>EU</strong> energy policy 2020 – <strong>2050</strong>......................................................................... 24<br />
Science requires 80-95% emissions reductions by <strong>2050</strong>.......................................................................... 25<br />
<strong>The</strong> real power choice: the power sec<strong>to</strong>r as a priority .............................................................................. 25<br />
<strong>The</strong> successful post-2020 combination................................................................................................... 28<br />
Transmission infrastructure, system operation and electricity market integration........................................ 29<br />
<strong>European</strong> renewable energy grid vision 2010-<strong>2050</strong>.................................................................................. 29<br />
National Renewable <strong>Energy</strong> Action Plans: quantitative analysis........................................... 36<br />
National Renewable <strong>Energy</strong> Action Plans: qualitative analysis.............................................. 50<br />
<strong>EU</strong> <strong>Energy</strong> <strong>Policy</strong> <strong>to</strong> <strong>2050</strong> - Achieving 80-95% emissions reductions<br />
5
XXX<br />
Pho<strong>to</strong>: Gamesa<br />
Executive summary
Since 1997, the <strong>European</strong> Union has had a successful<br />
renewable energy policy which has enabled significant<br />
progress <strong>to</strong> be made <strong>to</strong>wards the <strong>EU</strong>’s objectives<br />
of reducing greenhouse gas emissions, ensuring security<br />
of supply and improving <strong>EU</strong> competitiveness.<br />
Ambitious targets are at the core of the <strong>EU</strong>’s policies<br />
<strong>to</strong> promote energy from renewable sources. Due <strong>to</strong><br />
the early adoption of ambitious national and <strong>EU</strong> targets,<br />
<strong>European</strong> companies are world leaders in wind<br />
power technology, and have a leading share of the<br />
world market. As a result, Europe <strong>to</strong>day gets approximately<br />
20% of its electricity from renewable energy<br />
sources, including 5.3% from wind energy.<br />
In order <strong>to</strong> continue the development and deployment<br />
of renewable energy technologies, the <strong>EU</strong> adopted the<br />
2009 Renewable <strong>Energy</strong> Directive 1 , which included a<br />
20% renewable energy target by 2020 for the <strong>EU</strong>. In<br />
2020, according <strong>to</strong> the Renewable <strong>Energy</strong> Directive’s<br />
27 National Renewable <strong>Energy</strong> Action Plans, 34% of<br />
the <strong>EU</strong>’s <strong>to</strong>tal electricity consumption will come from<br />
renewable energy sources, including 495 TWh from<br />
wind energy meeting 14% of consumption.<br />
Importantly, expectations for wind energy and other<br />
renewables in 2020 are converging – as can be<br />
seen by comparing scenarios by EWEA, the <strong>European</strong><br />
Commission’s ‘Trends <strong>to</strong> 2030’, the <strong>European</strong> Commission’s<br />
Joint Research Centre, ENTSO-E, and the<br />
National Renewable <strong>Energy</strong> Action Plans – with renewables<br />
meeting between 32.6% and 36% of electricity<br />
consumption.<br />
Currently, the agreed framework for post-2020 consists<br />
of two elements: the Heads of States’ commitment<br />
<strong>to</strong> reduce greenhouse gas emissions by<br />
80-95% by <strong>2050</strong>, and the directive on the <strong>EU</strong> Emissions<br />
Trading System, which will continue <strong>to</strong> reduce<br />
the emissions cap for the ETS sec<strong>to</strong>rs by 1.74% each<br />
year beyond 2020.<br />
Given the difficulty in the <strong>2050</strong> timeframe <strong>to</strong> eliminate<br />
emissions in sec<strong>to</strong>rs such as transport and agriculture,<br />
achieving the Heads of States’ commitment<br />
is only certain if the power sec<strong>to</strong>r emits zero carbon<br />
well before <strong>2050</strong>.<br />
<strong>2050</strong> may seem a long time from now but in the power<br />
sec<strong>to</strong>r, <strong>2050</strong> is only one investment cycle away,<br />
which means decision makers must act <strong>to</strong>day and<br />
provide the markets with clear signals on technology<br />
choice. Due <strong>to</strong> the long lifetime of fossil fuel power<br />
plants, (35-45 years for coal and 30-35 years for<br />
gas 2 ) the commitment by Heads of State means that<br />
no new carbon-emitting power plant should be built<br />
after 2015.<br />
Necessary <strong>to</strong> achieving a zero-carbon power sec<strong>to</strong>r<br />
by <strong>2050</strong> is an <strong>EU</strong> regula<strong>to</strong>ry framework for the post-<br />
2020 period. In order <strong>to</strong> provide the power sec<strong>to</strong>r with<br />
the necessary investment stability and predictability,<br />
the <strong>EU</strong> will ideally need <strong>to</strong> decide during the course of<br />
the present Commission and Parliament – that is, by<br />
the end of 2014 – on a new regula<strong>to</strong>ry framework for<br />
the power sec<strong>to</strong>r.<br />
<strong>The</strong> <strong>EU</strong> has provided the power sec<strong>to</strong>r with a very<br />
clear trajec<strong>to</strong>ry over the next ten years. What is yet <strong>to</strong><br />
be done is for the <strong>EU</strong> <strong>to</strong> provide the power sec<strong>to</strong>r with<br />
an equally clear trajec<strong>to</strong>ry <strong>to</strong> <strong>2050</strong>.<br />
1 Directive 2009/28/EC of the <strong>European</strong> Parliament and of the Council of 23 April 2009 on the promotion of the use of energy<br />
from renewable sources and amending and subsequently repealing Directives 2001/77/EC and 2003/30/EC.<br />
2 SRU German Advisory Council on the Environment. “Climate-friendly, reliable, affordable: 100% renewable electricity supply by<br />
<strong>2050</strong>”. Statement May 2010.<br />
<strong>EU</strong> <strong>Energy</strong> <strong>Policy</strong> <strong>to</strong> <strong>2050</strong> - Achieving 80-95% emissions reductions<br />
7
Executive Summary<br />
EWEA proposes such a framework, which would have<br />
three key elements:<br />
Core post-2020 pillar: an ambitious, binding 2030<br />
target for renewable energy<br />
Given the proven success of the <strong>EU</strong> regula<strong>to</strong>ry<br />
framework for renewables since 1997, EWEA considers<br />
the most effective post-2020 regula<strong>to</strong>ry<br />
framework <strong>to</strong> be a binding 2030 renewable energy<br />
target. This would give the power sec<strong>to</strong>r a vital stepping<br />
s<strong>to</strong>ne, taking it from an expected 34% renewable<br />
electricity in 2020 <strong>to</strong> 100% renewables by <strong>2050</strong>.<br />
<strong>The</strong> <strong>EU</strong>’s renewable energy policy - the 2001 Renewable<br />
Electricity Directive and the 2009 Renewable<br />
<strong>Energy</strong> Directive - is successfully transforming<br />
our power sec<strong>to</strong>r. <strong>The</strong>refore, the most effective<br />
post-2020 framework would be <strong>to</strong> replicate the<br />
successful approach and set an ambitious, binding<br />
2030 target for renewable energy that is compatible<br />
with the necessary carbon reductions in the<br />
power sec<strong>to</strong>r.<br />
Enhancing the post-2020 framework: tightening the<br />
Emissions Trading System<br />
Any post-2020 legislative framework should include<br />
a tighter emission reduction target for the ETS <strong>to</strong><br />
reach 95% domestic greenhouse gas reductions<br />
by <strong>2050</strong>, preceded by a target of 30% domestic<br />
GHG reductions by 2020, and further domestic targets<br />
for 2030, 2040 and <strong>2050</strong> (95% reduction).<br />
It is clear that the most effective way of ensuring that<br />
the <strong>EU</strong> is able <strong>to</strong> continue reducing its greenhouse<br />
gas emissions beyond 2020 is <strong>to</strong> continue with the<br />
existing, stable, predictable and successful <strong>EU</strong> policy<br />
framework, by establishing a binding and ambitious<br />
renewable energy target for 2030. This policy should<br />
be complemented with other technology neutral policies<br />
— an ambitious EPS and ETS.<br />
Enhancing the post-2020 framework: an Emissions<br />
Performance Standard<br />
<strong>The</strong> most effective way of ensuring a carbonfree<br />
power sec<strong>to</strong>r by <strong>2050</strong> would be <strong>to</strong> ban carbon<br />
emissions from new power plants installed<br />
after 2015. <strong>The</strong> simple way <strong>to</strong> do this would<br />
be <strong>to</strong> introduce a technology neutral Emissions<br />
Performance Standard (EPS) of zero grams<br />
of CO 2<br />
/kWh for new power plants, thereby letting<br />
the market decide the most cost efficient<br />
way of delivering carbon-free primary energy.<br />
Given the challenge of developing a sufficiently<br />
flexible electricity system, the EPS could alternatively<br />
be set at around 350g CO 2<br />
/kWh in<br />
2015, equivalent <strong>to</strong> the emissions of a new gas<br />
plant. <strong>The</strong> Standard should be gradually reduced<br />
for new plants over time in order <strong>to</strong> encourage<br />
progress in gas plant technology.<br />
8<br />
March 2011
<strong>EU</strong> <strong>Energy</strong> <strong>Policy</strong> <strong>to</strong> <strong>2050</strong> - Achieving 80-95% emissions reductions<br />
9
XXX<br />
Pho<strong>to</strong>: Thinks<strong>to</strong>ck<br />
Introduction
XXX<br />
We need what <strong>European</strong> Commission President, José<br />
Manuel Barroso, called <strong>The</strong> Third Industrial Revolution:<br />
“Oil and other hydrocarbons are a limited resource,<br />
and our own internal reserves are dwindling. Today we<br />
import around 50% of our energy. By 2030 that will<br />
be nearer 70%, if we continue with current policies. At<br />
the same time, with the rise of new economic giants<br />
like China and India, global demand for these hydrocarbons<br />
is increasing (...)<br />
With its emphasis on renewable energy and a transformation<br />
<strong>to</strong> a low carbon economy, this revolution will<br />
help us <strong>to</strong> strike a major blow in the fight against climate<br />
change. At the same time, it will improve Europe’s<br />
energy security, and decrease geopolitical tensions.” 3<br />
Since then, the <strong>EU</strong> Heads of State have agreed <strong>to</strong><br />
reduce greenhouse gas emissions across the whole<br />
economy by 80-95% by <strong>2050</strong> 4 compared <strong>to</strong> 1990 levels.<br />
This will require an <strong>EU</strong> power sec<strong>to</strong>r with zero<br />
greenhouse gas emissions, well before <strong>2050</strong> because<br />
residual emissions, e.g. in agriculture and<br />
transport will be difficult or prohibitively expensive <strong>to</strong><br />
eliminate in that timeframe.<br />
Reaching a power system that does not emit carbon<br />
in 40 years is a tremendous task. However, his<strong>to</strong>ry<br />
reveals that it is possible <strong>to</strong> make dramatic changes<br />
<strong>to</strong> our energy supply structure in that timeframe,<br />
but it requires strong political signals and the right<br />
frameworks <strong>to</strong> develop, integrate and deploy new<br />
technology.<br />
Europe’s power mix changed dramatically over the past<br />
40 years (see fig 1). Four decades ago, almost half of<br />
Europe’s power came from coal, and a quarter from<br />
fuel oil. Back then natural gas was at the level that<br />
wind energy is <strong>to</strong>day, less than 3% of our power came<br />
from nuclear energy. Today we generate about one<br />
quarter of our electricity from gas, just 3% from fuel<br />
oil and, in 2009 about 20% from renewable sources.<br />
Fig 1: <strong>EU</strong>27’s evolving energy mix (% of electricity consumption)<br />
1971 Nuclear 4%<br />
2008<br />
Biomass & Waste<br />
3% Geothermal &<br />
solar & wind 4%<br />
Oil 23%<br />
Gas<br />
7%<br />
Hydro 17%<br />
Biomass<br />
& Waste<br />
0%<br />
Geothermal<br />
& solar & wind<br />
0%<br />
Nuclear 28%<br />
Hydro<br />
10%<br />
Coal 49%<br />
Coal 28%<br />
Gas 24%<br />
Oil<br />
3%<br />
1971 Calculations provided by 3E using the following sources: IEA Electricity Information (2010 Edition); IEA <strong>Energy</strong> statistics of non-OECD countries<br />
(2010 Edition); IEA CO 2<br />
emissions from fuel combustion - Annual his<strong>to</strong>rical series (1971-2008); US <strong>Energy</strong> Information administration (EIA, www.eia.<br />
doe.gov, installed capacity non OECD) 1971 (TWh 1,376).<br />
2008 Ibid 2008 (TWh 3,341)<br />
3 “Europe’s energy policy and the third industrial revolution”; Madrid 1 Oc<strong>to</strong>ber 2007.<strong>2050</strong>”. Statement May 2010.<br />
4 <strong>European</strong> Council Conclusions 29/30 Oc<strong>to</strong>ber 2009. Paragraph 7: “<strong>The</strong> <strong>European</strong> Council calls upon all Parties <strong>to</strong> embrace the<br />
2°C objective and <strong>to</strong> agree <strong>to</strong> global emission reductions of at least 50%, and aggregate developed country emission reductions<br />
of at least 80-95%, as part of such global emission reductions, by <strong>2050</strong> compared <strong>to</strong> 1990 levels; such objectives should<br />
provide both the aspiration and the yardstick <strong>to</strong> establish mid-term goals, subject <strong>to</strong> regular scientific review. It supports an <strong>EU</strong><br />
objective, in the context of necessary reductions according <strong>to</strong> the IPCC by developed countries as a group, <strong>to</strong> reduce emissions<br />
by 80-95% by <strong>2050</strong> compared <strong>to</strong> 1990 levels.”<br />
<strong>EU</strong> <strong>Energy</strong> <strong>Policy</strong> <strong>to</strong> <strong>2050</strong> - Achieving 80-95% emissions reductions<br />
11
Introduction<br />
XXX<br />
We can make significant changes <strong>to</strong> our power system<br />
over the coming 40 years if we are determined.<br />
<strong>The</strong> decommissioning of ageing coal power plants<br />
over the next 40 years, and their replacement with renewable<br />
energy power plants, will need <strong>to</strong> mirror what<br />
happened <strong>to</strong> fuel oil power plants over the last 40<br />
years - but with greater ambition and clear regula<strong>to</strong>ry<br />
certainty. One advantage available <strong>to</strong> policy makers<br />
<strong>to</strong>day is that there are many more renewable energy<br />
technologies available <strong>to</strong>day than technologies available<br />
40 years ago.<br />
Europe is debating how our energy system should<br />
look in <strong>2050</strong>. For the power sec<strong>to</strong>r, the <strong>EU</strong> commitment<br />
<strong>to</strong> reduce greenhouse gas emissions 80-95%<br />
means that it cannot emit any carbon by then. Due<br />
<strong>to</strong> the long lifetime of power plants, the commitment<br />
means that, ideally, no new carbon emitting power<br />
plant can be constructed after 2015, because it<br />
would continue <strong>to</strong> emit CO 2<br />
after <strong>2050</strong>.<br />
While it is widely acknowledged that the power sec<strong>to</strong>r<br />
must move <strong>to</strong> zero carbon emissions by <strong>2050</strong>, the direction<br />
for the period after 2020 is still unclear. Will<br />
we move <strong>to</strong> a carbon-free power system based exclusively<br />
on a mix of renewable energy sources, or do we<br />
combine these with construction of new nuclear power<br />
plants and fossil fuel plants with carbon capture<br />
and s<strong>to</strong>rage (CCS), were the technology <strong>to</strong> become<br />
available? A power system based on 100% renewables<br />
is both technologically and economically feasible<br />
<strong>to</strong> reach by <strong>2050</strong>, as several studies have shown 5 .<br />
Whether it will happen is, in the end, a matter of political<br />
decisions made over the next five years.<br />
5 <strong>The</strong> Future of the <strong>European</strong> Electricity Supply: Moving from <strong>Energy</strong>-Mix Projections <strong>to</strong> Renewables-Based Scenarios. Julia Hertin,<br />
Christian Hey and Franz Ecker (German Advisory Council on the Environment). 2010<br />
12<br />
March 2011
<strong>EU</strong> <strong>Energy</strong> <strong>Policy</strong> <strong>to</strong> <strong>2050</strong> - Achieving 80-95% emissions reductions<br />
13
XXX<br />
Pho<strong>to</strong>: <strong>Energy</strong>picturesonline<br />
Developing Europe’s renewable energy sec<strong>to</strong>r 1997 - 2010
Since 1997, the <strong>European</strong> Union has had a successful<br />
renewable energy policy which has enabled significant<br />
progress <strong>to</strong> be made <strong>to</strong>wards the <strong>EU</strong>’s objectives<br />
of reducing greenhouse gas emissions, ensuring security<br />
of supply and improving <strong>EU</strong> competitiveness.<br />
Ambitious targets are at the core of the <strong>EU</strong>’s policies<br />
<strong>to</strong> promote energy from renewable sources.<br />
Due <strong>to</strong> the early adoption of ambitious national and<br />
<strong>EU</strong> targets, <strong>European</strong> companies are world leaders<br />
in wind power technology, and have a leading share<br />
of the world market. At the end of 2010 an installed<br />
capacity of 84 GW in the <strong>EU</strong> would, in a normal wind<br />
year, produce 181 TWh, thereby supplying 5.3% of<br />
the <strong>EU</strong>’s electricity demand, and will avoid the emission<br />
of 126 million <strong>to</strong>nnes of C0 2<br />
each year.<br />
<strong>The</strong> 1997 White Paper<br />
<strong>The</strong> <strong>European</strong> Commission White Paper of 1997 on<br />
Renewable Sources of <strong>Energy</strong> 6 set the goal of doubling<br />
the share of renewable energy in the <strong>EU</strong>’s energy<br />
mix from 6% <strong>to</strong> 12% by 2010. It included a target of<br />
40,000 MW installed wind power capacity in the <strong>EU</strong> by<br />
2010, producing 80 TWh and saving 72 million <strong>to</strong>nnes<br />
of CO 2<br />
. <strong>The</strong> 40,000 MW were installed by 2005, five<br />
years ahead of the Commission’s target year. Another<br />
target of the White Paper was <strong>to</strong> increase the share<br />
of electricity from renewable energy sources (RES-E)<br />
from 337 TWh in 1995 <strong>to</strong> 675 TWh in 2010. In 2009,<br />
the latest year for which data was available, 608 TWh<br />
of electricity was produced by renewable sources 7 .<br />
<strong>The</strong> 2001 Renewable Electricity<br />
Directive<br />
<strong>The</strong> <strong>European</strong> Commission’s White Paper was followed<br />
by Directive 2001/77/EC on the Promotion of Electricity<br />
from Renewable <strong>Energy</strong> Sources. At the time, it was<br />
the most important piece of legislation ever introduced<br />
for wind power and other renewables, and led the 27<br />
Member States <strong>to</strong> develop frameworks for investment<br />
in renewables, and ways of overcoming administrative<br />
and grid access barriers.<br />
<strong>The</strong> Directive set national indicative targets for the<br />
share of electricity from renewables as a percentage<br />
of gross electricity consumption. <strong>The</strong> overall goal set<br />
out in the directive was <strong>to</strong> increase the share of electricity<br />
coming from renewables from 14% in 1997 <strong>to</strong><br />
22% in 2010. With enlargement, the overall <strong>EU</strong> target<br />
was adjusted <strong>to</strong> 21% of electricity consumption.<br />
Provisional Eurostat data for 2009 shows that already<br />
in 2009 about 19.9% (608 TWh) of Europe’s<br />
<strong>to</strong>tal electricity consumption (3,042 TWh) came from<br />
renewable energy sources 8 . Hydro power contributed<br />
with the largest share (11.6%), followed by wind<br />
(4.2%), biomass (3.5%), and solar (0.4%). This was an<br />
increase on 2008, when electricity generation from<br />
renewable energy covered 16.6% (558 TWh) of gross<br />
electricity consumption 9 , at 3,357 TWh.<br />
6 <strong>European</strong> Commission (COM(1997) 599 final): Communication for the Commission. “<strong>Energy</strong> for the future: Renewable sources of<br />
energy. White Paper for a Community Strategy and Action Plan. 1997”.<br />
7 “Renewable <strong>Energy</strong> Snapshots 2010”. Hans Bloem, Fabio Monforti-Ferrario, Marta Szabo and Arnulf Jäger-Waldau http://publications.jrc.ec.europa.eu/reposi<strong>to</strong>ry/bitstream/111111111/14436/1/reqno_jrc59050_re_snapshots_eur_2010.pdf%5b1%5d.pdf<br />
8 “Renewable <strong>Energy</strong> Snapshots 2010”. Hans Bloem, Fabio Monforti-Ferrario, Marta Szabo and Arnulf Jäger-Waldau http://publications.jrc.ec.europa.eu/reposi<strong>to</strong>ry/bitstream/111111111/14436/1/reqno_jrc59050_re_snapshots_eur_2010.pdf%5b1%5d.pdf<br />
9 Eurostat 56/2010 http://epp.eurostat.ec.europa.eu/cache/ITY_OFFPUB/KS-SF-10-056/EN/KS-SF-10-056-EN.PDF<br />
<strong>EU</strong> <strong>Energy</strong> <strong>Policy</strong> <strong>to</strong> <strong>2050</strong> - Achieving 80-95% emissions reductions<br />
15
Developing Europe’s renewable energy sec<strong>to</strong>r 1997 - 2010<br />
Fig 2: RENEWABLE ELECTRICITY’S SHARE OF TOTAL <strong>EU</strong>27 ELECTRICITY CONSUMPTION 1971 - 2010 (%)<br />
(%)<br />
20<br />
15<br />
248 TWh<br />
608 TWh<br />
10<br />
312 TWh<br />
357 TWh<br />
420 TWh 509 TWh<br />
5<br />
0<br />
1971 ... 1990 1991 1992<br />
Source %: 1971 3E; 1990 - 2008 Eurostat; 2009 EWEA assumption; 2010 NREAPs<br />
Source TWh Electricity figures: EWEA from renewable estimation based energy on sources above sources<br />
Renewable power installations<br />
continue <strong>to</strong> increase<br />
1993 1994 1995 1996 1997 1998 1999 2000 2001 2002 2003 2004 2005 2006 2007 2008 2009<br />
<strong>The</strong> increase in electricity generated from renewable<br />
sources is a result of the fact that a majority of newly<br />
installed generating capacity is renewable. In 1995,<br />
new renewable power installations <strong>to</strong>talled just 1.3<br />
GW (representing 14% of <strong>to</strong>tal <strong>EU</strong> power installations<br />
that year). Since 1995 they have gradually increased<br />
<strong>to</strong> 13.3 GW in 2008 (57% of <strong>to</strong>tal <strong>EU</strong> power installations<br />
that year), and 17.3 GW in 2009 (63% of <strong>to</strong>tal<br />
<strong>EU</strong> power installations that year). During 2010, a record<br />
22.7 GW was installed. However, due <strong>to</strong> an exceptional<br />
year in new gas installations, the renewable<br />
share of new capacity was 41%.<br />
Fig 3: New installed capacity per year 1995 - 2010 (MW)<br />
55,000<br />
50,000<br />
45,000<br />
40,000<br />
35,000<br />
30,000<br />
25,000<br />
20,000<br />
15,000<br />
10,000<br />
5,000<br />
RES<br />
0<br />
1995 1996 1997 1998 1999 2000 2001 2002 2003 2004 2005 2006 2007 2008 2009 2010<br />
<strong>Wind</strong> PV Large Hydro Other RES Nuclear Coal Natural Gas Fuel Oil Other non-RES<br />
16<br />
March 2011
<strong>The</strong> decarbonisation of Europe’s<br />
energy supply<br />
<strong>The</strong> net growth in the last 11 years of natural gas<br />
power (118.2 GW), wind power (75.2 GW) and solar<br />
PV (26.4 GW) was at the expense of fuel oil (down<br />
13.2 GW), coal (down 9.5 GW) and nuclear (down 7.6<br />
GW). <strong>The</strong> <strong>EU</strong> power sec<strong>to</strong>r, therefore, continues <strong>to</strong> replace<br />
ageing fuel oil, coal and nuclear power plants<br />
with modern technology, whilst at the same time increasing<br />
its <strong>to</strong>tal installed capacity <strong>to</strong> meet increasing<br />
demand.<br />
Fig 4: Net electricity generating installations in <strong>EU</strong> 2000 – 2010 (MW)<br />
120,000<br />
100,000<br />
80,000<br />
75,226<br />
60,000<br />
40,000<br />
20,000<br />
0<br />
-20,000<br />
-13,165<br />
<strong>EU</strong> <strong>Energy</strong> <strong>Policy</strong> <strong>to</strong> <strong>2050</strong> - Achieving 80-95% emissions reductions<br />
17
XXX<br />
Pho<strong>to</strong>: Siemens<br />
<strong>The</strong> immediate future for renewable energy in Europe <strong>to</strong> 2020
<strong>The</strong> 2009 Renewable <strong>Energy</strong><br />
Directive<br />
In order <strong>to</strong> continue the development and deployment<br />
of renewable energy technologies, the <strong>EU</strong> adopted<br />
the 2009 Renewable <strong>Energy</strong> Directive 10 , which included<br />
a 20% renewable energy target by 2020 for<br />
the <strong>EU</strong>. <strong>The</strong> directive provides each Member State<br />
with a differentiated legally binding national target <strong>to</strong><br />
reach the overall 20%, <strong>to</strong>gether with a requirement <strong>to</strong><br />
put in place national policies in order <strong>to</strong> achieve that<br />
national target.<br />
According <strong>to</strong> the National Renewable <strong>Energy</strong> Action<br />
Plans (NREAPs) that <strong>EU</strong> Member States submitted <strong>to</strong><br />
the <strong>European</strong> Commission in 2010, it is clear the vast<br />
majority of Member States are taking their responsibilities<br />
seriously. According <strong>to</strong> the NREAPs, the <strong>EU</strong>-<br />
27 will exceed its target of meeting 20% of its gross<br />
final energy consumption from renewable sources by<br />
2020. Taken <strong>to</strong>gether the NREAPs show that the <strong>EU</strong>-<br />
27 will meet 20.7% of its 2020 energy consumption<br />
from renewables.<br />
Converging expectations for 2020<br />
It is increasingly clear that expectations for wind energy<br />
and other renewables in 2020 are converging<br />
– as highlighted below by EWEA, the <strong>European</strong> Commission’s<br />
‘Trends <strong>to</strong> 2030’ scenarios, the <strong>European</strong><br />
Commission’s Joint Research Centre, ENTSO, and<br />
the National Renewable <strong>Energy</strong> Action Plans.<br />
EWEA 11<br />
EWEA’s 2020 “baseline” scenario assumes 581 TWh<br />
of wind energy being produced, meeting 15.7% of <strong>EU</strong><br />
electricity demand, from a <strong>to</strong>tal installed capacity of<br />
230 GW of wind power. EWEA’s 2020 “high” scenario<br />
assumes 680 TWh of electricity being produced<br />
from a <strong>to</strong>tal installed wind power capacity of 265 GW,<br />
meeting 18.4% of <strong>EU</strong> electricity demand.<br />
Fifteen Member States plan <strong>to</strong> exceed their national<br />
target, led by Bulgaria at +2.8% above its target,<br />
Spain (+2.7%), Greece (+2.2%), Hungary (+1.7) and<br />
Germany (+1.6%). Ten Member States will meet their<br />
national target, and just two Member States, Luxembourg<br />
(-2.1%) and Italy (-0.9%), have informed the <strong>European</strong><br />
Commission that they envisage using the cooperation<br />
mechanisms <strong>to</strong> meet their national targets.<br />
It is encouraging that 25 of the 27 <strong>EU</strong> countries intend<br />
<strong>to</strong> either exceed or meet their target. This shows<br />
the vast majority of <strong>EU</strong> countries clearly understand<br />
the benefits of deploying renewable energy technologies,<br />
particularly wind power.<br />
10 Directive 2009/28/EC of the <strong>European</strong> Parliament and of the Council of 23 April 2009 on the promotion of the use of energy<br />
from renewable sources and amending and subsequently repealing Directives 2001/77/EC and 2003/30/EC.<br />
11 EWEA 2010. Consumption figure for 2020 taken from EC PRIMES 2010 (3,690 TWh).<br />
<strong>EU</strong> <strong>Energy</strong> <strong>Policy</strong> <strong>to</strong> <strong>2050</strong> - Achieving 80-95% emissions reductions<br />
19
<strong>The</strong> immediate future for renewable energy in Europe <strong>to</strong> 2020<br />
National Renewable <strong>Energy</strong> Action Plans 12<br />
In 2020, according <strong>to</strong> the Renewable <strong>Energy</strong> Directive’s<br />
27 National Renewable <strong>Energy</strong> Action Plans,<br />
34% (1,199 TWh 13 ) of the <strong>EU</strong>’s <strong>to</strong>tal electricity consumption<br />
(3,529 TWh) will come from renewable energy<br />
sources. <strong>The</strong> 34% in 2020 consists of:<br />
• <strong>Wind</strong> energy - 14% (494.7 TWh from 213 GW<br />
installed capacity);<br />
• Hydro - 10.5% (370.3 TWh from 136 GW of<br />
installed capacity);<br />
• Biomass - 6.7% (232 TWh from 43 GW of installed<br />
capacity);<br />
• Solar PV - 2.4% (83.3 TWh from 84 GW of installed<br />
capacity);<br />
• Concentrated solar power - 0.5% (20 TWh from 7<br />
GW of installed capacity);<br />
• Geothermal - 0.3% (10.7 TWh from 1.6 GW);<br />
• Tidal, wave and ocean - 0.2% (5.8 TWh from 2 GW<br />
of installed capacity).<br />
A detailed quantitative and qualitative analysis of the<br />
27 NREAPs is set out in subsequent sections 6 and 7<br />
of this report.<br />
Fig 5: Renewables’ share of electricity consumption per Member State (%) in 2020 according <strong>to</strong> the NREAPs<br />
Austria<br />
Sweden<br />
Latvia<br />
Portugal<br />
Denmark<br />
Ireland<br />
Romania<br />
Spain<br />
Greece<br />
Slovenia<br />
Germany<br />
Netherlands<br />
Finland<br />
United Kingdom<br />
France<br />
Italy<br />
Slovakia<br />
Lithuania<br />
Bulgaria<br />
Belgium<br />
Poland<br />
Es<strong>to</strong>nia<br />
Cyprus<br />
Malta<br />
Czech Republic<br />
Luxembourg<br />
Hungary<br />
<strong>EU</strong><br />
<strong>Wind</strong><br />
Hydro<br />
Biomass<br />
PV<br />
CSP<br />
Geothermal<br />
Tidal & Wave<br />
0% 10% 20% 30% 40% 50% 60% 70% 80%<br />
12 http://ec.europa.eu/energy/renewables/transparency_platform/action_plan_en.htm<br />
13 EWEA is aware of a discrepancy across the 27 NREAPs between renewable electricity production (1,217 TWh for <strong>EU</strong>-27) and Member<br />
States’ reporting of “renewable energy contribution <strong>to</strong> final energy consumption” (the equivalent of 1,199 TWh expressed<br />
in K<strong>to</strong>e). This discrepancy can be due <strong>to</strong>, inter alia, rounding errors, miscalculations or Member States’ taking grid losses in<strong>to</strong><br />
account. <strong>The</strong>refore readers of this document and other analysis documents will come across the two different figures.<br />
20<br />
March 2011
Fig 6: Electricity production from renewable energy sources according <strong>to</strong> the NREAPs (<strong>EU</strong>-27)<br />
40%<br />
30%<br />
20%<br />
640<br />
RES-E (TWH)<br />
RES-E (%)<br />
686<br />
21%<br />
734<br />
22%<br />
786<br />
23%<br />
838<br />
25%<br />
887<br />
26%<br />
942<br />
27%<br />
1,003<br />
29%<br />
1,065<br />
31%<br />
1,128<br />
32%<br />
1,199<br />
34%<br />
1,200 TWh<br />
1,000 TWh<br />
800 TWh<br />
600 TWh<br />
19%<br />
400 TWh<br />
10%<br />
200 TWh<br />
0%<br />
2010<br />
2011<br />
2012<br />
2013<br />
2014<br />
2015<br />
2016<br />
2017<br />
2018<br />
2019<br />
2020<br />
0 TWh<br />
<strong>European</strong> Commission –<br />
“<strong>EU</strong> <strong>Energy</strong> Trends <strong>to</strong> 2030” 14<br />
In September 2010, the <strong>European</strong> Commission published<br />
its new <strong>EU</strong> energy scenarios ‘<strong>EU</strong> energy trends<br />
<strong>to</strong> 2030’. <strong>The</strong> scenario sees renewables generating<br />
33% of electricity demand in 2020, with wind energy<br />
producing 14% (525 TWh from 222 GW installed capacity).<br />
<strong>The</strong> scenario expects 333 GW of new electricity<br />
generating capacity <strong>to</strong> be installed in the <strong>EU</strong> in the<br />
decade from 2011 <strong>to</strong> 2020. <strong>Wind</strong> power would account<br />
for 136 GW, or 41% of all new installations - by far the<br />
largest of any power technology. <strong>The</strong> Commission expects<br />
64% of this <strong>to</strong>tal new capacity <strong>to</strong> be renewable<br />
energy, 17% gas, 12% coal, 4% nuclear and 3% oil.<br />
Compared <strong>to</strong> its previous scenario from 2008, the <strong>European</strong><br />
Commission has increased its expectations<br />
for <strong>EU</strong> wind energy capacity in 2020 by 85% from 120<br />
GW <strong>to</strong> 222 GW.<br />
<strong>European</strong> Commission -<br />
Joint Research Centre 15<br />
<strong>The</strong> <strong>European</strong> Commission’s Joint Research Centre<br />
(JRC) estimates that “35 <strong>to</strong> 40% of the <strong>to</strong>tal electricity<br />
(3,200 – 3,500 TWh) has <strong>to</strong> come from Renewable<br />
<strong>Energy</strong> Sources in 2020 <strong>to</strong> meet the [<strong>EU</strong> renewable<br />
energy] target” and that, therefore, the “target corridor<br />
which has <strong>to</strong> be reached for electricity generation<br />
from Renewable <strong>Energy</strong> Resources is 1,120 – 1,400<br />
TWh”, up from 608 TWh in 2009.<br />
<strong>The</strong> JRC concludes that “if the current growth rates<br />
[…] can be maintained, up <strong>to</strong> 1,600 TWh (45 – 50%)<br />
of renewable electricity could be generated in 2020.”<br />
ENTSO-E<br />
ENTSO-E in its Scenario Outlook and System Adequacy<br />
Forecast 2011 – 2025 sees renewables meeting a<br />
36% share of consumption from 1,159 TWh in 2020. 16<br />
14 http://ec.europa.eu/energy/observa<strong>to</strong>ry/trends_2030/index_en.htm<br />
15 “Renewable <strong>Energy</strong> Snapshots 2010”. Hans Bloem, Fabio Monforti-Ferrario, Marta Szabo and Arnulf Jäger-Waldau http://publications.jrc.ec.europa.eu/reposi<strong>to</strong>ry/bitstream/111111111/14436/1/reqno_jrc59050_re_snapshots_eur_2010.pdf%5b1%5d.pdf<br />
16 Using its Top-down Scenario for the <strong>EU</strong>-27 for 2020 (excluding Malta) with a consumption of 3,221 TWh<br />
<strong>EU</strong> <strong>Energy</strong> <strong>Policy</strong> <strong>to</strong> <strong>2050</strong> - Achieving 80-95% emissions reductions<br />
21
<strong>The</strong> immediate future for renewable energy in Europe <strong>to</strong> 2020<br />
Comparing the scenarios - 2020 17<br />
Using the ranges provided above by the <strong>European</strong><br />
Commission’s PRIMES model, ENTSO, the JRC and<br />
the NREAPs, between 33% and 50% of Europe’s electricity<br />
will come from renewable energy in 2020. <strong>The</strong><br />
range for wind energy, including EWEA’s baseline scenario,<br />
the <strong>European</strong> Commission’s PRIMES model,<br />
and the NREAPs, is producing between 495 TWh and<br />
581 TWh (from an installed capacity of between 213<br />
GW and 230 GW) meeting between 14% and 15.7%<br />
of the <strong>EU</strong>’s electricity consumption. Renewables as<br />
a whole will be producing between 1,159 and 1,209<br />
TWh, meeting between 32.6 and 36% of the <strong>EU</strong>’s<br />
electricity consumption.<br />
Fig 7A: Expected growth in installed wind power<br />
capacity 2010 - 2020 (GW)<br />
FIG 7B: EXPECTED GROWTH IN WIND ENERGY PRODUCTION<br />
2010 - 2020 (TWH)<br />
300<br />
700<br />
CAPACITY (GW)<br />
225<br />
150<br />
75<br />
ELECTRICITY (TWH)<br />
525<br />
350<br />
175<br />
0<br />
2010<br />
2020<br />
0<br />
2010<br />
2020<br />
NREAPs (<strong>EU</strong>-27) EC REF 2010 EWEA<br />
Table 1: <strong>Wind</strong> <strong>Energy</strong> Scenarios compared: EWEA/EC PRIMES/NREAPs (<strong>EU</strong>-27) 2010 – <strong>2050</strong><br />
TWh production/GW installed/share of electricity consumption (%)<br />
EWEA EC PRIMES REF 2010 NREAPS (<strong>EU</strong>-27)<br />
2010 181/84/5.3 161/86/4.9 165/82/5<br />
2020 581/230/15.7 525/222/14.2 495/213/14<br />
2030 1,155/400/28.5 694/280/17<br />
<strong>2050</strong> 2,015/600/50<br />
17 Consumption figures for 2020 vary from the NREAP figure of 3,529 TWh and PRIMES 3,795 TWh.<br />
22<br />
March 2011
<strong>The</strong> SET – Plan: the <strong>European</strong><br />
<strong>Wind</strong> Initiative 18<br />
<strong>The</strong> Strategic <strong>Energy</strong> Technology Plan (SET-Plan) is<br />
the technology pillar of the <strong>EU</strong>’s energy and climate<br />
policy aiming <strong>to</strong> fight climate change, improve energy<br />
security, enhance Europe’s competitiveness, and<br />
maintain technological leadership. As part of the SET-<br />
Plan, the <strong>European</strong> wind industry - <strong>to</strong>gether with the<br />
<strong>European</strong> Commission and Member States - has developed<br />
a ten year research and development programme<br />
called the <strong>European</strong> <strong>Wind</strong> Initiative (EWI).<br />
<strong>The</strong> <strong>European</strong> <strong>Wind</strong> Initiative (EWI) is the high-tech<br />
roadmap <strong>to</strong> reduce the cost of wind energy. It will take<br />
the <strong>European</strong> wind industry <strong>to</strong> the next stage: it will<br />
develop the wind energy technology of the future, the<br />
necessary testing facilities, and streamlined manufacturing<br />
processes.<br />
<strong>The</strong> EWI was launched in June 2010. Its implementation<br />
will pave the way for the large-scale deployment<br />
of wind energy worldwide, contribute <strong>to</strong> long-term <strong>European</strong><br />
technological and market leadership.<br />
<strong>The</strong> <strong>European</strong> Commission has highlighted that<br />
“more than 250,000 skilled jobs could be created”<br />
in the wind industry as a result. With a budget of €6<br />
billion, approximately half of which will be provided by<br />
the industry, the strategic objectives of the EWI are:<br />
• To maintain Europe’s technology leadership in both<br />
onshore and offshore wind power;<br />
• To make onshore wind the most competitive<br />
energy source by 2020, with offshore following by<br />
2030;<br />
• To enable wind energy <strong>to</strong> supply 20% of Europe’s<br />
electricity in 2020, 33% in 2030, and 50% in <strong>2050</strong>.<br />
To reach these objectives, the EWI focuses on four<br />
main technology areas:<br />
• New turbines and components;<br />
• Offshore technology;<br />
• Grid Integration;<br />
• Resource assessment and spatial planning.<br />
<strong>The</strong> EWI prioritises the following research activities:<br />
• To ease the site assessment, and gather data for<br />
improved designs onshore and offshore;<br />
• To develop the technology used in wind turbines,<br />
and their manufacturing - both for onshore and<br />
offshore - <strong>to</strong> reduce the cost of wind energy.<br />
A pro<strong>to</strong>type of a large offshore wind turbine in<br />
the 10 - 20 MW range will be developed and<br />
demonstrated;<br />
• To support the take-off of the offshore wind<br />
industry in the short <strong>to</strong> medium term and ensure<br />
long-term offshore technology leadership. This<br />
action is focused on turbine-support structures<br />
(including in deep waters), assembly, installation,<br />
operation and maintenance, decommissioning and<br />
environmental research;<br />
• To enable the large-scale grid integration of<br />
onshore and offshore wind energy;<br />
• To design the economic spatial planning<br />
instruments <strong>to</strong> deploy onshore and offshore wind<br />
energy technologies.<br />
<strong>The</strong> implementation of the EWI requires a yearly investment<br />
of public and private resources of approximately<br />
€600 million (<strong>to</strong>talling €6 billion by 2020). It is<br />
therefore necessary <strong>to</strong> allocate the dedicated public<br />
funds in the current pre-2014 <strong>EU</strong> budgets as well as<br />
in the new <strong>EU</strong> financial period starting in 2014.<br />
By doing so, the <strong>EU</strong> decision makers would show their<br />
commitment and political will <strong>to</strong>wards the <strong>European</strong><br />
wind industry, which will contribute significantly <strong>to</strong><br />
meeting the <strong>EU</strong>’s 2020 climate goals.<br />
18 See <strong>The</strong> <strong>European</strong> <strong>Wind</strong> Initiative. <strong>Wind</strong> power research and development for the next ten years. A <strong>European</strong> <strong>Wind</strong> <strong>Energy</strong> <strong>Association</strong><br />
briefing - June 2010. http://www.ewea.org/fileadmin/ewea_documents/documents/publications/EWI/EWI_2010_final.pdf<br />
<strong>EU</strong> <strong>Energy</strong> <strong>Policy</strong> <strong>to</strong> <strong>2050</strong> - Achieving 80-95% emissions reductions<br />
23
XXX<br />
Pho<strong>to</strong>: GWEC<br />
Beyond 2020: <strong>EU</strong> energy policy 2020 – <strong>2050</strong>
Science requires 80-95%<br />
emissions reductions by <strong>2050</strong><br />
Four years after the IPCC’s Fourth Assessment Report,<br />
scientific evidence shows an acceleration of climate<br />
change patterns and a deepening of the climate<br />
crisis: sea levels are rising, oceans are acidifying and<br />
ice caps are melting all much quicker than initially<br />
anticipated and current emission trends are steadily<br />
following the most serious of the IPCC scenarios,<br />
with dramatic implications. According <strong>to</strong> scientific evidence,<br />
the <strong>EU</strong> and other industrialised regions must<br />
reduce domestic greenhouse gas emissions by 25%-<br />
40% identified by the IPCC <strong>to</strong> give us a 50% chance<br />
of avoiding the 2°C temperature rise. 19 <strong>The</strong> cost of<br />
inaction is known <strong>to</strong> be much greater than the cost<br />
of early action. This recognition prompted <strong>EU</strong> Heads<br />
of State <strong>to</strong> agree <strong>to</strong> 80-95% emissions reduction by<br />
<strong>2050</strong>.<br />
Currently, the agreed framework for post-2020 consists<br />
of two elements: the Heads of States’ commitment<br />
<strong>to</strong> reduce greenhouse gas emissions by 80-95%<br />
by <strong>2050</strong>, and the directive on the <strong>EU</strong> Emissions Trading<br />
System, which will continue <strong>to</strong> reduce the emissions<br />
cap for the ETS sec<strong>to</strong>rs by 1.74% each year beyond<br />
2020. Given the difficulty of reducing emissions<br />
<strong>to</strong> zero in sec<strong>to</strong>rs such as transport and agriculture,<br />
achieving the Heads of States’ commitment is only<br />
certain if the power sec<strong>to</strong>r emits zero carbon well before<br />
<strong>2050</strong>.<br />
<strong>2050</strong> may seem a long time from now but in the power<br />
sec<strong>to</strong>r, <strong>2050</strong> is only one investment cycle away,<br />
which means decision makers must act <strong>to</strong>day and<br />
provide the markets with clear signals on technology<br />
choice. Due <strong>to</strong> the long lifetime of fossil fuel power<br />
plants, (35-45 years for coal and 30-35 years for<br />
gas 20 ) the reality of the commitment made by Heads<br />
of State is that no new carbon-emitting power plant<br />
should be built after 2015.<br />
Any post-2020 legislative framework should indicate<br />
the emission reduction pathway <strong>to</strong> reach 80-95%<br />
GHG reductions by <strong>2050</strong>, including domestic greenhouse<br />
gas objectives for 2020 (of a 30% domestic reduction),<br />
2030, 2040 and <strong>2050</strong> (of 80-95% domestic<br />
reduction). <strong>The</strong>se pathways should be broken down<br />
by sec<strong>to</strong>r, including a carbon pathway for the electricity<br />
sec<strong>to</strong>r that reaches zero-carbon well before <strong>2050</strong>.<br />
<strong>The</strong> pathways should be ambitious, achieve significant<br />
reductions earlier rather than later <strong>to</strong> give industry<br />
the right signals from the start, and enable Europe<br />
<strong>to</strong> achieve and then benefit from its first mover<br />
advantage in wind power and other renewable energy<br />
technologies.<br />
<strong>The</strong> real power choice:<br />
the power sec<strong>to</strong>r as a priority<br />
<strong>The</strong> pathway for the electricity sec<strong>to</strong>r should be accompanied<br />
by an analysis of the viable power technology<br />
mixes <strong>to</strong> follow the carbon pathway. It is crucial<br />
that this analysis takes in<strong>to</strong> account the large amount<br />
of existing and ageing power plants that will be decommissioned<br />
over the coming decades. Necessary<br />
<strong>to</strong> achieving a zero-carbon power sec<strong>to</strong>r by <strong>2050</strong> is<br />
an <strong>EU</strong> regula<strong>to</strong>ry framework for the post-2020 period.<br />
In order <strong>to</strong> provide the power sec<strong>to</strong>r with the necessary<br />
investment stability and predictability, the <strong>EU</strong><br />
will need <strong>to</strong> decide during the course of the present<br />
Commission and Parliament – that is, by the end of<br />
2014 - on a new regula<strong>to</strong>ry framework for the power<br />
sec<strong>to</strong>r consisting of three key pillars:<br />
Core post-2020 pillar: ambitious, binding 2030<br />
target for renewable energy<br />
Given the proven success of the <strong>EU</strong> regula<strong>to</strong>ry framework<br />
for renewables since 1997, EWEA considers the<br />
most effective post-2020 regula<strong>to</strong>ry framework <strong>to</strong> be<br />
a binding 2030 renewable energy target. This would<br />
give the power sec<strong>to</strong>r a vital stepping s<strong>to</strong>ne, taking it<br />
from an expected 34% renewable electricity in 2020<br />
<strong>to</strong> 100% renewables by <strong>2050</strong>.<br />
19 IPCC Fourth Assessment Report: Climate Chnage 2007 (AR4)<br />
20 SRU German Advisory Council on the Environment. “Climate-friendly, reliable, affordable: 100% renewable electricity supply by<br />
<strong>2050</strong>”. Statement May 2010.<br />
<strong>EU</strong> <strong>Energy</strong> <strong>Policy</strong> <strong>to</strong> <strong>2050</strong> - Achieving 80-95% emissions reductions<br />
25
Beyond 2020: <strong>EU</strong> energy policy 2020 – <strong>2050</strong><br />
Fig 8: contribution of electricity from renewable energy sources and wind energy 1970-2010 and expected<br />
contribution 2011-<strong>2050</strong> (% share of consumption)<br />
100<br />
75<br />
50<br />
25<br />
0<br />
1971<br />
1980<br />
1990<br />
2000<br />
2010<br />
2020<br />
2030<br />
2040<br />
<strong>2050</strong><br />
Sources: 1971-1989 3E/EWEA assumption; 1990-2008 Eurostat; 2009 EWEA assumption; 2010-2020 NREAPs; 2020-2030 EWEA (based on<br />
PRIMES consumption 2030); 2031-<strong>2050</strong> EWEA<br />
<strong>The</strong> <strong>EU</strong>’s renewable energy policy - the 2001 Renewable<br />
Electricity Directive and the 2009 Renewable <strong>Energy</strong><br />
Directive - is successfully transforming our power<br />
sec<strong>to</strong>r. <strong>The</strong>refore the most effective post-2020 framework<br />
would be <strong>to</strong> replicate and continue the successful<br />
approach by setting an ambitious, binding 2030 target<br />
for renewable energy that is compatible with the necessary<br />
carbon reductions in the power sec<strong>to</strong>r.<br />
Enhancing the post-2020 framework:<br />
an Emissions Performance Standard<br />
<strong>The</strong> most effective way of ensuring a carbon-free power<br />
sec<strong>to</strong>r by <strong>2050</strong> would be <strong>to</strong> ban carbon emissions<br />
from new power plants installed after 2015. <strong>The</strong> simple<br />
way <strong>to</strong> do this would be <strong>to</strong> introduce a technology<br />
neutral Emissions Performance Standard (EPS) of<br />
zero g CO 2<br />
/kWh for new power plants, thereby letting<br />
the market decide the most cost efficient way of delivering<br />
carbon-free primary energy.<br />
Given the challenge of developing a sufficiently flexible<br />
electricity system, the EPS could alternatively be set<br />
at around 350g CO 2<br />
/kWh in 2015, equivalent <strong>to</strong> the<br />
emissions of a new gas plant. <strong>The</strong> Standard should be<br />
gradually reduced for new plants over time in order <strong>to</strong><br />
encourage progress in flexible gas plant technology.<br />
26<br />
March 2011
Enhancing the post-2020 framework:<br />
tightening the Emissions Trading System (ETS)<br />
Any post-2020 legislative framework should indicate<br />
the emission reduction pathway <strong>to</strong> reach 80-95%<br />
GHG reductions by <strong>2050</strong>, including domestic greenhouse<br />
gas objectives for 2020 (of a 30% reduction),<br />
2030, 2040 and <strong>2050</strong> (of 80-95% reduction).<br />
Because of the low average price of carbon, and its<br />
fluctuation since the beginning of the ETS in 2005,<br />
analysts concur that the ETS mechanism has had, so<br />
far, close <strong>to</strong> no impact on the promotion of renewable<br />
energy technologies. On the other hand, renewables<br />
have had a major impact on the reductions in CO 2<br />
achieved so far.<br />
From the start of the <strong>EU</strong> ETS in 2005, and until 2010,<br />
49,702 MW of new wind power capacity was installed,<br />
producing about 112 TWh of electricity annually, and<br />
avoiding 78 million <strong>to</strong>nnes (Mt) of CO 2<br />
emissions. In<br />
2010, the ETS annual cap was 2,083 Mt, down from<br />
2,177 Mt of CO 2<br />
in 2005, or a reduction of 94 Mt.<br />
Comparing these two figures, it is clear that new installed<br />
wind energy has been a main contributer <strong>to</strong><br />
emissions reduction in ETS sec<strong>to</strong>rs during this period<br />
– equivalent <strong>to</strong> 83% of the <strong>to</strong>tal reduction.<br />
Looking at EWEA scenarios for wind installed capacity<br />
<strong>to</strong> 2020, we estimate that emissions avoided by new<br />
wind power installed between 2005 and 2020 will be<br />
equivalent <strong>to</strong> 62% of the greenhouse gas reductions<br />
required by the ETS by 2020 21 . Given that these emissions<br />
are purely domestic, and given the 50% access<br />
<strong>to</strong> international credits currently, this represents 124%<br />
of the domestic ETS effort needed within the <strong>EU</strong>.<br />
In order <strong>to</strong> establish an effective post-2020 framework,<br />
emission reductions should be increased from<br />
the current 20% <strong>to</strong> a 30% domestic reduction by<br />
2020. <strong>The</strong>re are three reasons for this.<br />
Firstly, the IPCC stated that industrialised countries<br />
need <strong>to</strong> reduce domestic emissions between 25-40%<br />
by 2020 <strong>to</strong> give us a 50% chance of avoiding a 2°C<br />
temperature rise 22 .<br />
Secondly, the financial crisis has undermined the effectiveness<br />
of the ETS as a <strong>to</strong>ol <strong>to</strong> shift Europe away<br />
from fossil fuels <strong>to</strong>wards a renewable, zero-carbon<br />
power sec<strong>to</strong>r. Reduced electricity demand meant reduced<br />
production which in turn also meant reduced<br />
real emissions. Because real emissions were below<br />
the amount of freely allocated allowances companies<br />
received, it generated a surplus that could be sold or<br />
kept for later use, when auctioning makes emitting<br />
CO 2<br />
more expensive. This has created vast windfall<br />
profits for heavy industry and cheap business-as-usual<br />
solutions for the power sec<strong>to</strong>r. To avoid oversupply<br />
on the carbon market and yet another price crash before<br />
2020, the <strong>EU</strong> must raise the current GHG target<br />
<strong>to</strong> 30% domestic reductions by 2020.<br />
Thirdly, reaching 2°C means that raising the cap <strong>to</strong> 30%<br />
domestic is necessary, since the current 20% reduction,<br />
which includes massive amounts of external credits,<br />
does not bring us on a path <strong>to</strong> an 80-95% economy-wide<br />
reduction, but merely <strong>to</strong> an 80% reduction in<br />
ETS sec<strong>to</strong>rs only. Compared with other sec<strong>to</strong>rs (such<br />
as agriculture and transport) it is easier <strong>to</strong> reduce emissions<br />
in the ETS sec<strong>to</strong>rs, and in particular the power<br />
sec<strong>to</strong>r. <strong>The</strong>refore these sec<strong>to</strong>rs need <strong>to</strong> be carbon-free<br />
by <strong>2050</strong>, <strong>to</strong> allow for unavoidable emissions in other<br />
sec<strong>to</strong>rs. Hence, a move <strong>to</strong> 30% domestic reductions<br />
by 2020 ensures that the defined linear fac<strong>to</strong>r (-1.74%<br />
emission reduction per year) brings us closer <strong>to</strong> 95% reduction<br />
by <strong>2050</strong>.<br />
While promoting renewables is not the main objective of<br />
the ETS, renewables, particularly wind power, have been<br />
so far the most efficient means of meeting the goal of<br />
the ETS: reducing emissions. <strong>The</strong>refore, policies promoting<br />
renewables should be maintained and extended<br />
21 <strong>The</strong> ETS requires a reduction of 21% compared <strong>to</strong> 2005 emissions.<br />
22 IPCC 4 th Assessment Report, 2007<br />
<strong>EU</strong> <strong>Energy</strong> <strong>Policy</strong> <strong>to</strong> <strong>2050</strong> - Achieving 80-95% emissions reductions<br />
27
Beyond 2020: <strong>EU</strong> energy policy 2020 – <strong>2050</strong><br />
alongside the ETS, as they will ensure that we reach our<br />
emissions reduction targets, regardless of any shortcomings<br />
of the ETS mechanism. It will also ensure that<br />
Europe develops a broad range of renewable technologies,<br />
including offshore wind. If the ETS were the sole<br />
driver for renewable energy investments, only the currently<br />
cheapest technologies would be deployed and<br />
developed, i.e. onshore wind and biomass, due <strong>to</strong> the<br />
structure of the mechanism, and Europe would lose the<br />
global race for renewable energy technology leadership.<br />
Revenue from the auctioning of <strong>EU</strong> allowances can<br />
provide ample resources <strong>to</strong> finance these new renewable<br />
targets, ideally within a coordinated <strong>EU</strong> strategy.<br />
50% of auctioning revenue has already been earmarked<br />
for climate action 22 . It is essential that these<br />
new funds result in new funding opportunities, rather<br />
than disappearing in<strong>to</strong> state budgets.<br />
<strong>The</strong> successful post-2020<br />
combination<br />
Given the successful track record of the <strong>EU</strong>’s past and<br />
existing renewable energy policies, it is clear that the<br />
most effective way of ensuring that the <strong>EU</strong> is able <strong>to</strong><br />
continue reducing its greenhouse gas emissions beyond<br />
2020 is <strong>to</strong> continue an existing, stable, predictable<br />
and successful <strong>EU</strong> policy by establishing a binding<br />
and ambitious renewable energy target for 2030. This<br />
policy should be complemented with other technology<br />
neutral policies - an ambitious EPS and ETS.<br />
Critical <strong>to</strong> any post-2020 policy framework for the<br />
power sec<strong>to</strong>r is that companies which own or operate<br />
carbon-emitting power plants should fully bear the financial<br />
risk and cost of the early decommissioning of<br />
such power plants in order <strong>to</strong> meet the requirement<br />
of ambitious increasing greenhouse gas emission reduction<br />
targets for the power sec<strong>to</strong>r, reaching zero<br />
before <strong>2050</strong>.<br />
23 DIRECTIVE 2009/29/EC of the <strong>European</strong> Parliament and the Council of 23 April 2009 amending Directive 2003/87/EC so as <strong>to</strong><br />
improve and extend the greenhouse gas emission allowance trading scheme of the Community<br />
28<br />
March 2011
Transmission infrastructure,<br />
system operation and electricity<br />
market integration<br />
An affordable <strong>2050</strong> zero-carbon power system is best<br />
achieved with a 100% renewable energy power system<br />
in Europe by that date. <strong>Wind</strong> energy alone could<br />
provide 50% of Europe’s electricity by then. <strong>Wind</strong> power<br />
contributes <strong>to</strong> all of the <strong>EU</strong>’s energy policy objectives<br />
– increased competitiveness, energy security<br />
and fighting climate change.<br />
To achieve this level of ambition a number of actions<br />
need <strong>to</strong> be taken. Alongside an adequate transmission<br />
infrastructure, the power system will need <strong>to</strong> be<br />
operated more efficiently, and the electricity market<br />
run <strong>to</strong> take account, and advantage, of the low marginal<br />
costs and zero fuel and carbon cost of wind<br />
energy and other renewable sources. Both the development<br />
of physical infrastructure and market integration<br />
are therefore closely linked and must be carried<br />
out in a coordinated way.<br />
For details on how EWEA sees the grid and its operation<br />
evolving in the years ahead please see “<strong>2050</strong>:<br />
Facilitating 50% <strong>Wind</strong> <strong>Energy</strong>. Recommendations on<br />
transmission infrastructure, system operation and<br />
electricity market integration” 24 and “Powering Europe:<br />
wind energy and the electricity grid” 25 .<br />
<strong>European</strong> renewable energy grid<br />
vision 2010-<strong>2050</strong><br />
Objective<br />
In 2010, EWEA developed a grid map in order <strong>to</strong> depict<br />
the evolution of wind energy and other renewables in<br />
the <strong>European</strong> power system up <strong>to</strong> <strong>2050</strong>. <strong>The</strong> maps<br />
overleaf identify the main renewable electricity production<br />
areas and consumption areas, and show where<br />
the major power corridors would be situated in an integrated<br />
electricity market.<br />
<strong>The</strong> maps aim <strong>to</strong> outline the way <strong>to</strong> a 100% renewable,<br />
fully integrated <strong>European</strong> power system by <strong>2050</strong>, provided<br />
that the necessary grid infrastructure is developed<br />
and the market is fully integrated.<br />
<strong>The</strong> grid maps consist of maps for five different years:<br />
2010, 2020, 2030, 2040 and <strong>2050</strong>. Each of these<br />
maps shows the main production areas and consumption<br />
areas and the corresponding dominant power flows<br />
along the transmission corridors. In this way, the reader<br />
can analyse the evolution of the main power generation<br />
capacities, the principle transmission routes, and<br />
the dominant power flows of specific generation sources<br />
along those transmission routes over time.<br />
24 EWEA 2010. “<strong>2050</strong>: Facilitating 50% <strong>Wind</strong> <strong>Energy</strong>. Recommendations on transmission infrastructure, system operation and<br />
electricity market integration” details how Europe’s power system should develop over the coming years in order <strong>to</strong> integrate 50%<br />
wind energy penetration http://www.ewea.org/index.php?id=182<br />
25 EWEA 2010. Powering Europe: wind energy and the electricity grid. http://ewea.org/fileadmin/ewea_documents/documents/publications/reports/Grids_Report_2010.pdf<br />
<strong>EU</strong> <strong>Energy</strong> <strong>Policy</strong> <strong>to</strong> <strong>2050</strong> - Achieving 80-95% emissions reductions<br />
29
Beyond 2020: <strong>EU</strong> energy policy 2020 – <strong>2050</strong><br />
Legend<br />
<strong>The</strong> grid maps depict the evolution of renewable energy<br />
in the <strong>European</strong> power system up <strong>to</strong> <strong>2050</strong>.<br />
Production sources<br />
<strong>The</strong> main on-land and offshore renewable energy producing<br />
areas are shown. Each source is represented<br />
by a different icon.<br />
<strong>The</strong> five countries with the highest electricity consumption<br />
were identified and a corresponding icon<br />
was added according <strong>to</strong> their approximate higher consumption<br />
area 27 .<br />
Main consumption area<br />
Onshore and offshore wind<br />
Hydro<br />
Ocean<br />
Biomass<br />
Solar<br />
Power corridors<br />
<strong>The</strong> main transmission corridors 28 are coloured according<br />
<strong>to</strong> the dominant renewable energy source<br />
flowing across them; this does not mean that there<br />
are no other power production sources using those<br />
transmission routes.<br />
Power corridor<br />
In order <strong>to</strong> indicate the general location of the generation<br />
sources, shaded bubbles have been incorporated<br />
in<strong>to</strong> the map. <strong>The</strong>se bubbles vary in size according<br />
<strong>to</strong> the relevance and penetration level of the<br />
corresponding generation source in the different areas<br />
and timeframes 26 .<br />
<strong>Wind</strong> energy production area<br />
Hydro energy production area<br />
Ocean energy production area<br />
Biomass energy production area<br />
Solar energy production area<br />
26 <strong>The</strong> main sources of information were EWEA, OffshoreGrid, and the Greenpeace-EREC [R]evolution scenarios. Based on these<br />
sources, 3E identified the main types of power generation, their locations and possible penetration levels for the different years.<br />
27 Data from <strong>European</strong> Commission, Direc<strong>to</strong>rate-General for <strong>Energy</strong>, <strong>EU</strong> <strong>Energy</strong> Trends <strong>to</strong> 2030 – Update 2009, ICCS-NTUA for EC,<br />
4 August 2010.<br />
28 Transmission lines were based on the current UCTE map, the ENTSO-E ten year development plan, and EWEA’s 20 Year Offshore<br />
Network Development Master Plan.<br />
30<br />
March 2011
<strong>European</strong> renewable energy grid<br />
2010<br />
This map shows the current role of renewable energy sources<br />
in a fragmented power system. After hydro, wind is the largest<br />
renewable power generation source,with around 4.8% of <strong>EU</strong> electricity<br />
demand. <strong>Wind</strong> energy already has a considerable share in<br />
the Northern German, Danish and Iberian power systems.<br />
<strong>Wind</strong> energy production area<br />
Hydro energy production area<br />
Ocean energy production area<br />
Biomass energy production area<br />
Solar energy production area<br />
Main consumption area<br />
Power corridor<br />
Cyprus<br />
Design: www.onehemisphere.se<br />
<strong>EU</strong> <strong>Energy</strong> <strong>Policy</strong> <strong>to</strong> <strong>2050</strong> - Achieving 80-95% emissions reductions<br />
31
Beyond 2020: <strong>EU</strong> energy policy 2020 – <strong>2050</strong><br />
<strong>European</strong> renewable energy grid<br />
2020<br />
<strong>The</strong> map for 2020 – the target year of the 2009 Renewable <strong>Energy</strong> Directive -<br />
shows the increasingly important role of renewable energy. In 2020, 230 GW of<br />
wind power is expected <strong>to</strong> supply between 14 and 18% of <strong>EU</strong> electricity demand,<br />
of which 40 GW would be offshore. <strong>Wind</strong> energy becomes more significant in the<br />
North Sea neighbouring countries, the Baltic Sea and in the Iberian Peninsula.<br />
<strong>Wind</strong> energy production area<br />
Hydro energy production area<br />
Ocean energy production area<br />
Biomass energy production area<br />
Solar energy production area<br />
Main consumption area<br />
Power corridor<br />
Cyprus<br />
Design: www.onehemisphere.se<br />
32<br />
March 2011
<strong>European</strong> renewable energy grid<br />
2030<br />
Renewable energy significantly increases from 2020 <strong>to</strong> 2030. This map shows<br />
the dominant role of wind power in the North Sea neighbouring countries,<br />
much facilitated by the development of the North Sea offshore grid. It also<br />
represents the growing role of pho<strong>to</strong>voltaic (PV) and concentrated solar power<br />
(CSP) in the Southern <strong>European</strong> and biomass in Eastern <strong>European</strong> systems.<br />
<strong>Wind</strong> energy production area<br />
Hydro energy production area<br />
Ocean energy production area<br />
Biomass energy production area<br />
Solar energy production area<br />
Main consumption area<br />
Power corridor<br />
Cyprus<br />
Design: www.onehemisphere.se<br />
<strong>EU</strong> <strong>Energy</strong> <strong>Policy</strong> <strong>to</strong> <strong>2050</strong> - Achieving 80-95% emissions reductions<br />
33
Beyond 2020: <strong>EU</strong> energy policy 2020 – <strong>2050</strong><br />
<strong>European</strong> renewable energy grid<br />
2040<br />
Due <strong>to</strong> increased power demand and a more integrated electricity market,<br />
renewable energy penetration levels increase significantly by 2040. <strong>Wind</strong><br />
power in the North and Baltic sea neighbouring countries, hydro in Scandinavia<br />
and in the Alps, PV/CSP in Southern Europe, biomass in eastern Europe<br />
and marine renewables in the North Atlantic area, will all contribute.<br />
<strong>Wind</strong> energy production area<br />
Hydro energy production area<br />
Ocean energy production area<br />
Biomass energy production area<br />
Solar energy production area<br />
Main consumption area<br />
Power corridor<br />
Cyprus<br />
Design: www.onehemisphere.se<br />
34<br />
March 2011
<strong>European</strong> renewable energy grid<br />
<strong>2050</strong><br />
In <strong>2050</strong> the system operates with 100% renewables, with the necessary grid<br />
infrastructure in place and full market integration. <strong>Wind</strong> power will meet up <strong>to</strong><br />
50% of Europe’s electricity demand, dominating in the North Sea and Baltic Sea<br />
areas, and the Iberian Peninsula, Southern France and Central Italy. Variable<br />
renewables will be balanced with hydro power production in Scandinavia, the Alps<br />
and the Iberian Peninsula. Pho<strong>to</strong>voltaic and concentrated solar power will play a<br />
crucial role in the Southern <strong>European</strong> power market, and biomass generation in<br />
Central and Eastern <strong>European</strong> countries.<br />
<strong>Wind</strong> energy production area<br />
Hydro energy production area<br />
Ocean energy production area<br />
Biomass energy production area<br />
Solar energy production area<br />
Main consumption area<br />
Power corridor<br />
Cyprus<br />
Design: www.onehemisphere.se<br />
<strong>EU</strong> <strong>Energy</strong> <strong>Policy</strong> <strong>to</strong> <strong>2050</strong> - Achieving 80-95% emissions reductions<br />
35
XXX<br />
© Nordex<br />
National Renewable <strong>Energy</strong> Action Plans:<br />
QUANTITATIVE analysis
<strong>The</strong> <strong>EU</strong>-27 NREAPs: key headline<br />
figures<br />
• Renewable energy will meet 20.7% of the <strong>EU</strong>’s energy<br />
needs in 2020, exceeding the <strong>EU</strong>’s 20% target by<br />
0.7 percentage points;<br />
• Renewable energy will supply 1,217 28 TWh of electricity<br />
meeting 34% of Europe’s <strong>to</strong>tal electricity demand<br />
in 2020;<br />
• Renewable energy will supply 22.2% of heating and<br />
cooling, and 11.2% of transport;<br />
• <strong>Wind</strong> energy will supply 14% (494.7 TWh from 213<br />
GW installed capacity) of Europe’s <strong>to</strong>tal electricity<br />
demand in 2020, up from 2.3% in 2005, and 5.3%<br />
in 2010;<br />
- Hydro will meet 10.5% of Europe’s electricity<br />
demand (370.3 TWh from 136 GW of installed<br />
capacity);<br />
- Biomass will meet 6.7% of demand (232 TWh<br />
from 43 GW of installed capacity);<br />
- Solar PV will meet 2.4% of electricity demand<br />
(83.3 TWh from 84 GW of installed capacity);<br />
- Concentrated Solar Power will meet 0.5% of electricity<br />
demand (20 TWh from 7 GW of installed<br />
capacity);<br />
- Geothermal energy will meet 0.3% of electricity<br />
demand (10.7 TWh from 1.6 GW);<br />
- Tidal, wave and ocean energy will meet 0.2% of<br />
electricity demand (5.8 TWh from 2 GW of installed<br />
capacity).<br />
<strong>Wind</strong> energy:<br />
• <strong>Wind</strong> energy will supply 494.7 TWh of electricity<br />
meeting 14% of Europe’s <strong>to</strong>tal electricity demand in<br />
2020, up from 2.3% in 2005, and 5.3% in 2010;<br />
- Ireland will be the Member State with the highest<br />
wind energy penetration level in 2020 at 36.4%<br />
of its <strong>to</strong>tal electricity demand, followed by Denmark<br />
at 31%.<br />
• Annual net installations of wind turbines will increase<br />
steadily from 11.5 GW in 2011 <strong>to</strong> 15.4 GW<br />
in 2020, an average increase of 3.1%;<br />
- <strong>The</strong> annual increase in onshore wind capacity will<br />
remain fairly constant, between 10 GW in 2011<br />
<strong>to</strong> 8.9 GW in 2020, an average net decrease in<br />
installations of 1.5% per year<br />
- <strong>The</strong> annual net increase in offshore wind capacity<br />
will increase steadily from 1.1 GW in 2011 <strong>to</strong><br />
6.5 GW in 2020, an average net increase in installations<br />
of 21.5% per year<br />
- Onshore re-powering – which is not represented<br />
by the NREAPs – will, in EWEA’s view, represent<br />
an increasing part of the annual market from<br />
2010 onwards. <strong>The</strong> annual repowering market<br />
will grow by an average of 40.3% per year from<br />
200 MW in 2011 <strong>to</strong> 4.2 GW in 2020<br />
- <strong>The</strong> annual wind power market – which is not<br />
made apparent by the NREAPs – would therefore<br />
grow by an average 6.1% per year from 11.6 GW<br />
in 2011 <strong>to</strong> 19.6 GW in 2020<br />
• Cumulative installed capacity will more than double<br />
from 84.5 GW at the end of 2010 <strong>to</strong> reach<br />
213.4 GW in 2020, a compound annual growth rate<br />
(CAGR) of 9.7% over 10 years;<br />
- Cumulative onshore capacity will increase steadily,<br />
from 92 GW in 2011 <strong>to</strong> 170 GW in 2020<br />
- Cumulative offshore capacity will increase<br />
steadily, from 3.7 GW in 2011 <strong>to</strong> 43.3 GW<br />
in 2020<br />
Flexibility/cooperation mechanisms<br />
Only two Member States indicate that they will not be<br />
able <strong>to</strong> meet their binding national target domestically:<br />
Luxembourg and Italy. However, their deficits (93<br />
K<strong>to</strong>e and 1,127 K<strong>to</strong>e respectively in 2020) remain<br />
marginal compared <strong>to</strong> the surpluses forecast in the<br />
15 Member States that indicate they will exceed their<br />
targets (8,991 K<strong>to</strong>e).<br />
28 EWEA is aware of a discrepancy across the 27 NREAPs between renewable electricity production (1,217 TWh for <strong>EU</strong>-27)<br />
and Member States’ reporting of “renewable energy contribution <strong>to</strong> final energy consumption” (the equivalent of 1,199 TWh<br />
expressed in K<strong>to</strong>e). This discrepancy can be due, inter alia, <strong>to</strong> rounding errors, miscalculations or Member States’ taking in<strong>to</strong><br />
account grid losses. <strong>The</strong>refore readers of this document and other analysis documents will come across the two different figures.<br />
<strong>EU</strong> <strong>Energy</strong> <strong>Policy</strong> <strong>to</strong> <strong>2050</strong> - Achieving 80-95% emissions reductions<br />
37
National Renewable <strong>Energy</strong> Action Plans:<br />
quantitative analysis<br />
Renewable energy targets<br />
Taking the National Renewable <strong>Energy</strong> Action Plans <strong>to</strong>gether, the <strong>EU</strong>’s 20% renewable energy target by 2020<br />
would be exceeded by 0.7 percentage points.<br />
TABLE 2: National renewable energy target (directive 28/2009/EC)<br />
SHARE OF ENERGY FROM<br />
RENEWABLE SOURCES IN<br />
FINAL CONSUMPTION<br />
2005<br />
<strong>EU</strong> TARGET: SHARE OF<br />
ENERGY FROM RENEWABLE<br />
SOURCES IN FINAL<br />
CONSUMPTION 2020<br />
NREAP AGGREGATE SHARE<br />
OF RENEWABLE SOURCES<br />
IN FINAL CONSUMPTION<br />
2020<br />
<strong>EU</strong> 8.5% 20% 20.7%<br />
Electricity from renewable sources represents the<br />
largest share of the overall target, forecast in the 27<br />
NREAPs as meeting 34% of consumption. Heating<br />
and cooling is forecast at 22.2% and the 10% RES<br />
in transport target should be exceeded by 1.2<br />
percentage points.<br />
TABLE 3: Share of renewables in electricity (RES-E), heating & cooling (RES-H&C) and transport (RES-T) in meeting <strong>EU</strong><br />
2020 renewable energy target<br />
RES-E 34%<br />
RES-H&C 22.2%<br />
RES-T 11.2%<br />
38<br />
March 2011
<strong>The</strong> <strong>EU</strong> electricity mix<br />
According <strong>to</strong> the National Renewable <strong>Energy</strong> Action<br />
Plans, wind energy will be the largest contribu<strong>to</strong>r <strong>to</strong><br />
meeting the renewable energy targets in the electricity<br />
sec<strong>to</strong>r supplying 14% of <strong>EU</strong> electricity by 2020.<br />
<strong>The</strong> share of hydro in the electricity mix is set <strong>to</strong> drop<br />
slightly from its 2005 level, whereas onshore wind<br />
increases its penetration five-fold. <strong>The</strong> action plans<br />
forecast that biomass will meet 6.6% of electricity demand<br />
by 2020 and offshore wind 4% of <strong>EU</strong> electricity<br />
demand (a 65-fold increase compared <strong>to</strong> 2005).<br />
fig 9: <strong>EU</strong> electricity mix in 2005 (share of <strong>to</strong>tal<br />
consumption) – Total 3,270.3 TWh<br />
fig 10: <strong>EU</strong> electricity mix in 2020 (NREAP) (share of<br />
<strong>to</strong>tal consumption) – Total 3,537.3 TWh<br />
Hydro<br />
10.60%<br />
Non-renewable electricity<br />
84.81%<br />
Biomass<br />
2.17%<br />
<strong>Wind</strong> onshore<br />
2.12%<br />
Geothermal<br />
0.18%<br />
<strong>Wind</strong> offshore<br />
0.06%<br />
PV<br />
0.04%<br />
Tidal & wave<br />
0.02%<br />
Hydro<br />
10.47%<br />
Non-renewable electricity<br />
65.58%<br />
Biomass<br />
6.56%<br />
<strong>Wind</strong> onshore<br />
10%<br />
<strong>Wind</strong> offshore<br />
4%<br />
PV<br />
2.36%<br />
Geothermal<br />
0.30%<br />
CSP<br />
0.57%<br />
Tidal & wave<br />
0.16%<br />
<strong>EU</strong> <strong>Energy</strong> <strong>Policy</strong> <strong>to</strong> <strong>2050</strong> - Achieving 80-95% emissions reductions<br />
39
National Renewable <strong>Energy</strong> Action Plans:<br />
quantitative analysis<br />
<strong>The</strong> <strong>EU</strong>’s renewable capacity mix 2005 – 2020<br />
Onshore wind is set <strong>to</strong> have the largest installed capacity<br />
in the renewables sec<strong>to</strong>r (35% of <strong>to</strong>tal installed<br />
capacity) in 2020, followed by hydro at 28%. Solar<br />
pho<strong>to</strong>voltaic installations will represent 17% of <strong>to</strong>tal<br />
renewable electricity capacity, followed by offshore<br />
wind and biomass. In all, <strong>to</strong>tal installed renewable<br />
electricity capacity is set <strong>to</strong> more than triple from 175<br />
GW installed in 2005 <strong>to</strong> over 487 GW in 2020, including<br />
213 GW of wind power capacity.<br />
fig 11: technology share of <strong>EU</strong> installed Renewable<br />
power capacity in 2005 (GW) - Total 175.1 GW<br />
fig 12: technology share of <strong>EU</strong> installed Renewable<br />
power capacity IN 2020 (GW) – Total 487.2 GW<br />
Geothermal<br />
PV<br />
0.7 GW/0.4%<br />
2.2 GW/1.3%<br />
<strong>Wind</strong> offshore<br />
0.7 GW/0.4%<br />
Biomass<br />
16GW/9.1%<br />
Tidal & wave<br />
0.2 GW/0.1%<br />
Tidal & wave<br />
CSP 2 GW/0.4%<br />
7 GW/1.4%<br />
Biomass<br />
43.2 GW<br />
8.9%<br />
Geothermal<br />
1.6 GW/0.3%<br />
<strong>Wind</strong> onshore<br />
40.1 GW/22.9%<br />
Hydro<br />
115.1 GW/65.7%<br />
PV<br />
84.4 GW/17.3%<br />
<strong>Wind</strong> onshore<br />
170.1 GW/34.9%<br />
Hydro<br />
135.6 GW/27.8%<br />
<strong>Wind</strong><br />
offshore<br />
43.3 GW<br />
8.9%<br />
40<br />
March 2011
<strong>Wind</strong> energy in the national power mix<br />
According <strong>to</strong> the 27 renewable energy action plans,<br />
wind energy production will increase seven-fold from<br />
just over 70 TWh in 2005 <strong>to</strong> 495 TWh in 2020, meeting<br />
14% of <strong>EU</strong> consumption.<br />
Looking at the Member States individually, the Irish<br />
action plan shows wind meeting over 36% of the<br />
country’s electricity demand. Denmark, currently the<br />
country with the largest wind energy penetration, is<br />
set <strong>to</strong> cover 31% of its electricity demand with wind<br />
power. Slovenia is the <strong>EU</strong> country with the smallest<br />
forecast penetration of wind power, with the NREAP<br />
assuming that only 1.3% of electricity consumption<br />
will be met by wind energy.<br />
fig 13: <strong>Wind</strong> power production in the <strong>EU</strong> – TWh/share of consumption according <strong>to</strong> the Nreaps<br />
TWh<br />
500<br />
400<br />
300<br />
200<br />
100<br />
2 TWh<br />
0.1%<br />
Offshore<br />
Onshore<br />
9 TWh<br />
0.3%<br />
4.7%<br />
156<br />
TWh<br />
12 TWh<br />
0.4%<br />
5.4%<br />
178<br />
TWh<br />
19 TWh<br />
0.6%<br />
5.9%<br />
198<br />
TWh<br />
30 TWh<br />
0,9%<br />
6.5%<br />
217<br />
TWh<br />
40 TWh<br />
1.2%<br />
7%<br />
238<br />
TWh<br />
50 TWh<br />
1.5%<br />
7.6%<br />
259<br />
TWh<br />
65 TWh<br />
1.9%<br />
8.1%<br />
278<br />
TWh<br />
82 TWh<br />
2.4%<br />
8.6%<br />
296<br />
TWh<br />
100 TWh<br />
2.9%<br />
9.1%<br />
317<br />
TWh<br />
118 TWh<br />
3.4%<br />
9.6%<br />
335<br />
TWh<br />
15%<br />
140 TWh<br />
4%<br />
10%<br />
355<br />
TWh<br />
12%<br />
9%<br />
6%<br />
3%<br />
0<br />
2.2%<br />
69<br />
TWh<br />
0%<br />
2005<br />
2010<br />
2011<br />
2012<br />
2013<br />
2014<br />
2015<br />
2016<br />
2017<br />
2018<br />
2019<br />
2020<br />
<strong>EU</strong> <strong>Energy</strong> <strong>Policy</strong> <strong>to</strong> <strong>2050</strong> - Achieving 80-95% emissions reductions<br />
41
National Renewable <strong>Energy</strong> Action Plans:<br />
quantitative analysis<br />
Fig 14: <strong>Wind</strong> energy share of electricity consumption per Member State and <strong>EU</strong> IN 2005, 2010 AND 2020<br />
Ireland<br />
Denmark<br />
Greece<br />
Netherlands<br />
Portugal<br />
Spain<br />
United kingdom<br />
Germany<br />
Es<strong>to</strong>nia<br />
Romania<br />
France<br />
Latvia<br />
Belgium<br />
Lithuania<br />
Poland<br />
Sweden<br />
Malta<br />
Cyprus<br />
Austria<br />
Bulgaria<br />
Finland<br />
Italy<br />
Luxembourg<br />
Hungary<br />
Slovakia<br />
Czech Republic<br />
Slovenia<br />
<strong>European</strong> Union<br />
2005<br />
2010<br />
2020<br />
0% 5% 10% 15% 20% 25% 30% 35% 40%<br />
* 2005 and 2020 data from NREAPs, 2009 data is calculated on the basis of production in average wind year<br />
divided by energy supplied data from Eurostat, November 2010.<br />
42<br />
March 2011
TABLE 4: <strong>Wind</strong> energy share of electricity consumption per Member State and <strong>EU</strong><br />
2005 2010* 2020<br />
Ireland 5.9% 10.1% 36.4%<br />
Denmark 17.9% 24.0% 31%<br />
Greece 2% 3.7% 24.5%<br />
Netherlands 1.7% 4.1% 23.9%<br />
Portugal 3.4% 14.8% 22.6%<br />
Spain 7.1% 14.4% 20.9%<br />
United kingdom 0.8% 3.2% 20.8%<br />
Germany 4.4% 9.4% 18.5%<br />
<strong>European</strong> Union 2.3% 5.3% 14%<br />
Es<strong>to</strong>nia 0.6% 3.2% 14%<br />
Romania 0% 1.6% 11.4%<br />
France 0.2% 2.3% 10.6%<br />
Latvia 0.1% 0,8% 10.4%<br />
Belgium 0.3% 2.3% 9.5%<br />
Lithuania 0% 2.5% 9.4%<br />
Poland 0% 1.5% 9%<br />
Sweden 0.7% 3.2% 8.1%<br />
Malta 0% 0% 7.7%<br />
Cyprus 0% 3.4% 6.8%<br />
Austria 2% 3.0% 6.5%<br />
Bulgaria 0% 2.0% 6.3%<br />
Finland 0.2% 0.5% 6%<br />
Italy 0.8% 3.4% 5.3%<br />
Luxembourg 0.8% 1.1% 3.6%<br />
Hungary 0% 1.4% 3.1%<br />
Slovakia 0% 0% 1.8%<br />
Czech Republic 0% 0.5% 1.8%<br />
Slovenia 0% 0% 1.3%<br />
* 2010 data is calculated on the basis of provisional Eurostat data and may not be fully consistent with other<br />
figures in this document.<br />
<strong>EU</strong> <strong>Energy</strong> <strong>Policy</strong> <strong>to</strong> <strong>2050</strong> - Achieving 80-95% emissions reductions<br />
43
National Renewable <strong>Energy</strong> Action Plans:<br />
quantitative analysis<br />
Renewable energy in the national power mix<br />
Looking at the Member States individually, the Austrian<br />
action plan shows renewables meeting over 70% of<br />
the country’s electricity demand. Hungary is the <strong>EU</strong><br />
country with the smallest forecast penetration of renewables,<br />
with the NREAP assuming that only 11%<br />
of electricity consumption will be met by renewables.<br />
Fig 15: RENEWABLE electricity production per Member State in 2020 - Total 1,217 TWh<br />
Germany<br />
Spain<br />
France<br />
United Kingdom<br />
Italy<br />
Sweden<br />
Austria<br />
Netherlands<br />
Portugal<br />
Finland<br />
Poland<br />
Romania<br />
Greece<br />
Belgium<br />
Denmark<br />
<strong>Wind</strong><br />
Ireland<br />
Czech Republic<br />
Hydro<br />
Slovakia<br />
Bulgaria<br />
Biomass<br />
Slovenia<br />
Hungary<br />
PV<br />
Latvia<br />
Lithuania<br />
CSP<br />
Es<strong>to</strong>nia<br />
Geothermal<br />
Cyprus<br />
Luxembourg<br />
Tidal & Wave<br />
Malta<br />
0 TWh 50 TWh 100 TWh 150 TWh 200 TWh 250 TWh<br />
44<br />
March 2011
Table 4: RENEWABLE electricity production per member state in 2020 (TWh)<br />
MEMBER STATE WIND HYDRO BIOMASS PV CSP<br />
GEO-<br />
THERMAL<br />
TIDAL<br />
& WAVE<br />
TOTAL<br />
Germany 104.43 20 49.46 41.39 0 1.65 0 216.9<br />
Spain 78.3 39.6 10 14.3 15.4 0 0 157.6<br />
France 57.9 71.7 17.2 5.9 1 0.5 1.2 155.4<br />
United Kingdom 78.3 6.4 26.2 2.2 0 0 4 117.1<br />
Italy 20 42 18.8 9.7 1.7 6.8 0.005 99<br />
Sweden 12.5 68 16.7 0.004 0 0 0 97.2<br />
Austria 4.8 42.1 5.1 0.3 0 0.002 0 52.3<br />
Netherlands 32.4 0.71 16.7 0.57 0 0 0 50.4<br />
Portugal 14.58 14.1 3.52 1.5 1 0.5 0.4 35.6<br />
Finland 6.1 14.4 12.9 0 0 0 0 33.4<br />
Poland 15.2 3 14.2 0.003 0 0 0 32.4<br />
Romania 8.4 19.8 2.9 0.3 0 0 0 31.4<br />
Greece 16.8 6.6 1.26 2.9 0.71 0.74 0 29<br />
Belgium 10.5 0.44 11.04 1.14 0 0.03 0 23.1<br />
Denmark 11.71 0.03 8.85 0.004 0 0 0 20.6<br />
Ireland 11.97 0.7 1 0 0 0 0.23 13.9<br />
Czech Republic 1.5 2.27 6.17 1.73 0 0.02 0 11.7<br />
Slovakia 0.6 5.4 1.7 0.3 0 0.03 0 8<br />
Bulgaria 2.26 3.95 0.87 0.45 0 0 0 7.5<br />
Slovenia 0.2 5.1 0.7 0.1 0 0 0 6.1<br />
Hungary 1.55 0.24 3.32 0.08 0 0.41 0 5.6<br />
Latvia 0.91 3.1 1.22 0.004 0 0 0 5.2<br />
Lithuania 1.25 0.47 1.22 0.02 0 0 0 3<br />
Es<strong>to</strong>nia 1.53 0.03 0.35 0 0 0 0 1.9<br />
Cyprus 0.5 0 0.14 0.31 0.22 0 0 1.17<br />
Luxembourg 0.24 0.12 0.33 0.08 0 0 0 0.8<br />
Malta 0.26 0 0.14 0.04 0 0 0 0.4<br />
<strong>EU</strong> 494.7 370.3 232 83.3 20 10.7 5.8 1,216.8<br />
<strong>EU</strong> <strong>Energy</strong> <strong>Policy</strong> <strong>to</strong> <strong>2050</strong> - Achieving 80-95% emissions reductions<br />
45
National Renewable <strong>Energy</strong> Action Plans:<br />
quantitative analysis<br />
Fig 16: RENEWABLE ELECTRICITY SHARE OF CONSUMPTION PER MEMBER STATE IN 2020 (%)<br />
Austria<br />
Sweden<br />
Latvia<br />
Portugal<br />
Denmark<br />
Ireland<br />
Romania<br />
Spain<br />
Greece<br />
Slovenia<br />
Germany<br />
Netherlands<br />
Finland<br />
United Kingdom<br />
France<br />
Italy<br />
Slovakia<br />
Lithuania<br />
Bulgaria<br />
Belgium<br />
Poland<br />
Es<strong>to</strong>nia<br />
Cyprus<br />
Malta<br />
Czech Republic<br />
Luxembourg<br />
Hungary<br />
<strong>EU</strong><br />
<strong>Wind</strong><br />
Hydro<br />
Biomass<br />
PV<br />
CSP<br />
Geothermal<br />
Tidal & Wave<br />
0% 10% 20% 30% 40% 50% 60% 70% 80%<br />
46<br />
March 2011
Table 5: RENEWABLE ELECTRICITY consumption per member state (%)<br />
MEMBER STATE WIND HYDRO BIOMASS PV CSP<br />
GEO-<br />
THERMAL<br />
TIDAL<br />
& WAVE<br />
Austria 6% 57% 7% 0% 0% 0% 0% 70%<br />
Sweden 8% 44% 11% 0% 0% 0% 0% 63%<br />
Latvia 10% 35% 14% 0% 0% 0% 0% 59%<br />
Portugal 23% 22% 5% 2% 2% 1% 1% 56%<br />
Denmark 10% 0% 23% 0% 0% 0% 0% 33%<br />
Ireland 37% 2% 3% 0% 0% 0% 1% 43%<br />
Romania 11% 27% 4% 0% 0% 0% 0% 42%<br />
Spain 20% 10% 3% 4% 4% 0% 0% 41%<br />
Greece 24% 9% 2% 4% 1% 1% 0% 41%<br />
Slovenia 1% 33% 4% 1% 0% 0% 0% 39%<br />
Germany 19% 4% 9% 7% 0% 0% 0% 39%<br />
Netherlands 24% 1% 12% 0% 0% 0% 0% 37%<br />
Finland 6% 14% 13% 0% 0% 0% 0% 33%<br />
United Kingdom 21% 2% 7% 1% 0% 0% 1% 32%<br />
France 11% 13% 3% 1% 0% 0% 0% 28%<br />
Italy 5% 11% 5% 3% 0% 2% 0% 26%<br />
Slovakia 2% 16% 5% 1% 0% 0% 0% 24%<br />
Lithuania 9% 3% 9% 0% 0% 0% 0% 21%<br />
Bulgaria 6% 11% 2% 1% 0% 0% 0% 20%<br />
Belgium 9% 0% 10% 1% 0% 0% 0% 20%<br />
Poland 9% 2% 9% 0% 0% 0% 0% 20%<br />
Es<strong>to</strong>nia 14% 0% 3% 0% 0% 0% 0% 17%<br />
Cyprus 7% 0% 2% 4% 3% 0% 0% 16%<br />
Malta 9% 0% 5% 1% 0% 0% 0% 15%<br />
Czech Republic 2% 3% 7% 2% 0% 0% 0% 14%<br />
Luxembourg 4% 2% 5% 1% 0% 0% 0% 12%<br />
Hungary 3% 0% 6% 1% 0% 1% 0% 11%<br />
TOTAL<br />
<strong>EU</strong> <strong>Energy</strong> <strong>Policy</strong> <strong>to</strong> <strong>2050</strong> - Achieving 80-95% emissions reductions<br />
47
National Renewable <strong>Energy</strong> Action Plans:<br />
quantitative analysis<br />
<strong>Wind</strong> power annual and cumulative installations<br />
Adding up the 27 NREAPs, <strong>to</strong>tal wind power capacity<br />
increases from just under 84.5 GW in 2010 (actual<br />
84.3 GW) <strong>to</strong> 213.4 GW in 2020. From 2.5 GW forecast<br />
in 2010 (actual 2.9 GW), 43.3 GW of offshore<br />
wind energy capacity is set <strong>to</strong> be operating by 2020.<br />
<strong>The</strong> increase in onshore wind power capacity will<br />
peak in 2011 and then decline on average by just<br />
over 1.5% per year. <strong>The</strong> increase in offshore wind capacity,<br />
on the other hand, is forecast <strong>to</strong> grow steadily<br />
up <strong>to</strong> 2020 with annual increases starting at 1.1 GW<br />
in 2011 and reaching 6.5 GW in 2020; an annual increase<br />
in capacity of 21.5%.<br />
Based on EWEA’s calculations, onshore re-powering<br />
(the replacement of old turbines with new models) –<br />
which is not made apparent by the NREAPs - will represent<br />
an increasing part of the annual market from 2010<br />
onwards. Re-powering hits 1 GW in 2015 and continues<br />
<strong>to</strong> grow steadily <strong>to</strong> over 4 GW by 2020. EWEA foresees<br />
no offshore repowering during the period.<br />
In this document EWEA analyses the cumulative figures<br />
provided by <strong>EU</strong> member states in their National<br />
Renewable <strong>Energy</strong> Action Plans. <strong>The</strong> EWEA Members’<br />
Lounge provides more in-depth analysis of the individual<br />
NREAPs and is available <strong>to</strong> <strong>European</strong> policymakers<br />
and EWEA members only.<br />
While much remains <strong>to</strong> be done <strong>to</strong> achieve the 20%<br />
target EWEA believes that it will be exceeded. Indeed,<br />
EWEA’s “baseline” scenario assumes a <strong>to</strong>tal<br />
installed capacity of wind power in the <strong>EU</strong> by 2020 of<br />
230 GW, producing 581 TWh of electricity, meeting<br />
between 15.7% and 16.5% of <strong>EU</strong> electricity demand.<br />
This compares <strong>to</strong> 213 GW installed capacity producing<br />
494.7 TWh according <strong>to</strong> the NREAPs.<br />
fig 17: ESTIMATE OF THE TOTAL MARKET FOR WIND POWER 2011-2020 BROKEN DOWN BY Annual net onshore and offshore<br />
wind power installations in the <strong>EU</strong> and EWEA ESTIMATE OF repowering installations in the <strong>EU</strong> (MW)<br />
20,000<br />
6,534<br />
Onshore<br />
Onshore repowering<br />
Offshore<br />
5,277<br />
5,686<br />
15,000<br />
4,817<br />
5,404<br />
1,134<br />
2,105<br />
3,317<br />
3,211<br />
3,249<br />
10,000<br />
200<br />
300<br />
700<br />
1,000<br />
1,300 1,900<br />
2,600<br />
3,500<br />
4,200<br />
500<br />
5,000<br />
10,195<br />
9,255<br />
8,043<br />
8,433 9,077<br />
8,266 8,200<br />
9,114<br />
8,260 8,889<br />
0<br />
2011<br />
2012<br />
2013<br />
2014<br />
2015<br />
2016<br />
2017<br />
2018<br />
2019<br />
2020<br />
48<br />
March 2011
fig 18: Cumulative wind power installations in the <strong>EU</strong> (MW)<br />
250,000<br />
Onshore<br />
Offshore<br />
43,324<br />
200,000<br />
36,790<br />
31,104<br />
25,827<br />
20,423<br />
150,000<br />
15,606<br />
12,357<br />
9,146<br />
5,829<br />
100,000<br />
50,000<br />
2,590<br />
82,232<br />
3,724<br />
92,518<br />
101,773<br />
109,815<br />
118,248<br />
127,324 135,590<br />
143,790<br />
152,905<br />
161,165<br />
170,054<br />
0<br />
2010<br />
2011<br />
2012<br />
2013<br />
2014<br />
2015<br />
2016<br />
2017<br />
2018<br />
2019<br />
2020<br />
<strong>EU</strong> <strong>Energy</strong> <strong>Policy</strong> <strong>to</strong> <strong>2050</strong> - Achieving 80-95% emissions reductions<br />
49
XXX<br />
© Pho<strong>to</strong>: <strong>Energy</strong>picturesonline<br />
NATIONAL RENEWABLE ENERGY ACTION PLANS:<br />
QUALITATIVE ANALYSIS
Introduction<br />
Directive 28/2009/EC on the promotion of the use of<br />
energy from renewable sources sets each <strong>EU</strong> Member<br />
State a binding 2020 target for the share of renewables<br />
in gross energy consumption. <strong>The</strong> directive<br />
also sets each Member State an indicative trajec<strong>to</strong>ry<br />
<strong>to</strong> be followed between 2010 and 2020 <strong>to</strong> reach the<br />
final binding target.<br />
Importantly, the directive requires each Member<br />
State <strong>to</strong> submit a National Renewable <strong>Energy</strong> Action<br />
Plan (NREAP) detailing all legislation affecting renewables<br />
(from spatial planning <strong>to</strong> grids and support<br />
mechanisms) and explain what measures will be taken<br />
<strong>to</strong> streamline procedures and generally promote<br />
energy from renewable energy sources.<br />
<strong>The</strong> NREAPs, which follow a binding template, also<br />
indicate separate or ‘sec<strong>to</strong>ral’ targets for electricity,<br />
heating, and cooling and transport. Within these sec<strong>to</strong>ral<br />
targets, Member States are required <strong>to</strong> indicate<br />
the contribution of each renewable energy (RES) technology<br />
and its share of consumption estimated using<br />
a high energy efficiency scenario.<br />
<strong>The</strong> following section gives a brief overview of the<br />
27 NREAPs and how Member States’ targets for<br />
wind compare with EWEA’s 2009 forecast 29 . <strong>The</strong><br />
27 NREAPs differ significantly in quality and level of<br />
detail. However, it remains <strong>to</strong> be seen how Member<br />
States implement the planned measures <strong>to</strong> increase<br />
installed renewable energy capacity and whether they<br />
will exceed, reach or fall short of their targets.<br />
Nevertheless, analysing the action plans, it is clear<br />
the <strong>EU</strong>-wide ambition for wind energy in 2020 is <strong>to</strong><br />
reach over 213 GW cumulative capacity (of which 43<br />
GW offshore), producing 495 TWh and meeting 14%<br />
of the <strong>EU</strong>’s power consumption. Given the weaknesses<br />
identified in the national actions plans concerning<br />
potential wind power installations, in particular onshore,<br />
EWEA maintains its baseline scenario of 230<br />
GW, and its high scenario of 265 GW.<br />
29 Pure Power – wind energy targets for 2020 and 2030, EWEA (2009) http://www.ewea.org/fileadmin/ewea_documents/documents/<br />
publications/reports/Pure_Power_Full_Report.pdf<br />
<strong>EU</strong> <strong>Energy</strong> <strong>Policy</strong> <strong>to</strong> <strong>2050</strong> - Achieving 80-95% emissions reductions<br />
51
National Renewable <strong>Energy</strong> Action Plans:<br />
qualitative analysis<br />
Austria<br />
With large hydro resources, Austria intends <strong>to</strong> meet<br />
its overall 34% renewables (RES) target largely<br />
through the increase of renewables in the power mix.<br />
As such, Austria has set itself the highest target of<br />
electricity from renewables (RES-E) of any <strong>EU</strong> Member<br />
State: 71% in 2020.<br />
Overall, the Austrian National Renewable <strong>Energy</strong><br />
Action Plan expects <strong>to</strong> slightly exceed its 2020 target.<br />
However, as the authors of the document have<br />
increased the 2005 baseline by over 1 percentage<br />
point, the established indicative trajec<strong>to</strong>ry has become<br />
significantly easier <strong>to</strong> follow. <strong>The</strong> authors of the<br />
plan expect Austria <strong>to</strong> exceed 30% RES as early as<br />
2010. <strong>The</strong> document does not foresee any use of cooperation<br />
mechanisms with other Member States.<br />
According <strong>to</strong> the plan, with a cumulative installed capacity<br />
of 2.6 GW, wind should represent less than<br />
10% of the RES-E target, covering just below 7% of<br />
<strong>to</strong>tal electricity consumption in 2020. This is significantly<br />
below EWEA’s 2009 scenario, which put Austria’s<br />
2020 wind potential between 3.5 GW and 4 GW,<br />
meeting 9.5% <strong>to</strong> 11% of electricity consumption.<br />
After several years of stagnation in the Austrian wind<br />
power market, the action plan expects a handful of<br />
new wind power megawatts <strong>to</strong> come online in 2010,<br />
increasing <strong>to</strong> over 220 MW by 2011. From 2012 onwards,<br />
the increase in net annual capacity is expected<br />
<strong>to</strong> diminish by 10 MW <strong>to</strong> 20 MW per year, reaching<br />
107 MW annually in 2020.<br />
2020 RES target<br />
in Directive<br />
28/2009/EC<br />
2020 RES target in<br />
NREAP<br />
2020 RES-E target<br />
in NREAP<br />
<strong>Wind</strong> capacity<br />
installed at end<br />
2010<br />
2020 wind capacity<br />
in NREAP<br />
2020 wind Production<br />
in NREAP<br />
34% 34.2% 71% 1,011 MW 2,578 MW 4.8 TWh 6.5%<br />
Belgium<br />
2020 wind share<br />
of electricity consumption<br />
in NREAP<br />
Belgium has an overall 13% RES target from 2020, up<br />
from just over 2% in 2005, the directive’s base year.<br />
<strong>The</strong> National Renewable <strong>Energy</strong> Action Plan indicates<br />
that Belgium expects <strong>to</strong> be slightly above its indicative<br />
trajec<strong>to</strong>ry throughout, and end in 2020 producing<br />
a small excess of 5.4 Kilo<strong>to</strong>nne Oil Equivalent (K<strong>to</strong>e).<br />
<strong>The</strong> Belgian authorities forecast that renewable electricity<br />
(RES-E) will represent the largest share of RES<br />
in 2020 (20.9%). With an annual production in 2020<br />
estimated at 10.5 TWh, wind energy will cover 9.5%<br />
of all electricity consumption. RES in the heating and<br />
cooling sec<strong>to</strong>r (RES-H) is forecast at 11.9% and renewables<br />
in transport (RES-T) at 10.1%.<br />
<strong>The</strong> NREAP does not respect the Commission’s binding<br />
template and does not present an onshore/offshore<br />
breakdown for either installed capacity or<br />
power production. However, information obtained by<br />
EWEA suggests that Belgium’s offshore wind target<br />
will be 2 GW by 2020.<br />
Nevertheless, net annual wind installations are forecast<br />
<strong>to</strong> grow steadily from just over 200 MW in 2012<br />
<strong>to</strong> over 480 MW in 2018, 2019 and 2020. It is estimated<br />
that by 2020, cumulative capacity will be<br />
4,320 MW, matching EWEA’s 2009 forecast.<br />
In terms of legislative framework at both regional and<br />
national level, the NREAP does not announce significant<br />
changes with some new measures foreseen at<br />
regional level.<br />
Given the recent growth in the wind energy sec<strong>to</strong>r, the<br />
NREAP’s target seems easily achievable.<br />
2020 RES target<br />
in Directive<br />
28/2009/EC<br />
2020 RES target in<br />
NREAP<br />
2020 RES-E target<br />
in NREAP<br />
<strong>Wind</strong> capacity<br />
installed at end<br />
2010<br />
2020 wind capacity<br />
in NREAP<br />
2020 wind Production<br />
in NREAP<br />
13% 13% 20.9% 911 MW 4,320 MW 10.5 TWh 9.5%<br />
2020 wind share<br />
of electricity consumption<br />
in NREAP<br />
52<br />
March 2011
Bulgaria<br />
Bulgaria’s action plan highlights the country’s desire<br />
<strong>to</strong> exceed its indicative trajec<strong>to</strong>ry and binding target<br />
by almost three percentage points - the biggest excess<br />
of any <strong>EU</strong> Member State. <strong>The</strong> Bulgarian authorities<br />
have clearly earmarked this excess for use in<br />
co-operation mechanisms with other Member States.<br />
It may be difficult for Bulgaria <strong>to</strong> achieve its targets in<br />
the power sec<strong>to</strong>r (21% RES-E up from 11% in 2005),<br />
however, given the power mix forecast in the plan.<br />
According <strong>to</strong> the NREAP, more hydro capacity will be<br />
installed throughout the ten year period, yet it will apparently<br />
produce less electricity than before. <strong>Wind</strong><br />
power will be the main new RES technology in the<br />
power mix, yet its capacity increase is unambitious<br />
- from just over 330 MW at end 2010 <strong>to</strong> 1,250 MW in<br />
2020 (2.3 TWh) - and little solar and biomass capacity<br />
is planned.<br />
Furthermore, the action plan forecasts virtually no increase<br />
in energy consumption from 2005 <strong>to</strong> 2020,<br />
and does not indicate whether the current feed-in<br />
system for RES will be extended beyond the current<br />
2015 deadline.<br />
With this in mind, the implementation of the Bulgarian<br />
National Renewable <strong>Energy</strong> Action Plan will need<br />
further development. Moreover, EWEA considers that<br />
by 2020, a cumulative wind capacity of 3,000 MW <strong>to</strong><br />
3,500 MW should be achieved.<br />
2020 RES target<br />
in Directive<br />
28/2009/EC<br />
2020 RES target in<br />
NREAP<br />
2020 RES-E target<br />
in NREAP<br />
<strong>Wind</strong> capacity<br />
installed at end<br />
2010<br />
2020 wind capacity<br />
in NREAP<br />
2020 wind Production<br />
in NREAP<br />
16% 18.8% 21% 375 MW 1,256 MW 2.3 TWh 6.3%<br />
2020 wind share<br />
of electricity consumption<br />
in NREAP<br />
Cyprus<br />
With the introduction of a feed-in tariff for large wind<br />
power plants, the Cypriot National Renewable <strong>Energy</strong><br />
Action Plan expects the largest contribution <strong>to</strong> the renewable<br />
electricity target <strong>to</strong> come from wind power<br />
in 2020.<br />
<strong>The</strong> plan estimates that in 2020, 300 MW of new onshore<br />
wind power, producing 0.5 TWh, will cover 6.8%<br />
of <strong>to</strong>tal electricity consumption. In terms of installed<br />
capacity, the targets are in line with EWEA’s 2009<br />
scenario. However, the low capacity fac<strong>to</strong>rs in the<br />
Cypriot document (averaging around 20%) may be underestimating<br />
wind’s electricity production and share<br />
of the power mix.<br />
Overall, the Cypriot action plan expects the country<br />
<strong>to</strong> meet its 13% RES target in 2020, with 16% RES<br />
in the power sec<strong>to</strong>r. <strong>The</strong> plan does not expect Cyprus<br />
<strong>to</strong> participate in co-operation mechanisms with other<br />
Member States.<br />
2020 RES target<br />
in Directive<br />
28/2009/EC<br />
2020 RES target in<br />
NREAP<br />
2020 RES-E target<br />
in NREAP<br />
<strong>Wind</strong> capacity<br />
installed at end<br />
2010<br />
2020 wind capacity<br />
in NREAP<br />
2020 wind Production<br />
in NREAP<br />
13% 13% 16% 82 MW 300 MW 0.5 TWh 6.8%<br />
2020 wind share<br />
of electricity consumption<br />
in NREAP<br />
<strong>EU</strong> <strong>Energy</strong> <strong>Policy</strong> <strong>to</strong> <strong>2050</strong> - Achieving 80-95% emissions reductions<br />
53
National Renewable <strong>Energy</strong> Action Plans:<br />
qualitative analysis<br />
Czech Republic<br />
<strong>The</strong> Czech National Renewable <strong>Energy</strong> Action Plan<br />
forecasts that the country will exceed its 2020 13%<br />
RES target by half a percentage point. Electricity from<br />
renewables should represent 14.3% of consumption<br />
by then according <strong>to</strong> the plan, despite an almost 20%<br />
increase in electricity consumption from 2010.<br />
<strong>The</strong> action plan banks on a net growth in wind capacity<br />
of 50 MW per year <strong>to</strong> 2020. Whereas such a capacity<br />
increase is consistent with past net average annual<br />
growth rates, it would result in an un-ambitious<br />
2020 cumulative capacity of 743 MW; less than half<br />
of EWEA’s scenario of 1,600 <strong>to</strong> 1,800 MW.<br />
Consequently, the NREAP estimates that wind power<br />
will cover less than 2% of gross electricity consumption,<br />
well below EWEA’s 3.4% <strong>to</strong> 3.8% estimate.<br />
Although the NREAP is lower than EWEA’s estimate,<br />
even its unambitious targets will be difficult <strong>to</strong> meet<br />
with the changes in the support mechanism and the<br />
insufficient simplification of the long authorisation<br />
procedures outlined in the plan.<br />
Finally, the authors do not expect the Czech Republic<br />
<strong>to</strong> participate in co-operation mechanisms with other<br />
Member States or third countries.<br />
2020 RES target<br />
in Directive<br />
28/2009/EC<br />
2020 RES target in<br />
NREAP<br />
2020 RES-E target<br />
in NREAP<br />
<strong>Wind</strong> capacity<br />
installed at end<br />
2010<br />
2020 wind capacity<br />
in NREAP<br />
2020 wind Production<br />
in NREAP<br />
13% 13.5% 14.3% 215 MW 743 MW 1.8 TWh 1.5%<br />
Denmark<br />
2020 wind share<br />
of electricity consumption<br />
in NREAP<br />
In 2020, the Danish Renewable <strong>Energy</strong> Action Plan<br />
expects almost 52% of <strong>to</strong>tal electricity consumption<br />
<strong>to</strong> be met by renewables. Almost 60% of this will be<br />
wind, with biomass, essentially, making up the rest.<br />
<strong>The</strong> NREAP thus indicates that Denmark is on track <strong>to</strong><br />
meet and, indeed, exceed its 30% RES target by 0.4<br />
percentage points. In the long term, Danish plans are<br />
for 100% renewables. <strong>The</strong> document indicates that<br />
the excess RES is available for use in co-operation<br />
mechanisms with other Member States.<br />
Denmark’s action plan focuses <strong>to</strong> a large extent on<br />
managing consumption, and only a very slight increase<br />
in electricity demand is expected between<br />
2010 and 2020. Moreover, the plan indicates that<br />
future policies aim <strong>to</strong> reduce energy consumption in<br />
2020 by 4% compared <strong>to</strong> 2006.<br />
However, the Danish action plan forecasts a decrease<br />
in <strong>to</strong>tal installed onshore capacity from over 2,800<br />
MW in 2009 <strong>to</strong> around 2,600 in 2020. This decrease<br />
is barely offset by the expected increase in offshore<br />
capacity which is forecast at 1,339 MW in 2020, up<br />
from 854 MW cumulative capacity at end 2010.<br />
Consequently, overall capacity increases are forecast<br />
up <strong>to</strong> 2013; beyond that, apart from small net capacity<br />
additions in 2016 and 2017, all other years<br />
see more capacity being decommissioned than put<br />
online.<br />
<strong>The</strong> plan contrasts with EWEA’s scenario, where capacity<br />
is expected <strong>to</strong> reach between 6 and 6.5 GW<br />
by 2020. <strong>The</strong> Danish action plan does not fully exploit<br />
the country’s re-powering opportunities onshore<br />
and downplays the offshore potential. With over 850<br />
MW of offshore capacity online at end 2010, a net<br />
capacity increase of less than 500 MW is foreseen.<br />
In February 2011, the Danish government published<br />
a more ambitious new energy strategy, which aims at<br />
meeting 40% of Denmark’s 2020 electricity demand<br />
with wind.<br />
2020 RES target<br />
in Directive<br />
28/2009/EC<br />
2020 RES target in<br />
NREAP<br />
2020 RES-E target<br />
in NREAP<br />
<strong>Wind</strong> capacity<br />
installed at end<br />
2010<br />
2020 wind capacity<br />
in NREAP<br />
2020 wind Production<br />
in NREAP<br />
30% 30.4% 51.9% 3,752 MW 3,960 MW 11.7 TWh 31%<br />
2020 wind share<br />
of electricity consumption<br />
in NREAP<br />
54<br />
March 2011
Es<strong>to</strong>nia<br />
Es<strong>to</strong>nia has a 2020 RES target of 25%. <strong>The</strong> National<br />
Renewable <strong>Energy</strong> Action Plan indicates that in the<br />
electricity sec<strong>to</strong>r renewables should reach 17.6%. Onshore<br />
and offshore wind are the main renewable energy<br />
technologies that will contribute <strong>to</strong> the target,<br />
and are forecast <strong>to</strong> cover 14% of <strong>to</strong>tal electricity consumption<br />
by 2020 (9% and 5% respectively).<br />
With 400 MW of onshore wind power and 250 MW<br />
offshore planned for 2020, the Es<strong>to</strong>nian NREAP is<br />
above EWEA’s forecast of 500 MW. However, EWEA’s<br />
scenario did not take in<strong>to</strong> account offshore capacity<br />
in Es<strong>to</strong>nia. Whereas it should not be problematic for<br />
Es<strong>to</strong>nia <strong>to</strong> reach its onshore target, the offshore target<br />
seems more challenging, but feasible.<br />
<strong>The</strong> build-out rates for wind energy are, on the other<br />
hand, uneven across the period with new annual capacity<br />
onshore peaking in 2012 at over 130 MW and<br />
subsequently dropping <strong>to</strong> less than 40 MW in 2013.<br />
No new onshore capacity is foreseen in the action<br />
plan after 2014. <strong>The</strong> first 100 MW of offshore capacity<br />
are programmed <strong>to</strong> come online in 2016.<br />
<strong>The</strong> uneven onshore growth rate and the sudden s<strong>to</strong>p<br />
foreseen in just four years’ time do not ensure longterm<br />
stability in the wind energy sec<strong>to</strong>r.<br />
2020 RES target<br />
in Directive<br />
28/2009/EC<br />
2020 RES target in<br />
NREAP<br />
2020 RES-E target<br />
in NREAP<br />
<strong>Wind</strong> capacity<br />
installed at end<br />
2010<br />
2020 wind capacity<br />
in NREAP<br />
2020 wind Production<br />
in NREAP<br />
25% 25% 17.6% 149 MW 650 MW 1.5 TWh 14%<br />
Finland<br />
2020 wind share<br />
of electricity consumption<br />
in NREAP<br />
<strong>The</strong> Finnish authorities submitted an incomplete National<br />
Renewable <strong>Energy</strong> Action Plan <strong>to</strong> the <strong>European</strong><br />
Commission.<br />
Nevertheless, the document indicates that Finland<br />
expects <strong>to</strong> meet its 2020 target of 38% RES. <strong>The</strong><br />
power sec<strong>to</strong>r is forecast <strong>to</strong> meet 33% of electricity<br />
consumption from RES. To achieve this, a target of<br />
2,500 MW of wind capacity is set, producing 6.1 TWh<br />
or 6% of <strong>to</strong>tal electricity consumption.<br />
From 2011 <strong>to</strong> 2015, installed onshore wind power<br />
capacity is expected <strong>to</strong> grow by about 100 MW a year<br />
net. In the five subsequent years, net annual increase<br />
in wind capacity is forecast <strong>to</strong> be between 300 and<br />
400 MW. <strong>The</strong> action plan does not expect any offshore<br />
wind installations by 2020 although some 26<br />
MW of near-shore shallow water offshore capacity is<br />
currently grid connected in Finland.<br />
<strong>The</strong> wind power target is consistent with EWEA’s overall<br />
2020 scenario for Finland of 1,900 <strong>to</strong> 3,000 MW.<br />
<strong>The</strong> action plan, however, does not take Finland’s offshore<br />
potential in<strong>to</strong> account in contrast <strong>to</strong> EWEA’s<br />
scenario, which includes 400 MW <strong>to</strong> 1,000 MW of<br />
offshore wind capacity.<br />
2020 RES target<br />
in Directive<br />
28/2009/EC<br />
2020 RES target in<br />
NREAP<br />
2020 RES-E target<br />
in NREAP<br />
<strong>Wind</strong> capacity<br />
installed at end<br />
2010<br />
2020 wind capacity<br />
in NREAP<br />
2020 wind Production<br />
in NREAP<br />
38% 38% 33% 197 MW 2,500 MW 6.1 TWh 6%<br />
2020 wind share<br />
of electricity consumption<br />
in NREAP<br />
<strong>EU</strong> <strong>Energy</strong> <strong>Policy</strong> <strong>to</strong> <strong>2050</strong> - Achieving 80-95% emissions reductions<br />
55
National Renewable <strong>Energy</strong> Action Plans:<br />
qualitative analysis<br />
France<br />
<strong>The</strong> French National Renewable <strong>Energy</strong> Action Plan<br />
expects around 11% of all electricity consumption in<br />
2020 <strong>to</strong> be met by onshore and offshore wind power.<br />
With regards <strong>to</strong> France’s overall 23% RES target for<br />
2020, 27% of power consumption is planned <strong>to</strong> be<br />
met by renewables. After hydro, with a planned 25<br />
GW, of which 6 GW offshore, wind power is the main<br />
renewable technology in the NREAP.<br />
<strong>The</strong> NREAP foresees net annual installations of onshore<br />
wind power remaining over the 1 GW mark in<br />
2010 and reaching almost 1.3 GW in 2011. <strong>The</strong>se<br />
installation rates are consistent with 2008 and 2009<br />
growth. Net increase in onshore wind power subsequently<br />
drops <strong>to</strong> around 770 MW in 2012 and then<br />
grows in a linear fashion <strong>to</strong> 2020.<br />
With a first offshore wind call for tender already announced<br />
in early 2011, the French NREAP expects<br />
offshore wind build-out <strong>to</strong> start as early as 2012.<br />
Although such timing is necessary <strong>to</strong> reach the 6 GW<br />
offshore wind objective by 2020, it seems overly optimistic<br />
considering that there are currently no offshore<br />
turbines in French waters.<br />
Moreover, a five wind turbine minimum size for onshore<br />
wind farms has been introduced and an obligation for<br />
wind turbines <strong>to</strong> be classified under rules governing<br />
dangerous industries (ICPE) could jeopardise the development<br />
of wind power in the more densely populated<br />
areas of the country, characterised <strong>to</strong> date by small<br />
wind projects, and increase administrative burdens.<br />
Overall, the French NREAP’s projections for wind development<br />
are in line with EWEA’s 2009 scenario of<br />
23 GW <strong>to</strong> 26 GW of installed wind capacity, of which<br />
4 GW <strong>to</strong> 6 GW offshore. However, without improvements<br />
<strong>to</strong> administrative procedures, and given the<br />
late start in developing offshore, achieving the targets<br />
could be a challenge<br />
2020 RES target<br />
in Directive<br />
28/2009/EC<br />
2020 RES target in<br />
NREAP<br />
2020 RES-E target<br />
in NREAP<br />
<strong>Wind</strong> capacity<br />
installed at end<br />
2010<br />
2020 wind capacity<br />
in NREAP<br />
2020 wind Production<br />
in NREAP<br />
23% 38% 27% 5,660 MW 25,000 MW 57.9 TWh 10.6%<br />
Germany<br />
2020 wind share<br />
of electricity consumption<br />
in NREAP<br />
<strong>The</strong> German National Renewable <strong>Energy</strong> Action Plan<br />
was published before the authorities had completed<br />
discussions on the national energy strategy <strong>to</strong> <strong>2050</strong><br />
(Energiekonzept). <strong>The</strong>refore, the document indicates<br />
that changes in some of the future activities or the<br />
figures could occur.<br />
Nevertheless, the NREAP indicates that Germany will<br />
meet its binding 2020 target of 18% RES domestically<br />
and, moreover, exceed it by 1.6 percentage points.<br />
However, the authors of the document increased the<br />
2005 baseline figure by 0.7 percentage points for statistical<br />
reasons, consequently making it easier <strong>to</strong> follow<br />
the outlined trajec<strong>to</strong>ry and meet the end target.<br />
<strong>The</strong> document underlines the authorities’ intention <strong>to</strong><br />
use the excess in co-operation mechanisms with other<br />
Member States.<br />
<strong>Energy</strong> efficiency is highlighted as a key fac<strong>to</strong>r in the<br />
plan with consumption set <strong>to</strong> decrease. Renewables<br />
in the power sec<strong>to</strong>r play a dominant role in the action<br />
plan with 38.6% of electricity demand expected <strong>to</strong> be<br />
met by RES in 2020. <strong>Wind</strong> has the largest share with<br />
onshore and offshore capacity accounting for 52% of<br />
the target, or almost 20% of all electricity consumption.<br />
In terms of build-out, the action plan expects new net<br />
annual onshore capacity <strong>to</strong> decrease steadily from over<br />
1.6 GW in 2011 <strong>to</strong> less than 300 MW in 2020. Conversely,<br />
new offshore capacity increases steadily from<br />
under 300 MW in 2010 <strong>to</strong> over 1,700 MW in 2020.<br />
Overall the plan forecasts 45,750 MW in 2020,<br />
10,000 MW of which offshore. Consequently the<br />
onshore ambition is lower than in EWEA’s scenario,<br />
56<br />
March 2011
whilst offshore is in line with the scenario’s higher end.<br />
<strong>The</strong> action plan, therefore, seems <strong>to</strong> under-estimate<br />
Germany’s onshore wind development potential and<br />
the effects of re-powering.<br />
2020 RES target<br />
in Directive<br />
28/2009/EC<br />
2020 RES target in<br />
NREAP<br />
2020 RES-E target<br />
in NREAP<br />
<strong>Wind</strong> capacity<br />
installed at end<br />
2010<br />
2020 wind capacity<br />
in NREAP<br />
2020 wind Production<br />
in NREAP<br />
18% 19.6% 38.6% 27,214 MW 45,750 MW 104.4 TWh 18.6%<br />
Greece<br />
2020 wind share<br />
of electricity consumption<br />
in NREAP<br />
Greece has a binding RES target of 18% by 2020,<br />
up from 6.9% in 2005. <strong>The</strong> Greek authorities have<br />
planned <strong>to</strong> overshoot the target by over two percentage<br />
points. To reach the overall target, the National<br />
Renewable <strong>Energy</strong> Action Plan focuses on the power<br />
sec<strong>to</strong>r. Almost 40% of electricity consumption is<br />
forecast <strong>to</strong> be met by RES in 2020. Onshore and offshore<br />
wind power should represent the lion’s share<br />
of the renewable power market and are forecast <strong>to</strong><br />
meet 24.5% of the country’s electricity consumption<br />
in 2020.<br />
To achieve this, the action plan banks on reaching 7.5<br />
GW of <strong>to</strong>tal installed wind capacity, of which 300 MW<br />
from offshore installations, by 2020. <strong>The</strong> net annual<br />
increase in wind power capacity is expected <strong>to</strong> be<br />
constant at around 600 MW. Offshore deployment is<br />
not expected <strong>to</strong> start before 2016 and is projected <strong>to</strong><br />
grow consistently by 50 MW a year. In 2020, offshore<br />
build-out is expected <strong>to</strong> increase <strong>to</strong> 100 MW.<br />
<strong>The</strong> Greek action plan’s forecasts for wind capacity and<br />
share of the power mix are in line with EWEA’s scenarios.<br />
2020 RES target<br />
in Directive<br />
28/2009/EC<br />
2020 RES target in<br />
NREAP<br />
2020 RES-E target<br />
in NREAP<br />
<strong>Wind</strong> capacity<br />
installed at end<br />
2010<br />
2020 wind capacity<br />
in NREAP<br />
2020 wind Production<br />
in NREAP<br />
18% 20.2% 39.8% 1,208 MW 7,500 MW 16.8 TWh 24.5%<br />
Hungary<br />
2020 wind share<br />
of electricity consumption<br />
in NREAP<br />
<strong>The</strong> authors of the Hungarian National Renewable <strong>Energy</strong><br />
Action Plan forecast that the country can reach<br />
14.7% renewables in gross energy consumption by<br />
2020, exceeding their 13% binding target by 1.7 percentage<br />
points. <strong>The</strong> heating and cooling sec<strong>to</strong>r is<br />
seen in the NREAP as the biggest contribu<strong>to</strong>r (18.9%<br />
RES in consumption), with the electricity sec<strong>to</strong>r meeting<br />
just under 11% of consumption with renewables.<br />
Biomass and wind are the two main renewable technologies<br />
in the electricity sec<strong>to</strong>r, with wind scheduled<br />
<strong>to</strong> meet over 3% of <strong>to</strong>tal consumption.<br />
<strong>The</strong> build-out rate for new wind power throughout the<br />
period is, however, extremely uneven with new annual<br />
capacities peaking in 2013 and 2017 at over 100<br />
MW and with troughs in 2015 and 2016 of around<br />
10 MW.<br />
<strong>The</strong> action plan forecasts that cumulative capacity for<br />
wind power will reach 750 MW in 2020. This is an unambitious<br />
target that suggests that only around 400 MW of<br />
new wind capacity will be built between 2010 and 2020.<br />
EWEA’s 2009 forecast expects Hungary <strong>to</strong> reach 1.2<br />
GW of installed wind capacity in the same timeframe.<br />
2020 RES target<br />
in Directive<br />
28/2009/EC<br />
2020 RES target in<br />
NREAP<br />
2020 RES-E target<br />
in NREAP<br />
<strong>Wind</strong> capacity<br />
installed at end<br />
2010<br />
2020 wind capacity<br />
in NREAP<br />
2020 wind Production<br />
in NREAP<br />
13% 14.7% 10.9% 295 MW 750 MW 1.6 TWh 3.1%<br />
2020 wind share<br />
of electricity consumption<br />
in NREAP<br />
<strong>EU</strong> <strong>Energy</strong> <strong>Policy</strong> <strong>to</strong> <strong>2050</strong> - Achieving 80-95% emissions reductions<br />
57
National Renewable <strong>Energy</strong> Action Plans:<br />
qualitative analysis<br />
Ireland<br />
<strong>The</strong> country’s National Renewable <strong>Energy</strong> Action Plan<br />
banks on the power sec<strong>to</strong>r <strong>to</strong> meet its binding target.<br />
<strong>The</strong> plan aims <strong>to</strong> meet 42.5% of electricity consumption<br />
from RES. <strong>Wind</strong> is the technology of choice in<br />
the plan, accounting for 86% of the RES-E target and<br />
some 35% of <strong>to</strong>tal electricity consumption.<br />
Over 4.6 GW of installed wind capacity are forecast<br />
in the Irish plan, of which 555 MW from new offshore<br />
installations, which is lower than in EWEA’s scenario.<br />
Both the onshore and offshore build-out rates vary<br />
significantly from one year <strong>to</strong> the next, following no<br />
particular growth pattern.<br />
Net capacity increase oscillates year on year from<br />
240 MW <strong>to</strong> 40 MW in the period between 2011 and<br />
2015. Subsequently, there is a two-year lull with 31<br />
MW and 41 MW net capacity increase in 2016 and<br />
2017 respectively. This is followed by a considerable<br />
increase in 2018, a further slump with net capacity<br />
increasing by 25 MW in 2019, and a 740 MW net<br />
peak in 2020.<br />
Indeed, the build-out will be continuously s<strong>to</strong>pping<br />
and starting, an issue that should be addressed in<br />
order <strong>to</strong> provide the industry with greater stability.<br />
2020 RES target<br />
in Directive<br />
28/2009/EC<br />
2020 RES target in<br />
NREAP<br />
2020 RES-E target<br />
in NREAP<br />
<strong>Wind</strong> capacity<br />
installed at end<br />
2010<br />
2020 wind capacity<br />
in NREAP<br />
2020 wind Production<br />
in NREAP<br />
16% 16% 42.5% 1,248 MW 4,649 MW 11.9 TWh 36.4%<br />
2020 wind share<br />
of electricity consumption<br />
in NREAP<br />
Italy<br />
Italy is one of the two Member States <strong>to</strong> indicate in<br />
its National Renewable <strong>Energy</strong> Action Plan that it will<br />
not meet its 17% RES target domestically, forecasting<br />
a shortfall of 0.85 percentage points in 2020. Consequently,<br />
the Italian authorities intend <strong>to</strong> turn <strong>to</strong> the<br />
co-operation mechanisms, indicating a preference for<br />
physically imported RES from countries outside the <strong>EU</strong>.<br />
Nevertheless, the Italian action plan intends <strong>to</strong> meet<br />
some 27% of the country’s electricity consumption with<br />
renewables by 2020, with onshore and offshore wind<br />
power providing just over 5% of <strong>to</strong>tal electricity consumption,<br />
requiring a cumulative capacity of just below<br />
13 GW, of which 680 MW from offshore installations.<br />
<strong>The</strong> onshore target is significantly (3 GW <strong>to</strong> 5 GW)<br />
lower than what EWEA considers the Italian market<br />
can deliver and, indeed, the action plan suggests an<br />
annual build-out rate greatly inferior <strong>to</strong> that which the<br />
Italian market has delivered for the past four consecutive<br />
years.<br />
However, the NREAP highlights delays in the authorisation<br />
procedures for new RES plants and grid development<br />
without offering a solution <strong>to</strong> end them.<br />
Moreover, the document announces revisions of the<br />
support scheme which may result in an undermining<br />
of inves<strong>to</strong>r confidence. <strong>The</strong>se weaknesses in the plan<br />
could result in inves<strong>to</strong>r caution unless improved with<br />
the introduction of future policies.<br />
2020 RES target<br />
in Directive<br />
28/2009/EC<br />
2020 RES target in<br />
NREAP<br />
2020 RES-E target<br />
in NREAP<br />
<strong>Wind</strong> capacity<br />
installed at end<br />
2010<br />
2020 wind capacity<br />
in NREAP<br />
2020 wind Production<br />
in NREAP<br />
17% 16.2% 26.4% 5,797 MW 12,680 MW 20 TWh 5.3%<br />
2020 wind share<br />
of electricity consumption<br />
in NREAP<br />
58<br />
March 2011
Latvia<br />
<strong>The</strong> Latvian National Renewable <strong>Energy</strong> Action Plan<br />
expects the country <strong>to</strong> reach its overall 2020 target<br />
of 40% RES with almost 60% RES in the power mix.<br />
<strong>The</strong> plan sets ambitious targets for both on- and offshore<br />
wind energy - <strong>to</strong> meet 6% and 4% of <strong>to</strong>tal electricity<br />
consumption respectively. With over 230 MW<br />
of cumulative onshore wind capacity and 180 MW of<br />
offshore capacity foreseen by 2020, Latvia is above<br />
EWEA’s scenario of 200 MW <strong>to</strong> 300 MW.<br />
Onshore build-out is expected <strong>to</strong> remain steady until<br />
2015 then drop dramatically. In 2017, annual capacity<br />
increase is expected <strong>to</strong> pick up again. Offshore,<br />
the first megawatts are expected in 2016 following a<br />
steady annual build-out <strong>to</strong> 2020.<br />
2020 RES target<br />
in Directive<br />
28/2009/EC<br />
2020 RES target in<br />
NREAP<br />
2020 RES-E target<br />
in NREAP<br />
<strong>Wind</strong> capacity<br />
installed at end<br />
2010<br />
2020 wind capacity<br />
in NREAP<br />
2020 wind Production<br />
in NREAP<br />
40% 40% 59.8% 31 MW 416 MW 0.9 TWh 10.4%<br />
2020 wind share<br />
of electricity consumption<br />
in NREAP<br />
Lithuania<br />
<strong>The</strong> Lithuanian National Renewable <strong>Energy</strong> Action Plan<br />
aims <strong>to</strong> exceed the country’s binding 23% RES target<br />
in 2020 by one percentage point. <strong>The</strong> 2020 target<br />
should be met as early as 2017. Electricity from renewables<br />
is expected <strong>to</strong> reach 21% of <strong>to</strong>tal consumption.<br />
<strong>The</strong> technology of choice is wind power, which, according<br />
<strong>to</strong> the projections, would produce 1.3 TWh a year<br />
and contribute <strong>to</strong> almost half the renewable electricity<br />
target or 9.4% of gross electricity consumption.<br />
<strong>The</strong> plan expects installed wind power capacity <strong>to</strong><br />
reach 500 MW by 2016. No increase in wind power<br />
capacity is forecast from then on. In terms of buildout,<br />
installed capacity is expected <strong>to</strong> double in 2010 <strong>to</strong><br />
reach almost 180 MW. 2011 is expected <strong>to</strong> deliver significantly<br />
less new wind capacity whereas the subsequent<br />
three years would see a steady annual build-out<br />
of 50 MW net. Following a slight slow-down in 2015, a<br />
new boom of over 110 MW is expected in 2016.<br />
<strong>The</strong> action plan’s projections for wind capacity are half<br />
of EWEA’s scenario, an indication that wind power’s<br />
full potential may not have been taken in<strong>to</strong> account.<br />
<strong>The</strong> Lithuanian NREAP indicates, finally, that the<br />
country is willing <strong>to</strong> use its projected surplus RES production<br />
in co-operation mechanisms with other Member<br />
States.<br />
2020 RES target<br />
in Directive<br />
28/2009/EC<br />
2020 RES target in<br />
NREAP<br />
2020 RES-E target<br />
in NREAP<br />
<strong>Wind</strong> capacity<br />
installed at end<br />
2010<br />
2020 wind capacity<br />
in NREAP<br />
2020 wind Production<br />
in NREAP<br />
23% 24% 21% 154 MW 500 MW 1.3 TWh 9.4%<br />
2020 wind share<br />
of electricity consumption<br />
in NREAP<br />
<strong>EU</strong> <strong>Energy</strong> <strong>Policy</strong> <strong>to</strong> <strong>2050</strong> - Achieving 80-95% emissions reductions<br />
59
National Renewable <strong>Energy</strong> Action Plans:<br />
qualitative analysis<br />
Luxembourg<br />
According <strong>to</strong> its National Renewable <strong>Energy</strong> Action<br />
Plan, Luxembourg will not meet its 11% RES target<br />
by 2020 due <strong>to</strong> lack of resources in the country. Consequently,<br />
the Luxembourgish authorities are looking<br />
in<strong>to</strong> co-operation mechanisms with other <strong>EU</strong> Member<br />
States <strong>to</strong> set up joint projects in order <strong>to</strong> make up a<br />
forecast 2.1 percentage point shortfall.<br />
Nevertheless, wind power is considered in the action<br />
plan as a key technology for increasing RES penetration.<br />
Almost 100 MW of new capacity are forecast,<br />
bringing cumulative capacity in 2020 <strong>to</strong> 131 MW.<br />
<strong>Wind</strong> power is forecast <strong>to</strong> cover 3.6% of electricity consumption,<br />
a third of all electricity from renewables.<br />
According <strong>to</strong> EWEA’s scenario, on the other hand,<br />
300 MW of installed wind capacity in Luxembourg<br />
could cover up <strong>to</strong> 14% of the country’s electricity consumption,<br />
more than the sum of all the RES-E technologies<br />
in the NREAP.<br />
2020 RES target<br />
in Directive<br />
28/2009/EC<br />
2020 RES target in<br />
NREAP<br />
2020 RES-E target<br />
in NREAP<br />
<strong>Wind</strong> capacity<br />
installed at end<br />
2010<br />
2020 wind capacity<br />
in NREAP<br />
2020 wind Production<br />
in NREAP<br />
11% 8.9% 11.8% 42 MW 131 MW 0.2 TWh 3.6%<br />
2020 wind share<br />
of electricity consumption<br />
in NREAP<br />
Malta<br />
Starting from no renewable energy at all in 2005, the<br />
Maltese National Renewable <strong>Energy</strong> Action Plan aims<br />
<strong>to</strong> slightly exceed the country’s 2020 target of 10%<br />
RES. <strong>The</strong> power sec<strong>to</strong>r is due <strong>to</strong> play the most significant<br />
role, achieving 13.8% of consumption covered<br />
by RES. Offshore wind is the technology of choice,<br />
planned <strong>to</strong> meet 7% of <strong>to</strong>tal electricity consumption.<br />
<strong>The</strong> Maltese NREAP highlights three planned government<br />
calls for tender for 110 MW of installed wind power<br />
capacity. <strong>The</strong>re is one tender for a 95 MW offshore<br />
project, and two onshore tenders <strong>to</strong>talling 14.5 MW.<br />
<strong>The</strong> planned onshore wind capacity is scheduled <strong>to</strong><br />
be built between 2012 and 2015, whereas offshore<br />
build-out is scheduled for 2016 and 2017.<br />
Malta’s overall installed capacity target is similar<br />
<strong>to</strong> EWEA’s scenario (100 MW <strong>to</strong> 200 MW) although<br />
EWEA considers that Malta could develop its onshore<br />
potential more thoroughly than planned in the NREAP.<br />
2020 RES target<br />
in Directive<br />
28/2009/EC<br />
2020 RES target in<br />
NREAP<br />
2020 RES-E target<br />
in NREAP<br />
<strong>Wind</strong> capacity<br />
installed at end<br />
2010<br />
2020 wind capacity<br />
in NREAP<br />
2020 wind Production<br />
in NREAP<br />
10% 10.2% 13.8% 0 MW 109.5 MW 0.24 TWh 7.6%<br />
2020 wind share<br />
of electricity consumption<br />
in NREAP<br />
60<br />
March 2011
Netherlands<br />
<strong>The</strong> Netherlands intends <strong>to</strong> exceed its 2020 RES target<br />
by half a percentage point <strong>to</strong> reach 14.5% RES in<br />
energy consumption. <strong>The</strong> National Renewable <strong>Energy</strong><br />
Action Plan, furthermore, indicates that this surplus<br />
is not intended for co-operation mechanisms with<br />
other Member States as it is a first step <strong>to</strong> setting a<br />
more ambitious national target.<br />
To reach the overall target, the Dutch plan estimates<br />
that 37% of renewable electricity is required.<br />
Two-thirds of this sec<strong>to</strong>ral target is <strong>to</strong><br />
be met by onshore and offshore wind power,<br />
which will supply 10% and 14% of <strong>to</strong>tal electricity<br />
consumption respectively, according <strong>to</strong> the plan.<br />
Two offshore licensing phases are scheduled <strong>to</strong> deliver<br />
almost 6 GW of new offshore capacity, 5,178<br />
MW of which <strong>to</strong> be operational by 2020. Onshore, the<br />
action plan aims <strong>to</strong> triple installed capacity <strong>to</strong> 6 GW.<br />
<strong>The</strong> document, however, does not indicate any new<br />
capacity in 2010 or 2011.<br />
Onshore build-out is scheduled <strong>to</strong> pick up from 2012<br />
<strong>to</strong> 2015 with net annual additions varying between<br />
415 MW and 800 MW. From 2016, new onshore additions<br />
are forecast <strong>to</strong> stabilise at 320 MW net per<br />
year. New offshore capacity is expected by 2013,<br />
with annual build-out reaching its cruising speed at<br />
800 MW net from 2016 onwards.<br />
<strong>The</strong> Dutch NREAP’s forecasts for wind energy broadly<br />
match EWEA’s high scenario.<br />
2020 RES target<br />
in Directive<br />
28/2009/EC<br />
2020 RES target in<br />
NREAP<br />
2020 RES-E target<br />
in NREAP<br />
<strong>Wind</strong> capacity<br />
installed at end<br />
2010<br />
2020 wind capacity<br />
in NREAP<br />
2020 wind Production<br />
in NREAP<br />
14% 14.5% 37% 2,245 MW 11,178 MW 32.4 TWh 23.9%<br />
Poland<br />
2020 wind share<br />
of electricity consumption<br />
in NREAP<br />
According <strong>to</strong> the Polish National Renewable <strong>Energy</strong><br />
Action Plan, the country will exceed the RES penetration<br />
trajec<strong>to</strong>ry set by the <strong>EU</strong> directive and exceed its<br />
2020 binding 15% target by 0.5 percentage points.<br />
Renewable electricity will account for over 19% of all<br />
electricity consumption according <strong>to</strong> the document,<br />
meaning that the sec<strong>to</strong>r will have a larger contribution<br />
<strong>to</strong> the overall target than renewables in heating and<br />
cooling (17%) and renewables in transport (10.1%).<br />
<strong>Wind</strong> will be the technology of choice, with onshore<br />
generation meeting 8% of <strong>to</strong>tal electricity consumption<br />
and offshore generation covering a further 1%.<br />
Biomass is forecast <strong>to</strong> meet 8% of gross electricity<br />
consumption. Other technologies such as hydro and<br />
solar PV will play a more marginal role.<br />
However, with a cumulative capacity target of 6.7 GW,<br />
up from over 1 GW in 2010, the Polish NREAP lacks<br />
ambition for wind. EWEA’s 2009 forecast suggests<br />
that installed wind capacity in Poland could reach between<br />
10 GW and 12 GW in the same time frame.<br />
Build-out rates for new onshore wind capacity are<br />
forecast as stable between 450 MW and 520 MW<br />
per year, only slightly above the 382 MW installed in<br />
2010. <strong>The</strong> first 500 MW of offshore capacity should<br />
come online in 2020 - in line with EWEA’s forecast.<br />
2020 RES target<br />
in Directive<br />
28/2009/EC<br />
2020 RES target in<br />
NREAP<br />
2020 RES-E target<br />
in NREAP<br />
<strong>Wind</strong> capacity<br />
installed at end<br />
2010<br />
2020 wind capacity<br />
in NREAP<br />
2020 wind Production<br />
in NREAP<br />
15% 15.5% 19.1% 1,104 MW 6,650 MW 15.2 TWh 9%<br />
2020 wind share<br />
of electricity consumption<br />
in NREAP<br />
<strong>EU</strong> <strong>Energy</strong> <strong>Policy</strong> <strong>to</strong> <strong>2050</strong> - Achieving 80-95% emissions reductions<br />
61
National Renewable <strong>Energy</strong> Action Plans:<br />
qualitative analysis<br />
Portugal<br />
Portugal’s binding 2020 RES target is 31% up from<br />
20.5% in 2005, although the authors of the National<br />
Renewable <strong>Energy</strong> Action Plan have reduced the 2005<br />
starting point <strong>to</strong> 19.8%. <strong>The</strong> overall target has been<br />
split in<strong>to</strong> 55.3% electricity from RES, 30.6% heating<br />
and cooling from RES and 10% RES in transport.<br />
According <strong>to</strong> the plan, with an annual production of<br />
14.6 TWh, wind power should be the country’s leading<br />
RES technology covering almost 23% of electricity consumption<br />
with a cumulative installed capacity of 6,800<br />
MW onshore and 75 MW offshore by 2020. <strong>The</strong>se targets<br />
are below EWEA’s scenario whereas wind’s share<br />
of the power mix is similar in the two forecasts, although<br />
the NREAP indicates a 17% increase in electricity<br />
consumption between 2010 and 2020.<br />
<strong>The</strong> forecast build-out rates in 2011 and 2012 are similar<br />
<strong>to</strong> recent developments in the Portuguese market<br />
(around 670 MW net annual increase). Subsequently<br />
there is a two year lull in new wind build-out, with a<br />
further 500 MW net capacity coming online in 2015.<br />
2016 and 2017 are also forecast by the plan <strong>to</strong> be<br />
quieter years. Offshore build-out is seen as starting<br />
in 2015, with the first 25 MW installed and the remaining<br />
50 MW all being installed in 2020.<br />
Furthermore, capacity fac<strong>to</strong>rs for wind turbines seem<br />
<strong>to</strong> have been underestimated in the document. <strong>The</strong>refore,<br />
production could be above what is projected and<br />
could lead <strong>to</strong> a future re-think of RES-E targets.<br />
<strong>The</strong> NREAP indicates that more RES-E production<br />
could be achieved with improved cross-border interconnection.<br />
Consequently no excess RES for use in<br />
co-operation mechanisms with other Member States<br />
is currently envisaged in the plan. Should interconnectivity<br />
with the rest of Europe be increased, the<br />
Portuguese authorities could review their position<br />
and exceed their trajec<strong>to</strong>ry and 2020 targets.<br />
2020 RES target<br />
in Directive<br />
28/2009/EC<br />
2020 RES target in<br />
NREAP<br />
2020 RES-E target<br />
in NREAP<br />
<strong>Wind</strong> capacity<br />
installed at end<br />
2010<br />
2020 wind capacity<br />
in NREAP<br />
2020 wind Production<br />
in NREAP<br />
31% 31% 55.3% 3,898 MW 6,875 MW 14.6 TWh 22.6%<br />
2020 wind share<br />
of electricity consumption<br />
in NREAP<br />
Romania<br />
<strong>The</strong> National Renewable <strong>Energy</strong> Action Plan for Romania<br />
expects the RES share <strong>to</strong> increase but stay below<br />
the trajec<strong>to</strong>ry determined by the RES directive. <strong>The</strong><br />
“indicative trajec<strong>to</strong>ry” is a series of target average<br />
levels of renewable energy production over two-year<br />
periods up <strong>to</strong> 2020. As Romania intends <strong>to</strong> reach its<br />
target level only in the second year of the two-year<br />
periods, its averages will be below target. Nevertheless,<br />
the final 2020 target of 24% RES is considered<br />
achievable. <strong>The</strong> Romanian NREAP, however, makes<br />
no mention resorting <strong>to</strong> the flexibility mechanisms <strong>to</strong><br />
compensate for the forecast deficit.<br />
<strong>Wind</strong> power is expected <strong>to</strong> benefit from a spectacular<br />
growth rate up <strong>to</strong> 2013, adding over 600 MW net a<br />
year. <strong>The</strong> net annual increase slows down from 2014<br />
onwards, especially from 2016 as the support mechanism<br />
is scheduled <strong>to</strong> be discontinued. Overall, however,<br />
the Romanian action plan expects some 4,000<br />
MW of capacity <strong>to</strong> be installed by 2020. This would<br />
cover almost 11.5% of <strong>to</strong>tal electricity consumption<br />
and position wind as the main RES power technology<br />
after hydro.<br />
<strong>The</strong> Romanian NREAP’s projections for wind power<br />
are above EWEA’s scenario, which estimates 3,000<br />
MW <strong>to</strong> 3,500 MW of cumulative capacity meeting<br />
7.7% <strong>to</strong> 9% of electricity consumption by 2020. However,<br />
considering the wind and land resources, inves<strong>to</strong>r<br />
interest and banking on the final adoption of the<br />
62<br />
March 2011
new RES law early in 2011, the action plan’s targets<br />
do not appear overly ambitious. <strong>The</strong> Romanian <strong>Wind</strong><br />
<strong>Energy</strong> <strong>Association</strong> has a more ambitious scenario<br />
for 2020, reaching 5 GW of installed wind capacity.<br />
2020 RES target<br />
in Directive<br />
28/2009/EC<br />
2020 RES target in<br />
NREAP<br />
2020 RES-E target<br />
in NREAP<br />
<strong>Wind</strong> capacity<br />
installed at end<br />
2010<br />
2020 wind capacity<br />
in NREAP<br />
2020 wind Production<br />
in NREAP<br />
24% 24% 42.6% 462 MW 4,000 MW 8.4 TWh 11.4%<br />
Slovakia<br />
2020 wind share<br />
of electricity consumption<br />
in NREAP<br />
Slovakia’s National Renewable <strong>Energy</strong> Action Plan indicates<br />
that the country could exceed its 2020 RES<br />
target of 14% by 1.3 percentage points. <strong>The</strong> power<br />
sec<strong>to</strong>r is expected <strong>to</strong> contribute the most <strong>to</strong> the overall<br />
target by increasing the share of renewables from<br />
around 16% in 2005 (mainly hydro) <strong>to</strong> 24% in 2020.<br />
After hydro and biomass, wind is forecast <strong>to</strong> make<br />
the biggest contribution <strong>to</strong> the renewable power mix<br />
in 2020, with a planned 350 MW which would feed<br />
600 GWh in<strong>to</strong> the grid and cover around 2% of <strong>to</strong>tal<br />
electricity consumption.<br />
Slovakia’s ambitions fall short of EWEA’s scenario.<br />
EWEA’s scenario estimates that 800 MW <strong>to</strong> 1.000<br />
MW of wind power could be installed by 2020, meeting<br />
up <strong>to</strong> 5% of the country’s electricity demand. Moreover,<br />
the build-out of wind power set out in the action<br />
plan is irregular, with two large chunks of around 150<br />
MW net expected <strong>to</strong> come online in 2012 and 2015,<br />
and a further 50 MW net in 2018.<br />
Exceeding its indicative trajec<strong>to</strong>ry and binding 2020<br />
target, the action plan indicates that some excess<br />
RES is available for use in co-operation mechanisms<br />
with other Member States.<br />
2020 RES target<br />
in Directive<br />
28/2009/EC<br />
2020 RES target in<br />
NREAP<br />
2020 RES-E target<br />
in NREAP<br />
<strong>Wind</strong> capacity<br />
installed at end<br />
2010<br />
2020 wind capacity<br />
in NREAP<br />
2020 wind Production<br />
in NREAP<br />
14% 15.3% 24% 3 MW 350 MW 0.6 TWh 1.8%<br />
Slovenia<br />
2020 wind share<br />
of electricity consumption<br />
in NREAP<br />
Slovenia is set <strong>to</strong> meet its 25% 2020 RES target and,<br />
indeed, slightly exceed it according <strong>to</strong> its National Renewable<br />
<strong>Energy</strong> Action Plan. In the power sec<strong>to</strong>r, renewables<br />
are forecast <strong>to</strong> meet almost 40% of the country’s<br />
electricity consumption, with onshore wind meeting an<br />
un-ambitious 1.3% of overall electricity demand.<br />
In all, the plan indicates just over 106 MW of installed<br />
wind capacity in 2020, a fifth of EWEA’s scenario.<br />
EWEA’s calculations show that by 2020 wind could<br />
cover between 6% and 9% of electricity demand.<br />
Build-out of wind projects is not expected <strong>to</strong> be constant,<br />
rather the action plan indicates that new wind<br />
capacity will be installed in 2010, 2013, 2015 and<br />
2019. <strong>The</strong> newly adopted feed-in tariff limiting support<br />
<strong>to</strong> projects of 5 MW and under may be hindering<br />
perspectives for wind power development.<br />
<strong>The</strong> action plan indicates that Slovenia is not planning<br />
<strong>to</strong> participate in co-operation mechanisms with<br />
other <strong>EU</strong> Member States. However, rules on how such<br />
co-operation should be envisaged are being drafted.<br />
2020 RES target<br />
in Directive<br />
28/2009/EC<br />
2020 RES target in<br />
NREAP<br />
2020 RES-E target<br />
in NREAP<br />
<strong>Wind</strong> capacity<br />
installed at end<br />
2010<br />
2020 wind capacity<br />
in NREAP<br />
2020 wind Production<br />
in NREAP<br />
25% 25.3% 39.3% 0.03 MW 106 MW 0.2 TWh 1.3%<br />
2020 wind share<br />
of electricity consumption<br />
in NREAP<br />
<strong>EU</strong> <strong>Energy</strong> <strong>Policy</strong> <strong>to</strong> <strong>2050</strong> - Achieving 80-95% emissions reductions<br />
63
National Renewable <strong>Energy</strong> Action Plans:<br />
qualitative analysis<br />
Spain<br />
Spain’s National Renewable <strong>Energy</strong> Action Plan aims<br />
<strong>to</strong> exceed the country’s binding 20% target by almost<br />
three percentage points. <strong>The</strong> authorities clearly intend<br />
<strong>to</strong> use the excess in co-operation mechanisms<br />
with other Member States.<br />
<strong>The</strong> document emphasises the role of the power sec<strong>to</strong>r<br />
in reaching the overall target and forecasts that<br />
41% of all electricity consumption will be met by RES<br />
in 2020, with wind power alone expected <strong>to</strong> meet half<br />
this amount.<br />
Surprisingly, however, the action plan has reduced<br />
wind power capacity ambitions <strong>to</strong> 35 GW onshore,<br />
with build-out rates below what the Spanish market<br />
has delivered in recent years. This is 4-5 GW less<br />
than in EWEA’s scenario.<br />
<strong>The</strong> 3 GW offshore target, on the other hand, is more<br />
ambitious than expected, with first capacity scheduled<br />
<strong>to</strong> come online in 2014. <strong>The</strong> feasibility of this<br />
amount of offshore in a six-year time frame – two <strong>to</strong><br />
three times higher than in EWEA’s scenario - remains<br />
<strong>to</strong> be verified.<br />
2020 RES target<br />
in Directive<br />
28/2009/EC<br />
2020 RES target in<br />
NREAP<br />
2020 RES-E target<br />
in NREAP<br />
<strong>Wind</strong> capacity<br />
installed at end<br />
2010<br />
2020 wind capacity<br />
in NREAP<br />
2020 wind Production<br />
in NREAP<br />
20% 22.7% 40% 20,676 MW 38,000 MW 70.5 TWh 20.8%<br />
2020 wind share<br />
of electricity consumption<br />
in NREAP<br />
Sweden<br />
Sweden has the highest RES target of any <strong>EU</strong> Member<br />
State, set at 49%, up from 39.8% in 2005. <strong>The</strong><br />
Swedish National Renewable energy Action Plan,<br />
furthermore, raises the country’s RES ambitions <strong>to</strong><br />
50.2% RES in final energy consumption with 63% RES<br />
in electricity consumption.<br />
With a forecast cumulative wind power capacity of<br />
just over 4.5 GW in 2020, wind should cover 8% of final<br />
electricity consumption. Onshore build-out is forecast<br />
as being stable at just under 260 MW net a year.<br />
With no offshore-specific support mechanism foreseen<br />
in the action plan, little increase in offshore<br />
capacity is forecast. In fact, the Swedish NREAP<br />
indicates that in 2010 there will be 76 MW of offshore<br />
wind capacity, growing by 10–11 MW net per year up<br />
<strong>to</strong> 2020 <strong>to</strong> reach a cumulative capacity of 182 MW.<br />
According <strong>to</strong> EWEA, at the end of 2010, there were<br />
already 164 MW of offshore wind capacity in five wind<br />
farms: Bockstigen, Utgrunden 1, Yttre Stengrund, Lillgrund<br />
and Gässlingegrund (an inland lake). Moreover,<br />
the projected build-out rate of 10/11 MW per year<br />
seems unlikely considering the average size of offshore<br />
wind projects.<br />
Concerning offshore, therefore, the Swedish action<br />
plan looks inaccurate. Overall, EWEA’s scenario put<br />
wind capacity in Sweden at around 6 GW <strong>to</strong> 8 GW onshore<br />
in 2020, with a further 3 GW offshore.<br />
2020 RES target<br />
in Directive<br />
28/2009/EC<br />
2020 RES target in<br />
NREAP<br />
2020 RES-E target<br />
in NREAP<br />
<strong>Wind</strong> capacity<br />
installed at end<br />
2010<br />
2020 wind capacity<br />
in NREAP<br />
2020 wind Production<br />
in NREAP<br />
49% 50.2% 62.9% 2,163 MW 4,547 MW 1.5 TWh 8.1%<br />
2020 wind share<br />
of electricity consumption<br />
in NREAP<br />
64<br />
March 2011
United Kingdom<br />
<strong>The</strong> United Kingdom has an overall 15% RES target<br />
for 2020, up from just over 1% in 2005 and its National<br />
Renewable <strong>Energy</strong> Action Plan expects the target<br />
<strong>to</strong> be met. <strong>The</strong> largest contribution <strong>to</strong> the overall<br />
target is expected from the power sec<strong>to</strong>r (30% of <strong>to</strong>tal<br />
electricity consumption).<br />
<strong>The</strong> document forecasts that around 70% RES-E in<br />
consumption will come from onshore and offshore<br />
wind, with onshore wind representing 9% of <strong>to</strong>tal electricity<br />
consumption and offshore wind 12%.<br />
To achieve this, the NREAP foresees an increasing<br />
build-out of onshore projects from the beginning of<br />
the period until 2018, followed by a slightly smaller<br />
– yet still over 1 GW net - onshore market for 2019<br />
and 2020. Cumulative capacity in 2020 is estimated<br />
at almost 15 GW.<br />
For offshore, on the other hand, the NREAP assumes<br />
a constant increase in the annual market from just<br />
under 600 MW net in 2011 <strong>to</strong> almost 1,700 MW net<br />
annually in 2020, <strong>to</strong> reach a cumulative target of 13<br />
GW. Both projections are broadly in line with EWEA’s<br />
scenario, however the scenario, unlike the NREAP,<br />
does not expect more capacity onshore than offshore.<br />
<strong>The</strong> NREAP, therefore, seems <strong>to</strong> lack offshore<br />
ambition, where the national wind industry body, RenewableUK,<br />
considers 20 GW of offshore capacity an<br />
achievable target for 2020.<br />
2020 RES target<br />
in Directive<br />
28/2009/EC<br />
2020 RES target in<br />
NREAP<br />
2020 RES-E target<br />
in NREAP<br />
<strong>Wind</strong> capacity<br />
installed at end<br />
2010<br />
2020 wind capacity<br />
in NREAP<br />
2020 wind Production<br />
in NREAP<br />
15% 15% 30% 5,204 MW 27,880 MW 78.3 TWh 20.8%<br />
2020 wind share<br />
of electricity consumption<br />
in NREAP<br />
<strong>EU</strong> <strong>Energy</strong> <strong>Policy</strong> <strong>to</strong> <strong>2050</strong> - Achieving 80-95% emissions reductions<br />
65
66<br />
March 2011
<strong>EU</strong> <strong>Energy</strong> <strong>Policy</strong> <strong>to</strong> <strong>2050</strong> - Achieving 80-95% emissions reductions<br />
67
XXX<br />
234-53520-0211-1175<br />
www.ewea.org<br />
About EWEA<br />
EWEA is the voice of the wind industry, actively promoting the utilisation of wind power in Europe<br />
and worldwide. It now has over 650 members from almost 60 countries including manufacturers<br />
with a 90% share of the world wind power market, plus component suppliers, research institutes,<br />
national wind and renewables associations, developers, electricity providers, finance and insurance<br />
companies and consultants.<br />
Rue d’Arlon 80 | B-1040 Brussels<br />
Tel: +32 2 213 18 11 - Fax: +32 2 213 18 90<br />
E-mail: ewea@ewea.org