Global Education Digest 2012 - International Reading Association
Global Education Digest 2012 - International Reading Association
Global Education Digest 2012 - International Reading Association

You also want an ePaper? Increase the reach of your titles
YUMPU automatically turns print PDFs into web optimized ePapers that Google loves.
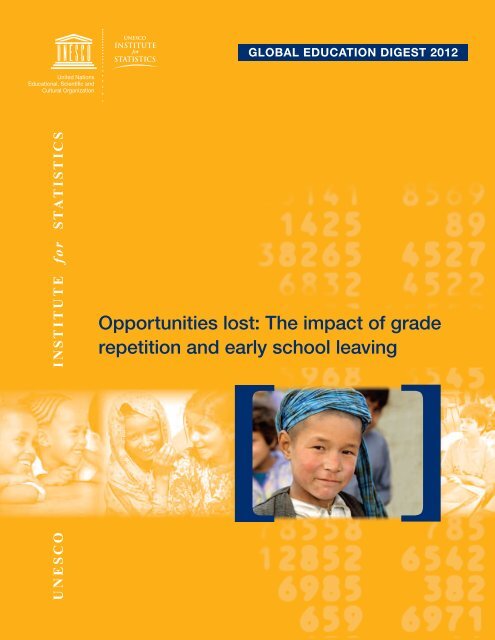
<strong>Global</strong> education diGest <strong>2012</strong><br />
INSTITUTE for STATISTICS<br />
Opportunities lost: The impact of grade<br />
repetition and early school leaving<br />
UNESCO
PREVIOUS EDITIONS OF THE GLOBAL EDUCATION DIGEST<br />
• GLOBAL EDUCATION DIGEST 2011<br />
Focus on Secondary <strong>Education</strong>: The Next Great Challenge<br />
• GLOBAL EDUCATION DIGEST 2010<br />
<strong>Education</strong> and Gender: Between Promise and Progress<br />
• GLOBAL EDUCATION DIGEST 2009<br />
<strong>Global</strong> Trends in Tertiary <strong>Education</strong><br />
• GLOBAL EDUCATION DIGEST 2008<br />
Inside the UIS: Collecting, Processing and Reporting <strong>International</strong> <strong>Education</strong> Data<br />
• GLOBAL EDUCATION DIGEST 2007<br />
Costs and Commitments in Financing <strong>Education</strong> for All<br />
• GLOBAL EDUCATION DIGEST 2006<br />
Tertiary <strong>Education</strong>: Extending the Frontiers of Knowledge<br />
• GLOBAL EDUCATION DIGEST 2005<br />
Making the Transition to Secondary <strong>Education</strong><br />
• GLOBAL EDUCATION DIGEST 2004<br />
Beyond Universal Primary <strong>Education</strong><br />
• GLOBAL EDUCATION DIGEST 2003<br />
The State of <strong>Global</strong> <strong>Education</strong> Statistics: Measuring Progress Towards Universal Primary <strong>Education</strong><br />
The UNESCO Institute for Statistics (UIS) is the leading source for international education statistics,<br />
which are also featured in major reports and databases, such as the:<br />
••<br />
EFA <strong>Global</strong> Monitoring Report (UNESCO)<br />
••<br />
World Development Indicators (World Bank)<br />
••<br />
Human Development Report (UNDP)<br />
••<br />
State of the World’s Children (UNICEF)<br />
••<br />
Millennium Development Goals (UN)<br />
While the GED publishes a selection of commonly used indicators, a wider range of data can be found in<br />
the UIS Data Centre: http://stats.uis.unesco.org
GLOBAL EDUCATION DIGEST <strong>2012</strong><br />
Opportunities lost: The impact of grade<br />
repetition and early school leaving
UNESCO<br />
The constitution of the United Nations <strong>Education</strong>al, Scientific and Cultural Organization (UNESCO) was<br />
adopted by 20 countries at the London Conference in November 1945 and entered into effect on 4 November<br />
1946. The Organization currently has 195 Member States and 8 Associate Members.<br />
The main objective of UNESCO is to contribute to peace and security in the world by promoting collaboration<br />
among nations through education, science, culture and communication in order to foster universal respect for<br />
justice, the rule of law, and human rights and fundamental freedoms that are affirmed for the peoples of the<br />
world, without distinction of race, sex, language or religion, by the Charter of the United Nations.<br />
To fulfill its mandate, UNESCO performs five principal functions: 1) prospective studies on education, science,<br />
culture and communication for tomorrow’s world; 2) the advancement, transfer and sharing of knowledge<br />
through research, training and teaching activities; 3) standard-setting actions for the preparation and adoption<br />
of internal instruments and statutory recommendations; 4) expertise through technical co-operation to Member<br />
States for their development policies and projects; and 5) the exchange of specialised information.<br />
UNESCO is headquartered in Paris, France.<br />
The UNESCO Institute for Statistics<br />
The UNESCO Institute for Statistics (UIS) is the statistical office of UNESCO and is the UN depository for global<br />
statistics in the fields of education, science and technology, culture and communication.<br />
The UIS was established in 1999. It was created to improve UNESCO’s statistical programme and to develop<br />
and deliver the timely, accurate and policy-relevant statistics needed in today’s increasingly complex and<br />
rapidly changing social, political and economic environments.<br />
The UIS is based in Montreal, Canada.<br />
Published in <strong>2012</strong> by:<br />
UNESCO Institute for Statistics<br />
P.O. Box 6128, Succursale Centre-Ville<br />
Montreal, Quebec H3C 3J7<br />
Canada<br />
Tel: (1 514) 343-6880<br />
Email: uis.publications@unesco.org<br />
http://www.uis.unesco.org<br />
© UNESCO-UIS <strong>2012</strong><br />
Ref: UIS/<strong>2012</strong>/ED/SD/08<br />
ISBN: 978-92-9189-120-7<br />
Typesetting: Em Dash Design / www.emdashdesign.ca<br />
Photo credits: Frontcover: UN Photo/Eskinder Debebe, UN Photo/Amjad Jamal, UN Photo/Luke Powell,<br />
Matt Bennett/Massachusetts Governor’s Office<br />
Backcover: smithereen11, Bill Lyons/World Bank, UN Photo/J Mohr<br />
Printing: Marquis Printing<br />
The authors are responsible for the choice and the presentation of the facts contained in this book and for the opinions expressed<br />
therein which are not necessarily those of UNESCO and do not commit the Organization.<br />
The designations employed and the presentation of material throughout this publication do not imply the expression of any opinion<br />
whatsoever on the part of UNESCO concerning the legal status of any country, territory, city or area or of its authorities or concerning<br />
the delimitation of its frontiers or boundaries.
FOREWORD<br />
Each year the UNESCO Institute for Statistics (UIS) publishes its <strong>Global</strong> <strong>Education</strong> <strong>Digest</strong> (GED) presenting the latest<br />
education statistics worldwide. These data are also featured in key reports produced by partner organizations, such as<br />
the EFA <strong>Global</strong> Monitoring Report, State of the World’s Children, World Development Indicators, World Development<br />
Report, Human Development Report and many others.<br />
The <strong>Digest</strong> offers particular value by presenting a wide range of education statistics – from early childhood learning<br />
programmes to adult literacy – and by highlighting a special theme, which is analysed based on indicators drawn<br />
from the statistical tables of the report. This current edition of the <strong>Digest</strong> examines key issues and indicators related<br />
to children’s progression through schooling, such as grade repetition, early school leaving and levels of learning<br />
achievement in primary and lower secondary education. As access to primary and secondary education continues to<br />
increase globally, there is growing interest in developing benchmarks and instituting comparisons that can improve the<br />
functioning and efficiency of education systems everywhere.<br />
In the run-up to 2015, policymakers at both national and international levels are looking to assess the extent to which<br />
education and development targets have been achieved, especially since 2000. One conclusion will be that access<br />
to schooling has widened considerably, that is, a much greater proportion of children were brought into schools. But<br />
another conclusion will likely be that many countries are encountering difficulties in translating this access into actual<br />
learning opportunities that are sustainable for all pupils over time. High rates of grade repetition, early school leaving and<br />
low levels of learning attainment have constrained the progress that could have been achieved and persist as important<br />
challenges for the future.<br />
The report finds that globally 32.2 million pupils repeated a grade in primary education and 31.2 million left school before<br />
achieving the last grade of this education level in 2010. Pupils who are over-age for their grade – due to late entry and/<br />
or repetition – are at greater risk of leaving school early. Girls are less likely than boys to enter primary school, but boys<br />
face greater risks of repeating grades and leaving school early. Children with the least opportunities – arising from poverty<br />
and compounding disadvantages – are most likely to repeat grades and leave school early. These shortcomings have<br />
meant lost opportunities for children, especially the poorest, as well as unfulfilled investments made by families and<br />
governments. The costs are both indirect – in terms of children’s developmental opportunities and life chances and, at<br />
the broader community level, in terms of poverty, slow economic growth and poorer public health status – and direct,<br />
with education systems spending much time, energy and resources on children who repeat grades or leave school<br />
without successful learning.<br />
In addition to cross-nationally comparable data compiled by the UIS, this edition of the <strong>Digest</strong> presents a rich set of<br />
information from household surveys and introduces two new indicators developed by the Institute: school life expectancy<br />
net of repetition, which assesses the number of years spent in school without repeating grades; and the survival rate to<br />
the last grade of lower secondary, which shows how many children complete (or not) basic education.<br />
The UIS undertakes a wide range of activities in different countries in order to improve the timeliness, comparability,<br />
completeness and reliability of education data. With the support of its staff in the field, the Institute works closely with<br />
Member States to improve data quality through networks of statisticians and policymakers. These exchanges help<br />
improve the scope and comparability of data through the use of international standards.<br />
Hendrik van der Pol<br />
Director<br />
UNESCO Institute for Statistics<br />
3
ACKNOWLEDGEMENTS<br />
This 10 th issue of the <strong>Global</strong> <strong>Education</strong> <strong>Digest</strong> is the result of a collaborative effort which benefits from the work<br />
and commitment of a number of actors, whom we would like to thank.<br />
Statisticians from each country and territory reported the data that form the basis of the information presented<br />
in the <strong>Global</strong> <strong>Education</strong> <strong>Digest</strong>. They took the time to respond carefully to the UIS, UOE or WEI questionnaires,<br />
as well as requests for clarification.<br />
<strong>International</strong> organizations, in particular the United Nations Statistics and Population Divisions, the World<br />
Bank, the Organisation for Economic Co-operation and Development (OECD), Eurostat and other specialized<br />
institutions, supplied additional information and statistics to complement the data gathered directly by the UIS.<br />
Albert Motivans heads the <strong>Education</strong> Indicators and Data Analysis section of the UIS and provided guidance<br />
throughout the process.<br />
Olivier Labé coordinated the production of the chapter. Authors contributing to the text were: Sheena Bell,<br />
César Guadalupe, Friedrich Huebler, Olivier Labé, Albert Motivans, Nhung Truong and Alcyone Vasconcelos.<br />
Alison Clayson and Amy Otchet edited the analytical chapter. Alison Kennedy and Said Ould Voffal provided<br />
quality assurance to the report.<br />
Hanna Taleb led the preparation of data tables with contributions from Chiao-Ling Chien, Amélie Gagnon,<br />
Hiromichi Katayama, Xiaobao Lin, Weixin Lu, Simon Normandeau, Miguel Ibañez Salinas, Ioulia Sementchouk,<br />
Hélène Tran and Nhung Truong. The figures were prepared by Wendy Xiaodan Weng with contributions from<br />
Patrick Montjourides.<br />
Contributions to data quality were provided by: Wilfried Amoussou-Guénou, Redouane Assad, Andrew Barton,<br />
Maria Helena Capelli Miguel, Hugo Castellano Tolmos, Ghania Djafri, Daniel Ejov, Rosario García Calderón,<br />
Mohamad Elmasri, Tin Nam Ho, Talal El-Hourani, Adolfo Gustavo Imhof, Elise Legault, Marietta Nkweta,<br />
John Pacifico, Pascale Ratovondrahona, Markus Schwabe, Anuja Singh, Konstantin Soushko-Borstov and<br />
UIS field staff.<br />
Katja Frostell coordinated the content and overall production of the <strong>Digest</strong>. Adriano Miele managed the<br />
production of the CD-ROM. Other staff of the UIS also made contributions to the <strong>Digest</strong>.<br />
4
CONTENTS<br />
Foreword 3<br />
Acknowledgements 4<br />
OPPORTUNITIES LOST / THE IMPACT OF GRADE REPETITION AND EARLY SCHOOL LEAVING<br />
Section 1 / Policy design and implementation of compulsory education systems 9<br />
1.1 Most out-of-school children have had some exposure to primary schooling 9<br />
1.2 When are children meant to enter school? How long are they supposed to stay in school? 11<br />
1.3 Do countries reach children of the intended age for compulsory education? 12<br />
1.4 Do education systems reach children of the intended ages? 14<br />
1.5 What are the major barriers or bottlenecks that hinder progression through the education system? 16<br />
Section 2 / Learning achievement: Differing policies and practices regarding grade repetition 17<br />
2.1 How is repetition defined, measured and evaluated? 17<br />
School life expectancy and repetition 19<br />
2.2 <strong>Global</strong> trends in pupils repeating grades in primary and lower secondary education 19<br />
Repetition trends in primary education show slight improvement depending on the region 19<br />
Repetition trends in lower secondary education show signs of improvement despite big enrolment<br />
increases 20<br />
2.3 Regional trends in pupils repeating grades in primary and lower secondary education 21<br />
Sub-Saharan Africa: Steady progress 21<br />
South and West Asia: Small signs of progress, especially in Nepal and Bhutan 24<br />
Latin America and the Caribbean: Repetition rates still high but some policy interventions<br />
show promise 24<br />
In other selected regions 25<br />
2.4 Which grades do children repeat the most? Country clusters show three patterns of repetition 27<br />
2.5 Which children are most likely to repeat? Usually children from poor families and rural locations<br />
are most at risk 28<br />
2.6 Inequity tends to decline as children make the transition to secondary education 30<br />
Section 3 / Early school leaving: Lost opportunities, lower potential 32<br />
3.1 Reached but then lost by the education system 32<br />
3.2 <strong>Global</strong> numbers and trends in early school leaving: Rates stagnating or dropping everywhere<br />
except sub-Saharan Africa 33<br />
3.3 Early school leaving by region 34<br />
Early leavers from primary education on the rise in sub-Saharan Africa, partly due to<br />
population increases 35<br />
Dropout rates stay high in South and West Asia despite demographic dividend 36<br />
5
CONTENTS<br />
Fewer children leaving school in Latin America and the Caribbean 36<br />
Other regions reflect wide variation in dropout rates 37<br />
3.4 When do children leave school? 37<br />
Over-age children are more likely to leave school early 39<br />
3.5 The profile of early school leavers 40<br />
Which children are more likely to leave school early? 40<br />
Six case studies of early school leavers: How do countries compare? 40<br />
How far do young people progress in their studies before leaving school? 43<br />
Section 4 / Monitoring education quality: Putting the spotlight on low levels of learning 45<br />
4.1 Low reading performance in early grades of primary education 45<br />
4.2 Assessing low levels of reading skills at the end of primary education 47<br />
4.3 Learning outcomes and repetition 49<br />
Section 5 / The costs of school failure 52<br />
5.1 Links between repetition, early school leaving and inadequate learning outcomes 52<br />
5.2 Grade repetition and early school leaving are costly, but to what extent? 54<br />
5.3 Policy options for reducing repetition and early school leaving 55<br />
References 60<br />
Annex A / Definitions 62<br />
Annex B / <strong>International</strong> Standard Classification of <strong>Education</strong> (ISCED97) 72<br />
Annex C / Regions 74<br />
Annex D / Electronic resources 76<br />
Annex E / Reader’s guide 77<br />
Annex F / Statistical tables 82<br />
6
OPPORTUNITIES LOST: THE IMPACT OF GRADE REPETITION AND EARLY SCHOOL LEAVING<br />
List of figures<br />
Figure 1. How many primary school-age children are out of school? 10<br />
Figure 2. At what age are children meant to begin compulsory education? 12<br />
Figure 3. How many years are children required to stay in compulsory education? 13<br />
Figure 4. To what extent are children enrolled in compulsory lower secondary education? 14<br />
Figure 5. How prevalent are over-age children in primary education? 15<br />
Figure 6. How many years can a child entering school expect to stay in school? 20<br />
Figure 7. How do trends in grade repetition and enrolment in primary education compare<br />
across regions? 21<br />
Figure 8. How do trends in grade repetition and enrolment in lower secondary education<br />
compare across regions? 22<br />
Figure 9. High but declining repetition rates in sub-Saharan Africa 23<br />
Figure 10. How has grade repetition changed in South and West Asia? 25<br />
Figure 11. How has grade repetition changed in Latin America and the Caribbean? 26<br />
Figure 12. Which grades do children repeat most often? 28<br />
Figure 13. Pupils from poor and rural households are much more likely to repeat 29<br />
Figure 14. Disparities in repetition rates are highest at the primary education level 31<br />
Figure 15. How has early school leaving changed in sub-Saharan Africa? 36<br />
Figure 16. How has early school leaving changed in South and West Asia? 37<br />
Figure 17. How has early school leaving changed in Latin America and the Caribbean? 38<br />
Figure 18. At which grade do children leave school? 39<br />
Figure 19. How old are children who leave primary school early? 41<br />
Figure 20. What share of youth completed primary and secondary education and what share<br />
left school early? 42<br />
Figure 21. How do household poverty and gender relate to the number of years of education students<br />
complete before leaving school? 43<br />
Figure 22. How do pupils perform in reading? 48<br />
Figure 23. Are rates of grade repetition and early school leaving related? 53<br />
Figure 24. How many years are spent repeating grades in primary and lower secondary education? 56<br />
Figure 25. How large are primary school classes in sub-Saharan Africa? 59<br />
List of tables<br />
Table 1. How many children leave primary school before reaching the last grade? 34<br />
Table 2. Are 2 nd to 4 th grade pupils learning to read? 46<br />
Table 3. How many countries take part in cross-national studies of learning achievement? 47<br />
List of boxes<br />
Box 1. Two key indicators to better examine grade repetition 18<br />
Box 2. What is the survival rate and how is it used to generate the dropout rate at the end of<br />
primary education? 33<br />
Box 3. Early school leaving in the European Union 35<br />
Box 4. What universal reading skills should all children acquire by the end of primary education? 50<br />
Box 5. New OECD estimates for the costs of grade repetition 55<br />
7
SECTION<br />
1<br />
POLICY DESIGN AND IMPLEMENTATION OF<br />
COMPULSORY EDUCATION SYSTEMS<br />
WHAT’S IN THIS SECTION?<br />
The discussions focus on how children progress<br />
through the education system – from entry to<br />
completion. The data show that compulsory<br />
education, even where government mandated, is<br />
a goal which is far from being met and that many<br />
children, especially the most disadvantaged, are<br />
still excluded from schooling. In addition, high<br />
rates of over-age entry into early grades leads to<br />
children of widely ranging and inappropriate ages<br />
spread across primary school grades.<br />
KEY FACTS<br />
••<br />
Progress in reducing the number of out-ofschool<br />
children of primary school age has<br />
slowed down since 2005 and stagnated since<br />
2008 at around 61 million.<br />
••<br />
The estimated number of out-of-school<br />
children has risen in sub-Saharan Africa from<br />
29 million in 2008 to 31 million in 2010.<br />
••<br />
<strong>Global</strong>ly, 47% of all out-of-school children of<br />
primary school age will probably never enter<br />
school.<br />
••<br />
In 2010, lower secondary education was part<br />
of compulsory education in three out of four<br />
countries reporting data.<br />
••<br />
In 2010, the longest average duration of<br />
compulsory education was found in North<br />
America and Western Europe (10.6 years)<br />
and in Latin America and the Caribbean (10.3<br />
years). The shortest average duration was<br />
observed in South and West Asia (5.7 years).<br />
••<br />
About one-third of the world’s children live in<br />
countries where lower secondary education<br />
is formally considered compulsory but where<br />
gross enrolment ratios fall below 90%.<br />
••<br />
Boys are more likely to be over-age in primary<br />
school than girls in almost every country with<br />
a high percentage of over-age children (over<br />
15%).<br />
This section begins by looking at the number of<br />
children who are out of school, some of whom have<br />
attended school at some point. It then presents the<br />
structure of national systems of compulsory education<br />
in order to identify the trajectories by which pupils<br />
progress – or not – through the education system.<br />
When are children meant to enter school and what<br />
are the ages that are supposed to be covered by<br />
the system? How effective is the policy concerning<br />
compulsory education? Does it cover all children? Do<br />
they start on time? The section ends with a description<br />
of the main patterns of school progression found<br />
across the world.<br />
1.1 MOST OUT-OF-SCHOOL CHILDREN HAVE<br />
HAD SOME EXPOSURE TO PRIMARY<br />
SCHOOLING<br />
Before looking at children and how they progress<br />
within the education system, it is important to note that<br />
among the estimated 61 million primary school-age<br />
girls and boys out of school, the majority have had<br />
or are likely to have some exposure to schooling (see<br />
Figure 1).<br />
Despite overall positive trends in the past decade,<br />
the decline in out-of-school figures has slowed down<br />
since 2005 and the number of out-of-school children<br />
has stood at about 61 million over the last three years.<br />
Much of this global stagnation is due to trends in sub-<br />
Saharan Africa, where the number of children out of<br />
school has risen from 29 million in 2008 to 31 million<br />
in 2010. Although enrolment has continued to expand<br />
in the region, it has not kept pace with the steady<br />
increases in the school-age population.<br />
Sub-Saharan Africa accounts for one-half of all outof-school<br />
children worldwide and has the highest<br />
9
SECTION 1 / Policy design and implementation of compulsory education systems<br />
out-of-school rate of all regions. In contrast, South<br />
and West Asia has made strong gains over the past<br />
decade. The reported number of out-of-school<br />
children fell by two-thirds, from 40 million to 13<br />
million between 1999 and 2010. This decrease was<br />
primarily due to progress made in India. Currently the<br />
out-of-school rate in South and West Asia is 7%.<br />
Slightly more than one-quarter of the global out-ofschool<br />
population live in the remaining six regions:<br />
East Asia and the Pacific, the Arab States, Latin<br />
America and the Caribbean, North America and<br />
Western Europe, Central and Eastern Europe and<br />
Central Asia. Together, these regions account for<br />
16.8 million primary school-age children who are not<br />
attending school.<br />
In 2010, an estimated 71 million lower secondary<br />
school-age children were out of school worldwide.<br />
This figure has remained relatively high over the past<br />
several years, despite a reduction in the previous<br />
decade. In 1999, there were 101 million lower<br />
secondary school-age children not attending school.<br />
The regions with the highest shares of the global<br />
out-of-school figure for this age group in 2010 were<br />
South and West Asia (31 million), sub-Saharan Africa<br />
(22 million) and East Asia and the Pacific (10 million).<br />
While in total approximately 131 million children<br />
of primary and lower secondary school age are<br />
currently out of school, this does not mean that they<br />
have never entered school. In fact, many out-ofschool<br />
children have had some exposure to formal<br />
FIGURE 1<br />
How many primary school-age children are out of school?<br />
Distribution of out-of-school children by type and region and absolute number of children out of<br />
school, 2010<br />
Left school Likely to enter school in the future Unlikely to ever enter school Children out of school<br />
(in millions)<br />
Sub-Saharan Africa<br />
20 25 55<br />
30.6<br />
South and<br />
West Asia<br />
45 7 49<br />
13.3<br />
East Asia and<br />
the Pacific<br />
47<br />
38 15<br />
6.6<br />
Arab States<br />
11<br />
41 49<br />
5.0<br />
Latin America and<br />
the Caribbean<br />
7 56 38<br />
2.7<br />
North America and<br />
Western Europe<br />
19<br />
79 2<br />
1.3<br />
Central and<br />
Eastern Europe<br />
9<br />
55 36<br />
0.9<br />
Central Asia<br />
8<br />
41 51 0.3<br />
WORLD<br />
26 27 47 60.7<br />
0 20 40 60 80 100<br />
Distribution of primary school-age children out of school (%)<br />
Source: UNESCO Institute for Statistics database.<br />
10
OPPORTUNITIES LOST: THE IMPACT OF GRADE REPETITION AND EARLY SCHOOL LEAVING<br />
schooling. The UIS disaggregates these children<br />
according to their exposure to education: those who<br />
have left school, those who are expected to enter<br />
school in the future and those who are expected to<br />
never attend school.<br />
<strong>Global</strong>ly, 47% of all out-of-school children of primary<br />
school age will probably never enter school. A further<br />
26% have attended school but dropped out, and<br />
the remaining 27% are expected to enter school<br />
in the future. Data show large variations in regional<br />
patterns. In the Arab States, Central Asia, South and<br />
West Asia and sub-Saharan Africa, about one-half<br />
of all out-of-school children will probably never enter<br />
school. In Central and Eastern Europe, Latin America<br />
and the Caribbean and North America and Western<br />
Europe, most out-of-school children will start school<br />
late. East Asia and the Pacific and South and West<br />
Asia have large shares of early school leavers.<br />
These data on different categories of out-of-school<br />
children highlight two central points relevant to<br />
this analysis. First, roughly 28 million children will<br />
not benefit from access to schooling, despite the<br />
improvements made over the past decade. It is<br />
therefore imperative – albeit difficult – to identify who<br />
these disadvantaged children are in order to design<br />
programmes that will be more effective in reaching<br />
them. Second, most children who are currently out of<br />
school will either start late (by exceeding the intended<br />
school entry age) or have left school early. So, in<br />
order to reduce the risk of early school leaving and<br />
the number of children out of school, it is essential to<br />
focus more attention on what is actually happening<br />
in schools and how this affects children’s chances of<br />
staying in school and progressing through the system.<br />
1.2 WHEN ARE CHILDREN MEANT TO<br />
ENTER SCHOOL? HOW LONG ARE THEY<br />
SUPPOSED TO STAY IN SCHOOL?<br />
How long are children meant to be in school? What<br />
are the legal regulations for compulsory schooling<br />
and how are education systems designed in terms<br />
of intended age coverage? The UIS collects data on<br />
compulsory education according to the age span<br />
and grades during which children and young people<br />
are legally obliged to attend school. These legal<br />
measures aim to assure that children and young<br />
people in a given country receive a minimum amount<br />
of education (even if they repeat grades) and do not<br />
leave school early.<br />
Many governments acknowledge the right to<br />
education in their national constitutions and through<br />
the signing of international treaties. Often, laws are<br />
enacted that obligate citizens in a certain age span to<br />
attend school. Furthermore, countries may guarantee<br />
these rights by offering tuition-free public education<br />
to their citizens, especially for certain grades or levels<br />
of education.<br />
The intended age for school entry varies by region<br />
(see Figure 2). Primary education is nearly always<br />
compulsory. It typically begins between the ages of<br />
5 and 7 years, with 6 years as the most common<br />
entry age. Yet in some countries, especially in Latin<br />
America and the Caribbean, compulsory education<br />
may even begin before primary education, starting<br />
as early as age 3. The regions with the latest starting<br />
ages for compulsory education in 2010 were Central<br />
Asia and Central and Eastern Europe (over 45% of<br />
countries begin primary education at age 7). In sub-<br />
Saharan Africa, more than two-thirds of countries<br />
begin compulsory education at age 6 or earlier, and<br />
the rest begin at age 7.<br />
In line with various international declarations and<br />
conventions on the right to education 1 , compulsory<br />
education typically begins with primary education.<br />
In 2010, lower secondary education was part of<br />
compulsory education in three out of four countries<br />
reporting data, and laws on compulsory education<br />
now include all or part of upper secondary education<br />
in just over one in four countries worldwide. Lower<br />
secondary education is part of basic education<br />
(according to ISCED 1997). Increasingly it is seen<br />
as part of compulsory education. The UNESCO-<br />
1 For example, the Universal Declaration of Human Rights, Article 26:<br />
www.un.org/en/documents/udhr/ and the UN Convention on the Rights of<br />
the Child, Article 28: www2.ohchr.org/english/law/crc.htm<br />
11
SECTION 1 / Policy design and implementation of compulsory education systems<br />
FIGURE 2<br />
At what age are children meant to begin compulsory education?<br />
Percentage of countries by age at the start of compulsory education, 2010<br />
Starting age of compulsory education<br />
3 years 4 years 5 years 6 years 7 years<br />
Arab States (19/20)<br />
100<br />
Latin America and the<br />
Caribbean (42/42)<br />
2<br />
7<br />
52<br />
33 5<br />
East Asia and the<br />
Pacific (29/34)<br />
24 69<br />
7<br />
South and West Asia (7/9)<br />
29<br />
57<br />
14<br />
North America and<br />
Western Europe (26/29)<br />
19<br />
65<br />
15<br />
Sub-Saharan Africa (41/45)<br />
2<br />
2 63<br />
32<br />
Central and Eastern<br />
Europe (20/21)<br />
55<br />
45<br />
Central Asia (9/9)<br />
44<br />
56<br />
WORLD (193/209)<br />
2<br />
19 60<br />
19<br />
1<br />
0 20 40 60 80 100<br />
Percentage of countries<br />
Notes: The figures in parentheses refer to the number of countries in the region reporting data out of the total number of countries in the region. Countries where<br />
compulsory education is reported as not applicable are not included.<br />
Sources: UNESCO Institute for Statistics database and UNESCO <strong>International</strong> Bureau of <strong>Education</strong> database.<br />
supported Basic <strong>Education</strong> in Africa Programme 2<br />
(BEAP) is an example of this expanded notion of a<br />
minimum standard of education. <strong>Education</strong> laws<br />
have also expanded the definition of compulsory<br />
education to include years of pre-primary education,<br />
as in the case of some Latin American and<br />
Caribbean countries.<br />
<strong>Global</strong>ly, the number of years of compulsory<br />
education has been generally on the increase since<br />
2000 (see Figure 3). The global average duration of<br />
compulsory education was 8.9 years in 2010, a slight<br />
increase from 8.5 years in 2000. In 2010, the longest<br />
average duration of compulsory education was noted<br />
2 For more information, see: http://www.unesco.org/new/en/dakar/<br />
education/basic-education-in-africa-programme/<br />
in North America and Western Europe (10.6 years)<br />
and in Latin America and the Caribbean (10.3 years).<br />
The shortest average duration was observed in South<br />
and West Asia and in sub-Saharan Africa, 5.7 and<br />
7.7 years, respectively.<br />
1.3 DO COUNTRIES REACH CHILDREN OF<br />
THE INTENDED AGE FOR COMPULSORY<br />
EDUCATION?<br />
To what extent are countries meeting the goal of<br />
compulsory education? Data on out-of-school<br />
children show that major gaps still persist (see<br />
Figure 1). Also, while a clear majority of countries<br />
recognise lower secondary education as being<br />
compulsory, this is not fully realised in terms of<br />
12
OPPORTUNITIES LOST: THE IMPACT OF GRADE REPETITION AND EARLY SCHOOL LEAVING<br />
FIGURE 3<br />
How many years are children required to stay in compulsory education?<br />
Average duration of compulsory education by region, 2000 and 2010<br />
Average 2000<br />
Shortest country duration 2000 Longest country duration 2000<br />
Average 2010<br />
Shortest country duration 2010<br />
Longest country duration 2010<br />
South and West Asia (9/9)<br />
5.0<br />
5.7<br />
Sub-Saharan Africa (43/45)<br />
7.0<br />
7.7<br />
East Asia and the<br />
Pacific (32/34)<br />
8.0<br />
8.3<br />
Arab States (20/20)<br />
7.5<br />
8.5<br />
Central and Eastern<br />
Europe (20/21)<br />
8.8<br />
9.2<br />
Central Asia (9/9)<br />
9.4<br />
9.9<br />
Latin America and the<br />
Caribbean (42/42)<br />
9.9<br />
10.3<br />
North America and<br />
Western Europe (26/29)<br />
10.5<br />
10.6<br />
WORLD (201/209)<br />
8.5<br />
8.9<br />
0 1 2 3 4 5 6 7 8 9 10 11 12 13 14<br />
Years<br />
Notes: Regional averages are unweighted. The figures in parentheses refer to the number of countries in the region reporting data out of the total number of<br />
countries in the region. Countries where compulsory education is reported as not applicable are included.<br />
Sources: UNESCO Institute for Statistics database and <strong>International</strong> Bureau of <strong>Education</strong> database.<br />
accessibility and availability. In monitoring the<br />
implementation of compulsory education worldwide,<br />
it is clear that many countries are far from meeting<br />
these commitments.<br />
Figure 4 shows that, while most lower secondary<br />
school-age children (80%) live in countries where lower<br />
secondary schooling is considered part of compulsory<br />
schooling, four in ten of these children live in countries<br />
that are far from providing universal lower secondary<br />
education. Despite legal frameworks that are often<br />
in place, participation at this level of schooling is not<br />
universal. About one-third of the world’s children live in<br />
countries where lower secondary education is formally<br />
considered compulsory but where gross enrolment<br />
ratios fall below 90%.<br />
In four regions (Central and Eastern Europe, Central<br />
Asia, Latin America and the Caribbean, and North<br />
America and Western Europe), at least 97% of<br />
children live in countries where participation in lower<br />
secondary education is considered compulsory. Yet,<br />
13
SECTION 1 / Policy design and implementation of compulsory education systems<br />
some of these countries have relatively low rates of<br />
participation in lower secondary education, even<br />
though it is compulsory. In Guatemala for example,<br />
the gross enrolment ratio (GER) for lower secondary<br />
was 65% in 2010. The ratios are also below 90% in<br />
Bulgaria, the Republic of Moldova and the Russian<br />
Federation.<br />
Compulsory lower secondary education is less<br />
common in the Arab States, South and West Asia,<br />
and sub-Saharan Africa. In South and West Asia,<br />
although lower secondary education is compulsory<br />
for a majority of children, only 4% live in countries<br />
with gross enrolment ratios above 90%. In particular,<br />
Afghanistan and India have lower secondary<br />
enrolment ratios below 81%.<br />
In sub-Saharan Africa, 12 out of 17 countries with<br />
compulsory lower secondary education have low<br />
levels of participation. For example, in Burkina Faso,<br />
Chad, Eritrea, Guinea, Malawi, Nigeria and Rwanda,<br />
the gross enrolment ratios for lower secondary<br />
education are between 25% and 50%.<br />
1.4 DO EDUCATION SYSTEMS REACH<br />
CHILDREN OF THE INTENDED AGES?<br />
Children enrolled in primary education tend to have<br />
a wide range of ages, extending beyond the scope<br />
the curriculum is designed for (see Figure 5). This is<br />
particularly true in less developed countries. Thirtyfour<br />
out of 156 countries worldwide reported that<br />
more than 15% of children in primary education were<br />
FIGURE 4<br />
To what extent are children enrolled in compulsory lower secondary education?<br />
Percentage of lower secondary school-age children by coverage of national compulsory<br />
education systems, 2010<br />
Compulsory lower secondary<br />
education and GER ≥ 90%<br />
Compulsory lower secondary<br />
education and GER < 90%<br />
Lower secondary education<br />
not compulsory<br />
South and West Asia<br />
4 73 23<br />
Sub-Saharan Africa<br />
7<br />
35 58<br />
Arab States<br />
52<br />
31 17<br />
Central and<br />
Eastern Europe<br />
57<br />
43<br />
East Asia and<br />
the Pacific<br />
82<br />
6 13<br />
Latin America and<br />
the Caribbean<br />
85<br />
12 3<br />
Central Asia<br />
97<br />
3<br />
North America and<br />
Western Europe<br />
100<br />
WORLD<br />
48 32 20<br />
0 20 40 60 80 100<br />
Percentage of lower secondary school-age children<br />
Notes: Based on 185 countries and territories representing 98% of the world population.<br />
Sources: UNESCO Institute for Statistics database and <strong>International</strong> Bureau of <strong>Education</strong> database.<br />
14
OPPORTUNITIES LOST: THE IMPACT OF GRADE REPETITION AND EARLY SCHOOL LEAVING<br />
older than the intended age group in 2010. More<br />
than one-half of these countries were in sub-Saharan<br />
Africa; for example, more than one in three children<br />
were over-age in Guinea-Bissau and two in seven in<br />
Angola.<br />
There is a gender dimension to being over-age in<br />
primary education. Boys are more likely to be overage<br />
than girls in every country with a high percentage<br />
of over-age children (more than 15%), except in<br />
Mauritania and Nepal.<br />
For the most part, over-age enrolment is caused<br />
by children entering school at an age later than<br />
intended. This is clearly seen in the analysis of<br />
household surveys conducted in Ghana (2008)<br />
and Zambia (2007). In Ghana, 34% of children who<br />
entered primary school were two or more years older<br />
than the intended entry age of 6 years. In Zambia,<br />
22% of primary school entrants were two or more<br />
years older than the entry age of 7 years. In both<br />
countries, boys were slightly more likely to be overage<br />
than girls.<br />
Even more striking are the different patterns of school<br />
progression resulting from the household wealth of<br />
the pupils. In Ghana, 43% of new entrants from the<br />
poorest quintile were over-age compared to 14%<br />
from the richest quintile. In Zambia, the difference<br />
was also large between children from the poorest<br />
(35%) and the richest (5%) quintiles. Inequalities<br />
begin very early, with the children at greatest<br />
disadvantage falling behind at the very start of their<br />
schooling experience.<br />
A wide range in the age of pupils can present<br />
difficulties within the instructional setting. Teachers<br />
may need to make adjustments in the approved<br />
educational programme (e.g. curriculum, instruction<br />
and/or the learning environment) in order to<br />
FIGURE 5<br />
How prevalent are over-age children in primary education?<br />
Percentage of children enrolled in primary education who are above the intended primary<br />
school age, 2010 or most recent year available<br />
Both sexes<br />
Female<br />
Male<br />
40<br />
35<br />
30<br />
25<br />
20<br />
15<br />
10<br />
5<br />
0<br />
Guinea-Bissau<br />
Nepal<br />
Equatorial Guinea<br />
Angola<br />
Lesotho<br />
Mauritania<br />
Kenya<br />
Malawi<br />
Laos<br />
Uganda<br />
Cambodia<br />
Sao Tome/Principe<br />
C. African Rep.<br />
Ghana<br />
Swaziland<br />
Colombia<br />
Nicaragua<br />
Brazil<br />
Burkina Faso<br />
Timor-Leste<br />
Botswana<br />
Rwanda<br />
Ethiopia<br />
Mozambique<br />
Bhutan<br />
Côte d'Ivoire<br />
Mongolia<br />
Suriname<br />
Djibouti<br />
Slovakia<br />
El Salvador<br />
Percentage of over-age pupils<br />
Philippines<br />
Eritrea<br />
Honduras<br />
Note:<br />
The figure includes only countries where more than 15% of pupils in primary education are over-age.<br />
Source: UNESCO Institute for Statistics database.<br />
15
SECTION 1 / Policy design and implementation of compulsory education systems<br />
accommodate the diverse learning needs of their<br />
students. As will be shown in subsequent sections,<br />
the age of school entry is also an important factor for<br />
both grade repetition and early school leaving.<br />
1.5 WHAT ARE THE MAJOR BARRIERS<br />
OR BOTTLENECKS THAT HINDER<br />
PROGRESSION THROUGH THE<br />
EDUCATION SYSTEM?<br />
By looking at major patterns in pupil progression<br />
through primary and secondary education, it is<br />
possible to identify barriers to successful learning.<br />
These key points usually include entry, grade<br />
progression, completion of a programme and<br />
transition to the next level of education.<br />
Three main patterns emerge from analysis of a<br />
range of data. The first pattern is reflected by<br />
countries with extremely high participation rates<br />
in the initial grades, which then drop sharply after<br />
Grade 1 and with each successive grade. These<br />
education systems are characterised by high<br />
numbers of late entrants (children who are older<br />
than the typical or intended primary school entry<br />
age of 6-7 years) and high rates of early school<br />
leaving, especially in early grades. As early grades<br />
provide the foundation for further learning, this<br />
means children often leave school with very little in<br />
terms of skills. At the same time, these countries<br />
often have high rates of grade repetition. The stock<br />
of pupils rapidly declines over the course of primary<br />
education, so that fewer make the transition to<br />
secondary education. This is often seen in lowincome<br />
countries, especially in sub-Saharan Africa,<br />
but also in Asia and the Pacific, as well as Latin<br />
America and the Caribbean.<br />
The second main pattern includes countries that<br />
have high gross participation rates in the initial grades<br />
of primary education (though not as high as countries<br />
in the first pattern), which is followed by a more<br />
moderate decline in participation rates. High rates of<br />
grade repetition are not uncommon, and early school<br />
leaving is a concern, especially at the secondary<br />
education level. This pattern is prevalent among<br />
middle-income countries, especially in Latin America<br />
and the Caribbean.<br />
In the third main pattern, countries have relatively<br />
consistent participation rates across grades, with<br />
little grade repetition and fairly good retention through<br />
lower secondary education. This is the largest group<br />
and includes countries from all over the world – from<br />
the highest performing systems in sub-Saharan<br />
Africa to most countries in North America and<br />
Western Europe, Latin America and the Caribbean,<br />
Central and Eastern Europe, Central Asia, and the<br />
Arab States.<br />
Overall, this section has shown that the schooling<br />
trajectory is not always smooth, nor does it deliver<br />
desired results for many children in developing<br />
countries, especially for those coming from<br />
disadvantaged backgrounds. The next sections<br />
assess the magnitude of these barriers to learning,<br />
while highlighting the compounding effects of socioeconomic<br />
disadvantages on progression patterns<br />
of students. Poor children tend to enter school late,<br />
repeat grades and are more likely to leave school<br />
early or without requisite skills. Notably, the odds are<br />
stacked against them from the beginning – meaning<br />
that without early identification and intervention, it<br />
becomes more difficult and costly to influence their<br />
trajectory for the better.<br />
16
SECTION<br />
2<br />
LEARNING ACHIEVEMENT: DIFFERING POLICIES<br />
AND PRACTICES REGARDING GRADE REPETITION<br />
WHAT’S IN THIS SECTION?<br />
This section examines how repeaters are defined and<br />
how repetition is measured and evaluated. It looks<br />
at global trends in the number of students repeating<br />
grades, in addition to presenting regional and countrylevel<br />
patterns of grade repetition. How many students<br />
repeat a grade every year? What is the share by region?<br />
Which countries show the highest rates of repetition?<br />
The section also examines the impact and cumulative<br />
disadvantage of poverty and rural location on children’s<br />
progress through school, painting a profile of repeaters<br />
based on household surveys.<br />
KEY FACTS<br />
••<br />
In Latin America and the Caribbean, a child entering<br />
school today can expect to receive about 9.5 years<br />
of primary and lower secondary education. However,<br />
almost one year of this time would be spent repeating<br />
a grade. A similar situation is found in sub-Saharan<br />
Africa and the Arab States.<br />
••<br />
In 2010, 32.2 million pupils repeated a grade in primary<br />
education globally compared to 34.7 million in 2000. So<br />
the good news is that over the past decade the number<br />
of repeaters decreased by 7%, even though enrolment<br />
in primary education increased by 6%.<br />
••<br />
Sub-Saharan Africa still has the highest share –<br />
35% – of the global population of primary education<br />
repeaters, but the region has been making steady<br />
progress over the last decade.<br />
••<br />
In sub-Saharan Africa, 14% of primary school<br />
pupils from the poorest households repeat a<br />
grade, compared to 10% of those from the richest<br />
households, according to household survey data.<br />
••<br />
In South and West Asia, the percentage of repeaters<br />
across the region remained the same between 2000<br />
and 2010 at about 5%, even though the number<br />
of primary education pupils increased with rising<br />
enrolment.<br />
••<br />
The situation has been improving in the Latin America<br />
and Caribbean region, which accounts for 17% of<br />
the world’s primary education repeaters. The regional<br />
percentage of repeaters fell from 12% to 8% between<br />
2000 and 2010.<br />
••<br />
In the Arab States, the number of repeaters fell by<br />
14%, while enrolment increased by 18% between<br />
2000 and 2010.<br />
2.1 HOW IS REPETITION DEFINED,<br />
MEASURED AND EVALUATED?<br />
A repeater is defined as a pupil who is not<br />
promoted to the next grade or does not complete<br />
an educational programme and who remains<br />
in the same grade the following school year.<br />
Repetition can result from academic failure,<br />
unsatisfactory progress, insufficient examination<br />
marks to advance to the next level of instruction,<br />
age, poor attendance or, simply, from lack of local<br />
educational opportunities. It may be obligatory or,<br />
in the case of some more developed countries, it<br />
may require the agreement of the student and/or<br />
parents (UNESCO/IIEP, 1997). In practice, there are<br />
countries where repetition is applied at any grade<br />
and others where it is only used at the last grade<br />
of each sub-cycle 3 (usually in primary education).<br />
Some countries practice automatic promotion<br />
where all children are systematically promoted to<br />
the next grade except in exceptional circumstances<br />
(e.g. extended absenteeism due to illness).<br />
<strong>Global</strong>ly, policies concerning grade repetition<br />
are often linked to historical traditions in the<br />
development of education systems and their<br />
colonial legacy. The four general types of European<br />
education systems (Vaniscotte, 1996) reflect<br />
different practices: repetition is not common in<br />
Scandinavian and Anglo-Saxon systems, while it<br />
is practiced in Latin and Mediterranean countries<br />
and to a lesser extent in Germanic education<br />
systems. As a result of colonial history, these four<br />
European approaches have often been used as<br />
models for education systems in Africa, Asia, Latin<br />
3 Sub-cycle repetition is applied in the majority of French-speaking<br />
sub-Saharan African countries (PASEC, 2010) where primary education<br />
comprises six grades sequenced into three sub-cycles of two grades:<br />
Grades 1 and 2 for ‘cours préparatoires’, Grades 3 and 4 for ‘cours<br />
élémentaires’ and Grades 5 and 6 for ‘cours moyens’.<br />
17
SECTION 2 / Learning achievement: Differing policies and practices regarding grade repetition<br />
America and the Caribbean, and the Pacific. Former<br />
French colonies in Africa, for example, tend to follow<br />
the French tradition whereby repetition is applied<br />
to students who fail to make the grade. In North<br />
America, education systems also use repetition<br />
(Labé, 2010).<br />
Repetition is often considered to be a good solution<br />
if learning objectives for that grade level are not<br />
achieved. Usually, repeaters are identified at the<br />
classroom level. The decision to repeat can be taken<br />
unilaterally by the classroom teacher – as in the case<br />
of many developing countries – or after consultation<br />
with the student’s parents, in countries such as<br />
Belgium, France, Switzerland and the United States.<br />
In some West African countries, school principals or<br />
inspectors may also influence the decision.<br />
may also be a ‘culture of repetition’ whereby teachers<br />
tend to fail each year a given proportion of less<br />
performing students irrespective of their learning level<br />
(Crahay, 2007; Labé, 2010).<br />
Learning achievement is not the only criteria for<br />
repetition. A student can also be held back due to<br />
insufficient social or physical maturity in the early<br />
grades of schooling. Moreover, in some cases<br />
students are not promoted simply because the<br />
schools that they attend do not have upper grades or<br />
lack sufficient places to accommodate them.<br />
While accurate data on repetition are essential for<br />
effective educational planning and policy design,<br />
official statistics often under-report the actual<br />
prevalence of repetition due to several factors.<br />
However, the lack of national norms and regulations<br />
has led many experts to argue that these decisions<br />
are based on vague and theoretical learning<br />
standards (UNESCO/IIEP, 1997; Crahay, 2007). In<br />
many cases the decision is based on the teacher’s<br />
evaluation of the student and not necessarily on the<br />
student’s performance on a national or standardised<br />
examination. So the same student may be promoted<br />
by one teacher but held back to repeat a grade by<br />
another teacher. In some countries or schools there<br />
First, the lack of clearly defined concepts of repetition<br />
and sound regulatory mechanisms lead to different<br />
interpretations and standards used at the school<br />
and classroom levels. Students who left or changed<br />
schools during an academic year and enrol in the<br />
same grade the following year are often not counted<br />
as repeaters (Schiefelbein and Wolff, 1992). This<br />
situation is common in developing countries where<br />
the education system is not always equipped to track<br />
these students.<br />
BOX 1. Two key indicators to better examine grade repetition<br />
The two most commonly used indicators for measuring repetition are the repetition rate and the<br />
percentage of repeaters.<br />
The repetition rate represents the proportion of students from a cohort enrolled in a given grade for the<br />
reference academic year who will be in the same grade in the following academic year. It is calculated<br />
at the end of the academic year and is usually based on administrative data. This indicator can be<br />
used to evaluate the internal efficiency of education systems and to project student flows from grade<br />
to grade within the education cycle.<br />
The percentage of repeaters measures the extent and pattern of repetition by grade. It is defined as<br />
the share of repeaters among the total number of students enrolled in a given grade for a reference<br />
academic year. For academic year Y+1, total enrolment in grade X+1 is comprised of new entrants to<br />
that grade (students promoted from grade X at the end of academic year Y) and repeaters that exist in<br />
grade X+1 (i.e. students enrolled in grade X+1 for a second year or more). The percentage of repeaters<br />
is usually calculated at the beginning of the academic year.<br />
For analytical purposes, it is important to note that the repetition rate at grade X refers to academic<br />
year Y, whereas the percentage of repeaters refers to the following academic year (Y+1).<br />
18
OPPORTUNITIES LOST: THE IMPACT OF GRADE REPETITION AND EARLY SCHOOL LEAVING<br />
Under-reporting of repetition also commonly occurs<br />
in multi-grade classrooms and in the year preceding<br />
the last grade of primary education, when parents<br />
may decide to hold their children back to provide<br />
them with greater instruction prior to the last grade in<br />
case examination is required for transition into lower<br />
secondary education. In addition, under-reporting<br />
of repetition can occur when pupils transfer to a<br />
private school or are enrolled in schools with rules<br />
restricting the number of years a pupil can repeat a<br />
grade, especially if school sanctions are applied by<br />
district officials (UNESCO/IIEP, 1997). Moreover, in<br />
some countries, automatic promotion policies are not<br />
fully respected, and repetition is still applied to some<br />
extent but not always reported in official statistics.<br />
For example, Mauritius, 4 Seychelles and Zimbabwe<br />
have an automatic promotion policy for primary<br />
education, but data from the Southern and Eastern<br />
Africa Consortium for Monitoring <strong>Education</strong>al Quality<br />
(SACMEQ) II and III showed that grade repetition is<br />
reported by pupils (Hungi, 2011). In Mauritius and<br />
Zimbabwe, for example, more than 20% of pupils<br />
surveyed reported that they had repeated a grade at<br />
least once.<br />
School life expectancy and repetition<br />
Over the last decade, school enrolment has increased<br />
considerably in many countries. However, high<br />
repetition rates inflate school participation indicators<br />
and misinform about school access, thus revealing<br />
issues of internal efficiency in the education system.<br />
The sizeable resources invested during the course<br />
of an academic year are not fully transformed into<br />
expected outputs and levels of learning achievement<br />
required for students to enter the next grade.<br />
To evaluate the extent of this inefficiency, it is useful<br />
to consider school life expectancy (SLE), which is<br />
a cumulative measure of school participation rates<br />
(see Figure 6). SLE is defined as the total number<br />
of years of schooling that a child of a certain age<br />
can expect to receive in the future based on current<br />
enrolment trends. It indicates the average number of<br />
4 Automatic promotion is applied in Grades 1 to 5, but not in Grade 6 of<br />
primary education.<br />
years that a child is likely to spend in school, including<br />
the repetition of grades. So, SLE reflects the average<br />
duration of schooling but not grades attained.<br />
For example, the Latin America and Caribbean region<br />
has the highest regional SLE of 9.5 years of primary<br />
and lower secondary education. However, a child<br />
entering school in that region today can expect to<br />
spend almost one year of this time repeating a grade.<br />
A similar situation is found in sub-Saharan Africa and<br />
the Arab States, where repetition accounts for 0.7<br />
year of their respective SLEs of 7.9 and 8.4 years. As<br />
shown in Figure 6, boys are more likely than girls to<br />
repeat grades in all regions, except in East Asia and<br />
the Pacific.<br />
2.2 GLOBAL TRENDS IN PUPILS<br />
REPEATING GRADES IN PRIMARY AND<br />
LOWER SECONDARY EDUCATION<br />
Repetition trends in primary education show<br />
slight improvement depending on the region<br />
In 2010, 32.2 million pupils repeated a grade in<br />
primary education globally compared to 34.7 million<br />
in 2000 (see Figure 7). So the good news is that<br />
over the past decade, the number of repeaters<br />
decreased by 7%, even though enrolment in primary<br />
education increased by 6% (from 654.8 to 691.3<br />
million). This global finding is the result of different<br />
patterns of progress at the regional level, which will<br />
be briefly described below. More detailed analysis<br />
is provided in a series of profiles for regions with the<br />
greatest numbers of repeating pupils.<br />
Sub-Saharan Africa has the highest share of primary<br />
education repeaters, numbering 11.4 million in 2010.<br />
The absolute number of repeaters has grown by 16%<br />
over the past decade, largely because of a steep rise<br />
in primary enrolment, which increased by 53% over<br />
the same period.<br />
The second highest share of primary repeaters is<br />
found in South and West Asia. The absolute number<br />
of these pupils has risen by 18%, from 7.7 million to<br />
9.1 million between 2000 and 2010. Throughout this<br />
19
SECTION 2 / Learning achievement: Differing policies and practices regarding grade repetition<br />
FIGURE 6<br />
How many years can a child entering school expect to stay in school?<br />
Average school life expectancy in primary and lower secondary education with and without<br />
repetition, 2000, 2005 and 2010<br />
10<br />
School life expectancy net of repetition, both sexes<br />
School life expectancy net of repetition, male<br />
School life expectancy net of repetition, female<br />
School life expectancy, both sexes<br />
School life expectancy, male<br />
School life expectancy, female<br />
9<br />
8<br />
7<br />
6<br />
5<br />
4<br />
2000<br />
2005<br />
2010<br />
2000<br />
2005<br />
2010<br />
2000<br />
2005<br />
2010<br />
2000<br />
2005<br />
2010<br />
2000<br />
2005<br />
2010<br />
2000<br />
2005<br />
2010<br />
2000<br />
2005<br />
2000<br />
2005<br />
2010<br />
School life expectancy (years)<br />
2000<br />
2005<br />
2010<br />
WORLD<br />
Latin America<br />
and the<br />
Caribbean<br />
North America<br />
and Western<br />
Europe<br />
Central Asia East Asia Arab States Central and<br />
and the<br />
Eastern<br />
Pacific<br />
Europe<br />
Sub-Saharan<br />
Africa<br />
South and<br />
West Asia<br />
Notes: Regions are ranked by 2010 school life expectancy values. Due to low coverage, publishable estimates on school life expectancy net of repetition are not<br />
available for North America and Western Europe. For the same reason, 2010 regional estimates for Central and Eastern Europe are not available.<br />
Source: UNESCO Institute for Statistics database.<br />
period, primary enrolment has fluctuated, growing on<br />
average by 18%.<br />
The Latin America and Caribbean region is home to<br />
17% of the global population of primary repeaters.<br />
However, the region has made considerable progress<br />
in reducing the number of pupils repeating a grade,<br />
which has fallen by 36% from 8.4 to 5.4 million<br />
between 2000 and 2010. This was partially due to a<br />
slight decline in enrolment (5%) over the same period.<br />
A similar trend is found in the Arab States, which<br />
accounts for 9% of global primary repeaters. Between<br />
2000 and 2010, the number of repeaters fell by<br />
14% while enrolment increased by 18%. Although<br />
enrolment rose rapidly between 2000 and 2005,<br />
repetition decreased sharply during the same period.<br />
The East Asia and the Pacific region hosted about 9%<br />
of the world’s primary repeaters in 2010. Over the past<br />
decade, the number of repeaters fell at a faster rate<br />
than enrolment (39% compared to 16%). This progress<br />
mostly occurred during the first half of the decade.<br />
In the remaining regions, the number of primary<br />
pupils and repeaters slightly declined between 2000<br />
and 2010. Together, these regions (Central Asia,<br />
Central and Eastern Europe, and North America and<br />
Western Europe) accounted for 2% of global primary<br />
repeaters in 2010.<br />
Repetition trends in lower secondary<br />
education show signs of improvement despite<br />
big enrolment increases<br />
<strong>Global</strong>ly, the total number of pupils repeating a grade<br />
in lower secondary (general programmes) education<br />
20
OPPORTUNITIES LOST: THE IMPACT OF GRADE REPETITION AND EARLY SCHOOL LEAVING<br />
FIGURE 7<br />
How do trends in grade repetition and enrolment in primary education compare<br />
across regions?<br />
Repeaters and enrolment in primary education by region, 2000, 2005 and 2010<br />
655<br />
685 691<br />
Enrolment Repeaters Percentage of repeaters<br />
400<br />
Enrolment (in millions)<br />
300<br />
200<br />
100<br />
0<br />
40<br />
30<br />
20<br />
10<br />
0<br />
34.7<br />
32.7 32.2<br />
16<br />
14<br />
12<br />
10<br />
8<br />
6<br />
4<br />
2<br />
0<br />
2000<br />
2005<br />
2010<br />
2000<br />
2005<br />
2010<br />
2000<br />
2005<br />
2010<br />
2000<br />
2005<br />
2010<br />
2000<br />
2005<br />
2010<br />
Repeaters (in millions)<br />
Percentage of repeaters<br />
2000<br />
2005<br />
2010<br />
2000<br />
2005<br />
2010<br />
2000<br />
2005<br />
2010<br />
2000<br />
2005<br />
2010<br />
WORLD<br />
Sub-Saharan<br />
Africa<br />
South and<br />
West Asia<br />
Latin America<br />
and the<br />
Caribbean<br />
Arab States<br />
East Asia<br />
and the<br />
Pacific<br />
North America<br />
and Western<br />
Europe<br />
Central and<br />
Eastern<br />
Europe<br />
Central Asia<br />
Note: Regions are ranked by the number of repeaters in 2010.<br />
Source: UNESCO Institute for Statistics database.<br />
rose slightly from 13.8 million to 14.1 million between<br />
2000 and 2010 (see Figure 8). Yet, over the same<br />
period, the number of pupils enrolled in this level<br />
of education grew by 11%, from 280 million to 310<br />
million. So the slight rise in repetition rates is likely<br />
due to growth in enrolment.<br />
In 2010, 70% of students who repeated a grade in<br />
lower secondary education lived in three regions:<br />
Latin America and the Caribbean, South and West<br />
Asia, and sub-Saharan Africa. In all regions, with the<br />
exception of East Asia and the Pacific, the number<br />
of pupils enrolled in lower secondary education<br />
progressed at a faster rate than the number of<br />
repeaters. This trend is further explored in the<br />
regional profiles below.<br />
2.3 REGIONAL TRENDS IN PUPILS<br />
REPEATING GRADES IN PRIMARY AND<br />
LOWER SECONDARY EDUCATION<br />
Sub-Saharan Africa: Steady progress<br />
Sub-Saharan Africa still has the highest share –<br />
35% – of the global population of primary education<br />
repeaters, but the region has been making steady<br />
progress over the last decade. The percentage of<br />
repeaters has fallen, from 11% to 9%, between<br />
2000 and 2010 even though, in absolute terms, the<br />
number of primary repeaters has increased over<br />
this period. This is mostly because there are more<br />
students in the system due to rising enrolment rates.<br />
This progress is clearly seen at the national level (see<br />
Figure 9). In 1999, 15 countries in sub-Saharan<br />
21
SECTION 2 / Learning achievement: Differing policies and practices regarding grade repetition<br />
Africa had repetition rates exceeding 20%, compared<br />
to only 6 countries in 2009. In particular, the following<br />
countries have reduced their rates by more than 10<br />
percentage points: Cameroon, Congo, Ethiopia,<br />
Madagascar, Mozambique and Rwanda.<br />
However, primary education repetition rates remain<br />
very high in Burundi (36%), Togo (23%), Chad (23%),<br />
Central African Republic (23%) and Congo (23%).<br />
In contrast, rates are low in the United Republic of<br />
Tanzania (2%), Mauritius (3%), Ghana (4%), Ethiopia<br />
(4%) and Niger (4%). In Nigeria and Seychelles,<br />
the rates are nil due to the practice of automatic<br />
promotion.<br />
Across the region, boys are slightly more likely<br />
to repeat than girls. However, the gender gap<br />
widens in countries such as Lesotho, where 23%<br />
of boys repeat a primary grade compared to<br />
17% of girls. Male repetition rates at this level of<br />
education are about four percentage points higher<br />
than that of girls in Cape Verde, Lesotho, Namibia<br />
and Swaziland. However, the opposite is found<br />
in the Central African Republic, where 23% of<br />
girls enrolled in primary education repeat a grade<br />
compared to 22% of boys.<br />
Repetition rates for lower secondary education have<br />
also been falling across the region over the last<br />
decade. Yet, there is considerable variation at the<br />
country level, where these rates ranged between 2%<br />
in the United Republic of Tanzania to 30% in Burkina<br />
Faso in 2009.<br />
FIGURE 8<br />
How do trends in grade repetition and enrolment in lower secondary education<br />
compare across regions?<br />
Repeaters and enrolment in lower secondary education (general programmes) by region, 2000,<br />
2005 and 2010<br />
280<br />
304 310<br />
Enrolment Repeaters Percentage of repeaters<br />
200<br />
Enrolment (in millions)<br />
100<br />
0<br />
15<br />
13.8 13.6<br />
14.1<br />
15<br />
Repeaters (in millions)<br />
10<br />
5<br />
10<br />
5<br />
Percentage of repeaters<br />
0<br />
2000<br />
2005<br />
2010<br />
2000<br />
2005<br />
2010<br />
2000<br />
2005<br />
2010<br />
2000<br />
2005<br />
2010<br />
2000<br />
2005<br />
2010<br />
2000<br />
2005<br />
2010<br />
2000<br />
2005<br />
2010<br />
2000<br />
2005<br />
2010<br />
2000<br />
2005<br />
2010<br />
0<br />
WORLD<br />
Latin America<br />
and the<br />
Caribbean<br />
South and<br />
West Asia<br />
Sub-Saharan<br />
Africa<br />
Arab States<br />
North America<br />
and Western<br />
Europe<br />
East Asia<br />
and the<br />
Pacific<br />
Central and<br />
Eastern<br />
Europe<br />
Central Asia<br />
Note: Regions are ranked by the number of repeaters in 2010.<br />
Source: UNESCO Institute for Statistics database.<br />
22
OPPORTUNITIES LOST: THE IMPACT OF GRADE REPETITION AND EARLY SCHOOL LEAVING<br />
FIGURE 9<br />
High but declining repetition rates in sub-Saharan Africa<br />
Primary and lower secondary repetition rates in sub-Saharan Africa, 1999, 2004 and 2009<br />
1999 2004 2009 2009 (decrease since 1999) 2009 (increase since 1999)<br />
Primary education<br />
Lower secondary education (general programmes)<br />
Gabon<br />
Burundi<br />
Comoros<br />
Togo<br />
Chad<br />
C. African Rep.<br />
Congo<br />
Equatorial Guinea<br />
Lesotho<br />
Malawi<br />
Madagascar<br />
Côte d’Ivoire<br />
Guinea<br />
Namibia<br />
Swaziland<br />
Guinea-Bissau<br />
DR Congo<br />
Rwanda<br />
Eritrea<br />
Benin<br />
Cameroon<br />
Mali<br />
Sao Tome/Principe<br />
Angola<br />
Burkina Faso<br />
Uganda<br />
Cape Verde<br />
South Africa<br />
Mozambique<br />
Liberia<br />
Senegal<br />
Zambia<br />
Kenya<br />
Gambia<br />
Botswana<br />
Niger<br />
Ethiopia<br />
Ghana<br />
Mauritius<br />
Tanzania<br />
Nigeria<br />
Seychelles<br />
Burkina Faso<br />
Burundi<br />
Togo<br />
Congo<br />
Sao Tome/Principe<br />
Cape Verde<br />
Niger<br />
Benin<br />
Angola<br />
Mali<br />
Chad<br />
Namibia<br />
Cameroon<br />
Senegal<br />
Guinea<br />
Equatorial Guinea<br />
Mozambique<br />
Comoros<br />
Lesotho<br />
C. African Rep.<br />
Côte d’Ivoire<br />
South Africa<br />
Eritrea<br />
Malawi<br />
Swaziland<br />
Madagascar<br />
Zambia<br />
Ethiopia<br />
Liberia<br />
Mauritius<br />
Gambia<br />
Ghana<br />
Uganda<br />
Tanzania<br />
Botswana<br />
Nigeria<br />
Seychelles<br />
0 5 10 15 20 25 30 35 40 45 0 5 10 15 20 25 30 35 40 45<br />
Repetition rate (%) Repetition rate (%)<br />
Notes: Countries are ranked by the repetition rate values in 2009 or most recent year available. Countries presented are those with data available. The symbol<br />
used when data for 1999 are not available or when data for 1999 and 2009 have the same value.<br />
is<br />
Source: UNESCO Institute for Statistics database.<br />
23
SECTION 2 / Learning achievement: Differing policies and practices regarding grade repetition<br />
Since 1999, the following countries reduced their<br />
repetition rates by at least 10 percentage points<br />
at the lower secondary education level: Eritrea,<br />
Mozambique, Sao Tome and Principe, and Zambia.<br />
However, there was a significant rise in rates in<br />
Lesotho, Namibia and Togo over the same period.<br />
In most cases, countries with high repetition rates at<br />
the lower secondary level (over 20%) tend to have<br />
rates exceeding 20% at the primary level, with the<br />
exceptions of Burkina Faso, Cape Verde, Niger, and<br />
Sao Tome and Principe.<br />
In general, boys are slightly more likely to repeat<br />
lower secondary grades than girls in most countries<br />
of sub-Saharan Africa. However, the gender gap<br />
was significant in Burkina Faso, where 31% of boys<br />
repeated a grade compared to 20% of girls in 2009,<br />
as well as in Angola and Cape Verde (6 versus 5<br />
percentage points respectively).<br />
South and West Asia: Small signs of progress,<br />
especially in Nepal and Bhutan<br />
The South and West Asia region has the second<br />
highest regional share – 28% – of the global<br />
population of primary education repeaters. Across<br />
the region, 9.1 million pupils at this education level<br />
repeated a grade in 2009. The good news is that the<br />
situation is improving, although at a slower rate than<br />
in sub-Saharan Africa. Between 2000 and 2010, the<br />
percentage of repeaters across the region remained<br />
the same at about 5%, even though the number<br />
of primary education pupils increased with rising<br />
enrolment.<br />
In contrast, repetition rates have increased in<br />
Bangladesh (from 11% to 13%) and Pakistan (from<br />
3% to 4%). This means that the number of children<br />
repeating a primary grade has risen by about 0.5<br />
million since 1999 in both countries combined.<br />
Overall, in the region, boys and girls are just as likely<br />
to repeat a grade of primary education.<br />
At the lower secondary level, repetition rates have<br />
been steadily falling in most countries in South and<br />
West Asia since 1999. The largest decreases were<br />
noticed in Bhutan (from 15% to 4%) and Iran (from<br />
13% to 4%). In general, gender is not a major issue<br />
affecting repetition rates.<br />
Latin America and the Caribbean: Repetition<br />
rates still high but some policy interventions<br />
show promise<br />
Repetition is also a major concern for the Latin<br />
America and Caribbean region, which accounts<br />
for 17% of the world’s primary education repeaters<br />
(see Figure 11). Yet, once again, the situation has<br />
been improving, with the regional percentage of<br />
repeaters falling from 12% to 8% between 2000<br />
and 2010. Unlike the previously described regions,<br />
the absolute number of repeaters in Latin America<br />
and the Caribbean has decreased from 8.4 million<br />
to 5.4 million over the same period. While this is<br />
partly due to a corresponding decline in primary<br />
school enrolment, the significant drop in the number<br />
of repeaters appears to reflect the success of<br />
interventions designed to reduce repetition (which<br />
are further discussed in Section 5).<br />
As shown in Figure 10, repetition rates at the<br />
primary education level decreased in four countries<br />
in South and West Asia, with significant progress<br />
made in Nepal, where the rates fell from 26% to<br />
12% between 1999 and 2009, followed by Bhutan<br />
(from 14% to 6%) and Iran (from 5% to 2%). In<br />
India, a slight drop in the repetition rate (from 4.3%<br />
to 3.5%) 5 has nevertheless led to a significant<br />
drop in the number of pupils repeating a grade.<br />
At the country level, repetition rates have fallen<br />
since 1999 in most countries of the region. The<br />
greatest progress has been made in Brazil, where<br />
the rate fell from 24% to 18% 6 , and in Saint Vincent<br />
and the Grenadines (10% to 4%). In contrast, there<br />
has been a significant rise in the repetition rate in<br />
Nicaragua, from 5% to 11%, as well as increases<br />
of about 2 to 4 percentage points in the Bahamas,<br />
5 The reference year is 2007.<br />
6 The reference year is 2004.<br />
24
OPPORTUNITIES LOST: THE IMPACT OF GRADE REPETITION AND EARLY SCHOOL LEAVING<br />
FIGURE 10<br />
How has grade repetition changed in South and West Asia?<br />
Primary and lower secondary education repetition rates in South and West Asia, 1999, 2004<br />
and 2009.<br />
1999 2004 2009<br />
2009 (decrease since 1999)<br />
Primary education<br />
Lower secondary education (general programmes)<br />
Afghanistan<br />
Maldives<br />
Bangladesh<br />
Nepal<br />
Nepal<br />
Iran<br />
Bhutan<br />
Bhutan<br />
Pakistan<br />
India<br />
Pakistan<br />
Iran<br />
Bangladesh<br />
Sri Lanka<br />
Sri Lanka<br />
0 5 10 15 20 25 30<br />
Repetition rate (%)<br />
0 5 10 15 20 25 30<br />
Repetition rate (%)<br />
Notes: Countries are ranked by the repetition rate values in 2009 or most recent year available. Countries presented are those with data available. The symbol<br />
used when data for 1999 are not available or when data for 1999 and 2009 have the same value.<br />
is<br />
Source: UNESCO Institute for Statistics database.<br />
Dominica, Dominican Republic, Saint Kitts and<br />
Nevis, and Suriname.<br />
Across the region, boys are slightly more likely to<br />
repeat grades in primary school than girls, with the<br />
regional average at 8.3% for boys compared to<br />
7.8% for girls. In 2009, the gender gap exceeded<br />
2 percentage points in Antigua and Barbuda,<br />
Argentina, Belize, Dominica, Dominican Republic,<br />
El Salvador, Guatemala, Nicaragua, Paraguay,<br />
Suriname, Trinidad and Tobago, Uruguay and<br />
Venezuela.<br />
(from 5% to 10%), Costa Rica (10% to 15%),<br />
Dominican Republic (3% to 7%), and Dominica<br />
(11% to 15%). In contrast, repetition rates have<br />
fallen in Belize (by 3 percentage points), Venezuela<br />
(6 percentage points), and Saint Vincent and the<br />
Grenadines (8 percentage points).<br />
As in the case of primary education, repetition rates<br />
are higher for boys than girls at the lower secondary<br />
level. This is true for all countries in the region, with<br />
the exception of Saint Kitts and Nevis, where boys<br />
have a slightly lower repetition rate than girls.<br />
Turning to lower secondary education, repetition<br />
rates are generally higher than at the primary level.<br />
Moreover, they have been rising since 1999 in about<br />
one-half of the region’s countries with available data.<br />
The greatest increases have occurred in Grenada<br />
In other selected regions<br />
Repetition rates by country in North America and<br />
Western Europe, Central Asia and Central and<br />
Eastern Europe are not discussed in the present<br />
25
SECTION 2 / Learning achievement: Differing policies and practices regarding grade repetition<br />
FIGURE 11<br />
How has grade repetition changed in Latin America and the Caribbean?<br />
Primary and lower secondary education repetition rates in Latin America and the Caribbean,<br />
1999, 2004 and 2009.<br />
1999 2004 2009 2009 (decrease since 1999) 2009 (increase since 1999)<br />
Primary education<br />
Lower secondary education (general programmes)<br />
Brazil<br />
Suriname<br />
Guatemala<br />
Netherlands Antilles<br />
Nicaragua<br />
Belize<br />
Aruba<br />
Dominican Rep.<br />
Trinidad/Tobago<br />
Peru<br />
Antigua/Barbuda<br />
El Salvador<br />
Costa Rica<br />
Panama<br />
Uruguay<br />
Honduras<br />
Argentina<br />
Paraguay<br />
Dominica<br />
St Vincent/Grenad.<br />
Venezuela<br />
Mexico<br />
Bahamas<br />
Chile<br />
Saint Lucia<br />
Jamaica<br />
Colombia<br />
St Kitts/Nevis<br />
Ecuador<br />
Guyana<br />
Bolivia<br />
Cuba<br />
Cayman Islands<br />
Anguilla<br />
Barbados<br />
Bermuda<br />
Brazil<br />
Uruguay<br />
Suriname<br />
Costa Rica<br />
Dominica<br />
Aruba<br />
Guyana<br />
Grenada<br />
British Virgin Is<br />
Nicaragua<br />
Antigua/Barbuda<br />
Panama<br />
Dominican Rep.<br />
Venezuela<br />
Peru<br />
Bolivia<br />
Belize<br />
Honduras<br />
El Salvador<br />
Ecuador<br />
Guatemala<br />
St Vincent/Grenad.<br />
Colombia<br />
St Kitts/Nevis<br />
Bahamas<br />
Chile<br />
Paraguay<br />
Cuba<br />
Mexico<br />
Jamaica<br />
Saint Lucia<br />
Trinidad/Tobago<br />
Cayman Islands<br />
Anguilla<br />
Barbados<br />
Bermuda<br />
Montserrat<br />
0 5 10 15 20 25<br />
Repetition rate (%)<br />
0 5 10 15 20 25<br />
Repetition rate (%)<br />
Notes: Countries are ranked by the repetition rate values in 2009 or most recent year available. Countries presented are those with data available. The symbol<br />
used when data for 1999 are not available or when data for 1999 and 2009 have the same value.<br />
is<br />
Source: UNESCO Institute for Statistics database.<br />
section. The total number of repeaters in these<br />
regions is very low (representing just 2% of the global<br />
total of repeaters in primary education) compared<br />
to the other regions. In addition, repetition rates are<br />
generally low in these regions.<br />
In the Arab States region, the percentage of<br />
repeaters in primary education decreased from<br />
9% in 2000 to 7% in 2010, while enrolment at that<br />
level increased from 35.5 million to 41.7 million. In<br />
2010, 2.9 million pupils repeated a primary grade<br />
in the region, which represents 9% of the world’s<br />
total repeaters and corresponds to the third-highest<br />
percentage of repeaters in the world after sub-<br />
Saharan Africa and Latin America and the Caribbean.<br />
In terms of progression, from 1999 to 2009 repetition<br />
26
OPPORTUNITIES LOST: THE IMPACT OF GRADE REPETITION AND EARLY SCHOOL LEAVING<br />
rates decreased considerably in Mauritania (from<br />
16% to 4%), Tunisia (from 16% to 7%) and Algeria<br />
(from 14% to 8%). In lower secondary education,<br />
Algeria, Lebanon, Mauritania, Morocco and Tunisia<br />
had repetition rates higher than 10% in 2009. During<br />
the decade, the largest decrease in repetition rates at<br />
the lower secondary level occurred in Iraq (from 33%<br />
to 10%). In general, boys were more likely to repeat<br />
than girls in the region, except in Djibouti, Lebanon,<br />
Mauritania and Qatar.<br />
The East Asia and the Pacific region hosts about<br />
9% of the world’s repeaters at the primary education<br />
level. As in the case of other regions, the percentage<br />
of repeaters decreased during the last decade,<br />
from 2% in 2000 to 1.5% in 2010. Yet, in some<br />
countries – Cambodia, Lao People’s Democratic<br />
Republic, Timor-Leste and Vanuatu – high repetition<br />
rates persist. In 2009, for example, repetition rates in<br />
Timor-Leste and Lao People’s Democratic Republic<br />
were 18% and 17% respectively, and they increased<br />
in Vanuatu from 11% in 1999 to 14% in 2009. The<br />
largest decrease in repetition rates in the region<br />
occurred in Cambodia, with rates falling from 18%<br />
to 9% over the same period. In lower secondary<br />
education, most countries in the region had repetition<br />
rates below 5% in 2009, except China, Special<br />
Administrative Region of Macao (14.3%). With regard<br />
to gender, repetition rates are generally lower for<br />
female students in the region than for male students<br />
in primary and lower secondary education.<br />
2.4 WHICH GRADES DO CHILDREN<br />
REPEAT THE MOST? COUNTRY<br />
CLUSTERS SHOW THREE PATTERNS OF<br />
REPETITION<br />
For effective educational planning and policy design,<br />
it is important to identify whether students are more<br />
likely to repeat grades at the start or the end of<br />
the education cycle. Figure 12 presents data on<br />
repetition by grade in countries with high repetition<br />
rates and highlights two main groups.<br />
In the first group of countries (coloured in yellow),<br />
high repetition rates in the first grade of primary<br />
education are coupled with high primary intake ratios<br />
(see Statistical Table 2), which leads to large class<br />
sizes due to considerable numbers of pupils who are<br />
either younger or older than the official entry age. In<br />
most countries, primary education is free of charge,<br />
while this is not necessarily the case for pre-primary<br />
education. In these cases, younger children may be<br />
enrolled directly in school or sometimes follow their<br />
elder siblings to school with their parents’ support.<br />
In such cases, high repetition in the first grade of<br />
primary can be partly due to low expectations for the<br />
younger group to meet learning objectives (Crahay,<br />
2007; Labé, 2010).<br />
With regard to over-age pupils, many reasons –<br />
including the cost of schooling, household<br />
responsibilities and the perceived benefits of<br />
education by their parents – may explain the<br />
persistence of late school entry (see Figure 5). In<br />
many developing countries, for example, primary<br />
school fee abolition has led to a considerable wave<br />
of first-time entrants in subsequent academic years.<br />
High repetition rates among these over-aged pupils in<br />
the first grade of primary school may be explained by<br />
a lack of motivation or relevance of the curriculum,<br />
which is usually designed for younger pupils.<br />
(Schiefelbein and Wolff, 1992; UNESCO/IIEP, 1997).<br />
The first group of countries is very diverse:<br />
Cambodia, Guatemala, Lao People’s Democratic<br />
Republic, Malawi, Nepal, Nicaragua, Timor-Leste and<br />
Vanuatu. Yet, all these countries have repetition rates<br />
of about 20% or higher in the first grade of primary<br />
education, which then fall sharply at the second<br />
grade and continue to decline over subsequent<br />
grades up to the last grade of lower secondary<br />
education.<br />
In the second group of countries (Benin, Burkina<br />
Faso, Mali, Mozambique, Niger and Senegal), there<br />
is a pattern of low repetition rates in the first grade of<br />
primary (10% or less), which steadily increase over<br />
subsequent grades before rising sharply (over 15%) at<br />
the last grade of primary and/or exceeding 20% in the<br />
last grade of lower secondary education. In this group<br />
of countries, access to lower and upper secondary<br />
27
SECTION 2 / Learning achievement: Differing policies and practices regarding grade repetition<br />
FIGURE 12<br />
Which grades do children repeat most often?<br />
Repetition rates across grades in primary and lower secondary education (general<br />
programmes) in selected countries, 2009 or most recent year available<br />
Primary education<br />
Lower secondary education (general programmes)<br />
50<br />
45<br />
Burkina Faso<br />
46<br />
40<br />
35<br />
32<br />
Niger<br />
Repetition rate (%)<br />
30<br />
25<br />
20<br />
Senegal<br />
15<br />
10<br />
5<br />
0<br />
4<br />
Guatemala<br />
2<br />
Laos<br />
Timor-Leste<br />
1 2 3 4 5 6 7 8 9 10<br />
Grade<br />
Source: UNESCO Institute for Statistics database.<br />
education is often subject to a national examination,<br />
which is usually competitive and results in high<br />
student failure rates. In Burkina Faso, for example,<br />
almost one-third and one-half of students repeat the<br />
last grade of primary and lower secondary school,<br />
respectively, after taking certification examinations.<br />
In effect, competitive national examinations are often<br />
used in some countries to limit entry into educational<br />
programmes due to an insufficient supply of school<br />
spaces (UNESCO-IBE, 2011).<br />
A third group of countries (Burundi, Central African<br />
Republic, Congo, Lesotho, Namibia and Togo)<br />
presents a mix of the two patterns described<br />
previously. In this group, countries have high<br />
repetition rates in all grades – ranging between 10%<br />
and 49% – which tend to fluctuate between grades.<br />
These fluctuations may be due to a combination<br />
of factors, such as large numbers of under-age or<br />
over-age children, lack of available spaces in certain<br />
grades, and the use of national examinations limiting<br />
access to education.<br />
2.5 WHICH CHILDREN ARE MOST LIKELY<br />
TO REPEAT? USUALLY CHILDREN<br />
FROM POOR FAMILIES AND RURAL<br />
LOCATIONS ARE MOST AT RISK<br />
As in the case of administrative data, analysis of<br />
household survey data shows that, on average, boys<br />
are more likely than girls to repeat grades in primary<br />
education. However, the gender gap is relatively small<br />
in the majority of countries.<br />
In many countries, household poverty and location<br />
are linked to wide disparities in primary education<br />
28
OPPORTUNITIES LOST: THE IMPACT OF GRADE REPETITION AND EARLY SCHOOL LEAVING<br />
FIGURE 13<br />
Pupils from poor and rural households are much more likely to repeat<br />
Repetition rates for primary education by location and household wealth quintile, countries with<br />
repetition rates greater than 5%, most recent year (2005-2010)<br />
Urban children<br />
Richest children<br />
Rural children<br />
Poorest children<br />
Average<br />
Liberia<br />
Guinea<br />
Côte d’Ivoire<br />
Sierra Leone<br />
Niger<br />
Mauritania<br />
Benin<br />
Mali<br />
Senegal<br />
Burkina Faso<br />
Madagascar<br />
C. African Rep.<br />
DR Congo<br />
Cambodia<br />
Cameroon<br />
Uganda<br />
Togo<br />
Malawi<br />
Rwanda<br />
Syrian Arab Rep.<br />
Dominican Rep.<br />
Kenya<br />
Belize<br />
Namibia<br />
Lesotho<br />
Swaziland<br />
Congo<br />
Less significant<br />
attendance gap<br />
Significant<br />
attendance gap<br />
Very significant<br />
attendance gap<br />
0 5 10 15 20 25 30 35<br />
Repetition rate for primary education (%)<br />
Notes: “Less significant gap” indicates that the difference in primary GAR between rich and poor children is less than 10 percentage points. “Significant gap”<br />
indicates that the difference in primary GAR between rich and poor children is between 10 and 30 percentage points. “Very significant gap” indicates that<br />
the difference in primary GAR between rich and poor children is greater than 30 percentage points.<br />
Sources: Demographic and Health Surveys (DHS) and Multiple Indicator Cluster Surveys (MICS).<br />
repetition rates as shown in Figure 13, which<br />
illustrates the extent of the progression gap<br />
between rich, urban, poor and rural children. It also<br />
sheds light on the attendance gap by classifying<br />
countries according to the difference between the<br />
gross attendance rates 7 (GAR) of rich and poor<br />
children.<br />
It is important to note that a primary GAR of 105%<br />
or more can reflect a large number of over-age and<br />
7 The gross attendance ratio (GAR) is the ratio between total attendance in<br />
a given level of education, regardless of age, and the official school-age<br />
population corresponding to the same level of education in a given school<br />
year.<br />
under-age pupils. For the purposes of this analysis,<br />
inequity in primary school attendance is reflected<br />
by a difference of 10 percentage points or more<br />
between the GARs of rich and poor children.<br />
Figure 13 highlights two main messages: first, in<br />
many countries, pupils from poor or rural households<br />
are much more likely to repeat a primary grade than<br />
pupils from rich or urban homes. Second, these<br />
disadvantaged pupils also tend to have significantly<br />
lower primary education attendance rates.<br />
29
SECTION 2 / Learning achievement: Differing policies and practices regarding grade repetition<br />
As illustrated in Figure 13, repetition rates for poor or<br />
rural pupils are at least five percentage points higher<br />
than those for rich or urban pupils in 13 countries.<br />
Moreover, these disparities are compounded by a<br />
gap in attendance rates in 10 countries. In Belize,<br />
Cambodia, Congo, Lesotho, Malawi, Rwanda,<br />
Swaziland and Uganda, poor children are not only<br />
less likely to attend school but more likely to repeat<br />
as well. In Cameroon and Togo, it is rural children<br />
who face the largest disparities in attendance and<br />
repetition (World Bank, 2003).<br />
The highest repetition rates are found in Malawi,<br />
Rwanda and Togo, where about one in three<br />
primary education pupils repeat a grade. In Rwanda<br />
and Malawi, pupils from poor households are about<br />
50% more likely to repeat than those from wealthy<br />
households. Repetition rates in urban areas are<br />
higher than in rural areas in Burkina Faso, which<br />
is an exception to the usual pattern among the<br />
countries shown in Figure 13 (Coulidiati-Kielem,<br />
2007).<br />
It is important to note some other exceptions.<br />
Poverty and rural location are not linked to<br />
significantly higher repetition rates at the primary<br />
level in Côte d’Ivoire, Guinea, Namibia, Niger and<br />
Sierra Leone. Moreover, household income is not<br />
linked to disparities in GARs in these countries: the<br />
GAR of poor and rich children differ by less than 10<br />
percentage points.<br />
2.6 INEQUITY TENDS TO DECLINE AS<br />
CHILDREN MAKE THE TRANSITION TO<br />
SECONDARY EDUCATION<br />
Figure 14 compares the repetition rates in primary<br />
(ISCED 1), lower secondary (ISCED 2) and upper<br />
secondary (ISCED 3) education in sub-Saharan<br />
Africa, based on data from 29 countries that<br />
represented 84% of the primary school-age<br />
population in that region in 2010. For each level of<br />
education and group of disaggregation, the graph<br />
highlights the mean repetition rate across the 29<br />
countries. 8 National values are represented by hollow<br />
grey markers that surround the regional average.<br />
Repetition rates that exceed 30% are not shown<br />
in the graph but were taken into account in the<br />
calculation of mean values.<br />
In general, repetition rates tend to decrease by level<br />
of education – with the average rate for all children<br />
falling from 12% at the primary level to 10% for lower<br />
and upper secondary education. Boys are somewhat<br />
more likely to repeat a grade at the primary level,<br />
but this small gap closes at the secondary level of<br />
education.<br />
Geographic location and household wealth account<br />
for far greater disparities in repetition rates than<br />
gender. Yet, these disparities tend to decrease<br />
as children advance from primary to secondary<br />
education. The average repetition rate in primary<br />
education is 13% in rural areas and 10% in urban<br />
areas. At the lower secondary level, the repetition rates<br />
for the two groups are 11% and 9%, respectively, and<br />
at the upper secondary level the difference between<br />
the repetition rates of urban and rural pupils shrinks to<br />
less than one percentage point. 9<br />
The biggest gap exists between children from the<br />
poorest and richest household wealth quintiles: 14%<br />
of primary school pupils from the poorest households<br />
repeat a grade, compared to 10% of those from the<br />
richest households. At the lower secondary level of<br />
education, the gap between the two groups is much<br />
smaller: 11% of the poorest children repeat a grade<br />
compared to 9% of the richest children. At the upper<br />
secondary level, the repetition rate of children from the<br />
richest households is 10%, which is the same as at<br />
the primary level. Very few children from the poorest<br />
households enrol in upper secondary education, so<br />
8 Mean repetition rates are not weighted by each country’s population. The<br />
focus of the analysis is thus on countries, giving each country the same<br />
weight, and not on the school-age population in the region.<br />
9 In theory, the repetition rates for the total student population in the first<br />
panel of Figure 14 should lie between the urban and rural repetition rates<br />
in the third panel. However, this is not observed for the upper secondary<br />
level of education, because the repetition rates by location and household<br />
wealth were calculated from a smaller group of countries due to limitations<br />
of data, including small sample size for some groups of disaggregation.<br />
30
OPPORTUNITIES LOST: THE IMPACT OF GRADE REPETITION AND EARLY SCHOOL LEAVING<br />
FIGURE 14<br />
Disparities in repetition rates are highest at the primary education level<br />
Repetition rates in primary, lower secondary and upper secondary education in sub-Saharan<br />
Africa by sex, location and household wealth quintile, most recent year (2005-2010)<br />
Female<br />
Rural<br />
Poorest 20%<br />
Total<br />
Male<br />
Urban<br />
Richest 20%<br />
30<br />
25<br />
20<br />
Repetition rate (%)<br />
15<br />
12.4<br />
12.8<br />
13.4<br />
14.2<br />
10<br />
9.8<br />
9.8<br />
12.1<br />
9.8<br />
10.0 9.9<br />
9.7<br />
10.1<br />
11.0<br />
8.9<br />
10.5<br />
9.9<br />
9.8<br />
10.7<br />
9.2<br />
10.1<br />
5<br />
0<br />
1 2 3<br />
1 2 3<br />
1 2 3<br />
1 2 3<br />
ISCED level<br />
ISCED level<br />
ISCED level<br />
ISCED level<br />
Notes: ISCED levels: 1=primary education, 2=lower secondary education, 3=upper secondary education. Hollow markers represent national values. Solid markers<br />
represent regional averages.<br />
Sources: Demographic and Health Surveys (DHS) and Multiple Indicator Cluster Surveys (MICS).<br />
it is not possible to calculate reliable repetition rates<br />
based on the household survey samples.<br />
Why do disparities between the different groups<br />
of children tend to weaken at higher levels of<br />
education? Analysis of household survey data from<br />
sub-Saharan Africa demonstrates that children with<br />
higher repetition rates – rural residents and those<br />
from poor households – also tend to have higher<br />
dropout rates. Pupils from disadvantaged groups are<br />
less likely to attend school, but those who persist<br />
and advance from primary to secondary education<br />
perform equally well as their peers, at least as far<br />
as repetition is concerned. Thus, the relatively few<br />
rural and poor children who manage to reach upper<br />
secondary education are no more likely to repeat<br />
grades than children from urban areas or wealthy<br />
households.<br />
31
SECTION<br />
3<br />
EARLY SCHOOL LEAVING: LOST OPPORTUNITIES,<br />
LOWER POTENTIAL<br />
WHAT’S IN THIS SECTION?<br />
This section begins by presenting a global<br />
perspective on early school leaving. It maps out<br />
the volume and incidence of early school leaving<br />
by region and how these figures have changed<br />
since 2000. It looks at when early school leaving<br />
occurs - at which ages and grades. Finally, the<br />
section profiles the main characteristics of children<br />
most likely to leave school early, underlining yet<br />
again the roles of poverty, remote locations and<br />
gender in intensifying risk and disadvantage.<br />
KEY FACTS<br />
••<br />
Sub-Saharan Africa has the highest dropout<br />
rate, at 42%, meaning that more than two in five<br />
children who started school in 2009 will probably<br />
not reach the last grade of primary education.<br />
••<br />
Across sub-Saharan Africa, about one in six<br />
pupils (17%) leave school before reaching<br />
Grade 2.<br />
••<br />
In South and West Asia, the dropout rate<br />
remains high at 33% compared to 35% in 1999.<br />
For every 100 children who start primary school,<br />
33 will leave before the last grade.<br />
••<br />
Latin America and the Caribbean has the thirdhighest<br />
regional dropout rate at 17%, which fell<br />
by 3 percentage points since 1999.<br />
••<br />
In the Arab States, the dropout rate has fallen<br />
from 18% to 13% between 1999 and 2009.<br />
••<br />
Pupils who are over-age for their grade – due<br />
to late entry or repetition – are at greater risk of<br />
leaving school early.<br />
••<br />
UIS data show that, on average, girls are less<br />
likely than boys to enter primary school, but<br />
boys face greater risks of repeating grades and<br />
leaving school early.<br />
••<br />
According to household survey data for 30<br />
countries, poor young men and women complete<br />
fewer years of education than their better-off<br />
peers. This disparity is all the more striking<br />
because it does not include the population that<br />
never went to school, which predominantly<br />
includes children from the poorest households.<br />
3.1 REACHED BUT THEN LOST BY THE<br />
EDUCATION SYSTEM<br />
The issue of early school leaving, especially in<br />
primary education, is important because it means<br />
that a child is “reached” but then “lost” by the<br />
education system. Very often, these children lack<br />
basic literacy and numeracy skills, which reduces<br />
their capabilities and life chances. There are strong<br />
rights-based and economic arguments supporting<br />
the introduction of policy measures to prevent<br />
and reduce early school leaving and to reintegrate<br />
those who have already left. From the individual’s<br />
perspective, education is considered a basic human<br />
right because it impacts on life chances in so<br />
many ways. Yet, the students from disadvantaged<br />
backgrounds who might benefit the most from this<br />
right are the most likely to lose it because of early<br />
leaving. At the level of societies and economies, the<br />
completion of primary (and secondary) education<br />
contributes to human capital, a key factor for<br />
economic growth. <strong>Education</strong>al inequality replicates<br />
marginalisation among disadvantaged populations,<br />
which can lead to greater social costs and less<br />
social cohesion. Moreover, in the current climate<br />
of financial austerity and reduced social sector<br />
budgets, it is essential to evaluate how efficiently<br />
schools deliver resources to students.<br />
In this section, the term ‘early school leaver’ (dropout)<br />
refers to a new entrant who will not reach the last<br />
grade of primary education. The key indicator used to<br />
capture trends in early school leaving is the dropout<br />
rate at the end of primary education (see Box 2).<br />
This section begins by presenting a global<br />
perspective on early school leaving. It maps out<br />
the volume and incidence of early school leaving<br />
32
OPPORTUNITIES LOST: THE IMPACT OF GRADE REPETITION AND EARLY SCHOOL LEAVING<br />
by region and how these figures have changed<br />
since 2000. It looks at when early school leaving<br />
occurs – at which ages and grades. Then it focuses<br />
on the situation at the national and regional levels,<br />
highlighting the countries that have the greatest<br />
problems and those that have made real progress in<br />
reducing dropout rates since 2000. Finally, using an<br />
equity perspective, the section looks at the profiles of<br />
children who leave school early.<br />
3.2 GLOBAL NUMBERS AND TRENDS<br />
IN EARLY SCHOOL LEAVING:<br />
RATES STAGNATING OR DROPPING<br />
EVERYWHERE EXCEPT SUB-SAHARAN<br />
AFRICA<br />
The scope of the early school leaving phenomenon<br />
is considerable – representing about 31 million<br />
newly marginalised children who were “reached” by<br />
school systems, but who left before reaching the<br />
last grade of primary education. These children are<br />
predominantly older than the intended age range<br />
for primary education – so they are often missed<br />
by indicators that focus on primary school-age<br />
populations.<br />
It should be noted, however, that while early<br />
school leaving is a major concern, getting enrolled<br />
in primary education is still a challenge for many<br />
children. For example, of the 31 million primary<br />
school-age children out of school in sub-Saharan<br />
Africa in 2010, more than one-half (55%) had never<br />
enrolled, suggesting that access to schooling is still<br />
a thorny problem in this region and others. Thus,<br />
when considering the children who are in school and<br />
leave early, it is important to remember that there is a<br />
substantial proportion of school-age children who still<br />
have no exposure to schooling at all.<br />
Table 1 highlights some major global patterns and<br />
trends regarding early school leaving in the past<br />
decade. In 2010, there were about 31.2 million early<br />
school leavers in the world and almost four out of five<br />
lived in South and West Asia (43%) and sub-Saharan<br />
Africa (36%). The next highest shares of the world’s<br />
early school leavers were found in East Asia and the<br />
Pacific (10%) and Latin America and the Caribbean<br />
(7%).<br />
How have patterns of early school leaving changed<br />
between 2000 and 2010? The increase in the<br />
BOX 2. What is the survival rate and how is it used to generate the dropout<br />
rate at the end of primary education?<br />
The survival rate to the last grade of primary education expresses how many students out of 100 who<br />
enter school are expected to reach the final grade of primary education. Survival rates are calculated<br />
according to the reconstructed cohort method, which uses data on enrolment by grade for the two<br />
most recent consecutive years (t and t+1) and repeaters by grade for the year (t+1) to reflect current<br />
patterns of grade transition. The dropout rate is simply the residual of the survival rate to the last<br />
grade of primary education (the difference between 100 and the survival rate). A survival rate of 95%<br />
indicates that 95 out of 100 children entering school are expected to remain in school for the full cycle,<br />
while 5 leave school before reaching the last grade. This is identical to a dropout rate of 5%.<br />
For example, in sub-Saharan Africa the dropout rate at the end of primary education was 42% in<br />
2009. This means that more than two in five new primary entrants are expected to leave school before<br />
reaching the last grade of primary education.<br />
In addition to survival and dropout rates, attainment measures can also be used to evaluate past<br />
patterns in primary school. Attainment measures reflect the percentage of a population cohort<br />
that has attended school but not completed a programme level (e.g. primary or lower secondary<br />
education). They are typically based on a population cohort that is beyond primary or lower<br />
secondary education (e.g. 17- to 22-year-olds, 20- to 24-year-olds). Attainment measures are the<br />
most accurate measure of early school leaving but are less timely than survival rates, which reflect<br />
current not past trends.<br />
33
SECTION 3 / Early school leaving: Lost opportunities, lower potential<br />
TABLE 1. How many children leave primary school before reaching the last grade?<br />
Number and share of children entering the 1 st grade who will leave school early by sex and region,<br />
2000 and 2010<br />
Absolute number<br />
Share<br />
of world<br />
total (%)<br />
Dropout rate to the last grade of primary<br />
education (%)<br />
2000 2010 2010 1999 to 2000 2009 to 2010<br />
REGION<br />
MF (000) %F MF (000) %F MF MF M F MF M F<br />
Arab States 1,126 47.6 1,004 49.7 3.2 17.6 17.4 17.8 12.9 12.5 13.4<br />
Central and Eastern Europe 224 44.5 189 38.5 0.6 4.3 4.6 4.0 4.5 5.3 3.5<br />
Central Asia 54 58.0 21 36.6 0.1 3.2 2.6 3.8 1.6 1.9 1.2<br />
East Asia and the Pacific 3,366 44.8 2,999 42.4 9.6 9.2 9.7 8.6 9.3 10.1 8.3<br />
Latin America and the<br />
Caribbean<br />
North America and<br />
Western Europe<br />
2,648 42.2 2,240 45.8 7.2 20.2 22.5 17.8 17.0 17.8 16.1<br />
122 ** 43.5 ** … … … 1.3** 1.5 ** 1.2 ** … … …<br />
South and West Asia 14,406 44.9 13,539 47.5 43.4 35.0 34.2 35.9 33.3 33.2 33.4<br />
Sub-Saharan Africa 7,008 46.7 11,066 47.7 35.5 40.3 40.1 40.5 42.1 42.1 42.1<br />
WORLD 28,955 45.2 31,207 46.9 100.0 22.1 22.6 21.6 23.2 23.5 22.8<br />
Note:<br />
The dropout rate to the last grade of primary education is defined as 100% minus the survival rate to the last grade of primary education.<br />
Source: UNESCO Institute for Statistics database.<br />
absolute number of early school leavers occurred<br />
almost entirely in one region: sub-Saharan Africa,<br />
with its share of the world’s early leavers jumping<br />
from 24% to 36%. But headcounts provide only part<br />
of the story; the dropout rate (see Box 2) provides<br />
a clearer indication of incidence among changing<br />
regional populations.<br />
Sub-Saharan Africa had the highest dropout rate,<br />
which increased from 40% to 42%, meaning that<br />
more than two in five children who started school<br />
in 2009 would not reach the last grade of primary<br />
education. In South and West Asia, the dropout<br />
rate remained high at 35% in 1999 and 33% in<br />
2009 – meaning that for every 100 children who<br />
start primary school, 33 will leave before the last<br />
grade. Latin America and the Caribbean had the<br />
next highest dropout rate (17%), which fell by<br />
3 percentage points since 1999. In Central and<br />
Eastern Europe and in East Asia and the Pacific,<br />
the dropout rate remained almost unchanged at<br />
4% and 9% respectively between 1999 and 2009.<br />
In the remaining regions, the dropout rate has<br />
fallen over the past decade, especially in the Arab<br />
States (from 18% to 13%).<br />
At the regional level, there was little difference<br />
between girls and boys leaving primary school early.<br />
The dropout rate for girls was slightly lower than that<br />
for boys in every region except the Arab States and<br />
South and West Asia in 2009. There, the rate among<br />
girls was slightly higher than for boys. However,<br />
larger differences can be found at national and subnational<br />
levels, where children at risk are often hidden<br />
in the data.<br />
While beyond the scope of this section, the problem<br />
of early school leaving is also found at higher levels<br />
of education, especially in more developed countries<br />
where upper secondary education is usually<br />
considered to be compulsory (see Box 3).<br />
3.3 EARLY SCHOOL LEAVING BY REGION<br />
How have regional and national patterns of early<br />
school leaving changed over the past decade? This<br />
discussion will focus on the three regions with the<br />
greatest incidence of early school leaving: sub-<br />
Saharan Africa, South and West Asia, and Latin<br />
America and the Caribbean.<br />
34
OpportuNITIES lost: The impaCT of grade repETITION and early schOOL leavINg<br />
Box 3. Early school leaving in the European Union<br />
European Union (EU) member states have made slow progress towards achieving the European target<br />
to reduce early secondary school leaving rates to below 10% by 2020. The highest dropout rates are<br />
found in Malta (37%), Portugal (30%) and Spain (29%), and the lowest rates in Slovakia (4%), the Czech<br />
Republic (5%) and Slovenia (5%). From 2009 to 2010, there was minimal improvement of 0.3%, with<br />
the average school dropout rate at 14%.<br />
The 2020 target is considered to be a rising priority given the fact that 53% of early school leavers<br />
were unemployed in 2010. EU member states are seeking to adopt targeted measures to reach young<br />
people at risk of leaving school early. These measures often involve the provision of high-quality<br />
technical and vocational education and training intended to meet the needs of young people and<br />
employers. Lifelong learning strategies are also acknowledged as an effective tool to facilitate access<br />
to the labour market among young unemployed and low-skilled adults.<br />
The EU defines early school leavers as people aged 18 to 24 years who have only lower secondary<br />
education or less and are no longer in education or training. Early school leavers are, therefore, those<br />
who have only achieved pre-primary, primary, lower secondary or a short upper secondary education<br />
of less than two years.<br />
Source: Council of the European Union and the European Commission (<strong>2012</strong>). “<strong>Education</strong> and training in a smart sustainable<br />
and inclusive Europe”. Official Journal of the European Union, C70, pp. 9-18.<br />
Early leavers from primary education on<br />
the rise in sub-Saharan Africa, partly due to<br />
population increases<br />
primary school were expected to leave before reaching<br />
the last grade. In contrast, the lowest dropout rates<br />
were in Mauritius (2%) and Botswana (7%) in 2009.<br />
Countries in sub-Saharan Africa have widened<br />
access to primary schooling in the past decade.<br />
In 2010, the number of children enrolled in primary<br />
education was 46 million higher than in 2000.<br />
However, this occurred in the context of strong<br />
population growth. In 2010, there were 27 million<br />
more primary school-age children than in 2000. So,<br />
while countries in the region have made great efforts<br />
to bring more children into primary school, they are<br />
still faced with the double task of providing schooling<br />
to a growing school-age population, while addressing<br />
the specific needs of children who have been<br />
excluded from the education system.<br />
Sub-Saharan Africa has the highest dropout rates<br />
of any region in the world. Most early school leaving<br />
occurs between the 1 st and 2 nd grades. Across the<br />
region, about one in six pupils (17%) leave school<br />
before reaching Grade 2.<br />
At the national level (see Figure 15), the highest<br />
dropout rates in 2009 were found in Chad (72%),<br />
Uganda (68%) and Angola (68%). These rates suggest<br />
that in 2009 more than two in three children entering<br />
In general, most of the countries that reduced their<br />
dropout rates were already starting from relatively low<br />
levels. Among those with higher rates, however, there<br />
was still upward movement – meaning that a higher<br />
proportion of children were leaving school early in<br />
the region. The largest increases in the dropout rate<br />
between 1999 and 2009 were found in Chad, Eritrea,<br />
Madagascar and Zambia, which contributed to the<br />
increase in the regional numbers.<br />
In Malawi and Togo, the dropout rates fell from<br />
64% to 47% and from 54% to 41% respectively.<br />
However, it is important to consider the context of<br />
these changes. In 1994, Malawi abolished primary<br />
school fees, which led to a dramatic expansion of<br />
educational opportunity. At the same time, these<br />
rapid changes appear to have had a negative impact<br />
on the quality of education, which led many children<br />
to leave school early. While the recent reduction in<br />
the dropout rate is a positive sign, the repetition rate<br />
has increased (from 16% to 20% between 1999<br />
and 2009) in Malawi, suggesting that children may<br />
be repeating grades rather than leaving school.<br />
Countries in southern Africa, like Botswana, South<br />
35
SECTION 3 / Early school leaving: Lost opportunities, lower potential<br />
Africa and Swaziland, significantly reduced the<br />
dropout rate during this period.<br />
Dropout rates stay high in South and West Asia<br />
despite demographic dividend<br />
In 2010, there were an estimated 13.3 million primary<br />
school-age children out of school in the South and<br />
West Asia region. Of this number, the biggest group<br />
comprised children who are not expected to ever<br />
enter school (49%).<br />
There is a growing potential for a demographic<br />
dividend in the region as school-age populations<br />
increased by only 1.8 million over the last decade,<br />
meaning that, in principle, education systems can<br />
focus on reaching the excluded and improving the<br />
quality of education provision. In fact, enrolment<br />
skyrocketed by 31 million between 2000 and 2010,<br />
which helped to drive regional and global progress<br />
towards the goal of universal primary education.<br />
Dropout rates are particularly high in South and West<br />
Asia, with four in seven countries reporting data with<br />
rates between 33% to 40% (see Figure 16). Rates<br />
were more moderate in the Islamic Republic of Iran<br />
(6%), Sri Lanka (7%) and Bhutan (9%). Over the last<br />
decade, dropout rates varied across countries. The<br />
most significant changes were in Pakistan, where<br />
the dropout rate increased from 30% to 38%, and in<br />
Bhutan, where it fell from 18% to 9% from 1999 to<br />
2009. Other countries with high dropout rates (e.g.<br />
India and Nepal) saw little movement in their values<br />
over the same period.<br />
Fewer children leaving school in Latin America<br />
and the Caribbean<br />
In 2010, there were an estimated 2.7 million primary<br />
school-age children out of school in the Latin<br />
America and Caribbean region. Of this number, 38%<br />
are not expected to ever enter school. The region<br />
has seen almost no change in the primary school-<br />
FIGURE 15<br />
How has early school leaving changed in sub-Saharan Africa?<br />
Dropout rates to last grade of primary education, 1999, 2004 and 2009<br />
Dropout rate to last grade of primary education (%)<br />
80<br />
70<br />
60<br />
50<br />
40<br />
30<br />
20<br />
10<br />
0<br />
1999 2004 2009 2009 (decrease since 1999) 2009 (increase since 1999)<br />
Chad<br />
Uganda<br />
Angola<br />
Madagascar<br />
Rwanda<br />
Liberia<br />
Mozambique<br />
C. African Rep.<br />
Ethiopia<br />
Malawi<br />
Zambia<br />
DR Congo<br />
Burundi<br />
Togo<br />
Senegal<br />
Côte d'Ivoire<br />
Equatorial Guinea<br />
Gambia<br />
Burkina Faso<br />
Benin<br />
Guinea<br />
Cameroon<br />
Sao Tome/Principe<br />
Eritrea<br />
Lesotho<br />
Niger<br />
Congo<br />
Ghana<br />
Kenya<br />
Comoros<br />
Mali<br />
South Africa<br />
Nigeria<br />
Tanzania<br />
Namibia<br />
Swaziland<br />
Seychelles<br />
Cape Verde<br />
Botswana<br />
Mauritius<br />
Notes: The dropout rate to the last grade of primary education is defined as 100% minus the survival rate to the last grade of primary education. Countries are<br />
ranked by the values of their dropout rates to the last grade of primary education in 2009 or most recent year available. Countries presented are those with<br />
data available. The symbol is used when data for 1999 are not available or when data for 1999 and 2009 have the same value.<br />
Source: UNESCO Institute for Statistics database.<br />
36
OPPORTUNITIES LOST: THE IMPACT OF GRADE REPETITION AND EARLY SCHOOL LEAVING<br />
FIGURE 16<br />
Dropout rate to last grade of primary education (%)<br />
45<br />
40<br />
35<br />
30<br />
25<br />
20<br />
15<br />
10<br />
5<br />
0<br />
age population over the last decade, although the<br />
number of enrolments has declined between 2000<br />
and 2010.<br />
2009 (decrease since 1999) 2009 (increase since 1999)<br />
Pakistan<br />
Nepal<br />
India<br />
Early school leaving is a major concern in a small<br />
number of countries in the region (see Figure 17).<br />
The countries with the highest dropout rates in<br />
2009 included: Nicaragua (52%), Guatemala<br />
(35%), Saint Kitts and Nevis (26%) and Honduras<br />
(24%). In contrast, Argentina, Cuba, Jamaica,<br />
Mexico and Uruguay had the lowest dropout rates<br />
in the region, at about 5%.<br />
How has early school leaving<br />
changed in South and West Asia?<br />
Dropout rates to the last grade of<br />
primary education, 1999, 2004<br />
and 2009<br />
1999 2004 2009<br />
Notes: The dropout rate to the last grade of primary education is defined as<br />
100% minus the survival rate to the last grade of primary education.<br />
Countries are ranked by the values of their dropout rates to the last<br />
grade of primary education in 2009 or most recent year available.<br />
Countries presented are those with data available. The symbol is<br />
used when data for 1999 are not available or when data for 1999 and<br />
2009 have the same value.<br />
Generally, across the region there has been<br />
improvement in reducing early school leaving at the<br />
primary level. Dropout rates have diminished over<br />
Bangladesh<br />
Source: UNESCO Institute for Statistics database.<br />
Bhutan<br />
Sri Lanka<br />
Iran<br />
the decade for practically every country reporting<br />
data. The countries making the greatest progress<br />
in reducing dropout rates include: Belize and<br />
Guatemala in the early 2000s, Honduras and El<br />
Salvador after 2004, and Guyana throughout the<br />
entire decade.<br />
Other regions reflect wide variation in dropout<br />
rates<br />
In the Arab States, the number of school-age<br />
children increased from 39 to 43 million between<br />
1999 and 2009. This is the only other region than<br />
sub-Saharan Africa where school-age cohorts<br />
continue to grow steadily. In 2010, there were an<br />
estimated 5 million primary school-age children out<br />
of school in the Arab States. Almost one-half (49%)<br />
are not expected to ever enter school. The dropout<br />
rate for the region was 13% in 2009. Unlike other<br />
regions where early school leaving takes place in the<br />
initial grades, the overall survival rate to the last grade<br />
is high in the Arab States, and most school leaving<br />
occurs between Grades 4 and 5. The countries with<br />
the highest dropout rates in 2009 included Djibouti<br />
(36%) and Mauritania (29%). In contrast, Morocco<br />
made the greatest progress in reducing the dropout<br />
rate from 25% to 9% since 1999.<br />
In East Asia and the Pacific, 47% of the region’s<br />
estimated 6.6 million out-of-school children of<br />
primary school age left school early. Another 38%<br />
are expected to start school late, and 15% are<br />
not expected to ever enrol. The dropout rate for<br />
the region was 9% in 2009. The countries with<br />
the highest dropout rates (33% to 46%) were<br />
Cambodia, Lao People’s Democratic Republic and<br />
Timor-Leste.<br />
3.4 WHEN DO CHILDREN LEAVE SCHOOL?<br />
It is difficult to determine exactly when children leave<br />
school, but it is possible to identify the grade and<br />
age at which this occurs based on administrative and<br />
household survey data. However, it is important to<br />
understand that many countries do not have recent<br />
data available.<br />
37
SECTION 3 / Early school leaving: Lost opportunities, lower potential<br />
FIGURE 17<br />
How has early school leaving changed in Latin America and the Caribbean?<br />
Dropout rates to the last grade of primary education, 1999, 2004 and 2009<br />
1999 2004 2009<br />
2009 (decrease since 1999) 2009 (increase since 1999)<br />
55<br />
50<br />
45<br />
40<br />
35<br />
30<br />
25<br />
20<br />
15<br />
10<br />
5<br />
0<br />
Nicaragua<br />
Guatemala<br />
Dominican Rep.<br />
St Kitts/Nevis<br />
Brazil<br />
Ecuador<br />
Dropout rate to last grade of primary education (%)<br />
Honduras<br />
Paraguay<br />
Nl Antilles<br />
Guyana<br />
Bolivia<br />
Colombia<br />
El Salvador<br />
Dominica<br />
Costa Rica<br />
Bermuda<br />
Trinidad/Tobago<br />
Bahamas<br />
Belize<br />
Suriname<br />
Peru<br />
Aruba<br />
Venezuela<br />
Saint Lucia<br />
Panama<br />
Argentina<br />
Mexico<br />
Cuba<br />
Uruguay<br />
Jamaica<br />
Barbados<br />
Chile<br />
Notes: The dropout rate to the last grade of primary education is defined as 100% minus the survival rate to the last grade of primary education. Countries are<br />
ranked by the values of their dropout rates to last grade of primary education in 2009 or most recent year available. Countries presented are those with data<br />
available. The symbol is used when data for 1999 are not available or when data for 1999 and 2009 have the same value.<br />
Source: UNESCO Institute for Statistics database.<br />
The grade at which children leave school has<br />
important implications, both in terms of children’s<br />
learning (fewer grades of schooling means, in<br />
principle, less learning) and in terms of the capacity<br />
of the education system and the investment made in<br />
each child.<br />
Figure 18 presents school survival rates by grade<br />
for selected countries, which helps to identify key<br />
points for policy intervention. The data illustrate the<br />
wide variation in patterns of a successful primary<br />
education cycle, ranging from nearly all pupils<br />
progressing from the first to the last grade of primary<br />
school in Brunei Darussalam, Mauritius or Tunisia to<br />
only one in three pupils completing primary schooling<br />
in Chad. It also shows three distinct patterns of early<br />
school leaving by grade.<br />
The first pattern is represented by a sharp increase in<br />
the proportion of pupils who leave school during or<br />
at completion of Grade 1. This pattern is particularly<br />
prominent in countries with low overall survival rates;<br />
for example, in Chad, where the survival rate drops<br />
from 100 pupils in Grade 1 to 74 pupils in Grade 2.<br />
The rate continues to decline through subsequent<br />
grades and by the last grade of lower secondary<br />
education, only 13 out of 100 children who started<br />
the 1 st grade of primary education remain in school.<br />
This is the lowest rate for any country in the world.<br />
The transition between primary and lower secondary<br />
education is not an issue – practically every child<br />
who makes it through primary education enters the<br />
secondary level. Yet from Grade 1 to Grade 6, the<br />
number of pupils drops from 100 to 28.<br />
The second pattern shows high rates of school<br />
leaving in the transition from primary to lower<br />
secondary education, as found in Mauritius and<br />
Myanmar. In Mauritius, almost all children complete<br />
the full six grades of primary education, but about<br />
one in seven do not continue onto lower secondary<br />
education. This is despite the fact that lower<br />
38
OPPORTUNITIES LOST: THE IMPACT OF GRADE REPETITION AND EARLY SCHOOL LEAVING<br />
FIGURE 18<br />
At which grade do children leave school?<br />
School survival rates by grade in selected countries, 2009 or most recent year available<br />
Primary education<br />
Lower secondary education (general programmes)<br />
100<br />
93<br />
Brunei<br />
80<br />
82<br />
Mauritius<br />
Survival rate (%)<br />
60<br />
40<br />
61<br />
58<br />
Tunisia<br />
Paraguay<br />
40<br />
Myanmar<br />
28<br />
Cambodia<br />
20<br />
18<br />
Niger<br />
Chad<br />
13<br />
0<br />
1 2 3 4 5 6 7 8 9 10<br />
Grade<br />
Source: UNESCO Institute for Statistics database.<br />
secondary (and even upper secondary) education is<br />
compulsory in Mauritius. In Paraguay, 78% of pupils<br />
progress to the last grade of primary education, but<br />
the proportions drop to 70% and 58% at the first and<br />
last grades, respectively, of the lower secondary level.<br />
The third pattern is representative of many middleand<br />
high-income countries, where only a very<br />
small proportion of children leave primary and<br />
lower secondary school. The example of Brunei<br />
Darussalam is presented here, where the survival rate<br />
by grade remains above 93% through the last grade<br />
of lower secondary education.<br />
Over-age children are more likely to leave<br />
school early<br />
As shown in Section 1, in many countries large<br />
proportions of children in primary education are over<br />
age, sometimes many years older than the intended<br />
primary school age. Pupils who are over age for their<br />
grade – due to late entry or repetition – have been<br />
shown to be at greater risk of leaving school early<br />
(UIS, 2005).<br />
Figure 19 presents household survey data on<br />
the age of children who left primary school before<br />
completion. In most countries in the sample, the<br />
majority of children who left school early were older<br />
than the intended completion age for primary school.<br />
In the post-conflict country of Liberia, four in five early<br />
school leavers are at least three years older than the<br />
intended completion age for primary school. This is<br />
the case for three in five early school leavers who are<br />
over age by at least three years in Cambodia and<br />
Uganda. The situation is slightly better in Bangladesh,<br />
Ghana and Swaziland, yet even here, one in five early<br />
school leavers is three or more years over age.<br />
The proportion of children three or more years older<br />
than the intended age ranged from one in five early<br />
school leavers in Bangladesh, Ghana and Swaziland<br />
39
SECTION 3 / Early school leaving: Lost opportunities, lower potential<br />
to more than three in five early school leavers in<br />
Cambodia and Uganda, and four in five early school<br />
leavers in the post-conflict country of Liberia. In 4 of<br />
the 16 countries presented in the figure, the majority<br />
of children left school when they were already three<br />
or more years older than the expected completion<br />
age for primary education.<br />
The high proportion of over-age early school leavers<br />
emphasises the importance of children starting<br />
school at the intended age and moving through<br />
the system in a timely manner. Indicators that<br />
track children by age are needed to monitor these<br />
aspects of education systems, though the accuracy<br />
of age data is often questionable. Therefore, greater<br />
efforts are needed to improve birth registration and<br />
record-keeping.<br />
3.5 THE PROFILE OF EARLY SCHOOL<br />
LEAVERS<br />
Which children are more likely to leave school<br />
early?<br />
The profile of children who leave school early is<br />
similar to that of children who repeat a grade in<br />
several important ways. Rural areas are linked to<br />
both higher rates of repetition and early school<br />
leaving (Hunt, 2008). Children who travel long<br />
distances to school are also more likely to leave<br />
school early, which often occurs in remote rural areas<br />
(Hunt, 2008; Sabates et al., 2010). Hunt (2008) finds<br />
that there may also be inter-urban disparities in the<br />
prevalence of early school leaving, particularly in<br />
cities with large slums, such as the capital cities in<br />
Burkina Faso and Kenya.<br />
Household poverty is also an important characteristic<br />
related to a higher likelihood of repetition and early<br />
school leaving (Hunt, 2008; Hammond et al., 2007;<br />
Sabates et al., 2010). Children who must combine<br />
work with study are more likely to repeat and leave<br />
school early (UCW, 2010). Other related household<br />
factors include a low level of education of the mother<br />
and living in a conflict-affected region (Hunt, 2008;<br />
Sabates et al., 2010; UIS, 2011).<br />
However, there are also important differences<br />
between the profiles of the typical early school<br />
leaver and the typical repeater. UIS data show<br />
that, on average, girls are less likely than boys to<br />
enter primary school, but boys face greater risks of<br />
repeating grades and leaving school early.<br />
Age is another important difference. Compared to<br />
children who attend the appropriate grade for their<br />
age, under-age pupils are more likely to repeat<br />
grades while over-age pupils tend to leave school<br />
early (EPDC, 2008). In general, repetition affects<br />
younger children more frequently. As discussed in<br />
Section 2, UIS data show that in many countries the<br />
repetition rate is high in primary education, especially<br />
during the early grades. However, early school<br />
leaving is more likely to occur among older children,<br />
at an age when the opportunity cost of participation<br />
in school rises.<br />
Six case studies of early school leavers: How<br />
do countries compare?<br />
Children who have left school or have never enrolled<br />
are not captured by school-based data collections.<br />
Household survey data cover children in and out of<br />
school and, therefore, represent an important source<br />
of information on early school leavers and their<br />
characteristics.<br />
Using household survey data, Figure 20 presents the<br />
educational attainment profile of young people aged<br />
17 to 22 years in six countries: Bolivia, Cambodia,<br />
Egypt, Kenya, Niger and Pakistan. The figure<br />
shows young people who entered and left school,<br />
categorised by the level of educational exposure:<br />
those who left before completing primary education;<br />
those who completed primary but did not transition<br />
to lower secondary education; those who left<br />
secondary education early; and finally those who left<br />
school after completing secondary or some tertiary<br />
education.<br />
In general, young people from poor and rural<br />
households are more likely to leave school before<br />
completing primary education than their peers from<br />
40
OPPORTUNITIES LOST: THE IMPACT OF GRADE REPETITION AND EARLY SCHOOL LEAVING<br />
FIGURE 19<br />
How old are children who leave primary school early?<br />
Distribution of children leaving primary school without completing, by age range in selected<br />
countries, 2006-2011<br />
Primary school age 1−2 years older 3 or more years older<br />
100<br />
21<br />
18<br />
20<br />
Percentage of early primary school leavers<br />
80<br />
60<br />
40<br />
20<br />
80<br />
8<br />
65<br />
23<br />
63<br />
15<br />
22<br />
52<br />
18<br />
30<br />
47<br />
21<br />
32<br />
37<br />
30<br />
33<br />
48<br />
18<br />
34<br />
32<br />
34<br />
34<br />
35<br />
28<br />
38<br />
31<br />
28<br />
41<br />
36<br />
20<br />
43<br />
33<br />
47<br />
36<br />
17<br />
47<br />
30<br />
20<br />
51<br />
23<br />
59<br />
17<br />
63<br />
12<br />
12<br />
0<br />
Liberia<br />
Cambodia<br />
Uganda<br />
Malawi<br />
Mauritania<br />
Philippines<br />
Mozambique<br />
Bolivia<br />
Mali<br />
India<br />
Zambia<br />
Bangladesh<br />
Dominican Rep.<br />
Côte d’Ivoire<br />
Ghana<br />
Swaziland<br />
Notes: The figure concerns pupils who were in primary school in the previous year, are not in school in the current year (when the household survey was<br />
conducted), and for which the highest grade completed was less than the last grade of primary education. This last condition excludes anyone who left<br />
school after completing primary education. The age of persons in the sample may range from 5 to 24 years, depending on the age range of available school<br />
attendance data in the household survey.<br />
Sources: Demographic and Health Surveys (DHS) and Multiple Indicator Cluster Surveys (MICS).<br />
wealthier households in urban areas. This is clearly<br />
seen in the cases of Bolivia and Cambodia. In Niger,<br />
very few children (less than 20%) from poor and rural<br />
households ever attend school.<br />
If pupils enter and complete primary education on<br />
time, their educational attainment can reach upper<br />
secondary or higher education (depending on the<br />
national education system) when they reach the<br />
ages of 17 to 22 years. In Bolivia, Egypt and Kenya,<br />
more than one-half of young people have achieved<br />
this: either they are still in school and attending<br />
secondary or higher education, or have left school<br />
after completing at least secondary education.<br />
By contrast, most of the 17- to 22-year-olds in<br />
Cambodia, Niger and Pakistan fall short of this level<br />
of educational attainment.<br />
Strikingly, across these six countries, young men have<br />
higher attainment rates than women. There are large<br />
disparities in attainment rates between urban and<br />
rural areas, and between poor and rich households.<br />
Young people from urban and rich households<br />
are much more likely to still be in school than their<br />
counterparts from rural and poor households. The<br />
pattern changes slightly in Kenya, where data show<br />
that relatively large proportions of rural and poor youth<br />
between the ages of 17 and 22 are still in secondary<br />
school but far beyond the intended age range – which<br />
increases the likelihood of dropout.<br />
How do the countries and sub-groups compare with<br />
respect to young people who never entered school?<br />
The proportion which has never attended school<br />
ranges from 73% in Niger and 31% in Pakistan to<br />
10% and 6% in Egypt and Cambodia, respectively.<br />
41
SECTION 3 / Early school leaving: Lost opportunities, lower potential<br />
FIGURE 20<br />
What share of youth completed primary and secondary education and what share left<br />
school early?<br />
<strong>Education</strong>al attainment of 17- to 22-year-olds by sex, location and household wealth quintile in<br />
selected countries, 2006-2011<br />
In school<br />
Left school<br />
In primary<br />
In secondary In tertiary Incomplete primary Complete primary Incomplete secondary Complete secondary<br />
or some tertiary<br />
No education<br />
Bolivia<br />
Cambodia<br />
Both sexes<br />
Male<br />
Female<br />
Male urban<br />
Female urban<br />
Male rural<br />
Female rural<br />
Male richest<br />
Female richest<br />
Male poorest<br />
Female poorest<br />
Both sexes<br />
Male<br />
Female<br />
Male urban<br />
Female urban<br />
Male rural<br />
Female rural<br />
Male richest<br />
Female richest<br />
Male poorest<br />
Female poorest<br />
0 20 40 60 80 100<br />
0 20 40 60 80 100<br />
Egypt<br />
Kenya<br />
Both sexes<br />
Male<br />
Female<br />
Male urban<br />
Female urban<br />
Male rural<br />
Female rural<br />
Male richest<br />
Female richest<br />
Male poorest<br />
Female poorest<br />
Both sexes<br />
Male<br />
Female<br />
Male urban<br />
Female urban<br />
Male rural<br />
Female rural<br />
Male richest<br />
Female richest<br />
Male poorest<br />
Female poorest<br />
0 20 40 60 80 100<br />
0 20 40 60 80 100<br />
Niger<br />
Pakistan<br />
Both sexes<br />
Male<br />
Female<br />
Male urban<br />
Female urban<br />
Male rural<br />
Female rural<br />
Male richest<br />
Female richest<br />
Male poorest<br />
Female poorest<br />
Both sexes<br />
Male<br />
Female<br />
Male urban<br />
Female urban<br />
Male rural<br />
Female rural<br />
Male richest<br />
Female richest<br />
Male poorest<br />
Female poorest<br />
0 20 40 60 80 100<br />
0 20 40 60 80 100<br />
<strong>Education</strong>al attainment of the 17- to 22-year-old population (%)<br />
Sources: Demographic and Health Surveys (DHS) and Multiple Indicator Cluster Surveys (MICS).<br />
42
OPPORTUNITIES LOST: THE IMPACT OF GRADE REPETITION AND EARLY SCHOOL LEAVING<br />
FIGURE 21<br />
How do household poverty and gender relate to the number of years of education<br />
students complete before leaving school?<br />
<strong>Education</strong>al attainment of 17- to 22-year-olds who have left school by household wealth quintile<br />
and sex in selected countries, 2005-2010<br />
Poorest girls Poorest boys Total Richest boys Richest girls<br />
Duration of primary education<br />
Duration of lower secondary education<br />
Countries where the average 17- to 22-year-old<br />
who left school did not complete primary<br />
Rwanda<br />
Madagascar<br />
Countries where the average 17- to 22-year-old<br />
who left school completed primary<br />
Senegal<br />
Niger<br />
C. African Rep.<br />
Haiti<br />
Guinea<br />
Ethiopia<br />
Benin<br />
Côte d’Ivoire<br />
Liberia<br />
Mali<br />
Mauritania<br />
Sao Tome/Principe<br />
Burkina Faso<br />
Uganda<br />
Nepal<br />
DR Congo<br />
Togo<br />
Congo<br />
Malawi<br />
Cambodia<br />
Cameroon<br />
Sierra Leone<br />
Bangladesh<br />
Tanzania<br />
Lesotho<br />
India<br />
Zambia<br />
Pakistan<br />
0 1 2 3 4 5 6 7 8 9 10 11 12<br />
Average number of grades completed<br />
0 1 2 3 4 5 6 7 8 9 10 11 12<br />
Average number of grades completed<br />
Notes: This figure only includes the population that went to school and has left school. Therefore, the total average does not include the attainment of 17- to<br />
22-year-olds who are still in school, nor the population who never went to school.<br />
Sources: Demographic and Health Surveys (DHS) and Multiple Indicator Cluster Surveys (MICS).<br />
The highest shares of exclusion from education are<br />
found in the poorest segments of the population.<br />
In Cambodia, Egypt, Kenya, Niger and Pakistan, a<br />
higher proportion of poor women have no education<br />
compared to poor men: in Niger and Pakistan, more<br />
than eight out of ten poor young women aged 17 to<br />
22 years have never entered school.<br />
How far do young people progress in their<br />
studies before leaving school?<br />
Once a child enters the classroom, how many years<br />
of education does he or she complete before leaving<br />
school? Figure 21 explores the link between poverty,<br />
household location and educational attainment<br />
among the population of 17- to 22-year-olds who<br />
43
SECTION 3 / Early school leaving: Lost opportunities, lower potential<br />
are no longer in school. In all 30 countries shown,<br />
young men and women from poor households<br />
have completed fewer years of education than<br />
their better-off peers. This disparity is all the more<br />
striking because it does not include the population<br />
that never went to school, which predominantly<br />
includes children from the poorest households. As<br />
this analysis focuses on the population which has<br />
attended school, young people with no education<br />
are excluded from the calculation of mean years of<br />
schooling.<br />
By contrasting educational attainment with the<br />
intended duration of primary and lower secondary<br />
education in each country, it is possible to see<br />
whether, on average, pupils complete primary or<br />
secondary education or leave school early. In 25<br />
of the 30 countries shown, the average pupil from<br />
a poor household has left primary school before<br />
completion.<br />
The difference in attainment between poor young<br />
women and men is quite small in most countries.<br />
However, gender disparities against women are<br />
apparent in Cameroon and Uganda, where poor<br />
women complete about one year of education less<br />
than poor men. In contrast, the opposite is seen in<br />
Lesotho and Sierra Leone.<br />
These data help to put in stark contrast the<br />
inequalities in educational attainment between<br />
rich and poor students. With the exceptions of<br />
Niger, Rwanda and Senegal, the average rich pupil<br />
completes at least primary education before leaving<br />
school. The attainment gap between rich and poor<br />
youth ranges from about one year in Rwanda to<br />
nearly five years in Ethiopia and Zambia.<br />
44
SECTION<br />
4<br />
MONITORING EDUCATION QUALITY: PUTTING<br />
THE SPOTLIGHT ON LOW LEVELS OF LEARNING 10<br />
WHAT’S IN THIS SECTION?<br />
Are students with low literacy skills more<br />
likely to repeat grades and leave school early?<br />
This section presents the results of several<br />
international assessments of reading skills among<br />
primary school pupils in countries at different<br />
stages of development. The discussion focuses<br />
specifically on reading, which is a crucial aspect<br />
of learning objectives at the primary level.<br />
KEY FACTS<br />
••<br />
Between 2008 and <strong>2012</strong>, large-scale reading<br />
assessments were conducted in 26 countries<br />
among national samples of pupils in Grades 2<br />
to 4. One-half of the children tested could not<br />
read a single word.<br />
••<br />
The most recent results from the SACMEQ<br />
(2007) assessment conducted in 14 sub-<br />
Saharan African countries show that in about<br />
one-half of countries pupils at the end of<br />
primary school had low performance levels in<br />
reading. In Malawi and Zambia, almost three<br />
in four tested pupils were unable to meet<br />
minimum requirements for reading.<br />
••<br />
In Francophone African countries, results from<br />
the most recent PASEC (2009) study show that<br />
more than one-half of pupils had the lowest<br />
performance levels in the French language.<br />
••<br />
In Latin America, results from the second<br />
learning achievement study undertaken by the<br />
LLECE (2006) show that at least one-third of<br />
tested pupils did not achieve minimum reading<br />
skills in one in four participating countries.<br />
••<br />
Results from international learning<br />
assessments like LLECE, PASEC and SACMEQ<br />
show that low student performance is found<br />
in education systems that practice grade<br />
repetition as well as those that practice<br />
automatic promotion.<br />
••<br />
A range of data sources show that children<br />
with the least opportunities – arising from<br />
poverty and compounding disadvantages – are<br />
most likely to repeat grades and leave school<br />
early without being able to read a basic text.<br />
Ultimately, the goal is not just to have children progress<br />
through and complete school, but to ensure “meaningful<br />
access” to good quality education (Lewin et al., 2011).<br />
This has led to a greater policy focus on outcomes such<br />
as the knowledge, attitudes and skills that students<br />
have acquired or develop as a result of their exposure to<br />
schooling (Kellaghan and Greaney, 2001). 10<br />
The discussions in this section are based primarily<br />
on data from cross-national assessments of student<br />
achievement, which are often conducted on a regional<br />
basis, as in the case of PASEC, SACMEQ and LLECE<br />
assessments. 11<br />
While cross-national comparisons of student<br />
achievement can provide important perspectives for<br />
analysis, they are also limited by the wide variation in<br />
contexts at the school level, such as late entry and<br />
the age of students, prevalence of grade repetition,<br />
and early school leaving. Context is also relevant in<br />
studies that include countries at different stages of<br />
development. In some developing countries, large<br />
proportions of students have dropped out well<br />
before the end of primary schooling. Nonetheless,<br />
assessment data show low levels of learning for those<br />
who remain in school.<br />
4.1 LOW READING PERFORMANCE IN EARLY<br />
GRADES OF PRIMARY EDUCATION<br />
Since 2008, a growing number of developing<br />
countries are assessing the reading skills of pupils<br />
in the early grades of primary school. This early<br />
10 It is important to note that the data presented in this section are not included<br />
in the statistical tables of the <strong>Digest</strong>.<br />
11 The Programme d’analyse des systèmes éducatifs des États et<br />
gouvernements membres de la CONFEMEN (PASEC); the Southern and<br />
Eastern Africa Consortium for Monitoring <strong>Education</strong>al Quality (SACMEQ);<br />
and the Laboratorio Latinoamericano de Evaluación de la Calidad de la<br />
Educación (LLECE).<br />
45
SECTION 4 / Monitoring education quality: Putting the spotlight on low levels of learning<br />
measurement is critical because it allows for<br />
timely intervention to ensure that all children<br />
learn to read. Pupils who are not able to read<br />
do not have the prerequisite skills for successful<br />
learning in later grades. In general, early grade<br />
reading assessments (EGRA) are used as a<br />
diagnostic tool for assessing pupils’ basic skills<br />
in reading (e.g. letter naming, familiar word<br />
reading, connected text passage reading and<br />
comprehension) and are administered in the 2 nd or<br />
3 rd grades of primary school.<br />
Between 2008 and <strong>2012</strong>, large-scale early grade<br />
reading assessments were conducted in several<br />
countries and in diverse languages. It is difficult<br />
to compare results across countries because<br />
of significant differences in how individual pupil<br />
achievements are scored and also because of<br />
TABLE 2. Are 2 nd to 4 th grade pupils learning to read?<br />
Percentage of children who were not able to decode a single word in selected countries, 2008-<strong>2012</strong><br />
COUNTRY % pupils Language Year Source<br />
GRADE 2<br />
Egypt (USAID/Girls Improved Learning Outcome(GILO)-supported schools) 48 Arabic 2009 RTI<br />
Ethiopia 22 Amharic 2010 RTI<br />
Honduras (rural World Bank-supported schools only) 26 Spanish 2008 RTI<br />
Liberia 54 English 2008 RTI<br />
Malawi* 96 Chichewa 2010 RTI<br />
Mali 94 French 2009 RTI<br />
Morocco 33 Arabic 2011 RTI<br />
Nepal** (sample of NGO-supported schools) 79 Nepali 2009 AED<br />
Nicaragua* (excluding Atlantic Coast) 6 Spanish 2008 RTI<br />
Pakistan (sample of NGO-supported schools) 91 Pashtu 2009 Save the Children<br />
Uganda (Lango sub-region) 82 Lango 2009 RTI<br />
Yemen 42 Arabic 2011 RTI<br />
Zambia 91 Bemba 2011 RTI<br />
GRADE 3<br />
Bangladesh** (sample of NGO-supported schools) 12 Bangla 2010 Save the Children<br />
Guatemala** (sample of NGO-supported schools) 4 Spanish 2008 AED<br />
Haiti*(Artibonite and Gonaives) 35 French 2009 RTI<br />
Kenya (Central and Luo-Nyanza provinces) 21 Kiswahili 2009 RTI<br />
Mozambique** (Cabo Delgado, sample of NGO-supported schools) 57 Portuguese 2010 AED<br />
Nigeria** (Sokoto and Bauchi states) 78 Hausa 2011 RTI<br />
Papua New Guinea (Madang province) 13 English 2011 World Bank<br />
Philippines** (Mindao, sample of NGO-supported schools) 30 English 2009 Save the Children<br />
Senegal 18 French 2009 RTI<br />
Vietnam** (sample of NGO-supported schools) 7 Vietnamese 2010 Save the Children<br />
Zimbabwe* (sample of NGO-supported schools) 56 English <strong>2012</strong> Save the Children<br />
GRADE 4<br />
Rwanda* 13 Kinyarwanda 2011 RTI<br />
DR Congo* (Bandundu, Equateur, Orientale provinces) 70 French 2010 RTI<br />
Notes: Non-readers are those students who were unable to read any words on the first line of a graded reading passage and were asked to discontinue the<br />
exercise. Results were based on national samples of pupils unless otherwise noted. For further documentation regarding the assessments, please see www.<br />
eddataglobal.org. Assessment was carried out at the end of the school year unless otherwise noted.<br />
* Assessment was conducted at the beginning of the school year.<br />
** Assessment was conducted in the middle of the school year.<br />
AED = Academy for <strong>Education</strong>al Development. RTI = Research Triangle Institute.<br />
Sources: Assessments conducted by ministries of education and non-governmental organizations. Compilation and calculations by RTI <strong>International</strong>.<br />
46
OPPORTUNITIES LOST: THE IMPACT OF GRADE REPETITION AND EARLY SCHOOL LEAVING<br />
TABLE 3. How many countries take part in cross-national studies of learning achievement?<br />
Number of countries by region that take part in cross-national assessments<br />
REGION<br />
Countries<br />
without<br />
cross-national<br />
assessments<br />
LLECE<br />
(reading)<br />
2008<br />
Countries participating in assessments<br />
PASEC<br />
(reading –<br />
French)<br />
PIRLS<br />
2011<br />
SACMEQ III<br />
(reading<br />
2007)<br />
PISA<br />
(reading)<br />
2009<br />
Total<br />
Arab States 11 6 4 20<br />
Central and Eastern Europe 5 10 16 21<br />
Central Asia 5 2 3 9<br />
East Asia and the Pacific 24 6 10 34<br />
Latin America and the Caribbean 24 16 3 9 42<br />
North America and Western Europe 6 18 22 29<br />
South and West Asia 8 1 9<br />
Sub-Saharan Africa 20 11 2 14 45<br />
WORLD 103 16 11 48 14 64 209<br />
Note:<br />
PISA = Programme for <strong>International</strong> Student Assessment.<br />
Source: UNESCO Institute for Statistics database.<br />
differences in language structure, especially with<br />
regard to word length and spelling. But, as shown<br />
in Table 2, one-half of the children tested could<br />
not read a single word after two to four years of<br />
schooling. Even worse, in three countries, almost<br />
all pupils were lacking the most basic reading skills.<br />
For example, in Malawi, Mali and Zambia, learning<br />
difficulties start early: in Grade 2 more than 90% of<br />
pupils were unable to decode a single word. Such<br />
low reading levels were found in other regions as<br />
well, including in Pakistan, where 91% of 2 nd graders<br />
were unable to decode a single word of text.<br />
4.2 ASSESSING LOW LEVELS OF READING<br />
SKILLS AT THE END OF PRIMARY<br />
EDUCATION<br />
countries per region with information from at least<br />
one of the cross-national assessment studies.<br />
The UIS has launched a new initiative, the<br />
Observatory of Learning Outcomes, that will use<br />
these assessments to develop a large body of<br />
comparable data in order to provide a reliable picture<br />
of learning achievement around the world, specifically<br />
concerning reading, writing and numeracy skills<br />
at the end of primary school. The Observatory will<br />
provide a range of statistical information on learning<br />
outcomes from all countries conducting assessments<br />
to facilitate global monitoring. It will develop two<br />
datasets: a global database on student performance<br />
and a catalogue of assessments undertaken around<br />
the world.<br />
Approximately 150 countries in the world undertake<br />
learning skills assessments at the end of primary<br />
education (UNESCO, 2008). These studies are<br />
conducted in a comparative manner, usually<br />
through a regional initiative covering countries in<br />
Central and West Africa, South and East Africa or<br />
Latin America. There are assessments, however,<br />
which include countries from different regions. The<br />
Progress in <strong>International</strong> <strong>Reading</strong> Literacy Study<br />
(PIRLS), for example, has participating countries on<br />
all continents, though the majority are in Europe.<br />
Table 3 presents a summary of the number of<br />
The global database will promote the use of<br />
indicators of learning outcomes that are comparable<br />
across countries. These measures will be generated<br />
by a consortium of international and regional<br />
assessment agencies. The catalogue will be a global<br />
inventory of large-scale assessments that countries<br />
use to monitor how much their school children are<br />
learning in primary and secondary school. It will cover<br />
national (including examinations) and international<br />
large-scale studies of student achievement. The aim<br />
is to provide the information needed for governments<br />
to make informed decisions concerning different<br />
47
SECTION 4 / Monitoring education quality: Putting the spotlight on low levels of learning<br />
FIGURE 22<br />
How do pupils perform in reading?<br />
Distribution of pupils by performance levels in international assessments, 2000s<br />
SACMEQ, 2007<br />
Low Intermediate High Advanced<br />
Swaziland 7<br />
21<br />
60<br />
12<br />
Tanzania 10 12<br />
45<br />
33<br />
Kenya 20<br />
20<br />
41<br />
20<br />
Mauritius 21<br />
12<br />
29<br />
38<br />
Zanzibar<br />
21<br />
16<br />
42<br />
20<br />
Seychelles<br />
22<br />
10<br />
30<br />
38<br />
Botswana<br />
24<br />
19<br />
37<br />
20<br />
Zimbabwe<br />
37<br />
21<br />
26<br />
16<br />
Namibia<br />
39<br />
26<br />
26<br />
9<br />
Mozambique<br />
44<br />
25<br />
29<br />
3<br />
Uganda<br />
46<br />
24<br />
26<br />
5<br />
South Africa<br />
48<br />
15<br />
20<br />
17<br />
Lesotho<br />
53<br />
26<br />
18 4<br />
Zambia<br />
73<br />
15 10 3<br />
Malawi<br />
73 20 6 1<br />
0 20 40 60 80 100<br />
Percentage of pupils<br />
Notes: Three performance levels are considered as<br />
“low”:<br />
Level 1: Matches words and pictures involving<br />
concrete concepts and everyday objects. Follows<br />
short, simple written instructions.<br />
Level 2: Matches words and pictures involving<br />
prepositions and abstract concepts. Uses cuing<br />
system (sounding out, using simple sentence<br />
structure, and familiar words) to interpret phrases.<br />
Level 3: Interprets meaning (matching words and<br />
phrases, completing sentences) in a short and<br />
simple text.<br />
Source: SACMEQ III Project Results, p. 12.<br />
PASEC, 2009<br />
Low Intermediate+<br />
Gabon 16<br />
84<br />
Cameroon<br />
29<br />
71<br />
Burundi<br />
47<br />
53<br />
Senegal<br />
55<br />
45<br />
Burkina Faso<br />
62<br />
38<br />
Côte d’Ivoire<br />
63<br />
37<br />
Congo<br />
63<br />
37<br />
Madagascar<br />
64<br />
36<br />
Chad<br />
74<br />
27<br />
Benin<br />
74<br />
26<br />
Comoros<br />
75 25<br />
0 20 40 60 80 100<br />
Percentage of pupils<br />
Notes: Performance levels considered as “low”:<br />
Level 1: Students with no more than 24% correct<br />
answers fall in this category. A score in this range<br />
could be obtained by random answers on the<br />
assessment.<br />
Level 2: Students with 25% to 40% correct<br />
answers.<br />
Source: “Synthèse régionale des résultats PASEC”, 2010,<br />
p. 8.<br />
48<br />
LLECE, 2008<br />
Low Intermediate High Advanced<br />
Costa Rica 5<br />
23<br />
37<br />
35<br />
Cuba 6 20<br />
24<br />
51<br />
Chile 8<br />
30<br />
32<br />
29<br />
Uruguay 10<br />
31<br />
30<br />
29<br />
Mexico 12<br />
33<br />
30<br />
24<br />
Colombia 14<br />
38<br />
30<br />
18<br />
Brazil 15<br />
35<br />
27<br />
22<br />
Argentina 20<br />
36<br />
25<br />
19<br />
El Salvador 22<br />
44<br />
24<br />
10<br />
Nicaragua<br />
23<br />
51<br />
21<br />
5<br />
Peru<br />
26<br />
42<br />
23<br />
9<br />
Panama<br />
31<br />
39<br />
21<br />
10<br />
Guatemala<br />
36<br />
43<br />
16 5<br />
Paraguay<br />
37<br />
37<br />
19<br />
7<br />
Ecuador<br />
38<br />
39<br />
17 6<br />
Dominican Rep.<br />
52<br />
38<br />
9 1<br />
0 20 40 60 80 100<br />
Percentage of pupils<br />
Notes: Performance levels considered as “low”:<br />
Low level: Locate information with a single<br />
meaning in a prominent or central part of the<br />
text (beginning or end), that is repeated literally<br />
or synonymously and is isolated from other<br />
information.<br />
Source: SERCE Student Achievement in Latin America<br />
and the Caribbean, 2008, p. 39.
OPPORTUNITIES LOST: THE IMPACT OF GRADE REPETITION AND EARLY SCHOOL LEAVING<br />
approaches to large-scale assessments. While<br />
collaboration among these assessment initiatives<br />
is a promising approach, it is nevertheless also<br />
important to keep in mind that learning goes beyond<br />
standardised scores of reading skills.<br />
Figure 22 presents the percentage of the assessed<br />
population that had low levels or “poor” performance<br />
(not meeting minimum requirements for reading) for the<br />
three regional studies (SACMEQ, PASEC and LLECE).<br />
Each study uses its own constructs, tools, procedures<br />
and benchmarks to generate this target group.<br />
Following its mandate to improve overall educational<br />
quality, the SACMEQ initiative has compared<br />
educational achievement among children at the end of<br />
primary schooling in 14 sub-Saharan African countries<br />
since 1995. The most recent study is from 2007.<br />
that the country has a relatively high national level<br />
of GDP per capita. In terms of progression, about<br />
three out of five children (58%) reach the last grade<br />
of primary school in Gabon. In contrast, Benin,<br />
Chad and Comoros had the greatest shares of<br />
low-performing pupils, where almost one out of two<br />
pupils (two out of five for Comoros) failed to meet<br />
minimum standards (PASEC, 2010).<br />
Concerning the determinants of pupils’ learning,<br />
research on PASEC results from the 11 countries<br />
shows that family income, the use of the instruction<br />
language at home, and the possession of textbooks<br />
have a positive impact on learning. However, the<br />
following factors have a negative impact on learning:<br />
repetition, gender discrimination (against girls),<br />
very large class size, and rural location of schools<br />
(PASEC, 2010).<br />
Results show that in approximately one-half of<br />
the countries pupils had low performance levels in<br />
reading (40% or more at the lowest performance<br />
level as defined by the study). Malawi and Zambia<br />
had the largest proportions of low performers, with<br />
almost three in four tested pupils unable to meet<br />
minimum requirements for reading. Many of these<br />
children appear to have only the most basic, or preemergent,<br />
skills.<br />
In the PASEC learning achievement study, pupils in<br />
Grades 2 and 5 were tested in mathematics, French<br />
and sometimes the national language. The study<br />
also collects data on the characteristics of pupils,<br />
teachers, classes and schools in order to examine<br />
their impact on pupil performance. The most recent<br />
study took place in 2009.<br />
Results for the PASEC study show that, in 8 out of<br />
11 participating countries, more than one-half of the<br />
pupils attained the lowest performance levels in the<br />
French language. Gabon (16%) and Cameroon (29%)<br />
had the smallest proportions of low-performing pupils<br />
in reading achievement in the French language. The<br />
rates in Gabon can be partly explained by the fact<br />
that almost all children speak French at home, which<br />
is not the case in many of the other countries, and<br />
LLECE, which has a network structure, serves as a<br />
technical and policy debate forum dedicated to the<br />
learning process and its ramifications, and undertakes<br />
systematic comparative studies among primary school<br />
pupils in the areas of reading, mathematics and<br />
sciences. The most recent study, the Third Regional<br />
Comparative and Explanatory Study (TERCE), is<br />
currently being implemented. The second study<br />
(SERCE) was conducted in 2006 and covered 16<br />
countries and the Mexican state of Nuevo Leon.<br />
Results show that, in one in four participating<br />
countries, at least one-third of tested pupils did not<br />
achieve minimum reading skills. The greatest number<br />
of low performers in reading were found in the<br />
Dominican Republic (52%), where more than onehalf<br />
of pupils tested did not meet minimum reading<br />
standards, followed by Ecuador (38%), Paraguay<br />
(37%) and Guatemala (36%). In contrast, the lowest<br />
shares were found in Costa Rica (5%) and Cuba (6%).<br />
4.3 LEARNING OUTCOMES AND<br />
REPETITION<br />
As shown in Section 2 of this report, many education<br />
systems apply a policy that requires pupils who<br />
have not satisfactorily met the learning objectives of<br />
49
SECTION 4 / Monitoring education quality: Putting the spotlight on low levels of learning<br />
BOX 4. What universal reading skills should all children acquire by the end of<br />
primary education?<br />
The Center for Universal <strong>Education</strong> at the Brookings Institution and the UNESCO Institute for Statistics<br />
(UIS) have launched a Learning Metrics Task Force to catalyse a shared vision for learning goals and<br />
targets. The task force provides a space for consultation and dialogue among a diverse group of<br />
experts to develop recommendations for learning standards, metrics and implementation practices.<br />
The project timeline strategically aligns with global policy processes to implement the next generation<br />
of the <strong>Education</strong> for All agenda and Millennium Development Goals, as well as the UN Secretary-<br />
General’s new global education initiative, <strong>Education</strong> First.<br />
The task force will develop recommendations for learning metrics at the early childhood, primary<br />
and post-primary education levels. It includes representatives of national governments, civil society,<br />
regional organizations, multilaterals and bilateral donors. The Brookings Institution and the UIS will<br />
support the analytical and administrative work of the task force, while technical working groups will<br />
make recommendations concerning standards, measures, methods and implementation strategies.<br />
their current grade to repeat the grade. This policy<br />
is motivated by the belief that an extra year in the<br />
grade will give struggling pupils an opportunity to<br />
improve content mastery and be better prepared to<br />
succeed in subsequent grades. Those who favour<br />
grade repetition policies also tend to suggest that it is<br />
important for schools to maintain high standards.<br />
In contrast, other school systems apply a social<br />
promotion policy of moving pupils to the next grade<br />
level despite poor achievement at their current grade.<br />
It is based on the belief that promotion maintains<br />
the motivation of pupils and that such pupils will get<br />
more from exposure to new content than they would<br />
from repeating their current grade (UIS, 2004).<br />
Results from international learning studies show that<br />
student performance is not closely associated with<br />
the practice of repetition or automatic promotion.<br />
For example, high-performing students come<br />
from countries that practise repetition and from<br />
those that practice automatic promotion. In more<br />
developed countries, results from the Programme<br />
for <strong>International</strong> Student Assessment (PISA) in 2009<br />
(OECD, 2011) show that some high-performing<br />
countries apply automatic promotion (e.g. Finland,<br />
Iceland and Norway) while others practice repetition<br />
(e.g. Belgium, Canada, the Netherlands and the<br />
United States). According to results from the<br />
SACMEQ III survey (Hungi, 2011), the top three<br />
performers in terms of reading scores of primary<br />
Grade 6 pupils were Seychelles, Mauritius (which<br />
have automatic promotion policies) and Tanzania,<br />
which applies repetition.<br />
At the same time, the progress of individual pupils<br />
may be impacted by repetition or automatic<br />
promotion policies. In South and East Africa, in all<br />
of the 15 SACMEQ school systems, pupils who<br />
had never repeated grades were likely to achieve<br />
better results than pupils who had repeated grades<br />
in reading, and in all but two of the school systems<br />
(Malawi and Swaziland) in mathematics (Hungi,<br />
2011). Over the last decade, PASEC evaluations in<br />
11 countries provide evidence that during the school<br />
year repeaters progressed less than their classmates<br />
in terms of learning (PASEC, 2010).<br />
Does repetition improve learning? A wide range of<br />
studies and empirical evidence have still not reached<br />
a consensus on the use of repetition to address<br />
insufficient learning (Ndaruhutse, 2008; Crahay,<br />
2007; UNESCO/IIEP, 1997). Those who support<br />
its pedagogical effectiveness argue that advancing<br />
to the subsequent grade/level of education is<br />
contingent upon mastery of the curriculum of the<br />
preceding grade/level. They also argue that repetition<br />
can be effectively used to regulate and motivate<br />
students. Conversely, arguments against the use of<br />
repetition consider that such a policy: i) is a waste of<br />
financial and human resources; ii) harms the self-<br />
50
OPPORTUNITIES LOST: THE IMPACT OF GRADE REPETITION AND EARLY SCHOOL LEAVING<br />
esteem of repeaters; and iii) is not effective in helping<br />
students to catch up academically (Labé, 2010).<br />
An analysis of the results of international student<br />
assessments seems to portray a story of two worlds.<br />
In the first, schools are stable, well-resourced<br />
institutions, designed to serve school-ready entrants<br />
who can successfully meet curricular objectives. Yet,<br />
in other places, schools lacking even the most basic<br />
services are trying to serve students, who often face<br />
poverty and compounding disadvantages. In the end,<br />
it is the children with the least opportunities who are<br />
most likely to repeat grades and leave school early<br />
without being able to read a basic text.<br />
It is important to note that the indicators of learning<br />
outcomes described here are not comparable; they<br />
were generated using different assessment models.<br />
At the same time, it is impossible not to observe<br />
that all the evidence from the different assessments<br />
point in a similar direction. Millions of children in less<br />
developed countries do not learn to read in the early<br />
grades, which is when they should do so, as reading<br />
is a foundation for further learning. In short, many<br />
youngsters are completing primary school each year<br />
without having acquired basic literacy skills.<br />
51
SECTION<br />
5<br />
THE COSTS OF SCHOOL FAILURE<br />
WHAT’S IN THIS SECTION?<br />
Based on the analysis presented in earlier sections,<br />
this section aims to identify the factors that underlie<br />
repetition, early school leaving and learning<br />
achievement before presenting the different types<br />
of policy measures required to address the needs<br />
of the most disadvantaged children. The economic<br />
dimension is also highlighted in order to stress the<br />
need for more efficient use of existing resources.<br />
Solutions that focus on early interventions – which<br />
are designed to remedy learning gaps before they<br />
accumulate and costs rise – are at the heart of this<br />
section.<br />
KEY FACTS<br />
••<br />
Many countries in sub-Saharan Africa are<br />
faced with high rates of repetition and early<br />
school leaving. This is also the case for several<br />
countries in Latin America and the Caribbean<br />
and in East Asia and the Pacific.<br />
••<br />
Repetition can account for two to three years<br />
of school life expectancy rates in Burundi and<br />
Togo, and almost one year or more in a range<br />
of other countries, primarily in sub-Saharan<br />
Africa, but also in Timor-Leste and Lao People’s<br />
Democratic Republic in Asia and the Pacific<br />
region, in Algeria, Morocco and Tunisia in the<br />
Arab States, and in Uruguay in Latin America<br />
and the Caribbean.<br />
••<br />
If resources spent on repeating a grade were<br />
instead spent on enrolling new entrants into<br />
school, annual GDP in countries like Burundi,<br />
Madagascar and Malawi could grow potentially<br />
by 1.3%, 0.7% and 0.6% respectively.<br />
••<br />
Policies that focus on prevention or prioritise<br />
interventions before learning gaps accumulate<br />
can be the most cost-effective.<br />
••<br />
In middle- or high-income countries, primary<br />
school classes have fewer than 30 pupils, and<br />
in a majority of them there are fewer than 20<br />
pupils per class. Yet, in sub-Saharan Africa, the<br />
average class size in public primary schools<br />
ranges from 26 pupils in Cape Verde to 84 in<br />
the Central African Republic. In four out of ten<br />
countries reporting data, there are on average<br />
50 or more pupils per class.<br />
Repetition is a policy implemented by teachers<br />
and school administrators, sometimes with the<br />
permission of parents. Early school leaving is more<br />
likely a choice, made by pupils and their families in<br />
response to a process rather than an event, which<br />
may also be precipitated by teachers, headmasters,<br />
education systems and a range of external factors.<br />
Thus, repetition policy is more readily amenable<br />
to changes in the provision of education, whereas<br />
policies related to early school leaving are linked to<br />
the supply of education and the demand for it.<br />
In terms of resource use, the costs of repetition often<br />
remain hidden, largely because a rising number<br />
of children in the education system and individual<br />
classrooms often leads to the downgrading of<br />
education quality. Equally hidden are the considerable<br />
individual and social costs associated with early<br />
school leaving – which are recognised but often<br />
difficult to quantify. Despite this important distinction,<br />
both phenomena are associated with unsatisfactory<br />
progress and incomplete learning.<br />
This section reviews the links between repetition and<br />
early school leaving before measuring the costs of<br />
grade repetition policies. It concludes by identifying<br />
a few important areas in terms of policies aimed at<br />
reducing grade repetition and dropout rates.<br />
5.1 LINKS BETWEEN REPETITION, EARLY<br />
SCHOOL LEAVING AND INADEQUATE<br />
LEARNING OUTCOMES<br />
The factors underlying repetition, early school leaving<br />
and learning achievement are related. While further<br />
evidence in longitudinal research is needed, existing<br />
research suggests that children who start late and/or<br />
repeat grades are more likely to leave school early.<br />
52
OPPORTUNITIES LOST: THE IMPACT OF GRADE REPETITION AND EARLY SCHOOL LEAVING<br />
Figure 23 shows that high rates of repetition and<br />
early school leaving are found in many of the same<br />
countries. The majority of these countries are in<br />
sub-Saharan Africa, although several countries are<br />
in Latin America and the Caribbean (e.g. Guatemala<br />
and Nicaragua) and in East Asia and the Pacific<br />
(e.g. Cambodia, Timor-Leste and Vanuatu). There are<br />
also countries with low rates of repetition but high<br />
dropout rates, like Ethiopia and Liberia. As with grade<br />
repetition, there are many reasons why children leave<br />
school early but, as profiles in earlier sections of this<br />
report show, children, households and communities<br />
that face multiple disadvantages are particularly at risk.<br />
However, the relationship between repetition and<br />
dropout rates is not clearly defined, which may be<br />
partly due to difficulties in accurately measuring<br />
these phenomena, especially in developing<br />
countries. For example, repetition rates of around<br />
23% are associated with dropout rates of 30%<br />
in the Congo, 41% in Togo, 54% in the Central<br />
African Republic and 72% in Chad. The reverse<br />
is noted in other countries, where high dropout<br />
rates in the range of 45% are found in countries<br />
such as Zambia, which has a repetition rate of 6%<br />
or Cambodia (11%), Malawi (20%) and Burundi<br />
(36%).<br />
FIGURE 23<br />
Are rates of grade repetition and early school leaving related?<br />
Repetition and dropout rates in primary education in selected countries, 2009<br />
Arab States East Asia and the Pacific Latin America and the Caribbean South and West Asia Sub-Saharan Africa Other regions<br />
80<br />
World average: 6.3<br />
70<br />
Uganda<br />
Angola<br />
Chad<br />
Madagascar<br />
Rwanda<br />
Dropout rate to last grade of primary education (%)<br />
60<br />
50<br />
40<br />
30<br />
20<br />
Liberia<br />
Ethiopia<br />
Zambia<br />
Senegal<br />
Pakistan<br />
Niger<br />
Mauritania<br />
Ghana<br />
St Kitts/Nevis<br />
Myanmar<br />
Honduras<br />
Philippines<br />
Indonesia Paraguay<br />
Nigeria<br />
Tanzania<br />
Djibouti<br />
C. African Rep.<br />
Nicaragua<br />
Malawi<br />
Cambodia<br />
DR Congo<br />
Togo<br />
Côte d’Ivoire<br />
Nepal<br />
Equatorial Guinea<br />
Burkina Faso<br />
Guatemala<br />
Guinea<br />
Cameroon<br />
Laos Timor-Leste<br />
Bangladesh<br />
Sao Tome/Principe<br />
Eritrea<br />
Lesotho<br />
Congo<br />
Vanuatu<br />
Mali<br />
Namibia<br />
Burundi<br />
World average: 17.4<br />
Columbia<br />
El Salvador<br />
Cape Verde<br />
Swaziland<br />
10<br />
0<br />
Trinidad/Tobago<br />
Suriname<br />
Belize<br />
Morocco<br />
Lebanon<br />
Botswana Aruba<br />
Iran<br />
Syrian Arab Rep.<br />
Tunisia Algeria<br />
Mauritius China, Macao<br />
0 5 10 15 20 25 30 35 40<br />
Repetition rate in primary education (%)<br />
Source: UNESCO Institute for Statistics database.<br />
53
SECTION 5 / The costs of school failure<br />
High repetition and dropout rates are also associated<br />
with inadequate levels of basic learning achievement<br />
in reading and mathematics. Indeed, results from<br />
SACMEQ III in Southern and Eastern Africa showed<br />
that most countries with poor pupil performance<br />
in reading and mathematics (e.g. Lesotho, Malawi,<br />
Uganda and Zambia) shared the same characteristics<br />
with regard to repetition and early school leaving<br />
(Hungi, 2011). This is also true for low-performing<br />
primary education systems in Central Africa (PASEC,<br />
2010), namely Chad and the Congo. In Latin America<br />
and the Caribbean (LLECE, 2006), low levels of<br />
pupil performance at the primary level were found in<br />
Guatemala and Nicaragua – which have high rates of<br />
grade repetition and early school leaving. At the same<br />
time, these large-scale learning achievement studies<br />
showed that countries with high levels of pupil<br />
performance (for example, Botswana, Costa Rica,<br />
Mauritius and Tanzania) also had more moderate<br />
repetition and dropout rates.<br />
A wide range of different factors can influence levels<br />
of student learning and, consequently, lead to grade<br />
repetition or early school leaving. Which factors<br />
are most relevant and how they interact with other<br />
factors tend to vary by context – between countries<br />
or within population groups (urban/rural, rich/poor) in<br />
a single country.<br />
Previous sections of this report have demonstrated<br />
the importance of student, family and school/<br />
classroom factors for grade repetition and early<br />
school leaving. For example, high rates of repetition<br />
and early school leaving have been associated with:<br />
pupil’s age, gender, motivation, household income,<br />
child labour, command of the instruction language,<br />
educational attainment/illiteracy of parents, urban/<br />
rural location, as well as the educational resources of<br />
the school, instruction conditions, teaching quality and<br />
non-standard assessment of student performance.<br />
It is important to note that these are just some of the<br />
determining factors related to the education system<br />
and family background of the pupils.<br />
From a gender perspective, UIS data show that,<br />
on average, boys are more likely to repeat a grade<br />
in primary education than girls. On the other hand,<br />
girls – typically from low-income households or rural<br />
areas in sub-Sahara Africa, for example – are slightly<br />
more likely to leave school early mainly due to their<br />
responsibilities for the care of younger children, the<br />
gender division of labour in the household economy<br />
or early marriage (Ndaruhutse, 2008). In such cases,<br />
high repetition rates would not explain early school<br />
leaving, nor would learning achievement or schoolrelated<br />
factors. Consequently, measures to enhance<br />
learning in this context may not directly address the<br />
causes of early school leaving.<br />
5.2 GRADE REPETITION AND EARLY<br />
SCHOOL LEAVING ARE COSTLY, BUT TO<br />
WHAT EXTENT?<br />
A number of studies have considered grade<br />
repetition and early school leaving from the<br />
perspective of inefficiencies in the use of resources<br />
(UNESCO/IBE, 1971; UNESCO, 1976, 1980, 1998,<br />
2005). Every pupil who leaves school without<br />
completing the full course of compulsory education<br />
or achieving the learning objectives (e.g. foundation<br />
skills in reading, writing and numeracy) represents<br />
lost investments in addition to lost opportunities<br />
at the level of the individual and society. A pupil<br />
who repeats a grade consumes an additional year<br />
of educational resources, potentially limiting the<br />
capacity of the education system, increasing class<br />
size and the cost per graduate. Yet, in certain<br />
contexts, the pedagogical effects of repetition can<br />
increase the repeater’s learning and labour market<br />
productivity.<br />
There are two broad approaches for estimating the<br />
costs of repetition and/or early school leaving. One<br />
focuses on the direct costs and the other takes<br />
into account indirect costs. Direct costs reflect how<br />
much resources are used in education systems<br />
and, thus, are typically based on per-student or<br />
per-graduate costs. The most basic approach is<br />
simply to multiply the number of repeaters by perstudent<br />
cost – though this can overstate the actual<br />
resources required to accommodate repeaters<br />
in the education system. Based on the cost per<br />
54
OPPORTUNITIES LOST: THE IMPACT OF GRADE REPETITION AND EARLY SCHOOL LEAVING<br />
BOX 5. New OECD estimates for the costs of grade repetition<br />
As part of the PISA 2009 background questionnaire, a number of 15-year-old students reported having<br />
repeated a grade at least once in primary, lower secondary or upper secondary education. OECD has<br />
introduced new estimates for the cost of grade repetition by adding up direct costs and opportunity<br />
costs.<br />
The direct costs are the costs for education systems to provide one additional year of education. The<br />
opportunity costs are the costs of delaying students’ entry into the labour market by one additional<br />
year. Two assumptions underlie the estimation of opportunity costs: i) repeaters attain at most the<br />
lower secondary level (i.e. using annual labour costs for ISCED levels 0 to 2 for 25- to 64-year-olds and<br />
the unemployment rate for “below upper secondary education”); and ii) repeaters attain the national<br />
average education level (i.e. using the average annual labour costs for 25- to 64-year-olds and the<br />
unemployment rate for “all levels of education”).<br />
Estimation results indicate that the United States, Germany and Brazil have the three highest annual<br />
costs for grade repetition. In these countries, the total annual cost for grade repetition is estimated at<br />
20.8, 6.9 and 6.8 trillion purchase power parities in U.S. dollars (PPP US$) respectively. This represents<br />
about 4% of total expenditure on primary and secondary education in the United States and about 9%<br />
of costs in Brazil and Germany.<br />
This estimation approach does not address the benefits of grade repetition or the costs of not having<br />
grade repetition. For example, by repeating grades, students’ productivity and readiness for the labour<br />
market might be improved. <strong>Education</strong> systems might have to implement relevant policies and invest<br />
resources, such as extra tuition and subsidies for at-risk students, in order to avoid grade repetition,<br />
but these costs are not incorporated into this estimation. In addition, these cost estimates are based<br />
on the assumption that the most recent data on labour costs and unemployment rates will remain<br />
stable over time.<br />
Source: OECD (2011).<br />
graduate, it is also possible to assess the internal<br />
efficiency of the education system and compute<br />
costs associated with the educational resources<br />
consumed by repetition and early school leaving<br />
(Cuadra and Fredriksen, 1992; UNESCO, 1980,<br />
1998). Calculating indirect costs involves taking a<br />
broader view, which includes potential human capital<br />
development, economic returns and growth that<br />
might be delayed or missed due to grade repetition<br />
or early school leaving (Belfield, 2008; OECD, 2011).<br />
Measures of school life expectancy net of repetition<br />
indicate the average number of grades that a child<br />
is likely to attain in school and help to inform about<br />
the inefficiency of grade repetition from an economic<br />
point of view. In a number of countries that reported<br />
data, the years spent repeating grades make up a<br />
substantial proportion of the output of education<br />
systems (see Figure 24). Repetition can result in<br />
two to three additional years in Burundi and Togo,<br />
and almost one additional year or more in a range of<br />
other countries, primarily in sub-Saharan Africa, but<br />
also in Algeria, Morocco, Timor-Leste, Tunisia, Lao<br />
People’s Democratic Republic and Uruguay. The years<br />
spent repeating typically occur in primary education,<br />
although grade repetition in lower secondary<br />
education makes up more one-than half of the<br />
additional years in Algeria, Tunisia and Uruguay.<br />
It is important to note that each year of real additional<br />
schooling (not due to repetition) could, on average,<br />
increase individual earnings by 10% and lift annual<br />
GDP growth globally by 0.37% (UNESCO, 2010). In<br />
this regard, if resources spent on repeating a grade<br />
were instead spent on enrolling new entrants into<br />
school without reducing the quality of education,<br />
annual GDP in countries like Burundi, Madagascar<br />
and Malawi could grow potentially by 1.3%, 0.7%<br />
and 0.6% respectively.<br />
5.3 POLICY OPTIONS FOR REDUCING<br />
REPETITION AND EARLY SCHOOL<br />
LEAVING<br />
It is difficult to design comprehensive policies to<br />
reduce repetition, early school leaving and low<br />
55
SECTION 5 / The costs of school failure<br />
FIGURE 24<br />
How many years are spent repeating grades in primary and lower secondary education?<br />
School life expectancy with and without repetition for countries exceeding a population of<br />
1 million with highest number of school years due to repetition, 2010 or most recent year available<br />
Years spent repeating grades<br />
in primary education<br />
Years spent repeating grades<br />
in lower secondary education<br />
Years spent in primary and lower<br />
secondary education excluding repetition<br />
Uruguay<br />
Laos<br />
Uganda<br />
Angola<br />
Tunisia<br />
Morocco<br />
Guinea<br />
Rwanda<br />
Timor-Leste<br />
Algeria<br />
Cameroon<br />
Sierra Leone<br />
C. African Rep.<br />
Swaziland<br />
Chad<br />
Lesotho<br />
Malawi<br />
Madagascar<br />
Togo<br />
Burundi<br />
4<br />
3 2 1<br />
0 1 2 3 4 5 6 7 8 9 10<br />
School life expectancy (years)<br />
Note:<br />
Countries are ordered by the total number of years spent repeating grades in primary and lower secondary education.<br />
Source: UNESCO Institute for Statistics database.<br />
learning achievement because of the range of factors<br />
involved. Nevertheless, addressing the persistent and<br />
low quality of learning outcomes is a serious concern<br />
regardless of efficiency considerations and should<br />
be a key ingredient in any policy intervention (Cuadra<br />
and Fredriksen, 1992).<br />
It is possible to identify interventions to lower the<br />
risks of grade repetition, early school leaving and low<br />
levels of learning achievement at different stages in<br />
a student’s educational experience. Some of these<br />
interventions include:<br />
••<br />
ensuring transition (in intermediate stages if<br />
necessary) to reduce or target the practice of<br />
repetition;<br />
••<br />
focusing on early intervention – ensuring wider<br />
access to pre-primary programmes to facilitate<br />
school readiness;<br />
••<br />
reducing the over-age population by addressing<br />
the direct causes of late entry;<br />
••<br />
investing resources in education quality in early<br />
grades to ensure successful early learning; and<br />
••<br />
developing a range of compensatory opportunities<br />
for skills formation for early school leavers and<br />
young people.<br />
An obvious starting point for policy formulation is<br />
establishing whether grade repetition or automatic<br />
promotion is better for student learning. Results<br />
from international learning assessments like LLECE,<br />
PASEC and SACMEQ show that low student<br />
56
OPPORTUNITIES LOST: THE IMPACT OF GRADE REPETITION AND EARLY SCHOOL LEAVING<br />
performance is found in education systems that<br />
practice grade repetition as well as those that<br />
practice automatic promotion. For more developed<br />
countries, PISA 2009 results (OECD, 2011) show<br />
that countries performing above the OECD average<br />
also tend to practice either automatic promotion (e.g.<br />
Finland, Iceland and Norway) or grade repetition (e.g.<br />
Belgium, the Netherlands and the United States).<br />
The top three performers in the SACMEQ III Grade 6<br />
pupils’ reading scores in Southern African countries<br />
in 2007 were Seychelles, Mauritius and Tanzania.<br />
Automatic promotion is applied in the first two<br />
countries, while repetition is applied in the last. The<br />
distinction may be found in how repetition is applied –<br />
when used selectively in more developed education<br />
systems, it can help support learning; but when used<br />
indiscriminately, it can lead to high dropout rates and<br />
poorly performing education systems.<br />
Moreover, automatic promotion could represent a<br />
more cost-effective policy. The resources saved can<br />
be evaluated by comparing them to the resources<br />
invested in costly remedial classes or catch-up<br />
programmes for students experiencing learning<br />
difficulties, which typically require one-on-one<br />
attention.<br />
What is the best way to introduce automatic<br />
promotion? The experience of countries in<br />
introducing automatic promotion is varied. Grade<br />
repetition is applied in secondary education in some<br />
countries (e.g. Nigeria), from the last grade of primary<br />
education in others (e.g. Mauritius), or limited to<br />
the last grades of sub-cycles of primary education<br />
(e.g. Burkina Faso, Mali, Niger, Sao Tome and<br />
Principe, and Senegal).<br />
A gradual transition by grade/level could represent<br />
a potential strategy in countries where repetition is<br />
well-rooted in educational practice. For example, the<br />
sub-cycle implementation policy consists of dividing<br />
the average six-year cycle of primary schooling<br />
into two-year sub-cycles with no repetition allowed<br />
within each sub-cycle. When practiced alongside a<br />
system that identifies and supports weaker children,<br />
this approach has been found to increase quality<br />
(Ndaruhutse, 2008).<br />
However, there are important obstacles facing<br />
countries aiming to implement such policies. There<br />
is often a culturally engrained practice of grade<br />
repetition in certain countries, leading to a strong<br />
resistance to reform. Consequently, policy change will<br />
require meaningful engagement of all stakeholders:<br />
governments, education policymakers and planners,<br />
district education officers, school managers,<br />
teachers, teaching assistants, parents/caretakers,<br />
learners and civil society (Ndaruhutse, 2008).<br />
Policies that focus on prevention or prioritise<br />
interventions before learning gaps accumulate can be<br />
the most cost-effective. Specifically, policies aiming<br />
at building readiness to learn at an early pre-school<br />
stage or providing individual remediation as first<br />
symptoms of learning difficulties emerge or when<br />
absenteeism is observed would efficiently reduce<br />
repetition and early school leaving. This should<br />
help to diminish lost investments while leading to<br />
improvements in school retention.<br />
<strong>Education</strong>al initiatives like <strong>Education</strong> for All (EFA) or<br />
the Second Decade of <strong>Education</strong> for Africa (2006-<br />
2015) explicitly include early childhood education<br />
and development in their goals and action plan.<br />
Nevertheless, the supply of pre-primary education is<br />
still lower than demand in most developing countries.<br />
Pre-primary education can be costly and is mainly<br />
provided by private institutions in urban areas.<br />
As a result, some parents who have children of<br />
pre-primary education age (typically 3 to 6-yearolds)<br />
send them to school – often prematurely – as<br />
primary education becomes tuition-free in many<br />
countries. A number of early enrolled children may<br />
not be sufficiently prepared for school, making<br />
this experience more challenging for them. This<br />
contributes to repetition and early school leaving<br />
in the first grade of primary education in many<br />
developing countries.<br />
57
SECTION 5 / The costs of school failure<br />
Early intervention is also considered effective when<br />
pupils facing learning difficulties are identified early<br />
in the school year and are provided with individual<br />
remediation. Examples of remedial classes in many<br />
OECD countries, instruction language catch-up<br />
programmes in sub-Saharan African countries or<br />
dual language programmes show that they can<br />
help to prevent pupils from repeating grades or<br />
leaving school early. When the grounds for early<br />
school leaving include family-related factors, school<br />
interventions (by the classroom teacher or the<br />
school principal) involving the pupil’s family can<br />
help to remove the risk. Effective policy measures<br />
would include establishing mechanisms to track and<br />
bring early school leavers back to school. However,<br />
individual remediation and tracking mechanisms are<br />
also costly to implement.<br />
A wide age range of pupils in classrooms also<br />
helps to explain high rates of repetition, early<br />
school leaving and low learning attainment. Late<br />
entry and subsequent grade repetition increase<br />
the prevalence of over-age students in schools.<br />
The likelihood of leaving school early grows as the<br />
curriculum – designed for an intended cohort of<br />
younger pupils – becomes irrelevant to learners and<br />
the opportunity cost of staying in school increases<br />
when compared to the opportunities of the labour<br />
market. Early marriage, especially for girls, could also<br />
be a factor in early school leaving. In terms of policy<br />
measures, interventions should focus on minimising<br />
late entry into primary education (e.g. through school<br />
fee abolition, raising awareness of the importance of<br />
entering school at the appropriate age and improving<br />
record-keeping systems for children’s ages), reducing<br />
repetition and enforcing laws on compulsory<br />
education.<br />
Improving education quality, especially in the crucial<br />
early grades, is also an important policy intervention<br />
for reducing repetition and early school leaving, and<br />
improving literacy and learning levels. One measure<br />
of the resources invested in primary education is<br />
related to class size. For example, in all of the middleor<br />
high-income countries with available data, primary<br />
school classes have fewer than 30 pupils, and in a<br />
majority of them, there are fewer than 20 pupils per<br />
class. On the other hand, in sub-Saharan Africa, the<br />
average class size in public primary schools ranges<br />
from 26 pupils in Cape Verde to 84 in Central African<br />
Republic. In four out of ten countries reporting data<br />
for this region there are on average 50 or more pupils<br />
per class.<br />
Not only are classes in sub-Saharan Africa large in<br />
general, those in the critical early grades of schooling<br />
are typically larger than others. For instance, in<br />
Burundi and Madagascar, there are on average<br />
over 60 pupils per class, while in Chad the average<br />
1 st grade class has 85 pupils (see Figure 25). The<br />
situation in Chad is of particular concern, since<br />
studies show that classes exceeding 70 pupils have<br />
a negative effect on students’ learning achievement<br />
(Pôle de Dakar, 2005). In Chad, Madagascar and<br />
Togo, there are on average more than 20 additional<br />
pupils in Grade 1 than in the final grade of primary<br />
school. In Burundi, Mali, Niger, Rwanda and Senegal,<br />
there are between 10 and 20 more pupils in 1 st grade<br />
classes. In Chad, Madagascar and Rwanda, the<br />
large differences in class sizes are reflected by low<br />
survival rates to the last grade of primary education.<br />
In Madagascar and Rwanda, only about one in three<br />
children entering Grade 1 reach the end of primary<br />
education. In Chad, it is fewer than one in four.<br />
In this context, policymakers should seek costeffective<br />
measures to reduce class size, especially in<br />
rural regions or disadvantaged areas, like the slums<br />
surrounding big cities in Burkina Faso and Kenya.<br />
Such cost-effective measures could include the<br />
construction/rehabilitation of schools to make them<br />
more accessible and secure, provision of additional<br />
grades to incomplete schools (typically found in<br />
rural areas), expansion of the supply of post-primary<br />
education, introduction of cluster schools in remote<br />
areas, and the use of salary incentives and other<br />
attractive measures to facilitate the deployment of<br />
teachers to remote areas.<br />
Late interventions, for example when students<br />
enter school at an older age than the official entry<br />
age or after they have left school prematurely,<br />
58
OPPORTUNITIES LOST: THE IMPACT OF GRADE REPETITION AND EARLY SCHOOL LEAVING<br />
FIGURE 25<br />
How large are primary school classes in sub-Saharan Africa?<br />
Average primary-level class size by grade in selected countries, 2010 or latest year<br />
90<br />
85<br />
Chad 85<br />
More than 50 pupils<br />
per class<br />
80<br />
75<br />
70<br />
65<br />
Burundi 65<br />
Madagascar 63<br />
Pupils per class<br />
60<br />
55<br />
50<br />
45<br />
40<br />
Mali 59<br />
Togo 57<br />
Rwanda 53<br />
Niger<br />
46<br />
Senegal<br />
Guinea 42<br />
55<br />
47<br />
39<br />
35<br />
35<br />
30<br />
Mauritius 31<br />
32<br />
30<br />
25<br />
20<br />
1 2 3 4 5 6<br />
Grade<br />
Note:<br />
The figure excludes multi-grade classes.<br />
Source: UNESCO Institute for Statistics database.<br />
are more costly and more difficult from a learning<br />
perspective. Early school leavers who exit school<br />
before acquiring basic literacy skills are more<br />
likely to remain illiterate if no specific intervention<br />
is developed for them. One of these interventions<br />
could be second-chance programmes. They can<br />
include adult literacy programmes, with or without<br />
the possibility of obtaining an equivalence for re-entry<br />
into the formal education system; or accelerated<br />
learning programmes for children in refugee camps in<br />
Tanzania and Kenya, for example, or for former child<br />
soldiers in Colombia, Liberia and Sierra Leone.<br />
Other examples of possible interventions include<br />
schools for life, as found in Ghana, which offer the<br />
equivalent of three years of primary school in nine<br />
months; ‘Educatodos’ programmes in the Honduras,<br />
which provide the six grades of the primary cycle<br />
in three years; SPARK (Skills, Participation, and<br />
Access to Relevant Knowledge) programmes<br />
in Zambia, where the seven grades of primary<br />
education are taught in four years; and catch-up<br />
programmes/classes in post-conflict countries such<br />
as Afghanistan, Burundi and Liberia.<br />
59
REFERENCES<br />
Belfield, Clive (2008). “The Cost of Early School-Leaving and School”. Research prepared for the World Bank. Available at:<br />
http://siteresources.worldbank.org/INTLACREGTOPPOVANA/Resources/BELFIELDCostofSchoolFailure.pdf (accessed on 14<br />
September <strong>2012</strong>).<br />
Consortium for Research on <strong>Education</strong>al Access, Transitions and Equity (CREATE) (2009). “Dropping out from School”. Policy<br />
Brief No. 8. Available at: http://www.create-rpc.org/pdf_documents/Policy_Brief_8.pdf (accessed on 14 September <strong>2012</strong>).<br />
Coulidiati-Kielem, Justine (2007). “Les facteurs déterminants de l’efficacité pédagogique des établissements secondaires :<br />
une analyse critique de l’échec scolaire au Burkina Faso”. Thèse postdoctorale. Dijon, France: Institut de recherche sur<br />
l’éducation : Sociologie et Economie de l’<strong>Education</strong> (IREDU). Available at: http://hal.archives-ouvertes.fr/tel-00259098/<br />
(accessed on 14 September <strong>2012</strong>).<br />
Crahay, Marcel (ed.) (2007). Peut-on lutter contre l’échec scolaire? 3 e éd. Brussels: De Boeck.<br />
Cuadra, Ernesto and Birger Fredriksen (1992). “Scope for Efficiency Gains Resulting from Reduction in Repetition and<br />
Dropout: A Simulation Exercise”. World Bank PHREE Background Paper Series No. PHREE/92/55. Available at: http://wwwwds.worldbank.org/external/default/WDSContentServer/WDSP/IB/1992/06/01/000009265_3961003045610/Rendered/PDF/<br />
multi_page.pdf (accessed on 14 September <strong>2012</strong>).<br />
<strong>Education</strong> Policy and Data Center (EPDC) (2008). “Four Studies of <strong>Education</strong> Growth: Inequality by Wealth, Age Effects,<br />
Sub-national Learning Differentials, and Projections”. Background paper for <strong>Education</strong> for All <strong>Global</strong> Monitoring Report<br />
2009: Overcoming Inequality: Why Governance Matters. UNESCO Document 2009/ED/EFA/MRT/PI/31. Available at: http://<br />
unesdoc.unesco.org/images/0017/001787/178747e.pdf (accessed on 14 September <strong>2012</strong>).<br />
Hammond, Cathy, Dan Linton, Jay Smink and Sam Drew (2007). “Dropout Risk Factors and Exemplary Programs: A Technical<br />
Report”. National Dropout Prevention Center. Available at: http://www.dropoutprevention.org/sites/default/files/uploads/<br />
major_reports/DropoutRiskFactorsandExemplaryProgramsFINAL5-16-07.pdf (accessed on 14 September <strong>2012</strong>).<br />
Hungi, Njora (2011). “Characteristics of Grade 6 Pupils, their Homes and Learning Environments”. SACMEQ Working paper<br />
No. 1. Available at: http://www.sacmeq.org/downloads/Working%20Papers/01_Pupils_Final_24Nov2011.pdf (accessed on<br />
14 September <strong>2012</strong>).<br />
Hunt, Francis (2008). Dropping Out from School: A Cross-Country Review of Literature. CREATE Pathways to Access,<br />
Monograph No 16. University of Sussex: CREATE. Available at: http://www.create-rpc.org/pdf_documents/PTA16.pdf<br />
(accessed on 14 September <strong>2012</strong>).<br />
Kellaghan, Thomas and Vincent Greaney (2001). Using Assessment to Improve the Quality of <strong>Education</strong>. Paris: UNESCO<br />
<strong>International</strong> Institute for <strong>Education</strong>al Planning (IIEP).<br />
Labé, Olivier (2010). “Le redoublement, la réussite scolaire et l’objectif de la Scolarisation Primaire Universelle (SPU) d’ici<br />
à 2015 dans le cadre de l’Éducation Pour Tous (EPT) : Cas du Sénégal à partir des données longitudinales du PASEC”.<br />
Postdoctoral Thesis. Available at: https://papyrus.bib.umontreal.ca/jspui/bitstream/1866/5948/2/Labe_Olivier_A_2011_these.<br />
pdf (accessed on 14 September <strong>2012</strong>).<br />
Lewin, Keith M. (2007). Improving Access, Equity and Transitions in <strong>Education</strong>: Creating a Research Agenda. CREATE<br />
Pathways to Access, Research Monograph No 1. University of Sussex: CREATE. Available at: http://www.create-rpc.org/<br />
pdf_documents/PTA1.pdf (accessed on 14 September <strong>2012</strong>).<br />
Lewin, Keith M., Paul Wasanga, Ephraim Wanderi and Anthony Somerset (2011). Participation and Performance in <strong>Education</strong><br />
in Sub-Saharan Africa with Special Reference to Kenya: Improving Policy and Practice. CREATE Pathways to Access,<br />
Research Monograph No 74. University of Sussex: CREATE. Available at: http://www.create-rpc.org/pdf_documents/PTA74.<br />
pdf (accessed on 14 September <strong>2012</strong>).<br />
60
OPPORTUNITIES LOST: THE IMPACT OF GRADE REPETITION AND EARLY SCHOOL LEAVING<br />
Ndaruhutse, Susy (2008). Grade Repetition in Primary Schools in Sub-Saharan Africa: An Evidence Base for Change.<br />
Literature Review. London: CfBT <strong>Education</strong> Trust.<br />
Organisation for Economic Co-operation and Development (OECD) (2011). “Notes on the estimation of costs for grade<br />
repetition”. Available at: http://www.oecd.org/dataoecd/35/29/48362484.pdf (accessed on 14 September <strong>2012</strong>).<br />
Pôle de Dakar (2005). EPT : Repères pour l’action, Éducation Pour Tous en Afrique. Forum Dakar +5 Afrique. Dakar:<br />
UNESCO BREDA.<br />
Programme d’Analyse des Systèmes Éducatifs des États et Gouvernements Membres de la CONFEMEN (PASEC) (2010).<br />
“Synthèse des résultats PASEC VII, VIII et IX. Conférence des ministres de l’éducation des pays ayant le français en partage”.<br />
Working Paper. Dakar: CONFEMEN.<br />
Sabates, Ricardo, Kwame Akyeampong, Jo Westbrook and Frances Hunt (2010). “School Dropout: Patterns, Causes,<br />
Changes and Policies”. Background paper prepared for the <strong>Education</strong> for All <strong>Global</strong> Monitoring Report 2011: The Hidden<br />
Crisis: Armed Conflict and <strong>Education</strong>. UNESCO Document 2011/ED/EFA/MRT/PI/08. Available at: http://unesdoc.unesco.<br />
org/images/0019/001907/190771e.pdf (accessed on 14 September <strong>2012</strong>).<br />
Schiefelbein, Ernesto and Laurence Wolff (1992). “Repetition and inadequate achievement in Latin America’s primary schools:<br />
a review of magnitudes, causes, relationships and strategies”. Latin America Technical Human Resources Division Paper No.<br />
31. Washington, D.C.: World Bank.<br />
Understanding Children’s Work (UCW) (2010). Child Labour: Trends, Challenges and Policy Responses. Joining Forces<br />
Against Child Labour. UCW Working Paper. Geneva: ILO. Available at: http://www.ucw-project.org/attachment/Child_labour_<br />
interagency_EN20110504_114814.pdf (accessed on 14 September <strong>2012</strong>).<br />
UNESCO (1976). Wastage in Primary <strong>Education</strong> in Africa. Paris: UNESCO.<br />
UNESCO (1980). Wastage in Primary and General Secondary <strong>Education</strong>: a Statistical Study of Trends and Patterns in<br />
Repetition and Dropout. Paris: UNESCO.<br />
UNESCO (1998). Wasted Opportunities: When Schools Fail. Paris: UNESCO.<br />
UNESCO (2005). The Quality Imperative. EFA <strong>Global</strong> Monitoring Report 2005. Paris: UNESCO.<br />
UNESCO (2008). <strong>Education</strong> for All by 2015. Will We Make It? EFA <strong>Global</strong> Monitoring Report 2008. Paris: UNESCO.<br />
UNESCO (2010). Reaching the Marginalized. EFA <strong>Global</strong> Monitoring Report 2010. Paris: UNESCO.<br />
UNESCO and <strong>International</strong> Institute for <strong>Education</strong>al Planning (IIEP) (1997). Reducing Repetition: Issues and Strategies. Paris:<br />
UNESCO.<br />
UNESCO and <strong>International</strong> Bureau of <strong>Education</strong> (IBE) (1971). Wastage in <strong>Education</strong>, a World Problem. Paris, Geneva:<br />
UNESCO, IBE.<br />
UNESCO and <strong>International</strong> Bureau of <strong>Education</strong> (IBE) (2011). World Data on <strong>Education</strong>, VII Ed. 2010/11. IBE Document No.<br />
IBE/2010/CP/WDE/UV. Available at: http://www.ibe.unesco.org/fileadmin/user_upload/Publications/WDE/2010/pdf-versions/<br />
Burkina_Faso.pdf (accessed on 14 September <strong>2012</strong>).<br />
UNESCO Institute for Statistics (UIS) (2004). <strong>Global</strong> <strong>Education</strong> <strong>Digest</strong> 2004. Comparing <strong>Education</strong> Statistics Across the World.<br />
Montreal: UIS.<br />
UNESCO Institute for Statistics (UIS) (2005). Children Out of School: Measuring Exclusion from Primary <strong>Education</strong>. Montreal:<br />
UIS.<br />
UNESCO Institute for Statistics (UIS) (2011). The Quantitative Impact of Conflict on <strong>Education</strong>. UIS Technical Paper No. 7.<br />
Montreal: UIS.<br />
United Nations Children’s Fund (UNICEF) and UNESCO Institute for Statistics (UIS) (2011). <strong>Global</strong> Initiative on Out-of-school<br />
Children: Conceptual and Methodological Framework (CMF). New York, Montreal: UNICEF, UIS.<br />
Vaniscotte, F. (1996). Les écoles de l’Europe : Systèmes éducatifs et dimension européenne. Paris, Toulouse: INRP, IUFM.<br />
World Bank (2003). “Le système éducatif togolais : Eléments d’analyse pour une revitalisation” (English summary included).<br />
Série Développement Humain de la Région Afrique, Working paper. Washington, DC : World Bank.<br />
61
A N N E X<br />
A4<br />
DEFINITIONS<br />
Adjusted net intake rate (ANIR). Total enrolment in primary education of pupils of official primary school<br />
entrance age, expressed as a percentage of the population of the same age in a given school year. It is the<br />
equivalent of the age-specific enrolment rate of the official primary entrance age. It measures the actual level of<br />
access to primary education of the population of the official primary school entrance age.<br />
Adjusted primary net enrolment rate (ANER). Total number of pupils or students of official primary school<br />
age who are enrolled in primary or secondary education, expressed as a percentage of the corresponding<br />
population. It measures actual school participation of the official primary school age population and assesses the<br />
level of achievement of the universal primary education (UPE) goal.<br />
Capping. Indicators that surpass a theoretical maximum value are adjusted using a capping factor. The<br />
maximum value is determined using raw data from related indicators. Male, female and total values are<br />
recalculated and lowered by the capping factor so that the gender parity index of the new set of values<br />
remains the same as for the original values. For instance, net enrolment rates in primary education are capped<br />
using a factor that takes into account the male and female primary school-age populations and enrolment<br />
of primary school-age boys and girls in pre-primary, primary and secondary education. If the total enrolment<br />
of primary school-age children (whether male or female) is higher than the corresponding population, all net<br />
enrolment indicators (net enrolment rate, adjusted net enrolment rate, etc.) and their derivative indicators<br />
(out-of-school rate, etc.) are capped based on the same capping factor. In this case, the capping factor is<br />
calculated by taking the maximum of male and female enrolments and dividing by the primary school-age<br />
population of the same sex.<br />
Class. A class is made up of pupils or students who are following a common course of study. Pupils/students<br />
are grouped together in a class based on the highest number of common courses, usually compulsory studies.<br />
A class is the pedagogical structure in which each pupil/student is registered. Regardless of the level of study, a<br />
pupil/student is registered in only one class. Pupils/students from different grades may be present in the same<br />
class, as occurs in one-teacher or two-teacher schools. Conversely, a school may have a number of classes for<br />
the same grade.<br />
Class size. The number of enrolled students divided by the number of classes for the whole country. To ensure<br />
comparability among countries, special needs programmes are excluded. Data include only regular programmes<br />
at primary and lower secondary levels of education and exclude teaching in sub-groups outside the regular<br />
classroom setting.<br />
Compulsory education. The number of years or age span during which children are legally obliged to attend<br />
school.<br />
62
OPPORTUNITIES LOST: THE IMPACT OF GRADE REPETITION AND EARLY SCHOOL LEAVING<br />
Duration. The number of grades or years in a given level of education.<br />
Early childhood care and education (ECCE). Programmes that, in addition to providing children with care,<br />
offer a structured and purposeful set of learning activities either in a formal institution (pre-primary or ISCED 0)<br />
or as part of a non-formal child development programme. ECCE programmes are typically designed for children<br />
aged 3 years and over, occurring before primary education, and include organized learning activities that last on<br />
average an equivalent of at least two hours per day and 100 days per year.<br />
<strong>Education</strong> finance<br />
<strong>Education</strong>al expenditure by nature of spending as a percentage of total educational expenditure<br />
on public institutions, by level. Spending by nature (salaries, other current, total current or capital)<br />
expressed as a percentage of the expenditure for public educational institutions of the specified level of<br />
education. Salaries and other current expenditure add up to total current expenditure. Public subsidies to<br />
the private sector and administrative costs are excluded.<br />
Public expenditure per pupil or student by level as a percentage of GDP per capita. Total public<br />
expenditure per pupil or student in the specified level of education expressed as a percentage of GDP per<br />
capita.<br />
Total public expenditure per pupil or student by level (PPP US$). Total public expenditure per pupil or<br />
student in the specified level of education expressed in U.S. dollars and adjusted in terms of purchasing<br />
power parity (PPP).<br />
Total expenditure on educational institutions and educational administration as a percentage of<br />
GDP, by source. Expenditure from public, private and international sources on educational institutions (i.e.,<br />
schools, universities and similar instructional institutions) and administration at a given level of education,<br />
expressed as a percentage of GDP. This indicator excludes public subsidies to the private sector. As a<br />
consequence of this, data on public expenditure on educational institutions and educational administration<br />
differ from total public expenditure on education.<br />
Total public expenditure on education as a percentage of GDP. Current and capital expenditure on<br />
education by local, regional and national governments, including municipalities (household contributions<br />
are excluded), expressed as a percentage of GDP.<br />
Total public expenditure on education as a percentage of total government expenditure. Current<br />
and capital expenditure on education by local, regional and national governments, including municipalities<br />
(household contributions are excluded), expressed as a percentage of total government expenditure on all<br />
sectors (including health, education, social services, etc.).<br />
<strong>Education</strong>al attainment. The educational attainment of an individual is defined as the ISCED level<br />
corresponding to the highest educational programme completed successfully.<br />
<strong>Education</strong>al attainment of the population aged 25 years and older. Percentage distribution of the population<br />
aged 25 years and older according to the highest level of education attained or completed with reference to<br />
ISCED.<br />
63
DEFINITIONS<br />
<strong>Education</strong>al institutions (public and private). <strong>Education</strong>al institutions are defined as entities that provide<br />
instructional or education-related services to individuals and other educational institutions. Whether or not<br />
an entity qualifies as an educational institution is not contingent upon which public authority (if any) has<br />
responsibility for it. These are classified as either public or private according to whether a public agency or<br />
private entity has the ultimate power to make decisions concerning the institution’s affairs.<br />
An institution is classified as public if it is controlled and managed directly by a public education authority or<br />
agency; or controlled and managed either by a government agency directly or by a governing body (council,<br />
committee, etc.), most of whose members are either appointed by a public authority or elected by public<br />
franchise.<br />
An institution is classified as private if it is controlled and managed by a non-governmental organization (e.g. a<br />
church, trade union or business enterprise), or if its governing board consists mostly of members not selected by<br />
a public agency. In general, the ultimate management control over an institution rests with who has the power to<br />
determine the general activity of the school and appoint the managing officers. The extent to which an institution<br />
receives its funding from public or private sources does not determine the classification status of the institution.<br />
A distinction is made between government-dependent and independent private institutions on the<br />
basis of the degree of a private institution’s dependence on funding from government sources. A<br />
government-dependent private institution receives at least 50% of its core funding from government agencies.<br />
An independent private institution receives less than 50% of its core funding from government agencies. Core<br />
funding refers to the funds that support the basic educational services of the institution. It does not include<br />
funds provided specifically for research projects, payments for services purchased or contracted by private<br />
organizations, or fees and subsidies received for ancillary services such as lodging and meals. Additionally,<br />
institutions should be classified as government-dependent if their teaching staff are paid by a government<br />
agency, either directly or indirectly.<br />
Enrolment. The number of pupils or students officially enrolled in a given grade or level of education, regardless<br />
of age.<br />
Entrance age (theoretical). The age at which pupils or students would enter a given programme or level<br />
of education assuming they start at the official entrance age for the lowest level of education, study full-time<br />
throughout, and progress through the system without repeating or skipping a grade. The theoretical entrance<br />
age to a given programme or level is typically, but not always, the most common entrance age.<br />
Expected gross intake ratio to the last grade of primary. Total number of new entrants to the first grade of<br />
primary education in a given year, regardless of age, who are expected to reach the last grade, regardless of<br />
repetition, expressed as a percentage of the population at the theoretical entrance age to primary education<br />
in the same year. It is calculated by multiplying the gross intake ratio to primary education by the probability of<br />
survival to the last grade. It estimates future gross intake to the last grade of primary education based on current<br />
new entrants to the first grade, assuming current grade transition and repetition rates remain unchanged. It<br />
therefore predicts the effect on last grade intake of current education policies on entrance to primary education<br />
and future years of schooling.<br />
64
OPPORTUNITIES LOST: THE IMPACT OF GRADE REPETITION AND EARLY SCHOOL LEAVING<br />
Expenditure on education<br />
Total public expenditure on education. The sum of all expenditure on education and education<br />
administration made by local, regional and national/central governments, including municipalities.<br />
Intergovernmental transfers are excluded.<br />
Current expenditure on education. Expenditure for goods and services consumed within the current<br />
year and which would be renewed if needed in the following year. It includes expenditure on staff salaries,<br />
pensions and benefits; contracted or purchased services; other resources, including books and teaching<br />
materials; welfare services; and other current expenditure, such as subsidies for students and households,<br />
minor equipment, minor repairs, fuel, telecommunications, travel, insurance and rent.<br />
Capital expenditure on education. Expenditure for assets that yield benefits for a period of more than<br />
one year. It includes expenditure for construction, renovation and major repairs of buildings and the<br />
purchase of heavy equipment or vehicles.<br />
Public subsidies. Public subsidies to households and other private entities consist of transfers to the<br />
private sector for educational institutions and transfers for student living costs and other education-related<br />
costs that occur outside educational institutions.<br />
Public subsidies to households and other private entities for educational institutions are composed of<br />
government transfers and certain other payments to students or households, insofar as these translate<br />
into payments to educational institutions for educational services (for example, fellowships, financial aid or<br />
student loans for tuition). They also include government transfers and other payments (mainly subsidies)<br />
to private entities other than households, including, for example, subsidies to firms or labour organizations<br />
that operate apprenticeship programmes and interest subsidies to private financial institutions that provide<br />
student loans, etc.<br />
Public subsidies to households that are not attributable to payments to educational institutions include<br />
subsidies for student living costs and the value of special subsidies provided to students, either in cash or<br />
in kind, such as free or reduced-price travel on public transport or family allowances that are contingent on<br />
student status.<br />
Fields of education (broad)<br />
Science and technology fields<br />
Science:.life sciences; physical sciences; mathematics and statistics; computer sciences.<br />
Engineering, manufacturing and construction:.engineering and engineering trades; manufacturing and<br />
processing; architecture and building.<br />
Other fields<br />
Agriculture:.agriculture, forestry and fishery; veterinary medicine.<br />
<strong>Education</strong>:.teacher training; education science.<br />
Health and welfare:.medicine; medical services; nursing; dental services; social care; social work.<br />
Humanities and arts:.religion and theology; foreign languages and cultures; native languages;<br />
interpretation and translation; linguistics; comparative literature; history; archaeology; philosophy; ethics.<br />
Fine arts; performing arts; graphic and audio-visual arts; design; craft skills.<br />
65
DEFINITIONS<br />
Social science, business and law:.social and behavioural science; journalism and information; business<br />
and administration; law.<br />
Services:.personal services; transport services; environmental protection; security services.<br />
Basic programmes, literacy, numeracy and personal development – together with programmes for which<br />
the field is unknown – are classified as “not known or unspecified”.<br />
GDP per capita. The gross domestic product divided by mid-year population.<br />
Gender parity index (GPI). The ratio of female-to-male values of a given indicator. A GPI of 1 indicates parity<br />
between the sexes.<br />
Graduate. A person who has successfully completed the final year of a level or sub-level of education. In<br />
some countries, completion occurs as a result of passing an examination or a series of examinations. In other<br />
countries, it occurs after a requisite number of course hours have been accumulated. Sometimes both types of<br />
completion occur within a country. For countries participating in the joint UNESCO/OECD/Eurostat (UOE) survey,<br />
graduations – instead of graduates – are used to calculate percentages by field of education (due to the UOE<br />
instrument design). Graduations refer to the number of qualifications obtained during the reference period; each<br />
qualification obtained counts as one graduation.<br />
Gross domestic product (GDP). The sum of gross value added by all resident producers in the economy,<br />
including distributive trades and transport, plus any product taxes, minus any subsidies not included in the value<br />
of the products.<br />
Gross enrolment ratio (GER). The number of pupils or students enrolled in a given level of education,<br />
regardless of age, expressed as a percentage of the population in the theoretical age group for the same level of<br />
education. For the tertiary level, the population used is the 5-year age group starting from the official secondary<br />
school graduation age.<br />
Gross entry ratio. Total number of new entrants to a given level, regardless of age, expressed as a percentage<br />
of the population of theoretical entrance age to this level.<br />
Gross graduation ratio. Total number of graduates, regardless of age, from a given level of education or<br />
programme expressed as a percentage of the population at the theoretical graduation age for that level of<br />
education or programme.<br />
Gross intake ratio (GIR). Total number of new entrants to the first grade of primary education, regardless of<br />
age, expressed as a percentage of the population at the official primary school entrance age.<br />
Gross intake ratio to the last grade of primary. The total number of new entrants in the last grade of primary<br />
education, regardless of age, expressed as a percentage of the population of theoretical entrance age to the last<br />
grade.<br />
Gross national income (GNI). The sum of gross value added by all resident producers in the economy,<br />
including distributive trades and transport, plus any product taxes, minus any subsidies not included in the value<br />
of the products, plus net receipts of income from abroad. Since net receipts from abroad may be positive or<br />
negative, it is possible for GNI to be greater or smaller than GDP.<br />
66
OPPORTUNITIES LOST: THE IMPACT OF GRADE REPETITION AND EARLY SCHOOL LEAVING<br />
Gross outbound enrolment ratio. Total number of tertiary students from a given country studying abroad<br />
expressed as a percentage of the population of tertiary age in that country.<br />
Instruction time of teachers (teaching time). Statutory instruction time (sometimes also referred to as teaching<br />
time) is defined as the total number of hours per year for which a full-time classroom teacher is responsible for<br />
teaching a group or class of students, according to the formal policy in the specific country. Periods of time<br />
formally allowed for breaks between lessons or groups of lessons may be excluded. Instruction/ teaching hours<br />
per year are calculated on the basis of teaching hours per day multiplied by the number of teaching days per<br />
year, or on the basis of teaching hours per week multiplied by the number of weeks per year that the school is<br />
open for teaching. The number of hours per year that fall on days when the school is closed is excluded.<br />
Intended instruction time for students. The number of hours per year that pupils are instructed according to<br />
the compulsory and flexible part of the intended curriculum. The total number of intended instruction hours per<br />
year is calculated by multiplying the total number of classroom sessions per year by the duration of one session.<br />
The intended curriculum is the subject matter content, as defined by the government or the education system.<br />
The intended curriculum comprises compulsory subjects, as well as the flexible part of the curriculum (subjects<br />
of the intended curriculum).<br />
<strong>International</strong> (or internationally mobile) students. Students who have crossed a national or territorial border<br />
for the purpose of education and are now enrolled outside their country of origin.<br />
<strong>International</strong> Standard Classification of <strong>Education</strong> (ISCED). A classification system that provides a<br />
framework for the comprehensive statistical description of national educational systems and a methodology that<br />
translates national educational programmes into internationally comparable levels of education. The basic unit<br />
of classification in ISCED is the educational programme. ISCED also classifies programmes by field of study,<br />
programme orientation and destination (see Annex B).<br />
Literacy. The ability to read and write, with understanding, a simple statement related to one’s daily life. It<br />
involves a continuum of reading and writing skills, and often includes basic arithmetic skills (numeracy).<br />
Literacy rate. Total number of literate persons in a given age group, expressed as a percentage of the total<br />
population in that age group. The adult literacy rate measures literacy among persons aged 15 years and older,<br />
and the youth literacy rate measures literacy among persons aged 15 to 24 years.<br />
Mobility ratios<br />
Inbound mobility rate. Total number of students from abroad studying in a given country, expressed as a<br />
percentage of total tertiary enrolment in that country.<br />
Outbound mobility ratio. Total number of students from a given country studying abroad, expressed as a<br />
percentage of total tertiary enrolment in that country.<br />
Net enrolment rate (NER). Total number of pupils or students in the theoretical age group for a given level of<br />
education enrolled in that level, expressed as a percentage of the total population in that age group.<br />
Net flow of mobile students. The number of tertiary students from abroad (inbound students) studying in a<br />
given country minus the number of students at the same level from a given country studying abroad (outbound<br />
students).<br />
67
DEFINITIONS<br />
Net flow ratio of mobile students. Total number of tertiary students from abroad (inbound students) studying in<br />
a given country minus the number of students at the same level of education from that country studying abroad<br />
(outbound students), expressed as a percentage of total tertiary enrolment in that country.<br />
Net intake rate (NIR). Total number of new entrants to the first grade of primary education who are of the<br />
theoretical primary school entrance age, expressed as a percentage of the population of the same age.<br />
New entrants. Pupils or students entering a given level of education, programme or grade for the first time.<br />
Orientation of educational programmes<br />
General education. Type of programme designed mainly to lead pupils to a deeper understanding of a<br />
subject or group of subjects, especially, but not necessarily to prepare pupils for further education at the<br />
same or higher level. These programmes are typically school-based and may contain vocational elements.<br />
Successful completion of these programmes may or may not lead to an academic qualification. However,<br />
they do not typically allow successful completers to enter a particular occupation, trade, or class of<br />
occupations or trades without further training. General education has a technical or vocational content of<br />
less than 25%, but pre-technical/pre-vocational programmes (i.e. programmes with a technical/vocational<br />
content of more than 25% that do not lead to a labour-market relevant technical or vocational qualification)<br />
are typically reported with general programmes.<br />
Technical and vocational education and training (TVET). Type of programme designed mainly to<br />
lead pupils to acquire the practical skills, know-how and understanding necessary for employment<br />
in a particular occupation or trade (or class of occupations or trades). Successful completion of such<br />
programmes normally leads to a labour-market relevant technical or vocational qualification recognised by<br />
the competent authorities (e.g. Ministry of <strong>Education</strong>, employers’ associations, etc.) in the country in which<br />
it is obtained.<br />
Out-of-school population. Total number of primary or lower secondary school-age children who are not<br />
enrolled in primary (ISCED 1) or secondary (ISCED 2 and 3) education.<br />
Percentage of female pupils. Total number of female pupils in a given level of education, expressed as a<br />
percentage of the total number of students enrolled at that level of education.<br />
Percentage of new entrants to primary education with ECCE experience. Total number of new entrants<br />
to primary education who have attended some form of organised Early Childhood Care and <strong>Education</strong> (ECCE)<br />
programmes, expressed as a percentage of the total number of new entrants to primary education.<br />
Percentage of private enrolment. Total number of pupils or students at a given level of education enrolled in<br />
institutions that are not operated by a public authority but controlled and managed, whether for profit or not,<br />
by a private body (e.g. non-governmental organisation, religious body, special interest group, foundation or<br />
business enterprise), expressed as a percentage of the total number of pupils or students enrolled at the given<br />
level of education.<br />
Percentage of repeaters. Total number of pupils or students who are enrolled in the same grade as the<br />
previous year, expressed as a percentage of total enrolment in the given grade of education.<br />
68
OPPORTUNITIES LOST: THE IMPACT OF GRADE REPETITION AND EARLY SCHOOL LEAVING<br />
Percentage of technical and vocational enrolment. Total number of pupils or students enrolled in technical<br />
and vocational programmes at a given level of education, expressed as a percentage of the total number of<br />
pupils or students enrolled in all programmes (technical/vocational and general) at that level.<br />
Percentage of trained teachers. Total number of teachers who have received the minimum organised teachertraining<br />
(pre-service or in service) required for teaching at the relevant level of education in a given country,<br />
expressed as a percentage of the total number of teachers at the given level of education.<br />
Pupil/teacher ratio. The average number of pupils per teacher at a given level of education, based on<br />
headcounts of both pupils and teachers.<br />
Purchasing power parity (PPP). The currency exchange rates that equalise the purchasing power of different<br />
currencies. This means that a given sum of money, when converted into U.S. dollars at the PPP exchange rate<br />
(PPP dollars), will buy the same basket of goods and services in all countries. In other words, PPPs are the<br />
rates of currency conversion which eliminate the differences in price levels among countries. Thus, comparisons<br />
between countries reflect only differences in the volume of goods and services purchased.<br />
Regional average. Weighted averages for a region, taking into account the relative size of the relevant<br />
population of each country. The figures for countries with larger populations thus have a proportionately greater<br />
influence on the regional aggregates. The averages are derived from published data complemented by imputed<br />
values for missing countries. Imputations are based on publishable data for the same countries from previous<br />
and/ or following years. When imputing an indicator, information from related indicators is used to strengthen the<br />
imputation hypothesis.<br />
Repeater. Pupil enrolled in the same grade for a second or further year.<br />
School-age population. Population of the age group theoretically corresponding to a given level of education,<br />
as indicated by theoretical entrance age and duration.<br />
School life expectancy. The number of years a person of school entrance age can expect to spend within the<br />
specified level of education. It is the sum of age-specific enrolment rates expressed as a percentage divided by<br />
100, for the levels of education specified. Enrolment that is not distributed by age is divided by the school-age<br />
population and multiplied by the duration of the given level before being added to the sum of the age-specific<br />
enrolment rates.<br />
School life expectancy net of repetition. The expected number of years of schooling that a child of school<br />
entrance age can expect to spend within the specified level of education, excluding years spent repeating a<br />
grade. It estimates the number of grades of schooling on average that a child will complete in his or her lifetime.<br />
Students<br />
Student/pupil. Pupil refers to a child enrolled in a basic educational programme; while pupils are always<br />
considered to be students, children, youth or adults enrolled at more advanced levels of education are<br />
more commonly referred to as students, and less often as pupils.<br />
Full-time students. Students engaged in an educational programme for a number of hours of study<br />
statutorily regarded as full-time at a particular level of education in a given country.<br />
69
DEFINITIONS<br />
Part-time students. Students whose statutory study hours are less than those required of full-time<br />
students in a given level and country.<br />
Full-time equivalent number of students. Generally calculated in person-years. The unit for the<br />
measurement of full-time equivalence is a full-time student. Thus, a full-time student equals one full-time<br />
equivalent. The full-time equivalence of part-time students is determined by calculating the ratio of their<br />
hours studied to the statutory hours studied by a full-time student during the school year. For example, a<br />
student who studied one-third of the statutory hours of a full-time student equals one-third of a full-time<br />
equivalent student.<br />
Survival rates. The percentage of a cohort of pupils or students enrolled in the first grade of a given level or<br />
cycle of education in a given school year who are expected to reach a given grade, regardless of repetition. The<br />
survival rates are calculated on the basis of the reconstructed cohort method, which uses data on enrolment by<br />
grade for two consecutive school years and repeaters by grade for the more recent year of these two years.<br />
Teachers<br />
Teaching staff. Persons employed full-time or part-time in an official capacity for the purpose of guiding<br />
and directing the learning experience of pupils and students, irrespective of their qualification or the<br />
delivery mechanism (i.e. whether face-to-face or at a distance). This definition excludes educational<br />
personnel who have no active teaching duties (e.g. headmasters, headmistresses or principals who do not<br />
teach) or who work occasionally or in a voluntary capacity in educational institutions.<br />
Trained teachers. Teachers who have received the minimum organized teacher training (pre-service or<br />
in-service) required for teaching at the relevant level in a given country.<br />
Full-time teachers. Persons engaged in teaching for a number of hours of work statutorily regarded as<br />
full-time at the particular level of education in a given country.<br />
Part-time teachers. Teachers whose statutory working hours are less than those required of full-time<br />
teachers in a given country.<br />
Full-time equivalent number of teachers. Calculated in person-years. The unit for the measurement of<br />
full-time equivalence is a full-time teacher. Thus, a full-time teacher equals one full-time equivalent. The fulltime<br />
equivalence of part-time teachers is determined by calculating the ratio of their hours worked to the<br />
statutory hours worked by a full-time teacher during the school year. For example, a teacher who works<br />
one-third of the statutory hours of a full-time teacher equals one-third of a full-time equivalent teacher.<br />
Teachers’ salaries. Expressed as statutory salaries, which are scheduled salaries according to official pay<br />
scales. They refer to the average scheduled gross salary per year for a full-time teacher with the minimum<br />
training necessary to be fully qualified at the beginning of his or her teaching career. Reported salaries are<br />
defined as the sum of wages (total sum of money paid by the employer for the labour supplied) minus the<br />
employer’s contribution to social security and pension funding (according to existing salary scales). Bonuses<br />
that constitute a regular part of the salary (such as holidays or regional bonuses) are included in the figures.<br />
Additional bonuses (for example, remuneration for teachers in remote areas, for participating in school<br />
improvement projects or special activities, or for exceptional performance) are excluded from the reported gross<br />
salaries. Salaries at 15 years experience refer to the scheduled annual salary of a full-time classroom teacher<br />
with the minimum training necessary to be fully qualified and with 15 years of experience. The maximum salaries<br />
reported refer to the scheduled maximum annual salary (top of the salary scale) of a full-time classroom teacher<br />
70
OPPORTUNITIES LOST: THE IMPACT OF GRADE REPETITION AND EARLY SCHOOL LEAVING<br />
with the minimum training to be fully qualified for his or her job. Salary data are reported in accordance with<br />
formal policies for public institutions.<br />
Transition rate (effective) from primary to secondary general education. The number of new entrants to the<br />
first grade of secondary education (general programmes only) in a given year expressed as a percentage of the<br />
students enrolled in the last grade of primary education in the previous year who do not repeat that grade the<br />
following year. It measures the probability that a pupil in the last grade of primary education makes the transition<br />
to secondary general education.<br />
For more definitions, refer to the multilingual UIS online glossary at www.uis.unesco.org/glossary<br />
71
A N N E X<br />
B<br />
INTERNATIONAL STANDARD CLASSIFICATION<br />
OF EDUCATION (ISCED97)<br />
Description of ISCED97 levels, classification criteria and sub-categories<br />
0 PRE-PRIMARY LEVEL OF EDUCATION Main criteria<br />
Initial stage of organized instruction, designed primarily to introduce very<br />
young children to a school-type environment.<br />
Should be centre- or school-based, be designed to meet the educational and developmental needs of<br />
children of at least 3 years of age, and have staff that are adequately trained (i.e. qualified) to provide<br />
an educational programme for children.<br />
1 PRIMARY LEVEL OF EDUCATION Main criteria<br />
Normally designed to give pupils a sound basic education in reading, writing<br />
and mathematics.<br />
Beginning of systematic studies characteristic of primary education, e.g. reading, writing and mathematics.<br />
Entry into the nationally designated primary institutions or programmes. The commencement<br />
of reading activities alone is not a sufficient criteria for classification of an educational programme at<br />
ISCED level 1.<br />
2 LOWER SECONDARY LEVEL OF EDUCATION Main criteria<br />
The lower secondary level of education generally continues the basic<br />
programmes of the primary level, although teaching is typically more subjectfocused,<br />
often employing more specialised teachers who conduct classes in<br />
their field of specialisation.<br />
Programmes at the start of level 2 correspond to the point where programmes are beginning to be<br />
organised in a more subject-oriented pattern, using more specialised teachers conducting classes in<br />
their field of specialisation.<br />
If this organizational transition point does not correspond to a natural split in the boundaries between<br />
national educational programmes, then programmes should be split at the point where national<br />
programmes begin to reflect this organisational change.<br />
3 UPPER SECONDARY LEVEL OF EDUCATION Main criteria<br />
The final stage of secondary education in most countries. Instruction is often<br />
more organised along subject-matter lines than at ISCED level 2 and teachers<br />
typically need to have a higher level, or more subject-specific, qualification<br />
than at ISCED 2.<br />
National boundaries between lower secondary and upper secondary education should be the dominant<br />
factor for splitting levels 2 and 3.<br />
Admission into programmes at this level usually requires the completion of ISCED 2 for admission, or<br />
a combination of basic education and life experience that demonstrates the ability to handle ISCED 3<br />
subject matter.<br />
4 POST-SECONDARY NON-TERTIARY Main criteria<br />
These programmes straddle the boundary between upper secondary and<br />
post-secondary education from an international point of view, even though<br />
they might clearly be considered as upper secondary or post-secondary<br />
programmes in a national context.<br />
They are often not significantly more advanced than programmes at ISCED<br />
3 but they serve to broaden the knowledge of participants who have already<br />
completed a programme at level 3. The students are typically older than<br />
those in ISCED 3 programmes.<br />
ISCED 4 programmes typically have a duration of 6 months to 2 years.<br />
Students entering ISCED 4 programmes will typically have completed ISCED 3.<br />
5 FIRST STAGE OF TERTIARY EDUCATION Classification criteria for level and sub-categories (5A and 5B)<br />
5A<br />
5B<br />
ISCED 5 programmes have an educational content more advanced than<br />
those offered at levels 3 and 4.<br />
ISCED 5A programmes are largely theoretically based and are intended<br />
to provide sufficient qualifications for gaining entry into advanced research<br />
programmes and professions with high skills requirements.<br />
ISCED 5B programmes are generally more practical/technical/occupationally<br />
specific than ISCED 5A programmes.<br />
Entry into these programmes normally requires the successful completion of ISCED level 3A or 3B or a<br />
similar qualification at ISCED level 4A.<br />
1. have a minimum cumulative theoretical duration (at tertiary level) of three years;<br />
2. typically require that the faculty have advanced research credentials;<br />
3. may involve completion of a research project or thesis;<br />
4. provide the level of education required for entry into a profession with high skills requirements or an<br />
advanced research programme.<br />
1. are more practically oriented and occupationally specific than programmes at ISCED 5A and do<br />
not prepare students for direct access to advanced research programmes;<br />
2. have a minimum of two years’ duration;<br />
3. the programme content is typically designed to prepare students to enter a particular occupation.<br />
6 SECOND STAGE OF TERTIARY EDUCATION (LEADING TO AN ADVANCED RESEARCH QUALIFICATION)<br />
This level is reserved for tertiary programmes that lead to the award of an<br />
advanced research qualification. The programmes are devoted to advanced<br />
study and original research.<br />
1. requires the submission of a thesis or dissertation of publishable quality that is the product of<br />
original research and represents a significant contribution to knowledge;<br />
2. are not solely based on course-work;<br />
3. prepare participants for faculty posts in institutions offering ISCED 5A programmes, as well as<br />
research posts in government and industry.<br />
72
OPPORTUNITIES LOST: THE IMPACT OF GRADE REPETITION AND EARLY SCHOOL LEAVING<br />
Auxilary criteria<br />
Sub-categories<br />
Pedagogical qualifications for the teaching staff;<br />
implementation of a curriculum with educational<br />
elements.<br />
Auxilary criteria<br />
In countries where the age of compulsory attendance<br />
(or at least the age at which virtually all students begin<br />
their education) comes after the beginning of systematic<br />
study in the subjects noted, the first year of compulsory<br />
attendance should be used to determine the boundary<br />
between ISCED 0 and ISCED 1.<br />
Auxilary criteria<br />
Destination for which the programmes have<br />
been designed to prepare students:<br />
Programme orientation<br />
If there is no clear break-point for this organisational<br />
change, however, then countries should artificially split<br />
national programmes into ISCED 1 and 2 at the end of<br />
six years of primary education.<br />
In countries with no system break between lower<br />
secondary and upper secondary education, and where<br />
lower secondary education lasts for more than 3<br />
years, only the first 3 years following primary education<br />
should be counted as lower secondary education.<br />
A<br />
B<br />
C<br />
Programmes designed to prepare students for direct<br />
access to level 3 in a sequence which would ultimately<br />
lead to tertiary education, that is, entrance to ISCED<br />
3A or 3B.<br />
Programmes designed to prepare students for direct<br />
access to programmes at level 3C.<br />
Programmes primarily designed for direct access to<br />
the labour market at the end of this level (sometimes<br />
referred to as ‘terminal’ programmes).<br />
General<br />
Vocational<br />
<strong>Education</strong> which is not designed explicitly to prepare<br />
participants for a specific class of occupations or<br />
trades or for entry into further vocational/technical<br />
education programmes.<br />
<strong>Education</strong> which prepares participants for direct entry,<br />
without further training, into specific occupations.<br />
Successful completion of such programmes leads to<br />
a labour-market relevant vocational qualification.<br />
Modular programmes<br />
Destination for which the programmes have<br />
been designed to prepare students:<br />
Programme orientation<br />
An educational qualification is earned in a modular<br />
programme by combining blocks of courses,<br />
or modules, into a programme meeting specific<br />
curricular requirements.<br />
A single module, however, may not have a specific<br />
educational or labour market destination or a particular<br />
programme orientation.<br />
A<br />
B<br />
C<br />
Programmes designed to provide direct access to<br />
ISCED 5A.<br />
Programmes designed to provide direct access to<br />
ISCED 5B.<br />
Programmes not designed to lead directly to ISCED 5A<br />
or 5B. Therefore, these programmes lead directly to the<br />
labour market, ISCED 4 programmes or other ISCED 3<br />
programmes.<br />
Vocational General<br />
<strong>Education</strong> which is not designed explicitly to prepare<br />
participants for a specific class of occupations or<br />
trades or for entry into further vocational/technical<br />
education programmes.<br />
<strong>Education</strong> which prepares participants for direct entry,<br />
without further training, into specific occupations.<br />
Successful completion of such programmes leads to<br />
a labour-market relevant vocational qualification.<br />
Types of programmes which can fit into level 4<br />
Destination for which the programmes have<br />
been designed to prepare students:<br />
Programme orientation<br />
The first type are short vocational programmes where<br />
either the content is not considered tertiary in many<br />
countries or the programmes do not meet the duration<br />
requirement for ISCED 5B – at least two years.<br />
These programmes are often designed for students who<br />
have completed level 3, although a formal ISCED level 3<br />
qualification may not be required for entry.<br />
The second type of programmes are nationally<br />
considered as upper secondary programmes, even<br />
though entrants to these programmes will have<br />
typically already completed another upper secondary<br />
programme (i.e. second-cycle programmes).<br />
A<br />
B<br />
Programmes designed to provide direct access to<br />
ISCED 5A or 5B.<br />
Programmes not designed to lead directly to ISCED 5A<br />
or 5B. These programmes lead directly to the labour<br />
market or other ISCED 4 programmes.<br />
Vocational General<br />
<strong>Education</strong> which is not designed explicitly to prepare<br />
participants for a specific class of occupations or<br />
trades or for entry into further vocational/technical<br />
education programmes.<br />
<strong>Education</strong> which prepares participants for direct entry,<br />
without further training, into specific occupations.<br />
Successful completion of such programmes leads to<br />
a labour-market relevant vocational qualification.<br />
Cumulative theoretical duration at tertiary<br />
Position in the national degree and<br />
qualifications structure<br />
A Duration categories: less than 5 years; 5 years or more. A Categories: First; Second or further.<br />
B Duration categories: None. B Categories: None.<br />
For a complete version of the ISCED97 classification, please see http://www.uis.unesco.org/publications/ISCED97<br />
73
A N N E X<br />
C REGIONS<br />
ARAB STATES (20 countries or territories)<br />
Respondents to UIS questionnaires:<br />
Respondents to WEI questionnaire:<br />
Algeria, Bahrain, Djibouti, Iraq, Kuwait, Lebanon, Libya, Mauritania, Morocco,<br />
Oman, Palestine, Qatar, Saudi Arabia, Sudan (pre-secession) a , Syrian Arab<br />
Republic, United Arab Emirates, Yemen.<br />
Egypt, Jordan, Tunisia.<br />
CENTRAL AND EASTERN EUROPE (21 countries or territories)<br />
Respondents to UIS questionnaires:<br />
Respondents to UOE questionnaire:<br />
Belarus, Montenegro, Republic of Moldova, Serbia, Ukraine.<br />
Albania, Bosnia and Herzegovina, Bulgaria, Croatia, Czech Republic, Estonia,<br />
Hungary, Latvia, Lithuania, Poland, Romania, Russian Federation, Slovakia,<br />
Slovenia, The former Yugoslav Republic of Macedonia, Turkey.<br />
CENTRAL ASIA (9 countries or territories)<br />
Respondents to UIS questionnaires:<br />
Armenia, Azerbaijan, Georgia, Kazakhstan, Kyrgyzstan, Mongolia, Tajikistan,<br />
Turkmenistan, Uzbekistan.<br />
EAST ASIA AND THE PACIFIC (34 countries or territories)<br />
Respondents to UIS questionnaires:<br />
Respondents to UOE or WEI questionnaires:<br />
Brunei Darussalam, Cambodia, China, Special Administrative Region of Hong<br />
Kong, China, Special Administrative Region of Macao, Cook Islands, Democratic<br />
People’s Republic of Korea, Fiji, Kiribati, Lao People’s Democratic Republic,<br />
Marshall Islands, Micronesia (Federated States of), Myanmar, Nauru, Niue, Palau,<br />
Papua New Guinea, Samoa, Singapore , Solomon Islands, Timor-Leste, Tokelau,<br />
Tonga, Tuvalu, Vanuatu, Viet Nam.<br />
Australia, China, Indonesia, Japan, Malaysia, New Zealand, Philippines, Republic<br />
of Korea, Thailand.<br />
LATIN AMERICA AND THE CARIBBEAN (42 countries or territories)<br />
Respondents to UIS questionnaires:<br />
Respondents to UOE or WEI questionnaires:<br />
Anguilla, Antigua and Barbuda, Aruba, Bahamas, Barbados, Belize, Bermuda,<br />
Bolivia (Plurinational State of), British Virgin Islands, Cayman Islands, Colombia,<br />
Costa Rica, Cuba, Dominica, Dominican Republic, Ecuador, El Salvador,<br />
Grenada, Guatemala, Guyana, Haiti, Honduras, Montserrat, Netherlands Antilles a ,<br />
Nicaragua, Panama, Puerto Rico, Saint Kitts and Nevis, Saint Lucia, Saint Vincent<br />
and the Grenadines, Suriname, Trinidad and Tobago, Turks and Caicos Islands,<br />
Venezuela (Bolivarian Republic of).<br />
Argentina, Brazil, Chile, Jamaica, Mexico, Paraguay, Peru, Uruguay.<br />
74
OPPORTUNITIES LOST: THE IMPACT OF GRADE REPETITION AND EARLY SCHOOL LEAVING<br />
NORTH AMERICA AND WESTERN EUROPE (29 countries or territories)<br />
Respondents to UIS questionnaires:<br />
Respondents to UOE questionnaire:<br />
Andorra, Gibraltar, Holy See, Monaco, San Marino.<br />
Austria, Belgium, Canada, Cyprus, Denmark, Finland, France, Germany, Greece,<br />
Iceland, Ireland, Israel, Italy, Liechtenstein, Luxembourg, Malta, Netherlands,<br />
Norway, Portugal, Spain, Sweden, Switzerland, United Kingdom of Great Britain<br />
and Northern Ireland, United States of America.<br />
SOUTH AND WEST ASIA (9 countries or territories)<br />
Respondents to UIS questionnaires:<br />
Respondents to WEI questionnaire:<br />
Afghanistan, Bangladesh, Bhutan, Iran (Islamic Republic of), Maldives (MDV),<br />
Nepal, Pakistan.<br />
India, Sri Lanka.<br />
SUB-SAHARAN AFRICA (45 countries or territories)<br />
Respondents to UIS questionnaires:<br />
Angola, Benin, Botswana, Burkina Faso, Burundi, Cameroon, Cape Verde,<br />
Central African Republic, Chad, Comoros, Congo, Côte d’Ivoire, Democratic<br />
Republic of the Congo, Equatorial Guinea, Eritrea, Ethiopia, Gabon, Gambia,<br />
Ghana, Guinea, Guinea-Bissau, Kenya, Lesotho, Liberia, Madagascar, Malawi,<br />
Mali, Mauritius, Mozambique, Namibia, Niger, Nigeria, Rwanda, Sao Tome and<br />
Principe, Senegal, Seychelles, Sierra Leone, Somalia, South Africa, Swaziland,<br />
Togo, Uganda, United Republic of Tanzania, Zambia, Zimbabwe.<br />
75
A N N E X<br />
D ELECTRONIC RESOURCES<br />
UIS DATA CENTRE<br />
The printed version of the <strong>Global</strong> <strong>Education</strong> <strong>Digest</strong> provides a subset of the internationally comparable<br />
statistics found in the UIS Data Centre, which can be accessed free of charge at the Institute’s website:<br />
http://stats.uis.unesco.org<br />
The Data Centre contains almost 1,000 education indicators and underlying data. It covers all levels of education<br />
from pre-primary to tertiary and includes topics such as access, participation, progression, completion, teachers<br />
and finance.<br />
The Data Centre also includes a range of tools to facilitate data access and analysis, including:<br />
••<br />
Country profiles highlighting key education indicators;<br />
••<br />
Tools to build and store statistical tables and graphs; and<br />
••<br />
UIS survey instruments, classifications and methodological documents.<br />
TIME SERIES<br />
The Data Centre contains indicators and underlying data for 1999 onwards, based on the ISCED 1997<br />
classification. In addition, the UIS incorporated a smaller set of indicators in a separate historical database,<br />
covering indicators on school participation, progression and resources for the period 1970 to 1999. Literacy<br />
rates are available since 1975.<br />
DATA UPDATES<br />
The Data Centre is updated in January, May and October of each year. This report contains data from the May<br />
<strong>2012</strong> release. Data received from countries after this date will be incorporated into the October release.<br />
DOCUMENTATION AND PUBLICATIONS<br />
All UIS publications and surveys are posted on the UIS website in different languages http://www.uis.unesco.org<br />
UIS eALERT<br />
Please consult the UIS website to subscribe to eAlerts and receive e-mail notifications of new reports and data<br />
releases.<br />
CD-ROM<br />
Additional electronic resources and a detailed set of raw data and indicators are available on the <strong>Global</strong><br />
<strong>Education</strong> <strong>Digest</strong> CD-ROM. To order a copy, please send your request to publications@uis.unesco.org<br />
76
A N N E X<br />
E<br />
READER’S GUIDE<br />
REFERENCE YEAR<br />
The reference year for education and finance data which are presented in the statistical tables is the academic<br />
or financial year ending in 2010 or the most recent year available within the period 2008 to 2011. For a small<br />
number of countries, data for 2011 are available.<br />
Where a given reference period is spread across two calendar years, the later year is cited. For example, the<br />
school year 2009/2010 is presented as 2010.<br />
Literacy indicators refer to the most recent data available within a given period. When observed data are only<br />
available prior to 2005, estimates generated with the UIS <strong>Global</strong> Age-Specific Literacy Projections Model (GALP)<br />
for 2010 are presented. The reference period for regional averages is 2005 to 2010.<br />
Data on educational attainment are the latest available.<br />
Countries that completed the joint UNESCO/OECD/Eurostat (UOE) questionnaire were requested to provide<br />
education finance and expenditure data corresponding to the financial year 2009 or the most recent year<br />
available.<br />
Data presented in the analytical chapter may not always be included in the statistical tables, but the latest<br />
releases of all UIS statistics can be referenced at the UIS Data Centre http://stats.uis.unesco.org<br />
DATA SOURCES<br />
<strong>Education</strong><br />
The UIS compiles education statistics in aggregate form from official administrative sources at the national<br />
level. These include data on educational programmes, access, participation, progression, completion, internal<br />
efficiency, and human and financial resources. They cover:<br />
••<br />
education in pre-primary, primary, basic and secondary schools, and in colleges, universities and other tertiary<br />
education institutions;<br />
••<br />
education in public (or state) and private sectors; and<br />
••<br />
special needs education (both in regular and special schools).<br />
These data are collected annually by the UIS and its partner agencies through the following three major surveys<br />
that can be downloaded from the UIS website http://www.uis.unesco.org/UISQuestionnaires<br />
i) UIS survey<br />
The UIS education questionnaires are sent to UNESCO Member States annually. The questionnaires are based<br />
on international standards, classifications and measures that are regularly reviewed and modified by the UIS in<br />
order to address emerging statistical issues and improve the quality of data. The countries that participate in the<br />
UIS survey are listed in Annex C.<br />
77
READER’S GUIDE<br />
ii) UOE survey<br />
UNESCO, the OECD and Eurostat (UOE) have jointly administered this annual data collection since 1993. The<br />
UOE questionnaire compiles data from high- and middle-income countries that are generally members or partner<br />
countries of the OECD or the European Union. The UOE survey collects more detailed education statistics and<br />
allows for the production of a wider set of indicators, as presented in Statistical Tables 16-22. The countries that<br />
participate in the UOE data collection are listed in Annex C.<br />
iii) WEI programme<br />
The World <strong>Education</strong> Indicators (WEI) programme provides a platform for middle-income countries to develop a<br />
critical mass of policy-relevant indicators beyond the global core set of education statistics. This also allows for<br />
direct comparisons with countries participating in the UOE survey as the collection of data from WEI countries is<br />
based on a same common set of definitions, instructions and methods.<br />
Participating countries in the WEI data collection are: Argentina, China, Egypt, India, Indonesia, Jamaica,<br />
Jordan, Malaysia, Paraguay, Peru, the Philippines, Sri Lanka, Thailand, Tunisia and Uruguay. The UIS hosts the<br />
secretariat for the WEI programme.<br />
Literacy<br />
All literacy data are UIS estimates unless otherwise noted.<br />
Literacy statistics for youth aged 15 to 24 years and adults aged 15 years and older are obtained from national<br />
population censuses, household surveys, and estimates using the UIS <strong>Global</strong> Age-Specific Literacy Projections<br />
Model (GALP) http://www.uis.unesco.org/publications/GALP. The UIS literacy questionnaire can be<br />
downloaded at http://www.uis.unesco.org/UISQuestionnaires/Documents/UIS_LIT_<strong>2012</strong>_EN.pdf<br />
Data sources, reference years and national definitions are available in the literacy metadata table available in the<br />
UIS Data Centre http://stats.uis.unesco.org<br />
<strong>Education</strong>al attainment<br />
Statistics on educational attainment for the population aged 25 years and older are based on national population<br />
censuses or surveys.<br />
Population<br />
Population statistics for countries with at least 50,000 inhabitants are provided by the United Nations Population<br />
Division, based on the 2010 Revision of the World Population Prospects. For more information on UN Population<br />
Division estimates, please visit http://www.un.org/esa/population/unpop.htm<br />
For countries where UN Population Division data are not available, the UIS derives estimates by single-year of<br />
age from other sources, such as Eurostat (Demographic Statistics), the Secretariat of the Pacific Community<br />
(Statistics for Development Programme) and national statistical offices.<br />
Population-based indicators are listed as missing (…) when population data are not available or not considered<br />
reliable. In exceptional cases, the UIS uses national data when enrolment data collected by the UIS and<br />
population data produced by the UN Population Division are not consistent.<br />
<strong>Education</strong> indicators based on population estimates by age and sex for countries with a total population under<br />
100,000 inhabitants should be interpreted with caution due to fluctuations in migration and other factors.<br />
78
OPPORTUNITIES LOST: THE IMPACT OF GRADE REPETITION AND EARLY SCHOOL LEAVING<br />
Economic data<br />
Data on economic indicators such as gross domestic product (GDP) and purchasing power parity (PPP) are<br />
based on the World Bank’s World Development Indicators database of April <strong>2012</strong>. For a small group of countries<br />
where World Bank estimates are not available, data are obtained from the United Nations Statistics Division<br />
(UNSD).<br />
Economic-based indicators are listed as missing (…) when economic data are not available or not considered<br />
reliable.<br />
TECHNICAL NOTES<br />
<strong>Education</strong> data and indicators<br />
Regional averages are based on publishable data, as well as imputed values for missing or unpublishable data<br />
for each country within a given region.<br />
Where the publishable data represent between 33% and 60% of the relevant population, the regional average is<br />
marked with the symbol **.<br />
Where the publishable data represent less than 33% of the regional population, the average is not published.<br />
Where the publishable data represent 60% or more of the original population, the average is considered as<br />
observed.<br />
Where data inconsistencies result in an indicator exceeding its theoretical maximum (e.g. 100% in the case of<br />
the net enrolment rate), it is “capped” in such a way as to maintain the same ratio between male and female<br />
values (see Annex A).<br />
Due to rounding, gender parity indices (GPI) may differ from those based directly on the published values of<br />
indicators. Similarly, totals may not always be the sum of their component parts.<br />
The percentage of females (% F) is included to provide information on the proportion of women in a given<br />
population (e.g. enrolment, graduates or teachers). For assessing gender parity, a more relevant measure is the<br />
GPI.<br />
<strong>Education</strong> finance<br />
Expenditure on pre-primary education or from international sources – both of which are often comparatively<br />
small – have been treated as negligible in cases where data were in fact missing. In these cases, total education<br />
expenditure may be underestimated.<br />
<strong>Education</strong>al attainment<br />
Data on educational attainment are presented by ISCED level. In addition to the categories related to completed<br />
education levels, three other columns are presented in Table 15:<br />
••<br />
“No schooling” refers to the percentage of the population without any formal schooling;<br />
••<br />
“Incomplete primary” refers to the percentage of the population that has attended primary education but not<br />
completed the level; and<br />
••<br />
“Unknown” refers to the percentage of the population for which the educational level could not be<br />
determined.<br />
79
READER’S GUIDE<br />
Population issues: Country Notes<br />
Azerbaijan:.<strong>Education</strong> data do not cover the region of Nagorno-Karabakh, whereas UN Population Division data<br />
do. Therefore, the population data used for the calculation of indicators were provided by Eurostat and exclude<br />
Nagorno-Karabakh.<br />
Cyprus:.<strong>Education</strong> data do not cover the population living outside the government-controlled area, whereas<br />
the UN Population Division data do. The population data used for the calculation of indicators were provided by<br />
Eurostat and only cover the population living in the government-controlled area.<br />
Republic of Moldova:.<strong>Education</strong> data do not cover the region of Transnistria, whereas the UN Population<br />
Division data do. The population data used for the calculation of indicators were provided by Eurostat and<br />
exclude Transnistria.<br />
Serbia:.<strong>Education</strong> data do not cover Kosovo, whereas the UN Population Division data do. The population data<br />
used for the calculation of indicators were provided by Eurostat and exclude Kosovo.<br />
Palestine:.<strong>Education</strong> data do not cover East Jerusalem, whereas the UN Population Division data do. Therefore,<br />
indicators should be interpreted with caution.<br />
United Republic of Tanzania:.<strong>Education</strong> data do not include Zanzibar, whereas the UN Population Division data<br />
do. Therefore, indicators should be interpreted with caution.The population of Zanzibar is approximately 3% of<br />
the total population of Tanzania.<br />
Student mobility<br />
<strong>International</strong>/mobile students are defined as foreign students who have crossed a national border and moved to<br />
another country with the objective to study. This group is commonly categorised by two operational definitions:<br />
i) a student’s country of permanent or usual residence; or ii) their country of prior education. The Institute only<br />
accepts country of citizenship as a proxy for countries/territories where residence or prior education are not<br />
available, as in the cases of: Austria, Cameroon, Chile, the Czech Republic, Finland, France, Greece, Hungary,<br />
India, Indonesia, Italy, Japan, Jordan, Kuwait, Madagascar, Malaysia, Malta, Oman, the Philippines, Poland,<br />
Qatar, the Republic of Korea, Romania, the Russian Federation, Saudi Arabia, South Africa, the former Yugoslav<br />
Republic of Macedonia and Turkey.<br />
In order to improve the coverage of data on international/mobile students, the UIS includes partial data for some<br />
host countries. Partial data (Statistical Table 9) are included for the following host countries: Canada, Costa Rica,<br />
Kuwait, the Netherlands and South Africa (public institutions only), and Germany and the Russian Federation<br />
(ISCED 5 only).<br />
Data on international/mobile students are reported by host countries. However, not all countries report such<br />
data regularly. In order to estimate the number of students from a given country who are studying abroad, the<br />
outbound mobility ratio (Statistical Table 10) as well as regional totals (Statistical Table 9) for the most recent year<br />
since 1999 are used to impute for missing data.<br />
It is worth noting that substantial numbers of students from countries with limited provision of higher education<br />
enrol in tertiary programmes outside their country of origin. The outbound mobility ratio (Statistical Table 10)<br />
shows the magnitude of this phenomenon.<br />
80
OPPORTUNITIES LOST: THE IMPACT OF GRADE REPETITION AND EARLY SCHOOL LEAVING<br />
Technical and vocational education and training (TVET) data<br />
Technical and vocational enrolment data are not comparable between countries participating in the UIS survey<br />
and those participating in the UOE survey or WEI programme, because the content of technical and vocational<br />
enrolment is different between these two groups of countries.<br />
Technical and vocational enrolment includes the following data:<br />
••<br />
Countries responding to the UIS survey: Data reflect vocational enrolment only (not including enrolment in<br />
pre-vocational and/or adult education programmes).<br />
••<br />
Countries responding to UOE/WEI surveys: Data reflect the sum of pre-vocational and vocational enrolment.<br />
Enrolment in adult education programme is included in some countries.<br />
While enrolment in technical and vocational programmes as a percentage of total enrolment in secondary<br />
education (ISCED 2 and 3) is presented in the <strong>Digest</strong>, in many countries the category of technical and vocational<br />
programmes is not applicable at the level of ISCED 2. Ideally this indicator should be reported by separate<br />
ISCED level.<br />
UOE/WEI data (Statistical Tables 16-22)<br />
Statistical Tables 16-22 provide an additional set of indicators based on the UOE and WEI questionnaires.<br />
Results are presented for participating countries only, and indicators are calculated by the UIS based on national<br />
data submissions.<br />
For OECD countries and partner countries, indicators and data used in Statistical Tables 19-21 are<br />
a subset of those presented in the <strong>2012</strong> edition of OECD’s <strong>Education</strong> at a Glance (EAG), available at<br />
http://www.oecd.org/edu/eag<strong>2012</strong><br />
81
A N N E X<br />
F<br />
STATISTICAL TABLES<br />
The following symbols are used in the statistical tables:<br />
…<br />
No data available<br />
* National estimation<br />
** For country data: UIS estimation<br />
For regional averages: Partial imputation due to incomplete country coverage<br />
(between 33% to 60% of population)<br />
— Magnitude nil or negligible<br />
. Not applicable<br />
x(y)<br />
Data are included in column (y) of the table<br />
+n Data refer to the school or financial year n years after the reference year<br />
-n Data refer to the school or financial year n years prior to the reference year<br />
The following footnotes are used in the statistical tables:<br />
a<br />
The statistical tables include the following entities according to their political status during the main reference<br />
year of this report (i.e. the school year ending in 2010): Netherlands Antilles prior to its dissolution on 10<br />
October 2010 and Sudan prior to the secession of South Sudan on 9 July 2011. Data are not yet available for<br />
Curaçao, Sint Maarten, South Sudan or Sudan.<br />
b<br />
Data on trained teachers can be found in the UIS Data Centre at http://stats.uis.unesco.org<br />
c<br />
Incomplete data. For details, see note on student mobility in the Reader’s Guide.<br />
d<br />
These countries are part of the World <strong>Education</strong> Indicators (WEI) programme and are not required to provide<br />
graduates by field of study.<br />
e<br />
These countries have completed the UNESCO/OECD/Eurostat (UOE) questionnaires. Data by field of study<br />
refer to graduations rather than graduates.<br />
f<br />
Data were collected in a national survey or census in the reference year.<br />
g<br />
Data refer to the population aged 16 years and older.<br />
82
OPPORTUNITIES LOST: THE IMPACT OF GRADE REPETITION AND EARLY SCHOOL LEAVING<br />
h<br />
Literacy rates are estimates for the current decade based on survey or census data from the previous<br />
decade. Refer to the metadata table in the UIS Data Centre at http://stats.uis.unesco.org for more<br />
information.<br />
i<br />
j<br />
UIS estimates for Sudan (pre-secession) are based on literacy data collected in Northern Sudan (presecession).<br />
Youth literacy rates are from a national survey; adult literacy rates are UIS estimates.<br />
k<br />
Data refer to the population aged 25-74 years.<br />
l<br />
“World (not specified)” denotes the number of mobile students whose country of origin is unknown.<br />
o<br />
Actual teaching and working time.<br />
p<br />
Teachers’ annual salaries are expressed as gross salaries without additional bonuses for teachers with the<br />
minimum training.<br />
q<br />
PPP rates used in Table 13 are based on GDP to reflect how much governments spend on education. PPP<br />
rates for teachers’ salaries in Table 21 are based on private consumption, to better capture the purchasing<br />
power of teachers. In previous editions of the GED, these latter PPPs were also based on GDP.<br />
r<br />
As a result of the education system reform which began in 2003, two cohorts of primary completers entered<br />
secondary education in 2009. This has led to a gross entry ratio of 200%.<br />
s<br />
Literacy indicators refer to the most recent year available within a census decade: 1990 represents 1985-<br />
1994, 2000 represents 1995-2004, and 2010 represents 2005-2010.<br />
t<br />
Not all countries or territories report the number of internationally mobile students that they host, and thus the<br />
number of inbound mobile students in a given region may be underestimated.<br />
u<br />
Data on internationally mobile students reported by host countries are used to estimate the number<br />
of outbound students from a given country. Not all host countries specify the country of origin of the<br />
internationally mobile students that they host, and thus the number of outbound students from a given<br />
country may be underestimated.<br />
v<br />
Not all countries or territories report the country of origin of the internationally mobile students that they host,<br />
and thus the total number of internationally mobile students from a given region may be underestimated. The<br />
number of students whose region of origin is not known are reported in “World not specified”.<br />
83
OPPORTUNITIES LOST: THE IMPACT OF GRADE REPETITION AND EARLY SCHOOL LEAVING<br />
List of statistical tables<br />
1. Pre-primary education / ISCED 0 / Measures of enrolment / 2010 86<br />
2. Primary education / ISCED 1 / Compulsory education, new entrants and measures<br />
of enrolment / 2010 90<br />
3. Primary and lower secondary education / ISCED 1 and 2 / Measures of progression and<br />
completion / 2010 98<br />
4. Primary and lower secondary education / ISCED 1 and 2 / Out-of-school children / 2010 106<br />
5. Primary and secondary education / ISCED 1, 2 and 3 / Repetition / 2010 110<br />
6. Secondary education / ISCED 2 and 3 / Measures of enrolment / 2010 114<br />
7. Pre-primary, primary and secondary education / ISCED 0-3 / Teaching staff b / 2010 118<br />
8. Tertiary education / ISCED 5 and 6 / Enrolment, graduation and teaching staff / 2010 122<br />
9. Tertiary education / ISCED 5 and 6 / <strong>International</strong>ly mobile students by host country and region of<br />
origin t / 2010 130<br />
10. Tertiary education / ISCED 5 and 6 / <strong>International</strong> flows of mobile students u / 2010 134<br />
11. Tertiary education / ISCED 5 and 6 / Graduates by broad fields of education / 2010 138<br />
12. School life expectancy / ISCED 0-6 / 2010 146<br />
13. Public expenditure on education by nature of spending / ISCED 1-6 / Financial year ending in 2010 154<br />
14. Adult and youth literacy / 2005-2010 162<br />
15. <strong>Education</strong>al attainment of the population aged 25 years and older / ISCED 0-6 /<br />
Latest year available 166<br />
WEI and UOE countries<br />
16. Primary and secondary education / ISCED 1, 2 and 3 / Distribution of students by<br />
type of institution / 2010 174<br />
17. Tertiary education / ISCED 5 and 6 / Distribution of students by type of institution / 2010 175<br />
18. Primary and lower secondary education / ISCED 1 and 2 / Average class size by type of i<br />
nstitution / 2010 176<br />
19. Intended instruction time (hours per year) for students (9 to 14 years) in public institutions / 2010 178<br />
20. Primary and secondary education / ISCED 1, 2 and 3 / Organization of teachers’ instructional<br />
time in public institutions / 2010 179<br />
21. Primary and secondary education / ISCED 1, 2 and 3 / Teachers’ annual salaries p in public<br />
institutions (in PPP q U.S. dollars) / 2010 180<br />
22. Primary and secondary education / ISCED 1, 2 and 3 / Teachers’ annual salaries p in public<br />
institutions as a percentage of GDP per capita / 2010 182<br />
Trends<br />
23. Trend data / Key indicators / Selected years 184<br />
To access the electronic version of the data tables, see www.uis.unesco.org/publications/GED<strong>2012</strong><br />
To access the full data set, see the UIS Data Centre at http://stats.uis.unesco.org<br />
85
TABLE<br />
1<br />
PRE-PRIMARY EDUCATION / ISCED 0 / Measures of enrolment / 2010<br />
REGION<br />
Country or territory<br />
ARAB STATES<br />
Age<br />
Enrolment Gross enrolment ratio Net enrolment rate<br />
group MF<br />
(000) % F % private MF M F GPI MF M F GPI<br />
(1) (2) (3) (4) (5) (6) (7) (8) (9) (10) (11) (12)<br />
Algeria 5-5 500 48 14 77 79 76 0.96 70 72 67 0.94<br />
Bahrain 3-5 26 49 100 ... ... ... ... ... ... ... ...<br />
Djibouti 4-5 2 +1 49 +1 65 +1 4 +1 4 +1 4 +1 0.97 +1 3 +1 3 +1 3 +1 0.97 +1<br />
Egypt 4-5 814 -1 48 -1 ... 24 -1 24 -1 23 -1 0.95 -1 21 ** , -1 22 ** , -1 20 ** , -1 0.95 ** , -1<br />
Iraq 4-5 ... ... ... ... ... ... ... ... ... ... ...<br />
Jordan 4-5 99 47 83 32 33 31 0.94 32 33 31 0.94<br />
Kuwait 4-5 74 49 43 ... ... ... ... 68 -2 68 -2 69 -2 1.02 -2<br />
Lebanon 3-5 154 48 81 81 82 81 0.98 79 79 78 0.98<br />
Libya 4-5 ... ... ... ... ... ... ... ... ... ... ...<br />
Mauritania 3-5 ... ... ... ... ... ... ... ... ... ... ...<br />
Morocco 4-5 740 +1 41 +1 92 +1 63 +1 73 +1 53 +1 0.72 +1 55 +1 64 +1 45 +1 0.70 +1<br />
Oman 4-5 46 49 ... 45 45 45 0.99 33 33 33 0.99<br />
Palestine 4-5 91 48 100 39 40 39 0.98 32 33 32 0.98<br />
Qatar 3-5 25 -1 47 -1 87 -1 55 -1 57 -1 54 -1 0.96 -1 49 -1 51 -1 48 -1 0.94 -1<br />
Saudi Arabia 3-5 190 ... 51 11 ... ... ... 10 ** , -2 11 ** , -2 10 ** , -2 0.95 ** , -2<br />
Sudan (pre-secession) a 4-5 632 -1 50 -1 23 -1 27 -1 26 -1 27 -1 1.04 -1 ... ... ... ...<br />
Syrian Arab Republic 3-5 149 47 72 10 10 9 0.97 10 10 9 0.97<br />
Tunisia 3-5 ... ... ... ... ... ... ... ... ... ... ...<br />
United Arab Emirates 4-5 125 49 79 ... ... ... ... ... ... ... ...<br />
Yemen 3-5 26 46 52 1 1 1 0.90 — — — 1.02<br />
CENTRAL AND EASTERN EUROPE<br />
Albania 3-5 75 47 5 56 56 55 0.98 53 53 52 0.98<br />
Belarus 3-5 282 48 ... 99 100 98 0.98 89 89 89 1.00<br />
Bosnia and Herzegovina 3-5 17 48 15 17 17 17 0.99 12 12 12 1.01<br />
Bulgaria 3-6 218 48 1 79 80 79 0.99 76 76 76 0.99<br />
Croatia 3-6 99 48 14 61 62 61 0.98 61 61 61 0.99<br />
Czech Republic 3-5 304 -1 48 -1 2 -1 106 -1 107 -1 105 -1 0.98 -1 ... ... ... ...<br />
Estonia 3-6 51 -1 49 -1 3 -1 96 -1 96 -1 96 -1 1.00 -1 92 -1 91 -1 92 -1 1.01 -1<br />
Hungary 3-6 326 -1 48 -1 6 -1 85 -1 85 -1 84 -1 0.98 -1 84 -1 84 -1 83 -1 0.99 -1<br />
Latvia 3-6 71 48 3 84 85 82 0.96 82 83 81 0.97<br />
Lithuania 3-6 88 48 1 74 75 73 0.97 73 74 72 0.98<br />
Montenegro 3-6 10 47 . 31 32 30 0.96 31 ... ... ...<br />
Poland 3-6 919 -1 49 -1 12 -1 66 -1 65 -1 66 -1 1.01 -1 64 -1 63 -1 64 -1 1.01 -1<br />
Republic of Moldova 3-6 112 48 — 76 * 76 * 75 * 0.98 * 74 * 74 * 74 * 0.99 *<br />
Romania 3-6 666 49 2 79 79 79 1.01 78 77 78 1.01<br />
Russian Federation 3-6 5,105 -1 48 -1 1 -1 90 -1 91 -1 89 -1 0.98 -1 73 -1 73 -1 72 -1 0.99 -1<br />
Serbia 3-6 158 49 1 53 * 53 * 53 * 1.01 * 52 * 52 * 53 * 1.01 *<br />
Slovakia 3-5 143 48 4 91 92 90 0.98 ... ... ... ...<br />
Slovenia 3-5 46 -1 48 -1 2 -1 86 -1 87 -1 85 -1 0.98 -1 85 -1 86 -1 84 -1 0.98 -1<br />
The former Yugoslav Rep. of Macedonia 3-5 17 49 . 25 25 26 1.05 24 24 25 1.03<br />
Turkey 3-5 805 -1 48 -1 9 -1 22 -1 22 -1 21 -1 0.95 -1 22 -1 22 -1 21 -1 0.95 -1<br />
Ukraine 3-5 1,214 48 1 97 99 96 0.97 ... ... ... ...<br />
CENTRAL ASIA<br />
Armenia 3-6 54 50 1 31 29 34 1.15 ... ... ... ...<br />
Azerbaijan 3-5 92 46 1 25 * 26 * 25 * 0.97 * 22 * 22 * 21 * 0.98 *<br />
Georgia 3-5 79 -2 51 ** , -2 — -2 58 -2 52 ** , -2 64 ** , -2 1.23 ** , -2 ... ... ... ...<br />
Kazakhstan 3-6 520 +1 48 +1 5 +1 48 +1 48 +1 47 +1 0.99 +1 47 +1 48 +1 47 +1 0.99 +1<br />
Kyrgyzstan 3-6 76 50 3 19 19 19 1.02 16 16 16 1.02<br />
Mongolia 3-5 109 50 6 77 76 79 1.03 58 57 58 1.03<br />
Tajikistan 3-6 58 44 ... 9 9 8 0.84 7 7 6 0.84<br />
Turkmenistan 3-6 ... ... ... ... ... ... ... ... ... ... ...<br />
Uzbekistan 3-6 523 +1 49 +1 1 +1 26 +1 26 +1 26 +1 1.00 +1 20 +1 20 +1 20 +1 1.01 +1<br />
EAST ASIA AND THE PACIFIC<br />
Australia 4-4 218 48 75 78 79 78 0.98 51 52 51 0.98<br />
Brunei Darussalam 4-5 13 49 72 88 88 88 1.00 65 64 65 1.02<br />
Cambodia 3-5 115 50 ... 13 13 13 1.04 13 13 13 1.04<br />
China 4-6 26,578 45 43 54 54 54 1.01 ... ... ... ...<br />
86
OPPORTUNITIES LOST: THE IMPACT OF GRADE REPETITION AND EARLY SCHOOL LEAVING<br />
REGION<br />
Country or territory<br />
Age<br />
Enrolment Gross enrolment ratio Net enrolment rate<br />
group MF<br />
(000) % F % private MF M F GPI MF M F GPI<br />
(1) (2) (3) (4) (5) (6) (7) (8) (9) (10) (11) (12)<br />
China, Hong Kong SAR 3-5 142 48 99 ... ... ... ... ... ... ... ...<br />
China, Macao SAR 3-5 10 48 97 80 83 78 0.94 78 80 75 0.94<br />
Cook Islands 4-4 1 +1 49 +1 34 +1 181 * , +1 180 * , +1 181 * , +1 1.01 * , +1 ... ... ... ...<br />
Democratic People’s Republic of Korea 5-6 ... ... ... ... ... ... ... ... ... ... ...<br />
Fiji 3-5 9 -1 50 -1 ... 18 -1 17 -1 19 -1 1.07 -1 ... ... ... ...<br />
Indonesia 5-6 3,863 50 97 43 43 44 1.03 31 31 31 1.02<br />
Japan 3-5 2,904 ... 70 88 ... ... ... 88 ... ... ...<br />
Kiribati 3-5 ... ... ... ... ... ... ... ... ... ... ...<br />
Lao People’s Democratic Republic 3-5 91 50 22 22 22 22 1.04 21 21 22 1.04<br />
Malaysia 4-5 786 -1 50 -1 46 -1 67 -1 64 -1 69 -1 1.08 -1 58 -1 56 -1 60 -1 1.07 -1<br />
Marshall Islands 4-5 1 +1 50 +1 18 +1 46 +1 45 +1 47 +1 1.05 +1 ... ... ... ...<br />
Micronesia (Federated States of) 3-5 ... ... ... ... ... ... ... ... ... ... ...<br />
Myanmar 3-4 159 51 61 10 10 10 1.06 10 10 10 1.06<br />
Nauru 3-5 1 -2 50 -2 ... 94 * , -2 96 * , -2 93 * , -2 0.97 * , -2 ... ... ... ...<br />
New Zealand 3-4 111 50 98 93 91 95 1.04 92 90 94 1.04<br />
Niue 4-4 ... ... ... ... ... ... ... ... ... ... ...<br />
Palau 3-5 ... ... ... ... ... ... ... ... ... ... ...<br />
Papua New Guinea 6-6 178 -2 48 -2 ... 100 -2 101 -2 99 -2 0.98 -2 ... ... ... ...<br />
Philippines 5-5 1,166 -1 49 -1 37 -1 51 -1 51 -1 52 -1 1.02 -1 39 -1 38 -1 39 -1 1.01 -1<br />
Republic of Korea 3-5 1,538 48 83 119 118 119 1.01 85 85 85 1.01<br />
Samoa 3-4 4 52 100 38 35 41 1.19 24 22 26 1.19<br />
Singapore 3-5 ... ... ... ... ... ... ... ... ... ... ...<br />
Solomon Islands 3-5 23 49 ... 49 49 50 1.03 ... ... ... ...<br />
Thailand 3-5 2,755 +1 48 +1 20 +1 100 +1 101 +1 100 +1 0.99 +1 93 +1 92 +1 93 +1 1.01 +1<br />
Timor-Leste 4-5 ... ... ... ... ... ... ... ... ... ... ...<br />
Tokelau 3-4 ... ... ... ... ... ... ... ... ... ... ...<br />
Tonga 3-4 ... ... ... ... ... ... ... ... ... ... ...<br />
Tuvalu 3-5 ... ... ... ... ... ... ... ... ... ... ...<br />
Vanuatu 3-5 11 49 ... 59 58 59 1.01 41 40 42 1.05<br />
Viet Nam 3-5 3,410 47 47 82 84 79 0.94 65 ... ... ...<br />
LATIN AMERICA AND THE CARIBBEAN<br />
Anguilla 3-4 0.4 45 100 ... ... ... ... 95 ** , -2 99 ** , -2 91 ** , -2 0.92 ** , -2<br />
Antigua and Barbuda 3-4 2 -2 49 -2 100 -2 76 -2 76 -2 76 -2 1.00 -2 70 -2 70 -2 70 -2 0.99 -2<br />
Argentina 3-5 1,462 -1 50 -1 32 -1 74 -1 73 -1 75 -1 1.02 -1 73 -1 73 -1 74 -1 1.02 -1<br />
Aruba 4-5 3 48 75 112 115 109 0.94 98 -1 100 -1 96 -1 0.96 -1<br />
Bahamas 3-4 ... ... ... ... ... ... ... ... ... ... ...<br />
Barbados 3-4 6 * 50 * 16 * 108 * 108 * 108 * 1.00 * 96 * 95 * 96 * 1.01 *<br />
Belize 3-4 7 51 85 46 45 47 1.06 44 43 45 1.05<br />
Bermuda 4-4 ... ... ... ... ... ... ... ... ... ... ...<br />
Bolivia (Plurinational State of) 4-5 222 -1 49 -1 12 -1 45 -1 45 -1 45 -1 1.01 -1 32 -1 32 -1 32 -1 1.02 -1<br />
Brazil 4-6 6,792 49 27 ... ... ... ... ... ... ... ...<br />
British Virgin Islands 3-4 1 -1 49 -1 100 -1 71 ** , -1 74 ** , -1 69 ** , -1 0.92 ** , -1 58 ** , -1 61 ** , -1 55 ** , -1 0.90 ** , -1<br />
Cayman Islands 3-4 1 -2 54 -2 97 -2 91 -2 82 -2 101 -2 1.22 -2 82 -2 72 -2 92 -2 1.28 -2<br />
Chile 3-5 414 -1 50 -1 57 -1 56 -1 55 -1 58 -1 1.05 -1 54 -1 52 -1 55 -1 1.06 -1<br />
Colombia 3-5 1,302 49 28 49 49 49 1.00 44 44 45 1.01<br />
Costa Rica 4-5 108 49 13 71 71 72 1.01 ... ... ... ...<br />
Cuba 3-5 389 +1 48 +1 . +1 104 +1 104 +1 104 +1 1.00 +1 90 +1 90 +1 90 +1 1.00 +1<br />
Dominica 3-4 2 49 100 112 111 114 1.02 82 77 88 1.15<br />
Dominican Republic 3-5 242 49 59 38 38 38 1.00 36 36 36 1.00<br />
Ecuador 5-5 331 ** , -2 50 ** , -2 37 ** , -2 112 ** , -2 109 ** , -2 115 ** , -2 1.05 ** , -2 ... ... ... ...<br />
El Salvador 4-6 227 49 15 64 63 65 1.02 55 54 55 1.03<br />
Grenada 3-4 4 51 54 99 95 102 1.07 94 90 98 1.09<br />
Guatemala 5-6 585 50 15 71 70 72 1.02 56 56 57 1.01<br />
Guyana 4-5 25 49 6 76 74 78 1.07 65 64 67 1.06<br />
Haiti 3-5 ... ... ... ... ... ... ... ... ... ... ...<br />
Honduras 3-5 248 50 14 44 43 44 1.03 38 37 38 1.04<br />
Jamaica 3-5 159 49 92 113 113 113 1.00 84 ... ... ...<br />
Mexico 4-5 4,619 49 14 101 101 102 1.02 84 84 85 1.01<br />
87
TABLE<br />
1<br />
PRE-PRIMARY EDUCATION / ISCED 0 / Measures of enrolment / 2010<br />
REGION<br />
Country or territory<br />
Age<br />
Enrolment Gross enrolment ratio Net enrolment rate<br />
group MF<br />
(000) % F % private MF M F GPI MF M F GPI<br />
(1) (2) (3) (4) (5) (6) (7) (8) (9) (10) (11) (12)<br />
Montserrat 3-4 0.1 -1 53 -1 — -1 ... ... ... ... ... ... ... ...<br />
Netherlands Antilles a 4-5 ... ... ... ... ... ... ... ... ... ... ...<br />
Nicaragua 3-5 218 50 16 55 55 56 1.03 55 55 56 1.03<br />
Panama 4-5 93 49 18 67 67 67 1.01 60 60 60 1.00<br />
Paraguay 3-5 155 -1 49 -1 30 -1 35 -1 35 -1 35 -1 1.01 -1 32 -1 32 -1 33 -1 1.02 -1<br />
Peru 3-5 1,376 49 25 79 79 79 1.00 78 78 78 1.00<br />
Puerto Rico 4-5 95 49 27 96 95 98 1.03 78 77 79 1.03<br />
Saint Kitts and Nevis 3-4 2 48 64 90 92 88 0.96 ... ... ... ...<br />
Saint Lucia 3-4 3 48 100 60 62 59 0.95 44 44 44 0.99<br />
Saint Vincent and the Grenadines 3-4 3 -1 50 -1 100 -1 80 -1 79 -1 80 -1 1.01 -1 ... ... ... ...<br />
Suriname 4-5 18 -1 50 -1 45 -1 85 -1 85 -1 86 -1 1.01 -1 80 -1 79 -1 80 -1 1.00 -1<br />
Trinidad and Tobago 3-4 ... ... ... ... ... ... ... ... ... ... ...<br />
Turks and Caicos Islands 4-5 1 -1 50 -1 ... ... ... ... ... ... ... ... ...<br />
Uruguay 3-5 133 -1 49 -1 37 -1 89 -1 89 -1 89 -1 1.01 -1 78 -1 78 -1 78 -1 1.01 -1<br />
Venezuela (Bolivarian Republic of) 3-5 1,269 51 17 73 71 76 1.07 70 68 73 1.07<br />
NORTH AMERICA AND WESTERN EUROPE<br />
Andorra 3-5 2 47 2 102 104 99 0.96 86 88 83 0.95<br />
Austria 3-5 240 49 28 100 100 100 1.00 ... ... ... ...<br />
Belgium 3-5 425 -1 49 -1 53 -1 118 -1 118 -1 118 -1 1.00 -1 98 -1 98 -1 99 -1 1.00 -1<br />
Canada 4-5 489 -2 49 -2 6 -2 71 -2 71 -2 71 -2 1.00 -2 71 -2 71 -2 71 -2 1.00 -2<br />
Cyprus 3-5 21 49 51 81 * 81 * 81 * 1.01 * 72 * 71 * 73 * 1.02 *<br />
Denmark 3-6 251 -1 49 -1 21 -1 96 -1 97 -1 96 -1 0.99 -1 92 -1 91 -1 93 -1 1.03 -1<br />
Finland 3-6 157 49 9 68 68 68 1.00 67 67 67 1.00<br />
France 3-5 2,551 49 13 109 109 108 0.99 100 100 99 1.00<br />
Germany 3-5 2,360 48 65 114 114 113 0.98 ... ... ... ...<br />
Gibraltar 4-4 ... ... ... ... ... ... ... ... ... ... ...<br />
Greece 4-5 ... ... ... ... ... ... ... ... ... ... ...<br />
Holy See . . . . . . . . . . . .<br />
Iceland 3-5 12 -1 49 -1 12 -1 97 -1 97 -1 97 -1 1.00 -1 97 -1 97 -1 97 -1 1.00 -1<br />
Ireland 4-4 62 48 97 98 99 97 0.98 28 30 25 0.86<br />
Israel 3-5 428 -1 50 -1 9 -1 106 -1 103 -1 109 -1 1.05 -1 97 -1 94 -1 100 -1 1.07 -1<br />
Italy 3-5 1,681 48 31 98 100 96 0.97 93 94 91 0.97<br />
Liechtenstein 5-6 1 49 3 104 * 102 * 105 * 1.03 * 74 * 75 * 73 * 0.97 *<br />
Luxembourg 3-5 15 -2 48 -2 8 -2 87 -2 87 -2 86 -2 0.99 -2 85 -2 85 -2 85 -2 1.00 -2<br />
Malta 3-4 9 48 34 117 119 115 0.97 98 100 97 0.97<br />
Monaco 3-5 1 50 20 ... ... ... ... ... ... ... ...<br />
Netherlands 4-5 379 49 ... 93 93 93 1.00 93 93 93 1.00<br />
Norway 3-5 174 49 45 99 100 98 0.98 99 100 98 0.98<br />
Portugal 3-5 275 -1 48 -1 48 -1 82 -1 82 -1 82 -1 1.00 -1 81 -1 81 -1 81 -1 1.00 -1<br />
San Marino 3-5 1 46 . 93 ** 96 ** 89 ** 0.93 ** 81 ** 84 ** 78 ** 0.93 **<br />
Spain 3-5 1,822 49 36 126 126 127 1.00 98 98 99 1.01<br />
Sweden 3-6 399 49 16 95 95 95 1.00 95 95 95 1.00<br />
Switzerland 5-6 147 49 4 99 99 100 1.01 76 76 76 1.00<br />
United Kingdom 3-4 1,122 -1 49 -1 28 -1 81 -1 81 -1 82 -1 1.01 -1 76 -1 75 -1 77 -1 1.02 -1<br />
United States of America 3-5 8,840 50 45 69 68 70 1.04 64 62 65 1.05<br />
SOUTH AND WEST ASIA<br />
Afghanistan 3-6 ... ... ... ... ... ... ... ... ... ... ...<br />
Bangladesh 3-5 1,234 * 49 * 48 * 13 * 14 * 13 * 0.99 * 13 * 13 * 13 * 0.99 *<br />
Bhutan 4-5 2 +1 51 +1 68 +1 5 +1 5 +1 5 +1 1.08 +1 ... ... ... ...<br />
India 3-5 41,301 49 ... 55 54 56 1.04 ... ... ... ...<br />
Iran (Islamic Republic of) 5-5 463 51 5 42 41 44 1.08 ... ... ... ...<br />
Maldives 3-5 18 +1 49 +1 91 +1 114 +1 113 +1 115 +1 1.02 +1 92 +1 91 +1 93 +1 1.02 +1<br />
Nepal 3-4 1,019 +1 48 +1 16 +1 ... ... ... ... ... ... ... ...<br />
Pakistan 3-4 ... ... ... ... ... ... ... ... ... ... ...<br />
Sri Lanka 3-4 ... ... ... ... ... ... ... ... ... ... ...<br />
SUB-SAHARAN AFRICA<br />
Angola 5-5 668 50 1 104 103 105 1.02 66 * 65 * 67 * 1.04 *<br />
Benin 4-5 97 51 25 18 18 19 1.04 ... ... ... ...<br />
88
OPPORTUNITIES LOST: THE IMPACT OF GRADE REPETITION AND EARLY SCHOOL LEAVING<br />
REGION<br />
Country or territory<br />
Age<br />
Enrolment Gross enrolment ratio Net enrolment rate<br />
group MF<br />
(000) % F % private MF M F GPI MF M F GPI<br />
(1) (2) (3) (4) (5) (6) (7) (8) (9) (10) (11) (12)<br />
Botswana 3-5 24 -1 50 -1 ... 19 -1 19 -1 19 -1 1.02 -1 15 -1 15 -1 16 -1 1.04 -1<br />
Burkina Faso 3-5 49 +1 49 +1 ... 3 +1 3 +1 3 +1 1.01 +1 3 +1 3 +1 3 +1 1.01 +1<br />
Burundi 4-6 55 50 20 9 9 9 1.00 7 7 7 1.00<br />
Cameroon 4-5 317 50 65 28 28 29 1.02 20 ... ... ...<br />
Cape Verde 3-5 22 50 64 70 70 70 1.00 65 65 65 1.00<br />
Central African Republic 3-5 21 +1 51 +1 55 +1 6 +1 6 +1 6 +1 1.02 +1 6 +1 6 +1 6 +1 1.02 +1<br />
Chad 3-5 21 48 46 2 2 2 0.91 2 2 2 0.92<br />
Comoros 3-5 14 -2 48 -2 100 -2 22 -2 22 -2 21 -2 0.97 -2 ... ... ... ...<br />
Congo 3-5 43 51 72 13 12 13 1.07 13 12 13 1.07<br />
Côte d’Ivoire 3-5 75 +1 50 +1 40 +1 4 +1 4 +1 4 +1 1.00 +1 4 -1 4 -1 4 -1 0.98 -1<br />
Democratic Republic of the Congo 3-5 219 51 ... 3 3 3 1.06 ... ... ... ...<br />
Equatorial Guinea 3-6 40 -2 57 -2 ... 55 -2 47 -2 63 -2 1.33 -2 ... ... ... ...<br />
Eritrea 5-6 41 48 53 14 14 13 0.95 9 9 9 0.95<br />
Ethiopia 4-6 341 49 95 5 5 5 0.96 4 4 4 0.96<br />
Gabon 3-5 45 +1 50 +1 74 +1 42 +1 41 +1 43 +1 1.04 +1 42 +1 41 +1 43 +1 1.04 +1<br />
Gambia 3-6 65 51 77 30 30 31 1.04 27 27 28 1.04<br />
Ghana 3-5 1,338 -1 50 -1 28 ** , -1 69 -1 68 -1 70 -1 1.04 -1 47 ** , -1 46 ** , -1 49 ** , -1 1.05 ** , -1<br />
Guinea 4-6 121 49 72 14 14 14 0.99 9 9 9 0.99<br />
Guinea-Bissau 4-6 9 51 84 7 7 7 1.06 5 5 5 1.05<br />
Kenya 3-5 1,914 -1 49 -1 38 -1 52 -1 52 -1 52 -1 0.99 -1 29 -1 27 -1 30 -1 1.12 -1<br />
Lesotho 3-5 53 ... ... 33 ... ... ... ... ... ... ...<br />
Liberia 3-5 ... ... ... ... ... ... ... ... ... ... ...<br />
Madagascar 3-5 164 50 91 9 9 9 1.03 8 8 8 1.03<br />
Malawi 3-5 ... ... ... ... ... ... ... ... ... ... ...<br />
Mali 3-6 71 +1 50 +1 73 +1 3 +1 3 +1 3 +1 1.05 +1 3 +1 3 +1 3 +1 1.05 +1<br />
Mauritius 3-4 35 49 82 96 97 96 0.99 89 89 88 0.99<br />
Mozambique 3-5 ... ... ... ... ... ... ... ... ... ... ...<br />
Namibia 5-6 ... ... ... ... ... ... ... ... ... ... ...<br />
Niger 4-6 96 +1 50 +1 15 +1 6 +1 6 +1 6 +1 1.07 +1 5 +1 5 +1 5 +1 1.06 +1<br />
Nigeria 3-5 2,021 49 27 14 14 14 0.99 ... ... ... ...<br />
Rwanda 4-6 112 +1 51 +1 100 +1 11 +1 11 +1 12 +1 1.05 +1 10 +1 10 +1 11 +1 1.05 +1<br />
Sao Tome and Principe 3-5 9 +1 51 +1 7 +1 62 +1 60 +1 63 +1 1.05 +1 57 +1 55 +1 58 +1 1.06 +1<br />
Senegal 4-6 147 52 50 13 12 14 1.12 9 8 9 1.12<br />
Seychelles 4-5 3 48 10 102 106 97 0.92 87 91 83 0.91<br />
Sierra Leone 3-5 37 +1 51 +1 41 +1 7 +1 7 +1 7 +1 1.03 +1 ... ... ... ...<br />
Somalia 3-5 ... ... ... ... ... ... ... ... ... ... ...<br />
South Africa 6-6 667 -1 50 -1 5 -1 65 -1 65 -1 65 -1 1.00 -1 ... ... ... ...<br />
Swaziland 3-5 21 50 100 23 22 23 1.03 23 22 23 1.03<br />
Togo 3-5 43 51 33 9 9 9 1.02 9 9 9 1.02<br />
Uganda 3-5 499 51 100 14 14 14 1.05 14 14 14 1.05<br />
United Republic of Tanzania 5-6 925 50 5 33 33 34 1.02 33 33 34 1.02<br />
Zambia 3-6 ... ... ... ... ... ... ... ... ... ... ...<br />
Zimbabwe 3-5 ... ... ... ... ... ... ... ... ... ... ...<br />
REGIONAL AVERAGES<br />
WORLD 163,763 48 ... 48 48 48 1.00 ... ... ... ...<br />
Arab States 3,904 ** 47 ** ... 22 ** 23 ** 22 ** 0.94 ** ... ... ... ...<br />
Central and Eastern Europe 10,906 ** 48 ** ... 69 ** 70 ** 69 ** 0.98 ** ... ... ... ...<br />
Central Asia 1,591 49 ... 30 30 30 1.00 ... ... ... ...<br />
East Asia and the Pacific 44,643 47 ... 57 57 58 1.01 ... ... ... ...<br />
Latin America and the Caribbean 20,636 49 ... 70 70 71 1.01 ... ... ... ...<br />
North America and Western Europe 22,051 49 ... 85 85 86 1.01 ... ... ... ...<br />
South and West Asia 48,144 49 ... 48 48 49 1.02 ... ... ... ...<br />
Sub-Saharan Africa 11,887 50 ... 17 17 18 1.01 ... ... ... ...<br />
89
TABLE<br />
2<br />
PRIMARY EDUCATION / ISCED 1 / Compulsory education, new entrants and measures of<br />
enrolment / 2010<br />
REGION Compulsory education New entrants Gross intake ratio Net intake rate (adjusted)<br />
Country or territory<br />
ARAB STATES<br />
Starting<br />
MF<br />
age Duration (000) % F MF M F GPI MF M<br />
(1) (2) (3) (4) (5) (6) (7) (8) (9) (10)<br />
Algeria 6 9 662 48 106 107 105 0.98 99 100<br />
Bahrain 6 9 15 -1 48 -1 ... ... ... ... ... ...<br />
Djibouti 6 9 13 +1 47 +1 60 +1 63 +1 57 +1 0.90 +1 43 +1 45 +1<br />
Egypt 6 9 1,758 ... 103 ... ... ... 94 ** , -1 96 ** , -1<br />
Iraq 6 6 ... ... ... ... ... ... ... ...<br />
Jordan 6 10 146 49 96 97 96 0.99 93 93<br />
Kuwait 6 9 45 49 ... ... ... ... 99 -2 98 -2<br />
Lebanon 6 9 72 49 107 108 106 0.98 96 96<br />
Libya 6 9 ... ... ... ... ... ... ... ...<br />
Mauritania 6 9 97 50 105 104 107 1.04 37 37<br />
Morocco 6 9 636 +1 49 +1 110 +1 110 +1 109 +1 0.99 +1 92 +1 93 +1<br />
Oman . . 51 -1 48 -1 106 -1 108 -1 103 -1 0.96 -1 95 -1 97 -1<br />
Palestine 6 10 103 49 91 91 91 1.00 89 89<br />
Qatar 6 12 16 49 107 107 107 1.00 80 78<br />
Saudi Arabia 6 6 578 50 105 104 106 1.02 63 -1 64 -1<br />
Sudan (pre-secession) a 6 8 915 -1 47 ** , -1 79 -1 83 ** , -1 75 ** , -1 0.91 ** , -1 ... ...<br />
Syrian Arab Republic 6 9 604 48 117 116 117 1.00 99 -1 99 -1<br />
Tunisia 6 9 163 -1 49 -1 106 -1 106 -1 106 -1 0.99 -1 100 -1 100 -1<br />
United Arab Emirates 6 9 72 49 ... ... ... ... ... ...<br />
Yemen 6 9 714 46 103 109 96 0.88 57 61<br />
CENTRAL AND EASTERN EUROPE<br />
Albania 6 9 42 48 87 87 87 1.01 66 64<br />
Belarus 6 9 87 49 96 96 96 1.00 ... ...<br />
Bosnia and Herzegovina … … 36 49 99 99 100 1.01 82 81<br />
Bulgaria 7 8 63 48 98 98 98 0.99 94 94<br />
Croatia 7 8 39 49 92 92 92 1.00 90 90<br />
Czech Republic 6 10 93 -1 49 -1 107 -1 107 -1 108 -1 1.01 -1 ... ...<br />
Estonia 7 9 12 -1 49 -1 100 -1 100 -1 100 -1 1.00 -1 ... ...<br />
Hungary 7 10 96 -1 48 -1 102 -1 103 -1 102 -1 0.99 -1 96 -1 95 -1<br />
Latvia 7 9 20 49 101 100 102 1.02 91 88<br />
Lithuania 7 9 28 48 92 93 91 0.98 91 91<br />
Montenegro 6 9 8 48 96 97 94 0.97 ... ...<br />
Poland 7 9 356 -1 49 -1 99 -1 99 -1 99 -1 1.00 -1 97 -1 96 -1<br />
Republic of Moldova 6 10 35 48 97 * 98 * 97 * 0.98 * 89 * 89 *<br />
Romania 7 10 202 48 94 94 94 0.99 87 86<br />
Russian Federation 6 10 1,322 -1 ... 102 -1 ... ... ... 89 -1 88 -1<br />
Serbia 7 8 72 49 92 * 92 * 92 * 1.00 * 89 * 89 *<br />
Slovakia 6 9 50 49 96 96 96 1.00 50 47<br />
Slovenia 6 9 18 -1 48 -1 99 -1 99 -1 98 -1 0.99 -1 95 -1 94 -1<br />
The former Yugoslav Rep. of Macedonia 6 9 23 49 98 97 100 1.03 94 93<br />
Turkey 6 8 1,234 -1 48 -1 98 -1 99 -1 97 -1 0.98 -1 85 -1 85 -1<br />
Ukraine 6 11 ... ... ... ... ... ... 75 75 *<br />
CENTRAL ASIA<br />
Armenia 6 9 36 46 92 91 93 1.02 ... ...<br />
Azerbaijan 6 11 119 46 90 * 91 * 88 * 0.98 * 69 * 71 *<br />
Georgia 6 9 46 47 101 100 102 1.02 97 -2 94 -2<br />
Kazakhstan 7 11 261 +1 49 +1 111 +1 112 +1 111 +1 1.00 +1 99 +1 99 +1<br />
Kyrgyzstan 7 9 101 49 105 106 104 0.99 97 97<br />
Mongolia 6 9 50 48 114 117 111 0.95 93 94<br />
Tajikistan 7 9 167 48 100 102 98 0.96 96 98<br />
Turkmenistan 7 10 ... ... ... ... ... ... ... ...<br />
Uzbekistan 7 12 482 +1 48 +1 96 +1 97 +1 94 +1 0.96 +1 90 +1 92 +1<br />
EAST ASIA AND THE PACIFIC<br />
Australia 5 11 ... ... ... ... ... ... 82 80<br />
Brunei Darussalam 6 9 7 49 96 95 97 1.03 77 76<br />
Cambodia . . 416 49 143 143 144 1.01 90 90<br />
China 6 9 16,677 46 97 95 99 1.04 ... ...<br />
90
OPPORTUNITIES LOST: THE IMPACT OF GRADE REPETITION AND EARLY SCHOOL LEAVING<br />
Net intake rate (adjusted) Enrolment Gross enrolment ratio Net enrolment rate (adjusted)<br />
MF<br />
F<br />
GPI (000) % F MF M F GPI MF M F GPI<br />
(11) (12) (13) (14) (15) (16) (17) (18) (19) (20) (21) (22)<br />
ARAB STATES<br />
98 0.98 3,312 47 110 113 107 0.94 97 98 96 0.98<br />
... ... 91 49 ... ... ... ... ... ... ... ...<br />
40 +1 0.89 +1 61 +1 47 +1 59 +1 62 +1 56 +1 0.90 +1 45 ** , -1 47 ** , -1 42 ** , -1 0.90 ** , -1<br />
93 ** , -1 0.97 ** , -1 10,004 48 ** 101 103 ** 98 ** 0.96 ** 96 ** ... ... ...<br />
... ... ... ... ... ... ... ... ... ... ... ...<br />
93 1.00 820 49 92 92 92 1.00 91 91 91 1.00<br />
100 -2 1.02 -2 214 49 ... ... ... ... 98 -2 97 -2 100 -2 1.03 -2<br />
96 1.00 462 48 105 106 103 0.97 93 94 93 0.99<br />
... ... ... ... ... ... ... ... ... ... ... ...<br />
38 1.04 531 50 102 99 105 1.05 74 ** 73 ** 76 ** 1.04 **<br />
92 +1 0.99 +1 4,001 +1 47 +1 114 +1 117 +1 110 +1 0.94 +1 96 +1 97 +1 96 +1 0.99 +1<br />
92 -1 0.95 -1 302 -1 48 -1 105 -1 107 -1 104 -1 0.97 -1 98 -1 100 -1 97 -1 0.97 -1<br />
89 1.00 403 48 91 92 90 0.98 89 90 88 0.99<br />
81 1.04 89 49 103 103 103 1.00 96 96 97 1.01<br />
63 -1 0.99 -1 3,321 49 106 106 106 0.99 90 -1 90 -1 89 -1 0.99 -1<br />
... ... 4,744 -1 46 -1 73 -1 76 -1 69 -1 0.90 -1 ... ... ... ...<br />
99 -1 1.00 -1 2,429 48 118 119 116 0.98 99 -1 100 -1 98 -1 0.99 -1<br />
99 -1 0.99 -1 1,025 -1 48 -1 109 -1 111 -1 107 -1 0.96 -1 99 -1 ... ... ...<br />
... ... 327 49 ... ... ... ... ... ... ... ...<br />
53 0.86 3,427 44 87 96 78 0.82 78 86 70 0.82<br />
CENTRAL AND EASTERN EUROPE<br />
68 1.06 225 48 87 87 87 0.99 80 80 80 1.01<br />
... ... 358 49 100 100 100 1.00 92 ... ... ...<br />
83 1.03 175 49 112 111 113 1.02 87 86 88 1.02<br />
94 0.99 260 48 103 103 102 1.00 100 99 100 1.00<br />
91 1.00 167 49 93 93 93 1.00 96 95 97 1.02<br />
... ... 460 -1 49 -1 106 -1 106 -1 106 -1 0.99 -1 ... ... ... ...<br />
... ... 74 -1 48 -1 99 -1 100 -1 98 -1 0.99 -1 96 -1 96 -1 96 -1 1.00 -1<br />
97 -1 1.02 -1 390 -1 48 -1 102 -1 102 -1 101 -1 0.99 -1 98 -1 98 -1 98 -1 1.00 -1<br />
93 1.05 114 48 101 101 100 0.99 96 95 97 1.02<br />
91 1.00 122 48 96 96 95 0.99 96 96 96 1.00<br />
... ... 35 48 107 107 106 0.98 83 ... ... ...<br />
97 -1 1.01 -1 2,294 -1 48 -1 97 -1 98 -1 97 -1 0.99 -1 96 -1 96 -1 96 -1 1.00 -1<br />
89 * 1.00 * 141 48 94 * 94 * 93 * 1.00 * 90 * 90 * 90 * 1.00 *<br />
87 1.01 842 48 96 96 95 0.99 88 88 87 0.99<br />
90 -1 1.02 -1 5,015 -1 49 -1 99 -1 99 -1 99 -1 1.00 -1 96 -1 95 -1 96 -1 1.01 -1<br />
90 * 1.01 * 283 49 96 * 96 * 96 * 0.99 * 95 * 95 * 94 * 1.00 *<br />
54 1.16 212 49 101 101 101 0.99 … … … …<br />
96 -1 1.02 -1 107 -1 48 -1 98 -1 98 -1 97 -1 0.99 -1 97 -1 97 -1 97 -1 1.00 -1<br />
96 1.03 111 48 90 89 91 1.01 98 97 99 1.02<br />
85 -1 1.00 -1 6,592 -1 49 -1 102 -1 103 -1 101 -1 0.98 -1 97 -1 98 -1 97 -1 0.98 -1<br />
76 * 1.01 * 1,540 49 99 99 100 1.01 91 91 * 91 * 1.01 *<br />
CENTRAL ASIA<br />
... ... 117 47 103 101 104 1.02 ... ... ... ...<br />
68 * 0.95 * 482 46 94 * 94 * 93 * 0.99 * 85 ** 85 ** 84 ** 0.99 **<br />
100 -2 1.06 -2 289 47 109 107 111 1.03 100 -1 ... ... ...<br />
99 +1 1.00 +1 986 +1 49 +1 111 +1 111 +1 111 +1 1.00 +1 100 +1 99 +1 100 +1 1.00 +1<br />
96 0.99 391 49 100 100 99 0.99 95 95 95 1.00<br />
92 0.99 274 49 122 123 121 0.98 99 ** 100 ** 99 ** 0.99 **<br />
94 0.96 682 48 102 104 100 0.96 98 99 96 0.96<br />
... ... ... ... ... ... ... ... ... ... ... ...<br />
88 +1 0.96 +1 1,948 +1 48 +1 95 +1 96 +1 93 +1 0.97 +1 93 +1 94 +1 91 +1 0.97 +1<br />
EAST ASIA AND THE PACIFIC<br />
84 1.05 2,015 49 105 105 105 0.99 97 97 98 1.01<br />
78 1.04 44 48 108 107 109 1.01 ... ... ... ...<br />
91 1.01 2,273 48 127 130 124 0.95 96 96 95 0.99<br />
... ... 101,019 46 111 110 113 1.03 ... ... ... ...<br />
91
TABLE<br />
2<br />
PRIMARY EDUCATION / ISCED 1 / Compulsory education, new entrants and measures of<br />
enrolment / 2010<br />
REGION Compulsory education New entrants Gross intake ratio Net intake rate (adjusted)<br />
Country or territory<br />
Starting<br />
MF<br />
age Duration (000) % F MF M F GPI MF M<br />
(1) (2) (3) (4) (5) (6) (7) (8) (9) (10)<br />
China, Hong Kong SAR 6 9 50 * 48 * 116 * 114 * 119 * 1.04 * 96 * , -1 95 * , -1<br />
China, Macao SAR 5 10 ... ... ... ... ... ... … …<br />
Cook Islands 5 11 0.3 +1 51 +1 121 * , +1 116 * , +1 127 * , +1 1.09 * , +1 96 * 95 *<br />
Democratic People’s Republic of Korea 6 11 ... ... ... ... ... ... ... ...<br />
Fiji 6 10 17 -1 48 -1 102 -1 102 -1 102 -1 0.99 -1 90 -1 89 -1<br />
Indonesia 7 9 5,154 -1 48 -1 119 -1 121 -1 118 -1 0.97 -1 98 98<br />
Japan 6 9 1,149 49 102 102 102 1.00 100 100<br />
Kiribati 6 9 3 -2 49 -2 115 -2 116 -2 113 -2 0.98 -2 ... ...<br />
Lao People’s Democratic Republic 6 5 189 48 134 137 131 0.96 96 96<br />
Malaysia 6 6 474 -1 48 -1 ... ... ... ... ... ...<br />
Marshall Islands 6 8 2 +1 48 +1 100 +1 102 +1 99 +1 0.97 +1 99 +1 100 +1<br />
Micronesia (Federated States of) 6 8 ... ... ... ... ... ... ... ...<br />
Myanmar 5 5 1,196 49 152 152 151 0.99 ... ...<br />
Nauru 6 11 ... ... ... ... ... ... ... ...<br />
New Zealand 5 12 ... ... ... ... ... ... 97 97<br />
Niue 5 12 ... ... ... ... ... ... ... ...<br />
Palau 6 9 ... ... ... ... ... ... ... ...<br />
Papua New Guinea . . ... ... ... ... ... ... ... ...<br />
Philippines 6 6 2,759 -2 47 -2 125 -2 129 -2 121 -2 0.94 -2 52 -1 50 -1<br />
Republic of Korea 6 9 477 48 107 107 107 0.99 96 95<br />
Samoa 5 8 6 49 125 122 128 1.05 81 79<br />
Singapore 6 6 46 -1 49 -1 ... ... ... ... ... ...<br />
Solomon Islands … … ... ... ... ... ... ... ... ...<br />
Thailand 6 9 ... ... ... ... ... ... … …<br />
Timor-Leste 6 9 46 49 141 141 141 1.00 77 76<br />
Tokelau … … ... ... ... ... ... ... ... ...<br />
Tonga 6 9 ... ... ... ... ... ... ... ...<br />
Tuvalu 7 8 ... ... ... ... ... ... ... ...<br />
Vanuatu . . 8 49 124 123 125 1.02 ... ...<br />
Viet Nam 6 9 ... ... ... ... ... ... ... ...<br />
LATIN AMERICA AND THE CARIBBEAN<br />
Anguilla 5 12 0.2 54 ... ... ... ... 88 ** , -2 80 ** , -2<br />
Antigua and Barbuda 5 11 1 44 94 103 84 0.81 72 75<br />
Argentina 5 13 752 -1 49 -1 114 -1 114 -1 115 -1 1.00 -1 98 -2 99 -2<br />
Aruba 6 11 1 49 106 108 104 0.96 97 99<br />
Bahamas 5 12 5 50 118 116 120 1.04 80 78<br />
Barbados 5 11 4 * 49 * 130 * 133 * 127 * 0.95 * ... ...<br />
Belize 5 10 8 50 115 115 114 0.99 98 97<br />
Bermuda 5 11 1 49 90 90 90 1.00 88 87<br />
Bolivia (Plurinational State of) 6 8 270 -2 49 -2 112 -2 113 -2 111 -2 0.99 -2 ... ...<br />
Brazil 6 9 ... ... ... ... ... ... ... ...<br />
British Virgin Islands 5 12 0.5 48 91 * 95 * 87 * 0.92 * 78 * 82 *<br />
Cayman Islands 5 12 1 -2 50 -2 88 -2 85 -2 91 -2 1.07 -2 ... ...<br />
Chile 6 12 239 -1 49 -1 97 -1 97 -1 96 -1 0.99 -1 84 -1 83 -1<br />
Colombia 5 10 970 48 110 113 107 0.95 78 78<br />
Costa Rica 5 10 76 49 98 98 98 1.00 ... ...<br />
Cuba 6 9 123 +1 49 +1 93 +1 93 +1 93 +1 1.00 +1 94 +1 94 +1<br />
Dominica 5 12 1 48 131 133 129 0.98 ... ...<br />
Dominican Republic 5 9 223 46 107 113 101 0.89 81 83<br />
Ecuador 5 10 ... ... ... ... ... ... 89 -1 86 -1<br />
El Salvador 7 9 141 47 113 117 110 0.94 70 70<br />
Grenada 5 12 2 ** 52 ** 106 ** 99 ** 113 ** 1.14 ** 93 -1 93 -1<br />
Guatemala 6 10 526 49 131 131 131 1.00 90 90<br />
Guyana 6 9 15 49 85 82 87 1.06 80 78<br />
Haiti 6 6 ... ... ... ... ... ... ... ...<br />
Honduras 6 6 228 48 123 125 120 0.96 70 69<br />
Jamaica 6 6 40 49 79 81 78 0.96 79 79<br />
Mexico 4 11 2,420 49 108 108 108 1.00 99 98<br />
92
OPPORTUNITIES LOST: THE IMPACT OF GRADE REPETITION AND EARLY SCHOOL LEAVING<br />
Net intake rate (adjusted) Enrolment Gross enrolment ratio Net enrolment rate (adjusted)<br />
MF<br />
F<br />
GPI (000) % F MF M F GPI MF M F GPI<br />
(11) (12) (13) (14) (15) (16) (17) (18) (19) (20) (21) (22)<br />
99 * , -1 1.04 * , -1 349 48 102 101 103 1.02 98 * ... ... ...<br />
… … 25 48 94 94 93 1.00 83 81 84 1.04<br />
96 * 1.01 * 2 +1 49 +1 111 * , +1 110 * , +1 113 * , +1 1.03 * , +1 98 * 98 * 99 * 1.02 *<br />
... ... ... ... ... ... ... ... ... ... ... ...<br />
91 -1 1.03 -1 101 -1 48 -1 105 -1 106 -1 104 -1 0.98 -1 99 -1 99 -1 99 -1 1.00 -1<br />
99 1.02 30,342 50 118 117 119 1.02 99 ... ... ...<br />
100 1.00 7,099 49 103 103 103 1.00 100 ... ... ...<br />
... ... 16 -1 50 -1 113 -1 111 -1 115 -1 1.04 -1 ... ... ... ...<br />
95 0.99 916 47 126 131 122 0.93 97 98 95 0.97<br />
... ... 3,001 -1 48 -1 ... ... ... ... ... ... ... ...<br />
97 +1 0.97 +1 9 +1 48 +1 102 +1 102 +1 101 +1 0.99 +1 99 +1 ... ... ...<br />
... ... ... ... ... ... ... ... ... ... ... ...<br />
... ... 5,126 50 126 126 126 1.00 ... ... ... ...<br />
... ... 1 -2 50 -2 93 * , -2 90 * , -2 96 * , -2 1.06 * , -2 ... ... ... ...<br />
98 1.01 348 49 101 101 101 1.00 99 99 100 1.00<br />
... ... ... ... ... ... ... ... ... ... ... ...<br />
... ... ... ... ... ... ... ... ... ... ... ...<br />
... ... 601 -2 45 -2 60 -2 63 -2 57 -2 0.89 -2 ... ... ... ...<br />
55 -1 1.09 -1 13,687 -1 48 -1 106 -1 107 -1 105 -1 0.98 -1 89 -1 88 -1 90 -1 1.02 -1<br />
96 1.01 3,306 48 106 106 105 0.99 99 ** 99 ** 98 ** 0.99 **<br />
83 1.06 31 48 108 107 109 1.02 95 93 97 1.04<br />
... ... 295 -1 48 -1 ... ... ... ... ... ... ... ...<br />
... ... ... ... ... ... ... ... ... ... ... ...<br />
… … 5,371 -1 48 -1 91 -1 91 -1 90 -1 0.99 -1 90 -1 90 -1 89 -1 0.99 -1<br />
78 1.03 230 48 117 119 115 0.96 86 86 86 0.99<br />
... ... ... ... ... ... ... ... ... ... ... ...<br />
... ... ... ... ... ... ... ... ... ... ... ...<br />
... ... ... ... ... ... ... ... ... ... ... ...<br />
... ... 42 47 117 120 114 0.95 ... ... ... ...<br />
... ... 6,923 47 106 109 103 0.94 98 ... ... ...<br />
LATIN AMERICA AND THE CARIBBEAN<br />
100 ** , -2 1.26 ** , -2 2 49 ... ... ... ... 93 ** , -2 93 ** , -2 93 ** , -2 1.00 ** , -2<br />
67 0.89 11 47 102 106 97 0.92 88 91 84 0.93<br />
97 -2 0.99 -2 4,702 -1 49 -1 118 -1 118 -1 117 -1 0.99 -1 ... ... ... ...<br />
94 0.96 10 49 114 116 112 0.97 100 100 100 1.00<br />
82 1.05 34 50 114 113 115 1.02 98 ... ... ...<br />
... ... 23 * 49 * 120 * 119 * 122 * 1.02 * 95 * , -2 ... ... ...<br />
99 1.02 53 49 121 127 116 0.91 97 ... ... ...<br />
90 1.03 4 49 ** 92 92 ** 92 ** 1.00 ** 95 ** ... ... ...<br />
... ... 1,481 -1 49 -1 105 -1 105 -1 104 -1 0.99 -1 ... ... ... ...<br />
... ... 16,893 47 ... ... ... ... ... ... ... ...<br />
74 * 0.91 * 3 49 100 * 103 * 97 * 0.94 * 90 * 91 * 88 * 0.97 *<br />
... ... 4 -2 48 -2 90 -2 91 -2 89 -2 0.97 -2 ... ... ... ...<br />
85 -1 1.02 -1 1,612 -1 48 -1 106 -1 108 -1 103 -1 0.95 -1 94 -1 94 -1 94 -1 1.00 -1<br />
79 1.01 5,085 49 115 116 114 0.98 92 92 91 1.00<br />
... ... 521 48 110 110 109 0.99 ... ... ... ...<br />
94 +1 1.00 +1 828 +1 48 +1 101 +1 102 +1 100 +1 0.98 +1 98 +1 98 +1 98 +1 1.00 +1<br />
... ... 8 49 112 113 111 0.98 98 -1 ... ... ...<br />
80 0.97 1,318 46 108 115 102 0.88 93 96 90 0.95<br />
93 -1 1.07 -1 2,008 -1 49 -1 114 -1 114 -1 115 -1 1.01 -1 98 -1 ... ... ...<br />
70 1.01 940 48 114 117 111 0.95 95 95 95 1.00<br />
94 -1 1.01 -1 14 49 103 103 103 1.00 97 -1 96 -1 99 -1 1.04 -1<br />
90 1.00 2,660 48 116 119 114 0.96 99 100 98 0.98<br />
83 1.07 99 49 85 83 86 1.04 84 82 86 1.04<br />
... ... ... ... ... ... ... ... ... ... ... ...<br />
72 1.04 1,275 49 116 116 116 1.00 96 ** 95 ** 97 ** 1.03 **<br />
78 0.98 299 49 89 91 87 0.95 82 83 81 0.98<br />
99 1.01 14,906 49 114 115 113 0.99 100 99 100 1.01<br />
93
TABLE<br />
2<br />
PRIMARY EDUCATION / ISCED 1 / Compulsory education, new entrants and measures of<br />
enrolment / 2010<br />
REGION Compulsory education New entrants Gross intake ratio Net intake rate (adjusted)<br />
Country or territory<br />
Starting<br />
MF<br />
age Duration (000) % F MF M F GPI MF M<br />
(1) (2) (3) (4) (5) (6) (7) (8) (9) (10)<br />
Montserrat 5 7 0.1 -1 47 -1 ... ... ... ... ... ...<br />
Netherlands Antilles a 5 13 ... ... ... ... ... ... ... ...<br />
Nicaragua 6 6 185 48 142 146 138 0.95 74 73<br />
Panama 6 9 70 49 102 103 101 0.98 87 87<br />
Paraguay 6 9 145 -1 48 -1 100 -1 101 -1 98 -1 0.97 -1 73 -1 72 -1<br />
Peru 5 12 616 49 106 106 107 1.01 96 96<br />
Puerto Rico 5 13 ... ... ... ... ... ... 80 77<br />
Saint Kitts and Nevis 5 12 1 51 78 76 80 1.06 75 75<br />
Saint Lucia 5 10 3 47 92 96 87 0.90 85 88<br />
Saint Vincent and the Grenadines 5 12 2 48 104 107 100 0.93 96 97<br />
Suriname 7 6 11 -1 49 -1 100 -1 101 -1 99 -1 0.97 -1 90 -1 90 -1<br />
Trinidad and Tobago 6 6 19 49 103 104 101 0.97 88 88<br />
Turks and Caicos Islands 4 13 0.5 -1 49 -1 ... ... ... ... ... ...<br />
Uruguay 4 14 53 -1 49 -1 106 -1 106 -1 106 -1 0.99 -1 83 -1 83 -1<br />
Venezuela (Bolivarian Republic of) 3 14 564 48 99 100 98 0.97 90 89<br />
NORTH AMERICA AND WESTERN EUROPE<br />
Andorra … … 1 50 85 81 88 1.08 39 37<br />
Austria 6 9 83 48 101 103 100 0.97 ... ...<br />
Belgium 6 13 111 -1 49 -1 95 -1 94 -1 95 -1 1.01 -1 93 -1 92 -1<br />
Canada 6 11 343 -2 49 -2 98 -2 99 -2 98 -2 1.00 -2 ... ...<br />
Cyprus 6 9 9 49 103 * 102 * 104 * 1.02 * 95 * 94 *<br />
Denmark 7 10 67 -1 49 -1 100 -1 100 -1 100 -1 1.00 -1 82 -1 77 -1<br />
Finland 7 10 56 49 98 99 98 0.99 95 94<br />
France 6 11 ... ... ... ... ... ... 98 98<br />
Germany 6 13 744 -1 49 -1 100 -1 100 -1 99 -1 0.99 -1 96 ** 94 **<br />
Gibraltar … … ... ... ... ... ... ... ... ...<br />
Greece 5 10 ... ... ... ... ... ... ... ...<br />
Holy See . . . . . . . . . .<br />
Iceland 6 11 4 -1 49 -1 97 -1 97 -1 97 -1 1.00 -1 97 -1 97 -1<br />
Ireland 6 10 64 49 103 103 103 1.00 100 100<br />
Israel 5 11 131 -1 49 -1 100 -1 98 -1 101 -1 1.03 -1 82 -1 80 -1<br />
Italy 6 9 561 48 100 101 98 0.97 97 98<br />
Liechtenstein 6 9 0.4 43 111 * 126 * 96 * 0.76 * 98 * 99 *<br />
Luxembourg 6 10 6 -2 50 -2 96 -2 94 -2 99 -2 1.06 -2 92 -2 87 -2<br />
Malta 5 11 4 49 105 105 105 1.00 73 73<br />
Monaco 6 11 0.3 -1 55 -1 ... ... ... ... ... ...<br />
Netherlands 5 13 199 49 98 98 98 1.00 98 98<br />
Norway 6 11 59 49 101 101 100 0.99 99 99<br />
Portugal 6 9 114 -1 48 -1 103 -1 103 -1 103 -1 1.00 -1 96 -1 96 -1<br />
San Marino 6 11 0.3 47 87 ** 89 ** 85 ** 0.97 ** 89 ** 90 **<br />
Spain 6 11 460 49 101 100 102 1.02 98 97<br />
Sweden 7 10 100 49 103 103 104 1.00 98 98<br />
Switzerland 7 9 71 49 94 92 96 1.04 99 98<br />
United Kingdom 5 12 ... ... ... ... ... ... 99 -1 99 -1<br />
United States of America 6 12 4,138 48 100 101 98 0.97 80 80<br />
SOUTH AND WEST ASIA<br />
Afghanistan 7 9 1,033 41 108 124 91 0.74 ... ...<br />
Bangladesh 6 5 3,688 * 50 * ... ... ... ... ... ...<br />
Bhutan . . 15 +1 50 +1 102 +1 101 +1 103 +1 1.02 +1 64 +1 63 +1<br />
India 6 9 31,584 -2 47 -2 127 -2 129 -2 125 -2 0.96 -2 ... ...<br />
Iran (Islamic Republic of) 6 8 1,119 -1 49 -1 107 -1 107 -1 108 -1 1.00 -1 ... ...<br />
Maldives 6 7 5 +1 47 +1 101 +1 104 +1 99 +1 0.95 +1 78 -1 77 -1<br />
Nepal . . 1,140 +1 50 +1 ... ... ... ... ... ...<br />
Pakistan 5 5 4,596 45 118 129 108 0.84 80 * 88 *<br />
Sri Lanka 5 9 345 49 94 94 95 1.00 89 89<br />
SUB-SAHARAN AFRICA<br />
Angola 6 6 1,029 * 45 * 165 * 182 * 148 * 0.82 * 69 * 76 *<br />
Benin 6 6 391 48 153 159 147 0.92 97 100<br />
94
OPPORTUNITIES LOST: THE IMPACT OF GRADE REPETITION AND EARLY SCHOOL LEAVING<br />
Net intake rate (adjusted) Enrolment Gross enrolment ratio Net enrolment rate (adjusted)<br />
MF<br />
F<br />
GPI (000) % F MF M F GPI MF M F GPI<br />
(11) (12) (13) (14) (15) (16) (17) (18) (19) (20) (21) (22)<br />
... ... 0.5 -1 49 -1 ... ... ... ... ... ... ... ...<br />
... ... ... ... ... ... ... ... ... ... ... ...<br />
76 1.05 924 48 118 119 116 0.98 94 93 95 1.01<br />
87 1.00 440 48 108 109 106 0.97 99 99 98 0.99<br />
73 -1 1.02 -1 852 -1 48 -1 100 -1 101 -1 98 -1 0.97 -1 86 -1 86 -1 86 -1 1.00 -1<br />
97 1.01 3,763 49 108 108 108 1.00 98 98 98 1.01<br />
83 1.07 300 49 93 91 95 1.04 86 ** 83 ** 88 ** 1.06 **<br />
76 1.01 6 49 93 93 94 1.00 86 * 86 * 86 * 1.01 *<br />
82 0.93 19 49 94 96 92 0.96 90 ** 90 ** 89 ** 0.99 **<br />
94 0.97 14 48 105 109 101 0.93 98 ... ... ...<br />
90 -1 1.00 -1 71 -1 48 -1 113 -1 116 -1 111 -1 0.95 -1 91 ** , -1 91 ** , -1 91 ** , -1 1.00 ** , -1<br />
89 1.01 131 48 105 107 103 0.97 97 98 97 0.99<br />
... ... 3 -1 49 -1 ... ... ... ... ... ... ... ...<br />
83 -1 1.00 -1 349 -1 48 -1 113 -1 115 -1 111 -1 0.97 -1 99 -1 100 -1 99 -1 0.99 -1<br />
91 1.01 3,458 48 103 104 101 0.97 95 95 95 1.00<br />
NORTH AMERICA AND WESTERN EUROPE<br />
41 1.13 4 48 84 84 85 1.01 79 78 79 1.01<br />
... ... 328 48 99 100 99 0.99 ... ... ... ...<br />
94 -1 1.02 -1 732 -1 49 -1 105 -1 105 -1 104 -1 1.00 -1 99 -1 99 -1 99 -1 1.00 -1<br />
... ... 2,200 -2 49 -2 99 -2 99 -2 98 -2 1.00 -2 ... ... ... ...<br />
97 * 1.03 * 55 49 106 * 106 * 105 * 0.99 * 99 * 99 * 99 * 1.00 *<br />
89 -1 1.16 -1 407 -1 49 -1 99 -1 99 -1 99 -1 1.00 -1 96 -1 95 -1 97 -1 1.02 -1<br />
95 1.01 347 49 99 99 99 0.99 98 98 98 1.00<br />
99 1.01 4,159 49 110 111 109 0.99 99 99 99 1.00<br />
97 ** 1.03 ** 3,068 49 102 103 102 1.00 100 ** ... ... ...<br />
... ... 3 -1 49 -1 ... ... ... ... ... ... ... ...<br />
... ... ... ... ... ... ... ... ... ... ... ...<br />
. . . . . . . . . . . .<br />
97 -1 1.00 -1 30 -1 49 -1 99 -1 99 -1 100 -1 1.00 -1 99 -1 99 -1 100 -1 1.00 -1<br />
99 0.99 506 49 108 108 108 1.00 100 99 100 1.01<br />
84 -1 1.05 -1 786 -1 49 -1 103 -1 103 -1 103 -1 1.01 -1 97 -1 97 -1 97 -1 1.01 -1<br />
96 0.98 2,822 48 102 102 101 0.99 99 100 99 0.99<br />
97 * 0.97 * 2 49 105 * 109 * 102 * 0.94 * 99 * 100 * 98 * 0.99 *<br />
96 -2 1.10 -2 36 -2 49 -2 100 -2 99 -2 100 -2 1.01 -2 97 -2 96 -2 98 -2 1.02 -2<br />
73 1.01 25 49 101 101 101 1.01 94 93 94 1.01<br />
... ... 2 51 ... ... ... ... ... ... ... ...<br />
98 1.00 1,294 49 108 108 107 0.99 100 ... ... ...<br />
98 0.99 424 49 99 99 99 1.00 99 99 99 1.00<br />
97 -1 1.00 -1 744 -1 48 -1 114 -1 116 -1 112 -1 0.97 -1 99 -1 99 -1 100 -1 1.00 -1<br />
87 ** 0.97 ** 2 50 94 ** 89 ** 101 ** 1.13 ** 92 * , -1 91 * , -1 93 * , -1 1.02 * , -1<br />
99 1.02 2,721 48 106 106 105 0.99 100 100 100 1.00<br />
98 1.00 576 49 101 102 101 0.99 99 100 99 0.99<br />
99 1.01 493 48 103 103 102 1.00 99 99 99 1.01<br />
99 -1 1.00 -1 4,416 -1 49 -1 106 -1 106 -1 106 -1 1.00 -1 100 -1 100 -1 100 -1 1.00 -1<br />
81 1.01 24,393 49 102 102 101 0.99 96 95 96 1.01<br />
SOUTH AND WEST ASIA<br />
... ... 5,279 39 97 114 79 0.69 ... ... ... ...<br />
... ... 16,987 * 51 * ... ... ... ... ... ... ... ...<br />
65 +1 1.03 +1 111 +1 50 +1 111 +1 111 +1 112 +1 1.01 +1 89 +1 88 +1 91 +1 1.03 +1<br />
... ... 143,310 -2 48 -2 116 -2 116 -2 116 -2 1.00 -2 98 ** , -2 99 ** , -2 98 ** , -2 0.99 ** , -2<br />
... ... 5,974 49 114 114 115 1.01 ... ... ... ...<br />
79 -1 1.03 -1 42 +1 48 +1 109 +1 111 +1 107 +1 0.96 +1 97 +1 97 +1 97 +1 1.00 +1<br />
... ... 4,952 +1 50 +1 ... ... ... ... ... ... ... ...<br />
73 * 0.83 * 18,756 44 95 104 85 0.82 74 * 81 * 67 * 0.82 *<br />
89 1.01 1,721 49 99 99 99 1.00 94 94 94 1.01<br />
SUB-SAHARAN AFRICA<br />
62 * 0.81 * 4,273 45 124 137 112 0.81 86 ** 93 ** 78 ** 0.84 **<br />
94 0.94 1,788 46 126 135 117 0.87 94 ... ... ...<br />
95
TABLE<br />
2<br />
PRIMARY EDUCATION / ISCED 1 / Compulsory education, new entrants and measures of<br />
enrolment / 2010<br />
REGION Compulsory education New entrants Gross intake ratio Net intake rate (adjusted)<br />
Country or territory<br />
Starting<br />
MF<br />
age Duration (000) % F MF M F GPI MF M<br />
(1) (2) (3) (4) (5) (6) (7) (8) (9) (10)<br />
Botswana 6 10 47 ** , -1 48 ** , -1 111 ** , -1 114 ** , -1 108 ** , -1 0.95 ** , -1 47 -1 46 -1<br />
Burkina Faso 6 10 445 +1 48 +1 89 +1 91 +1 86 +1 0.94 +1 29 +1 29 +1<br />
Burundi 7 6 324 49 161 164 158 0.96 ... ...<br />
Cameroon 6 6 706 46 134 144 123 0.86 92 -1 ...<br />
Cape Verde 6 6 10 50 96 96 96 1.00 92 92<br />
Central African Republic 6 6 116 +1 44 +1 96 +1 108 +1 85 +1 0.79 +1 52 +1 57 +1<br />
Chad 6 10 423 44 124 140 109 0.78 ... ...<br />
Comoros 6 8 16 -2 48 -2 80 -2 82 -2 77 -2 0.94 -2 ... ...<br />
Congo 6 10 119 49 109 109 108 0.99 79 * 78 *<br />
Côte d’Ivoire 6 10 458 +1 47 +1 83 +1 88 +1 78 +1 0.88 +1 45 -1 47 -1<br />
Democratic Republic of the Congo 6 6 2,268 47 111 117 105 0.90 ... ...<br />
Equatorial Guinea 7 6 16 49 92 93 90 0.97 45 42<br />
Eritrea 7 8 59 47 42 44 40 0.91 32 34<br />
Ethiopia . . 3,171 47 137 145 129 0.89 82 86<br />
Gabon 6 10 ... ... ... ... ... ... ... ...<br />
Gambia 7 6 44 ** 50 ** 88 ** 88 ** 88 ** 1.00 ** 57 57<br />
Ghana 4 11 703 +1 49 +1 110 +1 109 +1 111 +1 1.02 +1 46 -1 45 -1<br />
Guinea 7 10 287 45 104 112 96 0.86 71 75<br />
Guinea-Bissau 6 6 67 49 166 169 164 0.97 57 58<br />
Kenya 6 8 ... ... ... ... ... ... 40 ** , -1 39 ** , -1<br />
Lesotho . . 53 48 99 103 94 0.92 64 65<br />
Liberia … … 119 -2 47 -2 116 -2 120 -2 112 -2 0.93 -2 ... ...<br />
Madagascar 6 5 1,095 50 184 184 184 1.00 ... ...<br />
Malawi 6 8 699 51 154 150 159 1.06 92 -1 93 -1<br />
Mali 7 9 374 +1 47 +1 79 +1 82 +1 76 +1 0.92 +1 67 +1 70 +1<br />
Mauritius 5 12 18 50 97 95 99 1.04 82 80<br />
Mozambique 6 7 1,193 +1 48 +1 161 +1 165 +1 157 +1 0.95 +1 68 +1 68 +1<br />
Namibia 7 10 52 -1 50 -1 94 -1 93 -1 95 -1 1.02 -1 72 -1 71 -1<br />
Niger 7 6 470 +1 46 +1 95 +1 100 +1 90 +1 0.89 +1 81 +1 86 +1<br />
Nigeria 6 9 3,974 46 88 93 83 0.89 58 ** 60 **<br />
Rwanda 7 9 583 +1 49 +1 195 +1 200 +1 191 +1 0.95 +1 ... ...<br />
Sao Tome and Principe 6 11 5 +1 47 +1 112 +1 117 +1 107 +1 0.92 +1 97 +1 100 +1<br />
Senegal 7 10 359 51 103 100 106 1.06 83 80<br />
Seychelles 6 10 1 50 105 107 103 0.97 ... ...<br />
Sierra Leone 6 6 218 +1 48 +1 127 +1 133 +1 121 +1 0.91 +1 ... ...<br />
Somalia … … ... ... ... ... ... ... ... ...<br />
South Africa 7 9 926 -1 48 -1 91 -1 94 -1 88 -1 0.94 -1 86 ** , -1 85 ** , -1<br />
Swaziland 6 7 35 48 118 123 113 0.92 84 85<br />
Togo 6 10 247 49 154 157 150 0.96 87 -2 89 -2<br />
Uganda 6 7 1,718 50 155 153 157 1.02 73 71<br />
United Republic of Tanzania 7 7 1,265 50 96 96 97 1.01 85 -2 85 -2<br />
Zambia 7 7 453 50 115 114 117 1.03 61 59<br />
Zimbabwe 6 7 ... ... ... ... ... ... ... ...<br />
REGIONAL AVERAGES<br />
WORLD 134,682 ** 48 ** 110 ** 112 ** 109 ** 0.98 ** 85 ** 86 **<br />
Arab States 7,760 48 ** 101 102 ** 99 ** 0.97 ** 76 ** 78 **<br />
Central and Eastern Europe 4,262 ** 49 ** 99 ** 100 ** 99 ** 0.99 ** 86 ** 85 **<br />
Central Asia 1,349 48 100 101 98 0.97 90 91<br />
East Asia and the Pacific 32,295 47 106 105 107 1.02 93 ** 92 **<br />
Latin America and the Caribbean 13,208 ** 48 ** 119 ** 121 ** 117 ** 0.97 ** 86 ** 86 **<br />
North America and Western Europe 8,861 48 100 100 99 0.98 89 89<br />
South and West Asia 40,666 ** 47 ** 115 ** 117 ** 113 ** 0.97 ** 93 ** 95 **<br />
Sub-Saharan Africa 26,281 48 115 119 111 0.93 65 ** 66 **<br />
96
OPPORTUNITIES LOST: THE IMPACT OF GRADE REPETITION AND EARLY SCHOOL LEAVING<br />
Net intake rate (adjusted) Enrolment Gross enrolment ratio Net enrolment rate (adjusted)<br />
MF<br />
F<br />
GPI (000) % F MF M F GPI MF M F GPI<br />
(11) (12) (13) (14) (15) (16) (17) (18) (19) (20) (21) (22)<br />
48 -1 1.05 -1 331 -1 49 -1 110 -1 112 -1 108 -1 0.96 -1 87 ** , -1 87 ** , -1 88 ** , -1 1.01 ** , -1<br />
28 +1 0.97 +1 2,205 +1 47 +1 79 +1 82 +1 76 +1 0.93 +1 63 +1 65 +1 61 +1 0.94 +1<br />
... ... 1,850 50 156 157 155 0.99 ... ... ... ...<br />
... ... 3,510 46 120 129 111 0.86 94 ** ... ... ...<br />
93 1.01 71 48 110 114 105 0.92 93 95 92 0.98<br />
47 +1 0.82 +1 648 +1 42 +1 94 +1 109 +1 79 +1 0.73 +1 69 +1 78 +1 60 +1 0.76 +1<br />
... ... 1,727 42 93 107 78 0.73 ... ... ... ...<br />
... ... 111 -2 47 -2 104 -2 109 -2 100 -2 0.92 -2 ... ... ... ...<br />
79 * 1.01 * 705 48 115 118 112 0.95 91 * 92 * 89 * 0.97 *<br />
42 -1 0.89 -1 2,758 +1 45 +1 88 +1 96 +1 80 +1 0.83 +1 61 -1 67 -1 56 -1 0.83 -1<br />
... ... 10,572 46 94 100 87 0.87 ... ... ... ...<br />
47 1.11 85 49 87 88 85 0.97 56 57 56 0.99<br />
30 0.89 286 45 45 48 41 0.84 35 37 33 0.87<br />
78 0.92 13,635 47 102 106 97 0.91 82 85 80 0.94<br />
... ... 318 +1 49 +1 182 +1 184 +1 179 +1 0.97 +1 ... ... ... ...<br />
57 1.01 229 50 83 82 84 1.02 69 ** 68 ** 70 ** 1.03 **<br />
47 -1 1.04 -1 3,860 +1 49 +1 107 +1 107 +1 107 +1 1.00 +1 84 +1 84 +1 85 +1 1.01 +1<br />
66 0.88 1,453 45 94 103 86 0.84 77 83 70 0.85<br />
55 0.96 279 48 123 127 119 0.94 75 77 73 0.96<br />
41 ** , -1 1.06 ** , -1 7,150 -1 49 -1 113 -1 115 -1 112 -1 0.98 -1 84 ** , -1 84 ** , -1 85 ** , -1 1.01 ** , -1<br />
63 0.97 389 49 103 104 102 0.98 74 72 75 1.04<br />
... ... 540 -2 47 -2 96 -2 101 -2 91 -2 0.91 -2 ... ... ... ...<br />
... ... 4,242 49 149 150 147 0.98 ... ... ... ...<br />
92 -1 1.00 -1 3,417 50 135 133 138 1.04 97 -1 ... ... ...<br />
63 +1 0.91 +1 2,115 +1 46 +1 82 +1 87 +1 76 +1 0.88 +1 67 +1 72 +1 63 +1 0.87 +1<br />
83 1.04 117 49 99 99 100 1.01 93 92 94 1.02<br />
67 +1 0.99 +1 5,254 +1 47 +1 111 +1 116 +1 105 +1 0.91 +1 90 +1 92 +1 88 +1 0.95 +1<br />
74 -1 1.04 -1 407 -1 49 -1 107 -1 108 -1 107 -1 0.99 -1 86 -1 84 -1 89 -1 1.06 -1<br />
76 +1 0.88 +1 1,910 +1 44 +1 71 +1 77 +1 64 +1 0.84 +1 62 +1 68 +1 57 +1 0.83 +1<br />
55 ** 0.90 ** 20,682 47 83 87 79 0.91 58 ** 60 ** 55 ** 0.91 **<br />
... ... 2,341 +1 51 +1 142 +1 140 +1 143 +1 1.03 +1 99 ... ... ...<br />
94 +1 0.94 +1 35 +1 49 +1 134 +1 136 +1 132 +1 0.97 +1 99 ... ... ...<br />
86 1.07 1,695 51 87 84 89 1.06 78 76 80 1.06<br />
... ... 9 50 117 117 117 1.00 ... ... ... ...<br />
... ... 1,195 +1 49 +1 125 +1 129 +1 120 +1 0.93 +1 ... ... ... ...<br />
... ... ... ... ... ... ... ... ... ... ... ...<br />
86 ** , -1 1.00 ** , -1 7,129 -1 49 -1 102 -1 104 -1 100 -1 0.96 -1 90 ** , -1 90 ** , -1 91 ** , -1 1.01 ** , -1<br />
83 0.97 241 48 116 121 111 0.92 86 86 85 0.99<br />
86 -2 0.97 -2 1,287 47 140 147 132 0.90 94 -2 ... ... ...<br />
75 1.06 8,375 50 121 120 122 1.01 91 90 92 1.03<br />
86 -2 1.01 -2 8,419 50 102 101 103 1.02 98 -2 98 -2 98 -2 1.00 -2<br />
63 1.08 2,899 50 115 115 116 1.01 93 ** 91 ** 94 ** 1.03 **<br />
... ... ... ... ... ... ... ... ... ... ... ...<br />
REGIONAL AVERAGES<br />
85 ** 0.98 ** 691,318 48 106 107 105 0.97 91 ** 92 ** 90 ** 0.98 **<br />
75 ** 0.97 ** 41,741 47 98 102 94 0.93 88 ** 91 ** 85 ** 0.94 **<br />
86 ** 1.01 ** 19,433 ** 49 ** 100 ** 100 ** 99 ** 0.99 ** 95 ** 95 ** 95 ** 1.00 **<br />
89 0.98 5,461 48 101 102 100 0.98 94 95 93 0.99<br />
93 ** 1.01 ** 185,652 47 110 110 111 1.01 96 ** 96 ** 96 ** 1.00 **<br />
87 ** 1.01 ** 66,713 48 114 116 112 0.97 95 ** 96 ** 95 ** 1.00 **<br />
89 1.01 51,145 49 103 103 103 0.99 97 97 98 1.00<br />
92 ** 0.97 ** 188,366 ** 48 ** 106 ** 108 ** 105 ** 0.98 ** 93 ** 94 ** 91 ** 0.98 **<br />
62 ** 0.95 ** 132,809 48 101 105 97 0.93 77 ** 78 ** 75 ** 0.96 **<br />
97
TABLE<br />
3<br />
PRIMARY AND LOWER SECONDARY EDUCATION / ISCED 1 and 2 / Measures of<br />
progression and completion / 2010<br />
REGION<br />
Primary education<br />
Survival rate to the last grade<br />
Gross intake ratio to the last grade<br />
2009 to 2010<br />
Effective transition rate from primary<br />
to secondary education<br />
(general programmes 2009–2010)<br />
98<br />
Country or territory<br />
ARAB STATES<br />
MF M F GPI MF M F GPI MF M F GPI<br />
(1) (2) (3) (4) (5) (6) (7) (8) (9) (10) (11) (12)<br />
Algeria r 96 96 96 1.00 95 93 97 1.04 96 -1 93 -1 100 -1 1.07 -1<br />
Bahrain ... ... ... ... ... ... ... ... 100 -1 100 -1 100 -1 1.00 -1<br />
Djibouti 36 ** , -1 37 ** , -1 34 ** , -1 0.92 ** , -1 64 ** , -1 64 ** , -1 64 ** , -1 1.01 ** , -1 89 ** , -1 91 ** , -1 86 ** , -1 0.95 ** , -1<br />
Egypt 101 ... ... ... ... ... ... ... ... ... ... ...<br />
Iraq ... ... ... ... ... ... ... ... ... ... ... ...<br />
Jordan 90 89 91 1.01 ... ... ... ... 100 ** , -2 100 ** , -2 100 ** , -2 1.00 ** , -2<br />
Kuwait ... ... ... ... 96 96 96 1.00 100 100 100 1.00<br />
Lebanon 87 85 89 1.05 92 -1 90 -1 93 -1 1.03 -1 97 94 100 1.06<br />
Libya ... ... ... ... ... ... ... ... ... ... ... ...<br />
Mauritania 75 74 76 1.03 71 71 70 0.99 ... ... ... ...<br />
Morocco 85 87 82 0.94 91 91 90 1.00 89 92 85 0.93<br />
Oman 101 -1 102 -1 100 -1 0.98 -1 ... ... ... ... ... ... ... ...<br />
Palestine 95 97 93 0.95 ... ... ... ... 97 96 98 1.02<br />
Qatar 100 -1 99 -1 100 -1 1.01 -1 94 -2 91 -2 97 -2 1.07 -2 100 -1 100 -1 99 -1 0.99 -1<br />
Saudi Arabia 93 94 92 0.98 93 * , -2 97 * , -2 90 * , -2 0.93 * , -2 99 ** , -1 100 ** , -1 98 ** , -1 0.98 ** , -1<br />
Sudan (pre-secession) a 58 -1 61 ** , -1 55 ** , -1 0.90 ** , -1 91 -2 86 -2 98 -2 1.14 -2 98 ** , -1 100 ** , -1 95 ** , -1 0.95 ** , -1<br />
Syrian Arab Republic 104 104 103 0.99 95 94 95 1.01 98 98 98 1.00<br />
Tunisia 91 -1 90 -1 92 -1 1.02 -1 95 -1 94 -1 95 -1 1.02 -1 94 -1 94 -1 95 -1 1.01 -1<br />
United Arab Emirates ... ... ... ... ... ... ... ... 98 96 100 1.05<br />
Yemen 63 73 53 0.73 ... ... ... ... ... ... ... ...<br />
CENTRAL AND EASTERN EUROPE<br />
Albania 86 86 86 0.99 95 95 95 1.00 98 98 98 1.00<br />
Belarus 103 ... ... ... 100 ... ... ... 99 ... ... ...<br />
Bosnia and Herzegovina 92 90 94 1.04 99 99 98 0.99 84 85 83 0.98<br />
Bulgaria 106 106 106 1.01 97 98 97 0.99 99 99 98 0.99<br />
Croatia 93 93 93 1.00 99 99 100 1.01 100 100 99 0.99<br />
Czech Republic 101 -1 101 -1 101 -1 1.00 -1 100 -1 99 -1 100 -1 1.00 -1 100 -1 100 -1 100 -1 1.00 -1<br />
Estonia 98 -1 97 -1 98 -1 1.00 -1 98 -1 98 -1 99 -1 1.00 -1 99 -1 100 -1 99 -1 0.99 -1<br />
Hungary 98 -1 98 -1 97 -1 0.99 -1 98 -1 98 -1 98 -1 1.00 -1 100 -1 100 -1 100 -1 1.00 -1<br />
Latvia 92 94 90 0.95 95 95 95 1.00 99 98 100 1.02<br />
Lithuania 99 99 100 1.00 98 98 98 1.00 99 99 99 1.00<br />
Montenegro ... ... ... ... ... ... ... ... ... ... ... ...<br />
Poland 95 -1 95 -1 95 -1 1.00 -1 98 -1 97 -1 98 -1 1.00 -1 99 -1 100 -1 99 -1 0.99 -1<br />
Republic of Moldova 92 * 91 * 93 * 1.01 * 95 94 97 1.04 98 -1 99 -1 98 -1 0.99 -1<br />
Romania 92 92 93 1.00 97 97 97 1.00 99 100 99 0.99<br />
Russian Federation 98 -1 ... ... ... 96 -1 ... ... ... 100 -1 ... ... ...<br />
Serbia 96 * 96 * 97 * 1.00 * … … … … 98 97 100 1.02<br />
Slovakia 99 98 99 1.01 98 98 98 1.00 99 100 99 1.00<br />
Slovenia 95 -1 95 -1 95 -1 1.00 -1 100 -1 100 -1 99 -1 1.00 -1 99 -1 100 -1 99 -1 0.99 -1<br />
The former Yugoslav Rep. of Macedonia 92 -1 92 -1 93 -1 1.02 -1 ... ... ... ... 99 -1 99 -1 99 -1 1.00 -1<br />
Turkey 99 -1 100 -1 98 -1 0.98 -1 92 -1 91 -1 93 -1 1.03 -1 98 -1 98 -1 99 -1 1.01 -1<br />
Ukraine 98 97 98 1.00 98 97 98 1.01 100 * 100 * 100 * 1.00 *<br />
CENTRAL ASIA<br />
Armenia ... ... ... ... ... ... ... ... ... ... ... ...<br />
Azerbaijan 90 * 90 * 89 * 0.99 * 96 95 98 1.02 99 98 99 1.00<br />
Georgia 116 116 116 1.00 96 94 99 1.05 100 100 100 1.00<br />
Kazakhstan 116 +1 116 +1 116 +1 1.00 +1 100 +1 100 +1 100 +1 1.00 +1 100 +1 100 +1 100 +1 1.00 +1<br />
Kyrgyzstan 97 96 97 1.00 98 98 97 0.99 99 100 99 0.99<br />
Mongolia 109 109 109 1.00 94 93 95 1.02 ... ... ... ...<br />
Tajikistan 104 106 102 0.97 99 99 99 1.01 99 100 98 0.98<br />
Turkmenistan ... ... ... ... ... ... ... ... ... ... ... ...<br />
Uzbekistan 93 +1 94 +1 92 +1 0.98 +1 98 +1 98 +1 98 +1 1.01 +1 99 +1 100 +1 98 +1 0.98 +1<br />
EAST ASIA AND THE PACIFIC<br />
Australia ... ... ... ... ... ... ... ... ... ... ... ...<br />
Brunei Darussalam 118 118 118 1.00 96 96 96 1.00 100 99 100 1.01<br />
Cambodia 87 87 87 1.00 54 -2 52 -2 57 -2 1.10 -2 83 82 83 1.01<br />
China ... ... ... ... ... ... ... ... ... ... ... ...
OPPORTUNITIES LOST: THE IMPACT OF GRADE REPETITION AND EARLY SCHOOL LEAVING<br />
Lower secondary education<br />
Gross entry ratio Gross graduation ratio Survival rate to the last grade<br />
General programmes All programmes General programmes General programmes 2009 to 2010<br />
MF M F GPI MF M F GPI MF M F GPI MF M F GPI<br />
(13) (14) (15) (16) (17) (18) (19) (20) (21) (22) (23) (24) (25) (26) (27) (28)<br />
ARAB STATES<br />
200 -1 205 -1 195 -1 0.95 -1 ... ... ... ... ... ... ... ... 70 -1 60 -1 82 -1 1.37 -1<br />
... ... ... ... ... ... ... ... ... ... ... ... 96 -1 93 -1 99 -1 1.06 -1<br />
38 +1 42 +1 34 +1 0.81 +1 26 +1 ... ... ... 24 +1 ... ... ... 83 -1 80 -1 87 -1 1.09 -1<br />
94 -1 95 -1 92 -1 0.98 -1 ... ... ... ... ... ... ... ... ... ... ... ...<br />
... ... ... ... ... ... ... ... ... ... ... ... ... ... ... ...<br />
90 89 90 1.01 79 -2 75 -2 82 -2 1.09 -2 79 -2 75 -2 82 -2 1.09 -2 95 -2 94 -2 97 -2 1.03 -2<br />
109 -2 107 -2 112 -2 1.05 -2 ... ... ... ... ... ... ... ... 94 93 95 1.03<br />
84 80 88 1.11 55 48 62 1.29 52 44 59 1.33 80 77 83 1.09<br />
... ... ... ... ... ... ... ... ... ... ... ... ... ... ... ...<br />
23 -1 25 -1 21 -1 0.82 -1 ... ... ... ... … … … … 77 ** , -1 83 ** , -1 70 ** , -1 0.84 ** , -1<br />
75 +1 81 +1 70 +1 0.86 +1 47 +1 46 +1 47 +1 1.03 +1 47 +1 46 +1 47 +1 1.03 +1 86 +1 84 +1 89 +1 1.06 +1<br />
106 -1 109 -1 104 -1 0.95 -1 ... ... ... ... ... ... ... ... ... ... ... ...<br />
88 87 88 1.01 83 77 89 1.15 83 77 89 1.15 84 78 91 1.17<br />
104 -1 105 -1 102 -1 0.97 -1 ... ... ... ... ... ... ... ... 94 -1 93 -1 95 -1 1.03 -1<br />
96 ** , -1 95 ** , -1 97 ** , -1 1.02 ** , -1 ... ... ... ... ... ... ... ... 95 * , -2 96 * , -2 95 * , -2 0.99 * , -2<br />
55 ** , -1 59 ** , -1 50 ** , -1 0.85 ** , -1 27 -1 ... ... ... 27 -1 ... ... ... 94 ** , -1 ... ... ...<br />
103 103 102 0.99 52 48 56 1.18 52 48 56 1.18 64 63 66 1.05<br />
91 -1 92 -1 90 -1 0.98 -1 55 -2 46 -2 65 -2 1.39 -2 ... ... ... ... 68 -1 59 -1 78 -1 1.31 -1<br />
... ... ... ... ... ... ... ... ... ... ... ... 91 ** ... ... ...<br />
56 66 45 0.69 32 39 25 0.63 32 39 25 0.63 ... ... ... ...<br />
CENTRAL AND EASTERN EUROPE<br />
89 89 90 1.01 93 91 94 1.03 93 91 94 1.03 94 93 94 1.01<br />
100 ... ... ... 96 95 97 1.02 96 95 97 1.02 100 ... ... ...<br />
79 78 79 1.01 ... ... ... ... ... ... ... ... 97 97 97 1.01<br />
96 97 96 0.99 ... ... ... ... ... ... ... ... 56 -2 61 -2 51 -2 0.82 -2<br />
95 95 95 1.00 ... ... ... ... ... ... ... ... 99 99 99 1.00<br />
95 -1 95 -1 95 -1 1.00 -1 ... ... ... ... ... ... ... ... 96 -1 95 -1 97 -1 1.02 -1<br />
97 -1 98 -1 97 -1 0.99 -1 ... ... ... ... ... ... ... ... 99 -1 98 -1 100 -1 1.02 -1<br />
97 -1 98 -1 96 -1 0.98 -1 ... ... ... ... ... ... ... ... ... ... ... ...<br />
90 92 87 0.94 ... ... ... ... ... ... ... ... 98 97 99 1.02<br />
96 97 94 0.97 ... ... ... ... ... ... ... ... ... ... ... ...<br />
... ... ... ... ... ... ... ... ... ... ... ... ... ... ... ...<br />
94 -1 95 -1 93 -1 0.99 -1 ... ... ... ... ... ... ... ... ... ... ... ...<br />
90 * , -1 91 * , -1 88 * , -1 0.97 * , -1 89 * 88 * 90 * 1.02 * 89 * 88 * 90 * 1.02 * 92 -1 92 -1 93 -1 1.01 -1<br />
91 92 91 0.99 ... ... ... ... ... ... ... ... 92 91 93 1.02<br />
95 -1 ... ... ... ... ... ... ... ... ... ... ... 97 -1 ... ... ...<br />
95 * 94 * 95 * 1.01 * 94 * 93 * 96 * 1.04 * 94 * 93 * 96 * 1.04 * 97 98 97 0.99<br />
98 98 98 1.00 ... ... ... ... ... ... ... ... 82 82 81 0.99<br />
96 -1 97 -1 95 -1 0.98 -1 ... ... ... ... ... ... ... ... ... ... ... ...<br />
91 90 93 1.02 ... ... ... ... ... ... ... ... 96 96 96 1.00<br />
97 -1 98 -1 95 -1 0.97 -1 ... ... ... ... ... ... ... ... 94 -1 93 -1 95 -1 1.02 -1<br />
97 97 * 97 * 1.01 * 64 ... ... ... 64 ... ... ... 99 * 99 * 99 * 1.00 *<br />
CENTRAL ASIA<br />
89 87 91 1.05 108 108 109 1.01 108 108 109 1.01 98 98 98 1.00<br />
91 * 91 * 90 * 1.00 * 93 * 95 * 91 * 0.96 * 93 * 95 * 91 * 0.96 * 95 95 94 1.00<br />
110 112 109 0.97 94 97 92 0.95 94 97 92 0.95 99 98 100 1.02<br />
110 +1 110 +1 111 +1 1.01 +1 112 +1 113 +1 112 +1 0.99 +1 112 +1 113 +1 112 +1 0.99 +1 100 +1 100 +1 99 +1 1.00 +1<br />
96 96 96 1.00 84 84 85 1.01 84 84 85 1.01 95 95 94 0.98<br />
91 -1 91 -1 91 -1 1.00 -1 103 100 105 1.05 103 100 105 1.05 96 -1 94 -1 98 -1 1.04 -1<br />
100 103 97 0.94 83 88 78 0.88 83 88 78 0.88 93 96 90 0.94<br />
... ... ... ... ... ... ... ... ... ... ... ... ... ... ... ...<br />
93 +1 95 +1 92 +1 0.96 +1 98 +1 100 +1 96 +1 0.96 +1 98 +1 100 +1 96 +1 0.96 +1 95 +1 95 +1 96 +1 1.02 +1<br />
EAST ASIA AND THE PACIFIC<br />
... ... ... ... ... ... ... ... ... ... ... ... ... ... ... ...<br />
117 115 118 1.03 94 -1 ... ... ... 94 -1 ... ... ... 97 -1 98 -1 96 -1 0.99 -1<br />
70 70 70 1.00 35 -2 38 -2 32 -2 0.85 -2 35 -2 38 -2 32 -2 0.85 -2 64 -2 67 -2 61 -2 0.92 -2<br />
92 90 94 1.05 89 86 93 1.07 ... ... ... ... 98 -2 97 -2 99 -2 1.02 -2<br />
99
TABLE<br />
3<br />
PRIMARY AND LOWER SECONDARY EDUCATION / ISCED 1 and 2 / Measures of<br />
progression and completion / 2010<br />
REGION<br />
Primary education<br />
Survival rate to the last grade<br />
Gross intake ratio to the last grade<br />
2009 to 2010<br />
Effective transition rate from primary<br />
to secondary education<br />
(general programmes 2009–2010)<br />
Country or territory<br />
MF M F GPI MF M F GPI MF M F GPI<br />
(1) (2) (3) (4) (5) (6) (7) (8) (9) (10) (11) (12)<br />
100<br />
China, Hong Kong SAR 96 * , -1 95 * , -1 96 * , -1 1.01 * , -1 100 -2 100 -2 100 -2 1.00 -2 100 * , -1 100 * , -1 100 * , -1 1.00 * , -1<br />
China, Macao SAR 97 95 99 1.04 98 -1 98 -1 99 -1 1.01 -1 100 100 100 1.00<br />
Cook Islands 110 * , +1 103 * , +1 118 * , +1 1.15 * , +1 ... ... ... ... 99 +1 99 +1 100 +1 1.01 +1<br />
Democratic People’s Republic of Korea ... ... ... ... ... ... ... ... ... ... ... ...<br />
Fiji 105 -1 105 -1 105 -1 1.00 -1 91 -1 93 -1 88 -1 0.95 -1 96 -1 96 -1 97 -1 1.02 -1<br />
Indonesia 105 -1 104 -1 105 -1 1.01 -1 80 -2 77 -2 83 -2 1.07 -2 92 -1 91 -1 93 -1 1.02 -1<br />
Japan 102 102 102 1.00 100 100 100 1.00 ... ... ... ...<br />
Kiribati 112 -2 111 -2 113 -2 1.02 -2 ... ... ... ... ... ... ... ...<br />
Lao People’s Democratic Republic 87 89 84 0.94 67 -2 66 -2 68 -2 1.02 -2 82 -2 84 -2 79 -2 0.94 -2<br />
Malaysia ... ... ... ... 98 -1 97 -1 98 -1 1.00 -1 100 -1 100 -1 99 -1 0.99 -1<br />
Marshall Islands 97 +1 94 +1 101 +1 1.08 +1 83 -1 87 -1 80 -1 0.91 -1 91 -1 92 -1 90 -1 0.97 -1<br />
Micronesia (Federated States of) ... ... ... ... ... ... ... ... ... ... ... ...<br />
Myanmar 104 101 106 1.05 75 72 77 1.07 77 77 77 1.00<br />
Nauru ... ... ... ... ... ... ... ... ... ... ... ...<br />
New Zealand ... ... ... ... ... ... ... ... ... ... ... ...<br />
Niue ... ... ... ... ... ... ... ... ... ... ... ...<br />
Palau ... ... ... ... ... ... ... ... ... ... ... ...<br />
Papua New Guinea ... ... ... ... ... ... ... ... ... ... ... ...<br />
Philippines 92 -1 89 -1 94 -1 1.06 -1 76 -1 72 -1 80 -1 1.11 -1 99 -1 100 -1 98 -1 0.98 -1<br />
Republic of Korea 101 102 101 0.99 99 99 99 1.00 100 -1 100 -1 100 -1 1.00 -1<br />
Samoa 101 100 103 1.02 ... ... ... ... 100 100 100 1.00<br />
Singapore ... ... ... ... 99 -1 99 -1 99 -1 1.00 -1 91 -1 88 -1 94 -1 1.07 -1<br />
Solomon Islands ... ... ... ... ... ... ... ... ... ... ... ...<br />
Thailand ... ... ... ... ... ... ... ... ... ... ... ...<br />
Timor-Leste 65 64 67 1.04 67 63 70 1.11 90 88 91 1.03<br />
Tokelau ... ... ... ... ... ... ... ... ... ... ... ...<br />
Tonga ... ... ... ... ... ... ... ... ... ... ... ...<br />
Tuvalu ... ... ... ... ... ... ... ... ... ... ... ...<br />
Vanuatu 83 84 83 0.99 71 -1 74 -1 69 -1 0.94 -1 89 90 89 0.99<br />
Viet Nam ... ... ... ... ... ... ... ... ... ... ... ...<br />
LATIN AMERICA AND THE CARIBBEAN<br />
Anguilla 79 ** , -2 76 ** , -2 81 ** , -2 1.07 ** , -2 ... ... ... ... 95 91 100 1.10<br />
Antigua and Barbuda 100 102 98 0.96 ... ... ... ... 90 100 81 0.81<br />
Argentina 106 -1 104 -1 108 -1 1.03 -1 94 -1 94 -1 94 -1 1.01 -1 99 -1 100 -1 99 -1 0.99 -1<br />
Aruba 91 88 93 1.06 91 -1 86 -1 97 -1 1.13 -1 99 -1 100 -1 97 -1 0.97 -1<br />
Bahamas 97 95 99 1.04 89 91 88 0.96 99 99 99 0.99<br />
Barbados 101 * 96 * 107 * 1.12 * ... ... ... ... 99 * , -1 100 * , -1 98 * , -1 0.98 * , -1<br />
Belize 105 113 98 0.87 90 89 91 1.02 96 95 98 1.03<br />
Bermuda 100 100 ** 100 ** 1.00 ** ... ... ... ... ... ... ... ...<br />
Bolivia (Plurinational State of) 99 -2 100 -2 99 -2 0.99 -2 84 -2 85 -2 82 -2 0.97 -2 96 -2 97 -2 95 -2 0.98 -2<br />
Brazil ... ... ... ... ... ... ... ... ... ... ... ...<br />
British Virgin Islands 99 * 103 * 96 * 0.93 * ... ... ... ... 86 100 74 0.74<br />
Cayman Islands 86 -2 92 -2 80 -2 0.86 -2 ... ... ... ... 97 -2 100 -2 95 -2 0.95 -2<br />
Chile ... ... ... ... ... ... ... ... 93 ** , -2 88 ** , -2 100 ** , -2 1.14 ** , -2<br />
Colombia 114 113 115 1.02 85 84 85 1.01 98 99 97 0.98<br />
Costa Rica 96 95 97 1.02 89 88 90 1.03 92 94 90 0.95<br />
Cuba 99 +1 98 +1 99 +1 1.01 +1 95 +1 94 +1 96 +1 1.02 +1 99 +1 98 +1 99 +1 1.00 +1<br />
Dominica 84 85 83 0.97 88 86 90 1.05 98 100 96 0.96<br />
Dominican Republic 92 93 91 0.99 ... ... ... ... 91 89 93 1.05<br />
Ecuador ... ... ... ... ... ... ... ... ... ... ... ...<br />
El Salvador 96 96 96 0.99 86 86 87 1.01 98 99 97 0.98<br />
Grenada 112 ** 120 ** 103 ** 0.86 ** ... ... ... ... 88 -1 84 -1 92 -1 1.09 -1<br />
Guatemala 84 87 81 0.93 65 -2 65 -2 64 -2 0.98 -2 93 -2 95 -2 91 -2 0.96 -2<br />
Guyana 83 82 85 1.03 83 -1 85 -1 82 -1 0.96 -1 95 94 97 1.03<br />
Haiti ... ... ... ... ... ... ... ... ... ... ... ...<br />
Honduras 99 96 102 1.06 76 -2 74 -2 79 -2 1.07 -2 ... ... ... ...<br />
Jamaica 73 74 73 0.99 95 94 96 1.02 99 100 99 0.99<br />
Mexico 105 105 105 1.01 94 93 95 1.02 95 96 95 0.99
OPPORTUNITIES LOST: THE IMPACT OF GRADE REPETITION AND EARLY SCHOOL LEAVING<br />
Lower secondary education<br />
Gross entry ratio Gross graduation ratio Survival rate to the last grade<br />
General programmes All programmes General programmes General programmes 2009 to 2010<br />
MF M F GPI MF M F GPI MF M F GPI MF M F GPI<br />
(13) (14) (15) (16) (17) (18) (19) (20) (21) (22) (23) (24) (25) (26) (27) (28)<br />
95 * 95 * 96 * 1.01 * 93 91 95 1.05 93 91 95 1.05 98 * 97 * 100 * 1.02 *<br />
96 99 94 0.95 89 97 81 0.84 89 97 81 0.84 96 95 98 1.03<br />
102 * , +1 99 * , +1 105 * , +1 1.05 * , +1 ... ... ... ... ... ... ... ... 79 ** , +1 ... ... ...<br />
... ... ... ... ... ... ... ... ... ... ... ... ... ... ... ...<br />
102 -1 102 -1 103 -1 1.01 -1 ... ... ... ... ... ... ... ... 79 -1 74 -1 84 -1 1.13 -1<br />
93 -1 93 -1 93 -1 1.00 -1 76 74 77 1.04 76 74 77 1.04 93 -1 92 -1 93 -1 1.01 -1<br />
... ... ... ... ... ... ... ... ... ... ... ... ... ... ... ...<br />
... ... ... ... ... ... ... ... ... ... ... ... ... ... ... ...<br />
69 74 63 0.85 39 42 36 0.86 39 42 36 0.86 76 -2 76 -2 77 -2 1.01 -2<br />
94 -1 95 -1 94 -1 1.00 -1 88 -1 86 -1 90 -1 1.04 -1 88 -1 86 -1 90 -1 1.04 -1 92 -1 89 -1 95 -1 1.07 -1<br />
122 +1 122 +1 122 +1 1.00 +1 ... ... ... ... ... ... ... ... 97 -1 95 -1 98 -1 1.03 -1<br />
... ... ... ... ... ... ... ... ... ... ... ... ... ... ... ...<br />
77 76 78 1.02 47 45 48 1.06 47 45 48 1.06 69 65 74 1.14<br />
... ... ... ... ... ... ... ... ... ... ... ... ... ... ... ...<br />
... ... ... ... ... ... ... ... ... ... ... ... ... ... ... ...<br />
... ... ... ... ... ... ... ... ... ... ... ... ... ... ... ...<br />
... ... ... ... ... ... ... ... ... ... ... ... ... ... ... ...<br />
... ... ... ... ... ... ... ... ... ... ... ... ... ... ... ...<br />
91 -1 90 -1 93 -1 1.04 -1 69 -1 62 -1 77 -1 1.24 -1 69 -1 62 -1 77 -1 1.24 -1 86 -1 83 -1 90 -1 1.08 -1<br />
100 -1 100 -1 99 -1 0.99 -1 ... ... ... ... ... ... ... ... ... ... ... ...<br />
102 105 100 0.96 41 35 48 1.37 ... ... ... ... 99 100 98 0.98<br />
... ... ... ... ... ... ... ... ... ... ... ... 100 -1 99 -1 100 -1 1.01 -1<br />
... ... ... ... ... ... ... ... ... ... ... ... ... ... ... ...<br />
... ... ... ... 76 +1 71 +1 81 +1 1.13 +1 76 +1 71 +1 81 +1 1.13 +1 ... ... ... ...<br />
60 58 61 1.04 63 62 64 1.03 63 62 64 1.03 92 91 93 1.01<br />
... ... ... ... ... ... ... ... ... ... ... ... ... ... ... ...<br />
... ... ... ... ... ... ... ... ... ... ... ... ... ... ... ...<br />
... ... ... ... ... ... ... ... ... ... ... ... ... ... ... ...<br />
73 74 72 0.97 23 21 26 1.21 23 21 26 1.21 71 74 69 0.93<br />
... ... ... ... ... ... ... ... ... ... ... ... ... ... ... ...<br />
LATIN AMERICA AND THE CARIBBEAN<br />
76 ** , -2 103 ** , -2 55 ** , -2 0.53 ** , -2 ... ... ... ... ... ... ... ... 99 ** ... ... ...<br />
108 120 97 0.81 82 78 87 1.12 79 75 82 1.08 73 * 70 * 76 * 1.09 *<br />
108 -1 106 -1 109 -1 1.03 -1 70 -1 63 -1 77 -1 1.21 -1 70 -1 63 -1 77 -1 1.21 -1 ... ... ... ...<br />
94 -1 93 -1 95 -1 1.02 -1 63 59 66 1.12 60 54 65 1.19 ... ... ... ...<br />
100 99 102 1.03 97 98 97 1.00 97 98 97 1.00 97 94 100 1.06<br />
99 * , -1 95 * , -1 103 * , -1 1.08 * , -1 ... ... ... ... ... ... ... ... 96 ** , -1 ... ... ...<br />
... ... ... ... 46 43 48 1.13 46 43 48 1.13 67 63 71 1.13<br />
... ... ... ... ... ... ... ... ... ... ... ... ... ... ... ...<br />
91 -1 91 -1 91 -1 1.00 -1 82 -1 80 -1 84 -1 1.05 -1 82 -1 80 -1 84 -1 1.05 -1 94 -1 93 -1 95 -1 1.02 -1<br />
... ... ... ... ... ... ... ... ... ... ... ... ... ... ... ...<br />
106 * 107 * 106 * 0.99 * 92 * , -1 123 * , -1 61 * , -1 0.49 * , -1 ... ... ... ... 88 ** ... ... ...<br />
89 -2 81 -2 97 -2 1.20 -2 85 ** , -2 83 ** , -2 88 ** , -2 1.06 ** , -2 85 ** , -2 83 ** , -2 88 ** , -2 1.06 ** , -2 95 ** , -2 ... ... ...<br />
97 -1 98 -1 97 -1 0.99 -1 ... ... ... ... ... ... ... ... ... ... ... ...<br />
113 112 114 1.01 86 81 92 1.12 86 81 92 1.12 83 79 86 1.09<br />
88 89 87 0.97 55 * 51 * 60 * 1.19 * 46 * 42 * 50 * 1.19 * 63 59 68 1.16<br />
97 +1 96 +1 98 +1 1.02 +1 90 +1 92 +1 88 +1 0.95 +1 86 +1 85 +1 86 +1 1.01 +1 97 +1 97 +1 97 +1 1.00 +1<br />
88 91 85 0.93 106 103 110 1.07 93 92 94 1.02 90 87 93 1.07<br />
85 83 87 1.05 82 80 85 1.06 82 80 85 1.06 94 94 94 1.01<br />
94 -1 92 -1 96 -1 1.05 -1 60 -1 56 -1 64 -1 1.14 -1 60 -1 56 -1 64 -1 1.14 -1 ... ... ... ...<br />
92 91 92 1.01 71 69 73 1.05 71 69 73 1.05 86 85 87 1.03<br />
98 -1 99 -1 97 -1 0.98 -1 124 121 126 1.05 107 101 114 1.13 69 -1 67 -1 71 -1 1.07 -1<br />
78 82 74 0.90 37 37 37 1.01 37 37 37 1.01 75 -2 72 -2 79 -2 1.09 -2<br />
88 85 92 1.08 ... ... ... ... ... ... ... ... 88 81 94 1.16<br />
... ... ... ... ... ... ... ... ... ... ... ... ... ... ... ...<br />
... ... ... ... 46 40 52 1.30 46 40 52 1.30 ... ... ... ...<br />
78 79 78 0.99 ... ... ... ... ... ... ... ... ... ... ... ...<br />
99 100 99 0.99 ... ... ... ... ... ... ... ... 89 86 91 1.06<br />
101
TABLE<br />
3<br />
PRIMARY AND LOWER SECONDARY EDUCATION / ISCED 1 and 2 / Measures of<br />
progression and completion / 2010<br />
REGION<br />
Primary education<br />
Survival rate to the last grade<br />
Gross intake ratio to the last grade<br />
2009 to 2010<br />
Effective transition rate from primary<br />
to secondary education<br />
(general programmes 2009–2010)<br />
102<br />
Country or territory<br />
MF M F GPI MF M F GPI MF M F GPI<br />
(1) (2) (3) (4) (5) (6) (7) (8) (9) (10) (11) (12)<br />
Montserrat ... ... ... ... ... ... ... ... ... ... ... ...<br />
Netherlands Antilles a ... ... ... ... ... ... ... ... ... ... ... ...<br />
Nicaragua 81 78 84 1.08 48 -2 45 -2 52 -2 1.17 -2 97 -2 100 -2 94 -2 0.94 -2<br />
Panama 97 97 97 1.00 94 94 94 1.00 99 100 97 0.97<br />
Paraguay 94 -1 92 -1 95 -1 1.03 -1 78 -1 76 -1 80 -1 1.06 -1 90 -1 90 -1 90 -1 1.00 -1<br />
Peru 100 99 100 1.01 90 90 91 1.01 97 98 95 0.97<br />
Puerto Rico ... ... ... ... ... ... ... ... ... ... ... ...<br />
Saint Kitts and Nevis 89 89 89 1.00 74 78 70 0.90 97 * 100 * 93 * 0.93 *<br />
Saint Lucia 90 92 87 0.95 92 93 91 0.97 97 96 98 1.02<br />
Saint Vincent and the Grenadines 94 97 92 0.95 ... ... ... ... 96 100 93 0.93<br />
Suriname 86 -1 81 -1 91 -1 1.12 -1 90 -1 82 -1 100 -1 1.21 -1 56 -1 48 -1 63 -1 1.32 -1<br />
Trinidad and Tobago 91 91 91 1.00 89 * 87 * 92 * 1.06 * 94 * 94 * 94 * 1.00 *<br />
Turks and Caicos Islands ... ... ... ... ... ... ... ... ... ... ... ...<br />
Uruguay 106 -1 105 -1 106 -1 1.01 -1 95 -1 94 -1 97 -1 1.04 -1 82 -1 76 -1 88 -1 1.15 -1<br />
Venezuela (Bolivarian Republic of) 94 93 95 1.02 92 90 94 1.05 98 98 98 1.00<br />
NORTH AMERICA AND WESTERN EUROPE<br />
Andorra ... ... ... ... ... ... ... ... ... ... ... ...<br />
Austria 98 99 98 1.00 97 96 98 1.03 100 100 100 1.00<br />
Belgium 90 -1 89 -1 92 -1 1.04 -1 93 -1 92 -1 95 -1 1.03 -1 99 -1 100 -1 98 -1 0.98 -1<br />
Canada ... ... ... ... ... ... ... ... ... ... ... ...<br />
Cyprus 103 * 102 * 105 * 1.03 * 95 -2 94 -2 97 -2 1.03 -2 100 100 100 1.00<br />
Denmark 97 -1 97 -1 98 -1 1.00 -1 99 -1 99 -1 100 -1 1.00 -1 100 -1 100 -1 100 -1 1.00 -1<br />
Finland 98 98 99 1.01 100 100 100 1.00 100 100 100 1.00<br />
France ... ... ... ... ... ... ... ... ... ... ... ...<br />
Germany 101 101 101 1.00 96 96 97 1.01 99 100 99 0.99<br />
Gibraltar ... ... ... ... ... ... ... ... ... ... ... ...<br />
Greece ... ... ... ... ... ... ... ... ... ... ... ...<br />
Holy See . . . . . . . . . . . .<br />
Iceland 99 -1 100 -1 99 -1 0.99 -1 ... ... ... ... 100 -1 100 -1 100 -1 1.00 -1<br />
Ireland 103 102 104 1.02 ... ... ... ... ... ... ... ...<br />
Israel 103 -1 102 -1 105 -1 1.02 -1 99 -1 100 -1 98 -1 0.98 -1 100 -1 100 -1 100 -1 1.00 -1<br />
Italy 103 103 104 1.01 100 99 100 1.00 100 100 100 1.00<br />
Liechtenstein 111 * 116 * 107 * 0.92 * … … … … 98 100 96 0.96<br />
Luxembourg ... ... ... ... ... ... ... ... ... ... ... ...<br />
Malta 97 96 97 1.01 … … … … 98 100 96 0.96<br />
Monaco ... ... ... ... ... ... ... ... ... ... ... ...<br />
Netherlands ... ... ... ... ... ... ... ... ... ... ... ...<br />
Norway 99 99 99 1.00 99 99 99 1.00 100 100 100 1.00<br />
Portugal ... ... ... ... ... ... ... ... ... ... ... ...<br />
San Marino 101 ** 96 ** 107 ** 1.12 ** ... ... ... ... 100 100 99 0.99<br />
Spain 103 104 103 0.99 99 -1 99 -1 100 -1 1.01 -1 99 98 99 1.01<br />
Sweden 97 97 97 0.99 99 99 100 1.00 100 100 100 1.00<br />
Switzerland 96 94 97 1.03 ... ... ... ... 100 100 100 1.00<br />
United Kingdom ... ... ... ... ... ... ... ... ... ... ... ...<br />
United States of America 104 ** 103 ** 104 ** 1.01 ** … … … … ... ... ... ...<br />
SOUTH AND WEST ASIA<br />
Afghanistan ... ... ... ... ... ... ... ... ... ... ... ...<br />
Bangladesh ... ... ... ... 66 * 62 * 71 * 1.14 * 94 * 87 * 100 * 1.15 *<br />
Bhutan 95 +1 92 +1 98 +1 1.06 +1 91 +1 89 +1 93 +1 1.05 +1 100 +1 99 +1 100 +1 1.01 +1<br />
India 96 -2 96 -2 95 -2 0.99 -2 ... ... ... ... 85 -2 85 -2 84 -2 1.00 -2<br />
Iran (Islamic Republic of) 104 -1 104 -1 104 -1 1.00 -1 94 -1 94 -1 94 -1 1.00 -1 97 -1 97 -1 98 -1 1.01 -1<br />
Maldives 118 +1 127 +1 109 +1 0.86 +1 ... ... ... ... 96 -1 93 -1 100 -1 1.07 -1<br />
Nepal ... ... ... ... 62 -2 60 -2 64 -2 1.07 -2 88 -2 88 -2 88 -2 1.00 -2<br />
Pakistan 67 75 59 0.79 62 64 59 0.92 77 77 77 1.00<br />
Sri Lanka 101 101 101 1.00 ... ... ... ... 97 100 94 0.94<br />
SUB-SAHARAN AFRICA<br />
Angola 47 * 53 * 40 * 0.75 * 32 * 37 * 27 * 0.73 * 41 -1 31 -1 53 -1 1.73 -1<br />
Benin 63 ** , -1 74 ** , -1 53 ** , -1 0.72 ** , -1 ... ... ... ... ... ... ... ...
OPPORTUNITIES LOST: THE IMPACT OF GRADE REPETITION AND EARLY SCHOOL LEAVING<br />
Lower secondary education<br />
Gross entry ratio Gross graduation ratio Survival rate to the last grade<br />
General programmes All programmes General programmes General programmes 2009 to 2010<br />
MF M F GPI MF M F GPI MF M F GPI MF M F GPI<br />
(13) (14) (15) (16) (17) (18) (19) (20) (21) (22) (23) (24) (25) (26) (27) (28)<br />
... ... ... ... ... ... ... ... ... ... ... ... ... ... ... ...<br />
... ... ... ... ... ... ... ... ... ... ... ... ... ... ... ...<br />
88 88 88 1.00 43 36 50 1.40 42 35 49 1.40 64 -2 59 -2 70 -2 1.20 -2<br />
101 103 100 0.97 60 56 65 1.16 60 56 65 1.16 78 75 81 1.09<br />
85 -1 84 -1 86 -1 1.02 -1 65 -1 64 -1 67 -1 1.05 -1 ... ... ... ... 82 -1 80 -1 84 -1 1.04 -1<br />
96 97 94 0.98 73 71 75 1.06 73 71 75 1.06 84 81 86 1.06<br />
... ... ... ... 76 73 78 1.07 76 73 78 1.07 ... ... ... ...<br />
98 * 99 * 98 * 0.99 * 99 98 100 1.03 99 98 100 1.03 89 ** ... ... ...<br />
93 97 90 0.93 116 121 112 0.93 114 117 110 0.94 98 98 98 1.00<br />
116 124 108 0.87 112 -1 111 -1 114 -1 1.03 -1 112 -1 111 -1 114 -1 1.03 -1 87 81 94 1.15<br />
50 -1 38 -1 62 -1 1.62 -1 60 -1 50 -1 71 -1 1.42 -1 ... ... ... ... 67 -1 62 -1 71 -1 1.15 -1<br />
86 86 87 1.01 ... ... ... ... ... ... ... ... 86 * 81 * 91 * 1.12 *<br />
... ... ... ... ... ... ... ... ... ... ... ... ... ... ... ...<br />
88 -1 81 -1 96 -1 1.19 -1 86 -2 82 -2 91 -2 1.10 -2 ... ... ... ... 88 -1 84 -1 91 -1 1.09 -1<br />
93 92 94 1.03 71 65 77 1.17 71 65 77 1.17 83 78 87 1.12<br />
NORTH AMERICA AND WESTERN EUROPE<br />
88 89 88 0.99 ... ... ... ... ... ... ... ... 85 81 89 1.10<br />
99 99 100 1.00 ... ... ... ... ... ... ... ... 99 99 100 1.01<br />
94 -1 93 -1 95 -1 1.02 -1 ... ... ... ... ... ... ... ... 96 -1 95 -1 97 -1 1.03 -1<br />
... ... ... ... ... ... ... ... ... ... ... ... ... ... ... ...<br />
103 * 103 * 104 * 1.00 * ... ... ... ... ... ... ... ... 99 99 99 1.00<br />
100 -1 100 -1 101 -1 1.01 -1 ... ... ... ... ... ... ... ... 100 -1 100 -1 100 -1 1.00 -1<br />
98 98 98 1.00 ... ... ... ... ... ... ... ... 100 100 100 1.00<br />
105 104 105 1.01 ... ... ... ... ... ... ... ... 99 98 99 1.02<br />
109 109 108 0.99 ... ... ... ... ... ... ... ... … … … …<br />
... ... ... ... ... ... ... ... ... ... ... ... ... ... ... ...<br />
... ... ... ... ... ... ... ... ... ... ... ... ... ... ... ...<br />
. . . . . . . . . . . . . . . .<br />
96 -1 96 -1 95 -1 0.99 -1 ... ... ... ... ... ... ... ... ... ... ... ...<br />
105 105 106 1.02 ... ... ... ... ... ... ... ... 99 99 99 1.00<br />
100 -1 100 -1 101 -1 1.01 -1 ... ... ... ... ... ... ... ... 90 -1 89 -1 91 -1 1.02 -1<br />
104 103 104 1.01 ... ... ... ... ... ... ... ... 100 99 100 1.01<br />
95 * 94 * 95 * 1.01 * ... ... ... ... ... ... ... ... 93 -2 89 -2 96 -2 1.08 -2<br />
96 -2 95 -2 97 -2 1.02 -2 ... ... ... ... ... ... ... ... ... ... ... ...<br />
120 124 115 0.93 ... ... ... ... ... ... ... ... 78 72 86 1.19<br />
... ... ... ... ... ... ... ... ... ... ... ... ... ... ... ...<br />
95 93 97 1.03 ... ... ... ... ... ... ... ... … … … …<br />
100 100 100 1.00 ... ... ... ... ... ... ... ... 100 100 99 0.99<br />
... ... ... ... ... ... ... ... ... ... ... ... ... ... ... ...<br />
97 ** 95 ** 99 ** 1.04 ** ... ... ... ... ... ... ... ... 96 96 95 0.99<br />
103 103 103 1.00 ... ... ... ... ... ... ... ... 80 75 85 1.13<br />
95 94 95 1.00 ... ... ... ... ... ... ... ... 100 100 100 1.00<br />
100 98 102 1.04 ... ... ... ... ... ... ... ... 95 94 96 1.02<br />
... ... ... ... ... ... ... ... ... ... ... ... ... ... ... ...<br />
... ... ... ... ... ... ... ... ... ... ... ... ... ... ... ...<br />
SOUTH AND WEST ASIA<br />
... ... ... ... ... ... ... ... ... ... ... ... ... ... ... ...<br />
72 64 80 1.27 ... ... ... ... ... ... ... ... 84 79 89 1.12<br />
95 +1 89 +1 102 +1 1.16 +1 67 -1 67 -1 67 -1 1.00 -1 67 -1 67 -1 67 -1 1.00 -1 91 +1 93 +1 89 +1 0.96 +1<br />
80 -2 82 -2 78 -2 0.96 -2 ... ... ... ... ... ... ... ... ... ... ... ...<br />
97 -1 97 -1 97 -1 1.00 -1 80 -1 70 -1 91 -1 1.30 -1 80 -1 70 -1 91 -1 1.30 -1 92 -1 92 -1 92 -1 1.00 -1<br />
127 -1 130 -1 124 -1 0.96 -1 ... ... ... ... ... ... ... ... 80 -2 75 -2 86 -2 1.16 -2<br />
... ... ... ... ... ... ... ... ... ... ... ... 92 +1 91 +1 94 +1 1.04 +1<br />
48 53 42 0.78 35 41 29 0.70 35 41 29 0.70 86 87 85 0.98<br />
103 106 101 0.95 ... ... ... ... ... ... ... ... 87 -1 86 -1 89 -1 1.04 -1<br />
SUB-SAHARAN AFRICA<br />
19 -1 16 -1 22 -1 1.39 -1 26 29 23 0.81 19 19 18 0.96 ... ... ... ...<br />
... ... ... ... ... ... ... ... ... ... ... ... ... ... ... ...<br />
103
TABLE<br />
3<br />
REGION<br />
PRIMARY AND LOWER SECONDARY EDUCATION / ISCED 1 and 2 / Measures of<br />
progression and completion / 2010<br />
Gross intake ratio to the last grade<br />
Primary education<br />
Survival rate to the last grade<br />
2009 to 2010<br />
Effective transition rate from primary<br />
to secondary education<br />
(general programmes 2009–2010)<br />
Country or territory<br />
MF M F GPI MF M F GPI MF M F GPI<br />
(1) (2) (3) (4) (5) (6) (7) (8) (9) (10) (11) (12)<br />
Botswana 97 ** , -1 97 ** , -1 98 ** , -1 1.01 ** , -1 93 ** , -1 91 ** , -1 95 ** , -1 1.04 ** , -1 ... ... ... ...<br />
Burkina Faso 45 48 42 0.88 64 61 67 1.09 75 76 73 0.96<br />
Burundi 56 57 55 0.96 56 52 61 1.18 70 76 63 0.84<br />
Cameroon 79 85 72 0.85 66 67 65 0.98 51 -1 50 -1 53 -1 1.06 -1<br />
Cape Verde 99 100 98 0.98 86 -2 85 -2 87 -2 1.03 -2 96 94 99 1.05<br />
Central African Republic 43 +1 53 +1 33 +1 0.62 +1 46 +1 49 +1 44 +1 0.90 +1 59 59 59 0.99<br />
Chad 35 43 26 0.60 28 28 27 0.96 91 96 82 0.85<br />
Comoros 75 -2 84 -2 65 -2 0.78 -2 ... ... ... ... ... ... ... ...<br />
Congo 71 73 69 0.94 70 ** , -2 71 ** , -2 71 ** , -2 1.00 ** , -2 76 77 74 0.97<br />
Côte d’Ivoire 59 +1 65 +1 52 +1 0.80 +1 61 -1 62 -1 59 -1 0.96 -1 69 -1 70 -1 67 -1 0.96 -1<br />
Democratic Republic of the Congo 59 67 50 0.75 55 58 51 0.88 89 * , -2 92 * , -2 85 * , -2 0.93 * , -2<br />
Equatorial Guinea 52 52 53 1.01 62 60 64 1.08 ... ... ... ...<br />
Eritrea 40 43 36 0.84 69 71 67 0.94 90 91 90 0.99<br />
Ethiopia 72 75 69 0.92 47 47 48 1.00 93 94 92 0.98<br />
Gabon ... ... ... ... ... ... ... ... ... ... ... ...<br />
Gambia 71 ** 69 ** 72 ** 1.03 ** … … … … 83 ** 82 ** 84 ** 1.02 **<br />
Ghana 94 +1 97 +1 91 +1 0.95 +1 72 -1 76 -1 69 -1 0.91 -1 96 -1 94 -1 97 -1 1.03 -1<br />
Guinea 64 75 53 0.71 66 74 56 0.76 77 82 70 0.86<br />
Guinea-Bissau 68 75 60 0.80 ... ... ... ... ... ... ... ...<br />
Kenya ... ... ... ... ... ... ... ... ... ... ... ...<br />
Lesotho 70 60 79 1.31 69 62 77 1.24 86 ** 87 ** 85 ** 0.98 **<br />
Liberia 62 -2 67 -2 57 -2 0.85 -2 46 -2 49 -2 43 -2 0.88 -2 66 -2 67 -2 64 -2 0.95 -2<br />
Madagascar 72 72 73 1.02 35 34 35 1.05 73 74 72 0.97<br />
Malawi 67 65 68 1.04 53 52 54 1.03 90 91 88 0.97<br />
Mali 55 +1 61 +1 50 +1 0.81 +1 75 +1 77 +1 74 +1 0.95 +1 86 87 85 0.98<br />
Mauritius 96 96 96 1.01 98 98 97 0.99 85 82 89 1.09<br />
Mozambique 56 +1 61 +1 52 +1 0.85 +1 … … … … 59 +1 57 +1 62 +1 1.08 +1<br />
Namibia 84 -1 80 -1 88 -1 1.11 -1 83 -1 80 -1 85 -1 1.07 -1 94 -1 93 -1 95 -1 1.01 -1<br />
Niger 46 +1 52 +1 40 +1 0.76 +1 69 +1 71 +1 67 +1 0.94 +1 72 +1 74 +1 70 +1 0.95 +1<br />
Nigeria 74 79 70 0.88 80 77 83 1.07 ... ... ... ...<br />
Rwanda 70 65 74 1.13 37 35 39 1.11 77 77 77 0.99<br />
Sao Tome and Principe 115 +1 112 +1 117 +1 1.04 +1 68 ** , -1 62 ** , -1 75 ** , -1 1.21 ** , -1 97 +1 95 +1 99 +1 1.04 +1<br />
Senegal 59 58 61 1.05 60 58 61 1.05 79 81 77 0.95<br />
Seychelles 133 135 132 0.98 ... ... ... ... 98 98 98 1.00<br />
Sierra Leone 74 +1 78 +1 71 +1 0.92 +1 ... ... ... ... ... ... ... ...<br />
Somalia ... ... ... ... ... ... ... ... ... ... ... ...<br />
South Africa ... ... ... ... ... ... ... ... ... ... ... ...<br />
Swaziland 77 76 78 1.03 84 81 87 1.07 98 97 99 1.02<br />
Togo 74 84 64 0.76 59 55 67 1.23 85 88 80 0.91<br />
Uganda 57 58 56 0.97 32 32 32 1.01 64 65 62 0.96<br />
United Republic of Tanzania 90 88 92 1.05 81 76 87 1.13 41 ** 45 ** 37 ** 0.83 **<br />
Zambia 103 98 108 1.10 53 -1 55 -1 52 -1 0.95 -1 74 73 74 1.02<br />
Zimbabwe ... ... ... ... ... ... ... ... ... ... ... ...<br />
104
OPPORTUNITIES LOST: THE IMPACT OF GRADE REPETITION AND EARLY SCHOOL LEAVING<br />
Lower secondary education<br />
Gross entry ratio Gross graduation ratio Survival rate to the last grade<br />
General programmes All programmes General programmes General programmes 2009 to 2010<br />
MF M F GPI MF M F GPI MF M F GPI MF M F GPI<br />
(13) (14) (15) (16) (17) (18) (19) (20) (21) (22) (23) (24) (25) (26) (27) (28)<br />
... ... ... ... ... ... ... ... ... ... ... ... ... ... ... ...<br />
32 +1 27 +1 36 +1 1.35 +1 12 +1 ... ... ... 10 +1 ... ... ... 69 ** , +1 ... ... ...<br />
33 39 28 0.73 10 -1 12 -1 8 -1 0.64 -1 10 -1 12 -1 8 -1 0.65 -1 87 ** ... ... ...<br />
39 -1 41 -1 36 -1 0.89 -1 27 -1 ... ... ... 23 -1 ... ... ... ... ... ... ...<br />
94 91 96 1.06 61 52 70 1.34 61 52 70 1.34 83 76 89 1.17<br />
23 29 18 0.62 ... ... ... ... ... ... ... ... 29 30 28 0.93<br />
32 43 21 0.48 17 24 9 0.38 16 24 9 0.40 52 56 45 0.80<br />
... ... ... ... ... ... ... ... ... ... ... ... ... ... ... ...<br />
53 56 51 0.90 ... ... ... ... ... ... ... ... 76 77 74 0.98<br />
36 +1 43 +1 28 +1 0.65 +1 ... ... ... ... 12 -1 16 -1 8 -1 0.49 -1 87 ** , -1 ... ... ...<br />
45 * , -2 55 * , -2 34 * , -2 0.63 * , -2 ... ... ... ... ... ... ... ... ... ... ... ...<br />
... ... ... ... ... ... ... ... ... ... ... ... ... ... ... ...<br />
43 48 39 0.81 34 -1 39 -1 29 -1 0.74 -1 34 -1 39 -1 29 -1 0.74 -1 79 74 87 1.17<br />
52 55 49 0.88 29 33 25 0.74 29 33 25 0.74 63 62 65 1.04<br />
... ... ... ... ... ... ... ... ... ... ... ... ... ... ... ...<br />
63 ** 61 ** 65 ** 1.06 ** ... ... ... ... ... ... ... ... 86 ** 89 ** 82 ** 0.93 **<br />
89 +1 91 +1 86 +1 0.95 +1 66 -2 70 -2 61 -2 0.87 -2 66 -2 70 -2 61 -2 0.87 -2 86 -1 89 -1 82 -1 0.92 -1<br />
48 59 37 0.63 ... ... ... ... 18 25 12 0.46 79 75 85 1.13<br />
60 70 49 0.70 ... ... ... ... 28 35 21 0.61 ... ... ... ...<br />
... ... ... ... 80 -1 83 -1 76 -1 0.91 -1 80 -1 83 -1 76 -1 0.91 -1 ... ... ... ...<br />
58 ** 50 ** 67 ** 1.34 ** 27 ... ... ... 27 ... ... ... 71 ** 74 ** 69 ** 0.93 **<br />
44 -2 49 -2 39 -2 0.80 -2 ... ... ... ... ... ... ... ... ... ... ... ...<br />
61 62 60 0.98 16 -1 16 -1 15 -1 0.95 -1 15 -1 15 -1 14 -1 0.94 -1 66 67 65 0.97<br />
57 57 58 1.01 20 23 17 0.75 20 23 17 0.75 34 35 33 0.95<br />
46 52 40 0.77 27 -2 33 -2 20 -2 0.60 -2 27 -2 33 -2 20 -2 0.60 -2 86 86 86 1.00<br />
79 75 83 1.10 ... ... ... ... 73 68 79 1.16 98 96 99 1.03<br />
35 +1 37 +1 34 +1 0.91 +1 20 23 18 0.80 19 21 17 0.82 68 +1 66 +1 70 +1 1.07 +1<br />
76 -1 71 -1 82 -1 1.15 -1 ... ... ... ... ... ... ... ... 80 -1 79 -1 81 -1 1.03 -1<br />
31 +1 36 +1 25 +1 0.70 +1 4 -1 5 -1 3 -1 0.54 -1 4 -1 ... ... ... 35 +1 36 +1 34 +1 0.95 +1<br />
... ... ... ... 42 -1 45 -1 39 -1 0.87 -1 ... ... ... ... ... ... ... ...<br />
52 50 55 1.10 22 +1 23 +1 21 +1 0.93 +1 22 +1 23 +1 21 +1 0.93 +1 ... ... ... ...<br />
83 +1 78 +1 89 +1 1.13 +1 ... ... ... ... ... ... ... ... 85 +1 75 +1 94 +1 1.24 +1<br />
49 50 49 0.96 ... ... ... ... 18 ... ... ... 88 86 91 1.05<br />
131 129 133 1.03 ... ... ... ... ... ... ... ... 95 100 90 0.90<br />
56 +1 63 +1 50 +1 0.80 +1 ... ... ... ... ... ... ... ... ... ... ... ...<br />
... ... ... ... ... ... ... ... ... ... ... ... ... ... ... ...<br />
... ... ... ... 34 -1 31 -1 36 -1 1.15 -1 ... ... ... ... ... ... ... ...<br />
71 70 72 1.03 ... ... ... ... ... ... ... ... 80 82 77 0.94<br />
60 71 48 0.68 ... ... ... ... 32 34 30 0.89 78 -2 84 -2 69 -2 0.81 -2<br />
38 39 37 0.93 32 35 29 0.82 ... ... ... ... 71 71 72 1.01<br />
42 ** 46 ** 38 ** 0.83 ** ... ... ... ... ... ... ... ... 64 -1 65 -1 63 -1 0.98 -1<br />
67 70 64 0.91 83 87 78 0.90 83 87 78 0.90 88 88 88 1.00<br />
... ... ... ... ... ... ... ... ... ... ... ... ... ... ... ...<br />
105
TABLE<br />
4<br />
PRIMARY AND LOWER SECONDARY EDUCATION / ISCED 1 and 2 / Out-of-school<br />
children / 2010<br />
106<br />
REGION<br />
Country or territory<br />
ARAB STATES<br />
Age group<br />
ISCED<br />
1<br />
ISCED<br />
2<br />
Out-of-school rate (%)<br />
Out-of-school children of primary school age<br />
Number out of<br />
school<br />
Share of children of primary<br />
school age enrolled in preprimary<br />
education (%)<br />
Out-of-school children of lower<br />
secondary school age<br />
Out-of-school rate (%)<br />
Number out of<br />
school<br />
MF M F MF (000) % F MF M F MF M F MF (000) % F<br />
(1) (2) (3) (4) (5) (6) (7) (8) (9) (10) (11) (12) (13) (14) (15)<br />
Algeria 6-10 11-14 3 2 4 82 65 — — — ... ... ... ... ...<br />
Bahrain 6-11 12-14 ... ... ... ... ... ... ... ... ... ... ... ... ...<br />
Djibouti 6-10 11-14 55 ** , -1 53 ** , -1 58 ** , -1 56 ** , -1 52 ** , -1 — -1 — -1 — -1 60 ** , -2 54 ** , -2 66 ** , -2 49 ** , -2 54 ** , -2<br />
Egypt 6-11 12-14 4 ** ... ... 368 ** ... ... ... ... 4 ** ... ... 214 ** ...<br />
Iraq 6-11 12-14 ... ... ... ... ... ... ... ... ... ... ... ... ...<br />
Jordan 6-11 12-15 9 9 9 83 49 — — — 11 ** ,-2 13 ** ,-2 10 ** ,-2 62 ** ,-2 42 ** ,-2<br />
Kuwait 6-10 11-14 2 -2 3 -2 — -2 4 -2 1 -2 — -2 — -2 — -2 2 -2 ... ... 2 -2 ...<br />
Lebanon 6-11 12-14 7 6 7 30 51 1 1 1 13 14 12 32 46<br />
Libya 6-11 12-14 ... ... ... ... ... ... ... ... ... ... ... ... ...<br />
Mauritania 6-11 12-15 26 ** 27 ** 24 ** 134 ** 46 ** ... ... ... ... ... ... ... ...<br />
Morocco 6-11 12-14 4 +1 3 +1 4 +1 134 +1 56 +1 1 +1 1 +1 — +1 23 ** 18 ** 29 ** 433 ** 61 **<br />
Oman 6-11 12-14 2 -1 — -1 3 -1 5 -1 87 -1 — -1 — -1 — -1 2 -1 ... ... 4 -1 ...<br />
Palestine 6-9 10-15 11 10 12 48 52 1 1 1 13 14 12 82 44<br />
Qatar 6-11 12-14 4 4 3 3 43 ... ... ... 2 ... ... 1 ...<br />
Saudi Arabia 6-11 12-14 10 -1 10 -1 11 -1 318 -1 52 -1 ... ... ... 6 9 4 96 29<br />
Sudan (pre-secession) a 6-11 12-13 ... ... ... ... ... ... ... ... ... ... ... ... ...<br />
Syrian Arab Republic 6-9 10-14 1 -1 — -1 2 -1 19 -1 87 -1 — -1 — -1 — -1 12 -1 11 -1 12 -1 280 -1 51 -1<br />
Tunisia 6-11 12-14 1 -1 ... ... 5 -1 ... ... ... ... ... ... ... ... ...<br />
United Arab Emirates 6-10 11-14 ... ... ... ... ... ... ... ... ... ... ... ... ...<br />
Yemen 6-11 12-14 22 14 30 857 66 — — — 40 ** 28 ** 52 ** 718 ** 64 **<br />
CENTRAL AND EASTERN EUROPE<br />
Albania 6-10 11-14 20 20 20 52 47 2 2 2 ... ... ... ... ...<br />
Belarus 6-9 10-14 8 ... ... 29 ... 8 9 7 5 ** ... ... 24 ** ...<br />
Bosnia and Herzegovina 6-9 10-13 13 14 12 20 45 1 1 1 ... ... ... ... ...<br />
Bulgaria 7-10 11-14 — 1 — 1 26 — — — 13 12 13 34 51<br />
Croatia 7-10 11-14 4 5 3 7 36 — — — 1 ... ... 2 ...<br />
Czech Republic 6-10 11-14 ... ... ... ... ... ... ... ... ... ... ... ... ...<br />
Estonia 7-12 13-15 4 -1 4 -1 4 -1 3 -1 52 -1 3 -1 4 -1 3 -1 3 -1 3 -1 3 -1 1 -1 43 -1<br />
Hungary 7-10 11-14 2 -1 2 -1 2 -1 8 -1 45 -1 1 -1 1 -1 1 -1 1 -1 1 -1 2 -1 6 -1 65 -1<br />
Latvia 7-12 13-15 4 5 3 5 38 1 1 1 12 11 13 8 53<br />
Lithuania 7-10 11-16 4 4 4 5 47 1 1 1 8 8 8 21 49<br />
Montenegro 7-10 11-14 17 ... ... 6 ... — ... ... ... ... ... ... ...<br />
Poland 7-12 13-15 4 -1 4 -1 4 -1 94 -1 50 -1 — -1 1 -1 — -1 6 -1 6 -1 6 -1 88 -1 48 -1<br />
Republic of Moldova 7-10 11-15 10 * 10 * 10 * 15 * 48 * 1 * 2 * 1 * 12 * 12 * 13 * 29 * 51 *<br />
Romania 7-10 11-14 12 12 13 109 50 1 1 1 6 -1 6 -1 6 -1 52 -1 47 -1<br />
Russian Federation 7-10 11-15 4 -1 5 -1 4 -1 221 -1 42 -1 3 -1 3 -1 3 -1 9 -1 10 -1 8 -1 671 -1 43 -1<br />
Serbia 7-10 11-14 5 * 5 * 6 * 16 * 50 * — * — * — * 3 * 3 * 3 * 8 * 52 *<br />
Slovakia 6-9 10-14 ... ... ... ... ... ... ... ... ... ... ... ... ...<br />
Slovenia 6-11 12-14 3 -1 3 -1 3 -1 3 -1 50 -1 1 -1 1 -1 1 -1 2 -1 2 -1 2 -1 1 -1 45 -1<br />
The former Yugoslav Rep. of Macedonia 6-10 11-14 2 3 1 2 22 1 1 1 ... ... ... ... ...<br />
Turkey 6-10 11-13 3 -1 2 -1 3 -1 162 -1 64 -1 — -1 — -1 — -1 5 ** , -1 3 ** , -1 7 ** , -1 181 ** , -1 71 ** , -1<br />
Ukraine 6-9 10-14 9 9 * 9 * 138 47 * ... ... ... 4 4 * 4 * 92 47 *<br />
CENTRAL ASIA<br />
Armenia 7-9 10-14 ... ... ... ... ... ... ... ... ... ... ... ... ...<br />
Azerbaijan 6-9 10-14 15 ** 15 ** 16 ** 78 ** 49 ** 3 * 3 * 3 * ... ... ... ... ...<br />
Georgia 6-11 12-14 — -1 ... ... — -1 ... ... ... ... 8 -1 ... ... 14 -1 ...<br />
Kazakhstan 7-10 11-15 — +1 1 +1 — +1 4 +1 33 +1 — +1 — +1 — +1 — +1 ... ... 0.1 +1 ...<br />
Kyrgyzstan 7-10 11-15 5 5 5 18 51 1 1 1 8 * 8 * 9 * 45 * 52 *<br />
Mongolia 6-10 11-14 1 ** — ** 1 ** 2 ** 78 ** — — — ... ... ... ... ...<br />
Tajikistan 7-10 11-15 2 1 4 15 88 — 1 — 4 ... ... 31 ...<br />
Turkmenistan 7-9 10-14 ... ... ... ... ... ... ... ... ... ... ... ... ...<br />
Uzbekistan 7-10 11-15 7 +1 6 +1 9 +1 148 +1 58 +1 2 +1 2 +1 2 +1 4 -1 3 -1 4 -1 114 -1 58 -1<br />
EAST ASIA AND THE PACIFIC<br />
Australia 5-11 12-15 3 3 2 54 43 2 2 2 2 2 2 20 48<br />
Brunei Darussalam 6-11 12-13 ... ... ... ... ... ... ... ... … ... ... … ...<br />
Cambodia 6-11 12-14 4 4 5 73 55 — — — ... ... ... ... ...<br />
China 7-11 12-14 ... ... ... ... ... ... ... ... ... ... ... ... ...
OPPORTUNITIES LOST: THE IMPACT OF GRADE REPETITION AND EARLY SCHOOL LEAVING<br />
REGION<br />
Country or territory<br />
Age group<br />
ISCED<br />
1<br />
ISCED<br />
2<br />
Out-of-school rate (%)<br />
Out-of-school children of primary school age<br />
Number out of<br />
school<br />
Share of children of primary<br />
school age enrolled in preprimary<br />
education (%)<br />
Out-of-school children of lower<br />
secondary school age<br />
Out-of-school rate (%)<br />
Number out of<br />
school<br />
MF M F MF (000) % F MF M F MF M F MF (000) % F<br />
(1) (2) (3) (4) (5) (6) (7) (8) (9) (10) (11) (12) (13) (14) (15)<br />
China, Hong Kong SAR 6-11 12-14 2 * ... ... 5 * ... ... ... ... 6 * 7 * 5 * 14 * 39 *<br />
China, Macao SAR 6-11 12-14 17 19 16 5 43 1 1 1 11 9 12 2 57<br />
Cook Islands 5-10 11-14 2 * 2 * 1 * — * … 1 * 1 * 1 * 5 * , +1 ... ... 0.1 * , +1 ...<br />
Democratic People’s Rep. of Korea 7-10 11-13 ... ... ... ... ... ... ... ... ... ... ... ... ...<br />
Fiji 6-11 12-15 1 -1 1 -1 1 -1 1 -1 36 -1 ... ... ... 3 ** , -1 ... ... 2 ** , -1 ...<br />
Indonesia 7-12 13-15 1 ... ... 236 ... — — — 14 14 14 1,815 48<br />
Japan 6-11 12-14 — ... ... 2 ... — — — — ... ... 0.1 ...<br />
Kiribati 6-11 12-14 ... ... ... ... ... ... ... ... ... ... ... ... ...<br />
Lao People’s Democratic Republic 6-10 11-14 3 2 5 23 70 — — — 28 25 32 174 56<br />
Malaysia 6-11 12-14 ... ... ... ... ... ... ... ... 10 -1 11 -1 8 -1 159 -1 43 -1<br />
Marshall Islands 6-11 12-13 1 +1 ... ... 0.1 +1 ... ... ... ... ... ... ... ... ...<br />
Micronesia (Federated States of) 6-11 12-13 ... ... ... ... ... ... ... ... ... ... ... ... ...<br />
Myanmar 5-9 10-13 ... ... ... ... ... ... ... ... ... ... ... ... ...<br />
Nauru 6-11 12-15 ... ... ... ... ... ... ... ... ... ... ... ... ...<br />
New Zealand 5-10 11-14 1 1 — 2 33 — — — — ... ... 1 ...<br />
Niue 5-10 11-14 ... ... ... ... ... ... ... ... ... ... ... ... ...<br />
Palau 6-10 11-13 ... ... ... ... ... ... ... ... ... ... ... ... ...<br />
Papua New Guinea 7-12 13-16 ... ... ... ... ... ... ... ... ... ... ... ... ...<br />
Philippines 6-11 12-14 11 -1 12 -1 10 -1 1,460 -1 45 -1 2 -1 2 -1 2 -1 5 -1 7 -1 4 -1 332 -1 39 -1<br />
Republic of Korea 6-11 12-14 1 ** 1 ** 2 ** 35 ** 70 ** 1 1 1 — ** ... ... 9 ** ...<br />
Samoa 5-10 11-12 5 … ... 1 … 3 … … — ... ... ...<br />
Singapore 6-11 12-13 ... ... ... ... ... ... ... ... ... ... ... ... ...<br />
Solomon Islands 6-11 12-14 ... ... ... ... ... ... ... ... ... ... ... ... ...<br />
Thailand 6-11 12-14 10 -1 10 -1 11 -1 611 -1 50 -1 — -1 — -1 — -1 9 -1 10 -1 8 -1 286 -1 45 -1<br />
Timor-Leste 6-11 12-14 14 14 14 28 50 ... ... ... 35 35 36 34 49<br />
Tokelau 5-10 11-13 ... ... ... ... ... ... ... ... ... ... ... ... ...<br />
Tonga 5-10 11-14 ... ... ... ... ... ... ... ... ... ... ... ... ...<br />
Tuvalu 6-11 12-15 ... ... ... ... ... ... ... ... ... ... ... ... ...<br />
Vanuatu 6-11 12-15 ... ... ... ... ... ... ... ... ... ... ... ... ...<br />
Viet Nam 6-10 11-14 2 ... ... 121 ... 2 ... ... ... ... ... ... ...<br />
LATIN AMERICA AND THE CARIBBEAN<br />
Anguilla 5-11 12-14 7 ** , -2 7 ** , -2 7 ** , -2 0.1 ** , -2 48 ** , -2 — ** , -2 — ** , -2 — ** , -2 20 ** , -2 15 ** , -2 24 ** , -2 0.2 ** , -2 63 ** , -2<br />
Antigua and Barbuda 5-11 12-14 12 9 16 1 63 ... ... ... 2 ... ... 0.1 ...<br />
Argentina 6-11 12-14 ... ... ... ... ... ... ... ... 2 -1 ... ... 35 -1 ...<br />
Aruba 6-11 12-13 — — — — … — — — 12 -1 13 -1 11 -1 0.4 -1 47 -1<br />
Bahamas 5-10 11-13 2 ... ... 1 ... ... ... ... 6 8 4 1 32<br />
Barbados 5-10 11-13 5 * , -2 ... ... 1 * , -2 ... 2 * , -2 ... ... 11 * 15 * 6 * 1 * 28 *<br />
Belize 5-10 11-14 3 ... ... 1 ... — ... ... ... ... ... ... ...<br />
Bermuda 5-10 11-13 5 ** ... ... 0.2 ** ... ... ... ... 10 ** 14 ** 5 ** 0.2 ** 25 **<br />
Bolivia (Plurinational State of) 6-11 12-13 ... ... ... ... ... ... ... ... ... ... ... ... ...<br />
Brazil 7-10 11-14 ... ... ... ... ... ... ... ... ... ... ... ... ...<br />
British Virgin Islands 5-11 12-14 10 * 9 * 12 * 0.3 * 57 * ... ... ... ... ... ... ... ...<br />
Cayman Islands 5-10 11-13 ... ... ... ... ... ... ... ... 14 -2 14 -2 15 -2 0.3 -2 51 -2<br />
Chile 6-11 12-13 6 -1 6 -1 6 -1 94 -1 51 -1 1 -1 1 -1 1 -1 6 -1 5 -1 6 -1 30 -1 52 -1<br />
Colombia 6-10 11-14 8 8 9 374 50 2 2 2 6 7 6 221 45<br />
Costa Rica 6-11 12-14 ... ... ... ... ... ... ... ... ... ... ... ... ...<br />
Cuba 6-11 12-14 2 +1 2 +1 2 +1 13 +1 50 +1 — +1 — +1 — +1 3 +1 3 +1 4 +1 14 +1 59 +1<br />
Dominica 5-11 12-14 2 -1 ... ... 0.1 -1 ... ... ... ... ... ... ... ... ...<br />
Dominican Republic 6-11 12-13 7 4 10 85 67 1 1 1 9 8 11 37 57<br />
Ecuador 6-11 12-14 2 -1 ... ... 27 -1 ... ... ... ... ... ... ... ... ...<br />
El Salvador 7-12 13-15 5 5 5 38 48 4 4 4 9 9 10 41 51<br />
Grenada 5-11 12-14 3 -1 4 -1 1 -1 0.3 -1 14 -1 1 -1 1 -1 1 -1 8 -2 ... ... 0.5 -2 ...<br />
Guatemala 7-12 13-15 1 — 2 32 86 — — — 23 18 27 233 60<br />
Guyana 6-11 12-14 16 18 14 19 42 1 1 1 10 ** , -1 12 ** , -1 8 ** , -1 5 ** , -1 37 ** , -1<br />
Haiti 6-11 12-14 ... ... ... ... ... ... ... ... ... ... ... ... ...<br />
Honduras 6-11 12-14 4 ** 5 ** 3 ** 47 ** 34 ** 3 3 3 ... ... ... ... ...<br />
Jamaica 6-11 12-14 18 17 19 59 53 — — — 13 12 13 23 51<br />
Mexico 6-11 12-14 — 1 — 58 13 — — — 4 4 4 272 48<br />
107
TABLE<br />
4<br />
PRIMARY AND LOWER SECONDARY EDUCATION / ISCED 1 and 2 / Out-of-school<br />
children / 2010<br />
108<br />
REGION<br />
Country or territory<br />
Age group<br />
ISCED<br />
1<br />
ISCED<br />
2<br />
Out-of-school rate (%)<br />
Out-of-school children of primary school age<br />
Number out of<br />
school<br />
Share of children of primary<br />
school age enrolled in preprimary<br />
education (%)<br />
Out-of-school children of lower<br />
secondary school age<br />
Out-of-school rate (%)<br />
Number out of<br />
school<br />
MF M F MF (000) % F MF M F MF M F MF (000) % F<br />
(1) (2) (3) (4) (5) (6) (7) (8) (9) (10) (11) (12) (13) (14) (15)<br />
Montserrat 5-11 12-14 ... ... ... ... ... ... ... ... ... ... ... ... ...<br />
Netherlands Antilles a 6-11 12-13 ... ... ... ... ... ... ... ... ... ... ... ... ...<br />
Nicaragua 6-11 12-14 6 7 5 48 44 — — — 17 18 17 69 48<br />
Panama 6-11 12-14 1 1 2 5 67 1 1 1 7 8 7 14 47<br />
Paraguay 6-11 12-14 14 -1 14 -1 14 -1 123 -1 49 -1 1 -1 2 -1 1 -1 13 -1 12 -1 13 -1 53 -1 51 -1<br />
Peru 6-11 12-14 2 2 2 66 40 — — — 2 2 2 36 49<br />
Puerto Rico 6-11 12-14 14 ** 17 ** 12 ** 46 ** 39 ** — — — ... ... ... ... ...<br />
Saint Kitts and Nevis 5-11 12-14 14 * 14 * 14 * 1 * 49 * ... ... ... 3 * 3 * 3 * 0.1 * 51 *<br />
Saint Lucia 5-11 12-14 10 ** 10 ** 11 ** 2 ** 52 ** 1 1 1 8 ** 6 ** 9 ** 1 ** 61 **<br />
Saint Vincent and the Grenadines 5-11 12-14 2 ... ... 0.2 ... ... ... ... 3 -2 ... ... 0.2 -2 ...<br />
Suriname 6-11 12-15 9 ** , -1 9 ** , -1 9 ** , -1 6 ** , -1 49 ** , -1 — -1 — -1 — -1 22 ** , -1 23 ** , -1 22 ** , -1 8 ** , -1 48 ** , -1<br />
Trinidad and Tobago 5-11 12-14 3 2 3 3 56 ... ... ... 12 14 10 7 42<br />
Turks and Caicos Islands 6-11 12-14 ... ... ... ... ... ... ... ... ... ... ... ... ...<br />
Uruguay 6-11 12-14 1 -1 — -1 1 -1 2 -1 78 -1 — -1 — -1 — -1 8 -2 8 -2 8 -2 13 -2 47 -2<br />
Venezuela (Bolivarian Republic of) 6-11 12-14 5 5 5 171 47 2 2 2 8 9 7 135 42<br />
NORTH AMERICA AND WESTERN EUROPE<br />
Andorra 6-11 12-15 21 22 21 1 47 7 8 7 15 13 16 0.5 52<br />
Austria 6-9 10-13 ... ... ... ... ... ... ... ... ... ... ... ... ...<br />
Belgium 6-11 12-13 1 -1 1 -1 1 -1 7 -1 42 -1 1 -1 1 -1 1 -1 ... ... ... ... ...<br />
Canada 6-11 12-13 ... ... ... ... ... ... ... ... ... ... ... ... ...<br />
Cyprus 6-11 12-14 1 * 1 * 1 * 0.5 * 56 * 1 * 1 * 1 * — * ... ... 0.1 * ...<br />
Denmark 7-12 13-15 4 -1 5 -1 3 -1 17 -1 35 -1 3 -1 4 -1 2 -1 1 -1 1 -1 1 -1 2 -1 39 -1<br />
Finland 7-12 13-15 2 2 2 8 47 — — — 2 2 2 4 50<br />
France 6-10 11-14 1 1 1 31 43 1 1 1 — ... ... 2 ...<br />
Germany 6-9 10-15 — ** ... ... 7 ** ... ... ... ... ... ... ... ... ...<br />
Gibraltar 5-10 11-12 ... ... ... ... ... ... ... ... ... ... ... ... ...<br />
Greece 6-11 12-14 ... ... ... ... ... ... ... ... ... ... ... ... ...<br />
Holy See . . . . . . . . . . . . . . .<br />
Iceland 6-12 13-15 1 -1 1 -1 — -1 0.2 -1 38 -1 — -1 — -1 — -1 3 -1 3 -1 3 -1 0.4 -1 43 -1<br />
Ireland 5-12 13-15 — 1 — 1 2 — — — — ... ... 1 ...<br />
Israel 6-11 12-14 3 -1 3 -1 3 -1 23 -1 43 -1 3 -1 3 -1 3 -1 — -1 ... ... 1 -1 ...<br />
Italy 6-10 11-13 1 — 1 25 80 — — — 1 ... ... 9 ...<br />
Liechtenstein 7-11 12-15 1 * — * 2 * — * … — * — * — * 8 * 6 * 11 * 0.1 * 65 *<br />
Luxembourg 6-11 12-14 3 -2 4 -2 2 -2 1 -2 37 -2 1 -2 1 -2 — -2 3 -2 4 -2 2 -2 0.5 -2 32 -2<br />
Malta 5-10 11-15 6 7 6 2 45 4 4 4 5 4 6 1 58<br />
Monaco 6-10 11-14 ... ... ... ... ... ... ... ... ... ... ... ... ...<br />
Netherlands 6-11 12-14 — ... ... 0.3 ... — — — 3 3 2 15 41<br />
Norway 6-12 13-15 1 1 1 4 43 — — — 2 2 2 4 50<br />
Portugal 6-11 12-14 1 -1 1 -1 — -1 4 -1 37 -1 1 -1 1 -1 — -1 ... ... ... ... ...<br />
San Marino 6-10 11-13 8 * , -1 9 * , -1 7 * , -1 0.1 * , -1 41 * , -1 — * , -1 — * , -1 — * , -1 ... ... ... ... ...<br />
Spain 6-11 12-15 — — — 6 33 — — — — ... ... 5 ...<br />
Sweden 7-12 13-15 1 — 1 4 75 — — — 8 8 7 27 45<br />
Switzerland 7-12 13-15 1 1 1 4 33 — — — 5 5 5 13 46<br />
United Kingdom 5-10 11-13 — -1 — -1 — -1 8 -1 68 -1 — -1 — -1 — -1 — -1 ... ... 4 -1 ...<br />
United States of America 6-11 12-14 4 5 4 1,023 45 3 3 3 1 ... ... 122 ...<br />
SOUTH AND WEST ASIA<br />
Afghanistan 7-12 13-15 ... ... ... ... ... ... ... ... ... ... ... ... ...<br />
Bangladesh 6-10 11-13 ... ... ... ... ... ... ... ... 21 * 29 * 12 * 1,978 * 28 *<br />
Bhutan 6-12 13-16 11 +1 12 +1 9 +1 11 +1 42 +1 ... ... ... 15 +1 19 +1 11 +1 9 +1 37 +1<br />
India 6-10 11-13 2 ** , -2 1 ** , -2 2 ** , -2 2,278 ** , -2 62 ** , -2 ... ... ... ... ... ... ... ...<br />
Iran (Islamic Republic of) 6-10 11-13 ... ... ... ... ... ... ... ... 3 ... ... 88 ...<br />
Maldives 6-12 13-15 3 +1 3 +1 3 +1 1 +1 48 +1 3 +1 3 +1 3 +1 ... ... ... ... ...<br />
Nepal 5-9 10-12 ... ... ... ... ... ... ... ... ... ... ... ... ...<br />
Pakistan 5-9 10-12 26 * 19 * 33 * 5,125 * 63 * ... ... ... 58 53 64 7,207 54<br />
Sri Lanka 5-9 10-13 6 6 6 102 47 ... ... ... ... ... ... ... ...<br />
SUB-SAHARAN AFRICA<br />
Angola 6-11 12-14 14 ** 7 ** 22 ** 493 ** 76 ** 7 * 7 * 7 * 12 -1 3 -1 22 -1 172 -1 89 -1<br />
Benin 6-11 12-15 6 ... ... 88 ... ... ... ... ... ... ... ... ...
OPPORTUNITIES LOST: THE IMPACT OF GRADE REPETITION AND EARLY SCHOOL LEAVING<br />
REGION<br />
Country or territory<br />
Age group<br />
ISCED<br />
1<br />
ISCED<br />
2<br />
Out-of-school rate (%)<br />
Out-of-school children of primary school age<br />
Number out of<br />
school<br />
Share of children of primary<br />
school age enrolled in preprimary<br />
education (%)<br />
Out-of-school children of lower<br />
secondary school age<br />
Out-of-school rate (%)<br />
Number out of<br />
school<br />
MF M F MF (000) % F MF M F MF M F MF (000) % F<br />
(1) (2) (3) (4) (5) (6) (7) (8) (9) (10) (11) (12) (13) (14) (15)<br />
Botswana 6-12 13-15 13 ** , -1 13 ** , -1 12 ** , -1 38 ** , -1 47 ** , -1 1 -1 1 -1 1 -1 4 ** , -1 4 ** , -1 3 ** , -1 5 ** , -1 38 ** , -1<br />
Burkina Faso 6-11 12-15 37 +1 35 +1 39 +1 1,022 +1 52 +1 — +1 — +1 — +1 55 +1 51 +1 58 +1 873 +1 52 +1<br />
Burundi 7-12 13-16 ... ... ... ... ... ... ... ... ... ... ... ... ...<br />
Cameroon 6-11 12-15 6 ** ... ... 179 ** ... — ... ... ... ... ... ... ...<br />
Cape Verde 6-11 12-14 7 5 8 4 58 — — — 8 8 9 3 53<br />
Central African Republic 6-11 12-15 31 +1 22 +1 40 +1 214 +1 66 +1 — +1 — +1 — +1 54 ** , +1 43 ** , +1 65 ** , +1 224 ** , +1 61 ** , +1<br />
Chad 6-11 12-15 ... ... ... ... ... ... ... ... ... ... ... ... ...<br />
Comoros 6-11 12-15 ... ... ... ... ... ... ... ... ... ... ... ... ...<br />
Congo 6-11 12-15 9 * 8 * 11 * 56 * 58 * — — — ... ... ... ... ...<br />
Côte d’Ivoire 6-11 12-15 39 -1 33 -1 44 -1 1,161 -1 57 -1 — -1 — -1 — -1 ... ... ... ... ...<br />
Democratic Republic of the Congo 6-11 12-13 ... ... ... ... ... ... ... ... ... ... ... ... ...<br />
Equatorial Guinea 7-12 13-16 44 43 44 43 50 ... ... ... ... ... ... ... ...<br />
Eritrea 7-11 12-14 65 63 67 418 51 — — — 59 54 63 201 54<br />
Ethiopia 7-12 13-16 18 15 20 2,390 57 — — — 39 ** 35 ** 43 ** 3,134 ** 55 **<br />
Gabon 6-10 11-14 ... ... ... ... ... ... ... ... ... ... ... ... ...<br />
Gambia 7-12 13-15 31 ** 32 ** 30 ** 85 ** 48 ** 1 1 1 26 ** 27 ** 26 ** 32 ** 49 **<br />
Ghana 6-11 12-14 16 +1 16 +1 15 +1 567 +1 48 +1 ... ... ... 26 ** , +1 25 ** , +1 27 ** , +1 422 ** , +1 51 ** , +1<br />
Guinea 7-12 13-16 23 17 30 355 63 — — — 51 ** , -1 42 ** , -1 60 ** , -1 445 ** , -1 58 ** , -1<br />
Guinea-Bissau 7-12 13-15 25 23 27 57 53 — — — ... ... ... ... ...<br />
Kenya 6-11 12-13 16 ** , -1 16 ** , -1 15 ** , -1 1,010 ** , -1 48 ** , -1 13 -1 14 -1 12 -1 2 ** , -1 ... ... 30 ** , -1 ...<br />
Lesotho 6-12 13-15 26 28 25 99 47 ... ... ... 25 29 21 40 42<br />
Liberia 6-11 12-14 ... ... ... ... ... ... ... ... ... ... ... ... ...<br />
Madagascar 6-10 11-14 ... ... ... ... ... ... ... ... ... ... ... ... ...<br />
Malawi 6-11 12-15 3 -1 ... ... 62 -1 ... ... ... ... 22 -1 22 -1 22 -1 319 -1 50 -1<br />
Mali 7-12 13-15 33 +1 28 +1 37 +1 850 +1 56 +1 — +1 — +1 — +1 51 +1 43 +1 58 +1 557 +1 56 +1<br />
Mauritius 5-10 11-13 7 8 6 8 41 2 2 2 ... ... ... ... ...<br />
Mozambique 6-12 13-15 10 +1 8 +1 12 +1 482 +1 61 +1 ... ... ... 36 +1 31 +1 42 +1 606 +1 58 +1<br />
Namibia 7-13 14-16 14 -1 16 -1 11 -1 52 -1 40 -1 ... ... ... ... ... ... ... ...<br />
Niger 7-12 13-16 38 +1 32 +1 43 +1 1,012 +1 56 +1 — +1 — +1 — +1 78 ** , -2 74 ** , -2 83 ** , -2 1,011 ** , -2 52 ** , -2<br />
Nigeria 6-11 12-14 42 ** 40 ** 45 ** 10,542 ** 52 ** ... ... ... ... ... ... ... ...<br />
Rwanda 7-12 13-15 1 ... ... 20 ... — — — ... ... ... ... ...<br />
Sao Tome and Principe 6-11 12-14 1 ... ... 0.4 ... — — — 4 ** , +1 6 ** , +1 3 ** , +1 1 ** , +1 31 ** , +1<br />
Senegal 7-12 13-16 22 24 20 429 45 — — — ... ... ... ... ...<br />
Seychelles 6-11 12-14 ... ... ... ... ... ... ... ... 3 -1 ... ... 0.1 -1 ...<br />
Sierra Leone 6-11 12-14 ... ... ... ... ... ... ... ... ... ... ... ... ...<br />
Somalia 6-11 12-13 ... ... ... ... ... ... ... ... ... ... ... ... ...<br />
South Africa 7-13 14-15 10 ** , -1 10 ** , -1 9 ** , -1 679 ** , -1 47 ** , -1 ... ... ... ... ... ... ... ...<br />
Swaziland 6-12 13-15 14 14 15 30 51 — — — 33 31 34 30 52<br />
Togo 6-11 12-15 6 -2 ... ... 51 -2 ... — -2 — -2 — -2 ... ... ... ... ...<br />
Uganda 6-12 13-16 9 10 8 623 43 — — — 20 ** 19 ** 21 ** 650 ** 53 **<br />
United Republic of Tanzania 7-13 14-17 2 -2 2 -2 2 -2 137 -2 56 -2 — -2 — -2 — -2 ... ... ... ... ...<br />
Zambia 7-13 14-15 7 ** 9 ** 6 ** 184 ** 41 ** ... ... ... ... ... ... ... ...<br />
Zimbabwe 6-12 13-14 ... ... ... ... ... ... ... ... ... ... ... ... ...<br />
REGIONAL AVERAGES<br />
WORLD 9 ** 8 ** 10 ** 60,735 ** 53 ** ... ... ... 18 ** 18 ** 18 ** 70,615 ** 48 **<br />
Arab States 12 ** 9 ** 15 ** 5,036 ** 61 ** ... ... ... 17 ** 15 ** 18 ** 3,732 ** 54 **<br />
Central and Eastern Europe 5 ** 5 ** 5 ** 931 ** 49 ** ... ... ... 7 ** 7 ** 7 ** 1,281 ** 49 **<br />
Central Asia 6 5 7 317 54 ... ... ... 4 ** 4 ** 5 ** 315 ** 58 **<br />
East Asia and the Pacific 4 ** 4 ** 4 ** 6,584 ** 44 ** ... ... ... 10 ** 13 ** 6 ** 10,331 ** 31 **<br />
Latin America and the Caribbean 5 ** 4 ** 5 ** 2,698 ** 50 ** ... ... ... 5 5 5 1,780 50<br />
North America and Western Europe 3 3 2 1,267 45 ... ... ... 2 1 ** 2 ** 554 62 **<br />
South and West Asia 7 ** 6 ** 9 ** 13,261 ** 55 ** ... ... ... 30 ** 29 ** 30 ** 30,946 ** 49 **<br />
Sub-Saharan Africa 23 ** 22 ** 25 ** 30,641 ** 53 ** ... ... ... 36 ** 33 ** 40 ** 21,676 ** 55 **<br />
109
TABLE<br />
5<br />
PRIMARY AND SECONDARY EDUCATION / ISCED 1, 2 and 3 / Repetition / 2010<br />
Primary education<br />
Secondary education<br />
110<br />
REGION<br />
Repeaters<br />
Percentage of repeaters<br />
Secondary (ISCED 2 and 3),<br />
general programmes<br />
Percentage of repeaters<br />
Lower secondary (ISCED 2),<br />
general programmes<br />
Upper secondary (ISCED 3),<br />
general programmes<br />
Country or territory MF (000) % F MF M F MF M F MF M F MF M F<br />
(1) (2) (3) (4) (5) (6) (7) (8) (9) (10) (11) (12) (13) (14)<br />
ARAB STATES<br />
Algeria 248 35 7 9 6 16 -1 19 -1 13 -1 15 -1 19 -1 11 -1 19 -1 21 -1 17 -1<br />
Bahrain 2 -1 49 -1 2 -1 2 -1 2 -1 4 -1 6 -1 3 -1 5 -1 6 -1 2 -1 4 -1 4 -1 3 -1<br />
Djibouti 6 +1 46 +1 10 +1 10 +1 9 +1 6 +1 7 +1 6 +1 7 +1 7 +1 6 +1 6 +1 6 +1 5 +1<br />
Egypt 366 ... 4 ... ... 8 ** 9 ** 6 ** ... ... ... ... ... ...<br />
Iraq ... ... ... ... ... ... ... ... ... ... ... ... ... ...<br />
Jordan 4 54 1 — 1 1 1 1 2 2 2 ... ... ...<br />
Kuwait 1 42 1 1 1 6 6 5 5 5 4 7 9 6<br />
Lebanon 37 40 8 9 7 10 11 10 12 12 12 7 8 6<br />
Libya ... ... ... ... ... ... ... ... ... ... ... ... ... ...<br />
Mauritania 18 52 3 3 4 11 -1 11 -1 12 -1 10 -1 10 -1 11 -1 14 -1 13 -1 15 -1<br />
Morocco 424 38 11 13 9 16 +1 19 +1 12 +1 15 +1 18 +1 11 +1 16 +1 19 +1 13 +1<br />
Oman 4 -1 54 -1 1 -1 1 -1 2 -1 ... ... ... ... ... ... 4 5 3<br />
Palestine — . — — — 2 2 2 2 3 2 1 1 1<br />
Qatar — -1 50 -1 — -1 — -1 — -1 3 -1 3 -1 3 -1 1 -1 1 -1 2 -1 5 -1 5 -1 5 -1<br />
Saudi Arabia 106 -2 46 -2 3 -2 3 -2 3 -2 4 ** , -1 5 ** , -1 3 ** , -1 3 ** , -1 4 ** , -1 3 ** , -1 5 ** , -1 6 ** , -1 3 ** , -1<br />
Sudan (pre-secession) a 174 -1 45 -1 4 -1 4 -1 4 -1 3 -2 3 -2 2 -2 4 -2 4 -2 4 -2 — -2 1 -2 — -2<br />
Syrian Arab Republic 185 41 8 9 6 7 9 5 7 9 6 5 6 3<br />
Tunisia 70 -1 36 -1 7 -1 8 -1 5 -1 17 -1 20 -1 14 -1 18 -1 22 -1 14 -1 16 -1 17 -1 15 -1<br />
United Arab Emirates 7 46 2 2 2 3 4 2 3 3 2 4 4 3<br />
Yemen 224 39 7 7 6 7 8 6 7 8 5 8 9 6<br />
CENTRAL AND EASTERN EUROPE<br />
Albania 2 40 1 1 1 1 -1 2 -1 1 -1 2 -1 2 -1 1 -1 ... ... ...<br />
Belarus — ... — ... ... — ... ... — ... ... — ... ...<br />
Bosnia and Herzegovina — 24 — — — — ... ... — 1 — — ... ...<br />
Bulgaria 2 39 1 1 1 2 2 1 ... ... ... ... ... ...<br />
Croatia — 40 — — — 1 1 — 1 1 — 1 1 —<br />
Czech Republic 3 -1 41 -1 1 -1 1 -1 1 -1 1 -1 1 -1 1 -1 1 -1 1 -1 1 -1 — -1 1 -1 — -1<br />
Estonia — -1 26 -1 1 -1 1 -1 — -1 3 -1 4 -1 3 -1 3 -1 4 -1 2 -1 4 -1 4 -1 4 -1<br />
Hungary 8 -1 38 -1 2 -1 2 -1 2 -1 3 -1 4 -1 2 -1 ... ... ... ... ... ...<br />
Latvia 2 36 2 3 2 4 5 3 4 5 3 3 3 2<br />
Lithuania 1 34 1 1 — 1 1 1 ... ... ... ... ... ...<br />
Montenegro ... ... ... ... ... ... ... ... ... ... ... ... ... ...<br />
Poland 22 -1 31 -1 1 -1 1 -1 1 -1 3 -2 4 -2 2 -2 ... ... ... ... ... ...<br />
Republic of Moldova — -1 34 -1 — -1 — -1 — -1 — -1 — -1 — -1 — -1 — -1 — -1 — -1 — -1 — -1<br />
Romania 15 40 2 2 2 2 3 1 3 3 2 — — —<br />
Russian Federation 19 -1 ... — -1 ... ... — -1 ... ... — -1 ... ... — -1 ... ...<br />
Serbia 1 37 1 1 — 1 2 1 1 2 1 1 1 —<br />
Slovakia 7 45 3 3 3 2 2 1 2 2 2 — — —<br />
Slovenia 1 -1 32 -1 1 -1 1 -1 — -1 — -1 1 -1 — -1 1 -1 1 -1 — -1 — -1 — -1 — -1<br />
The former Yugoslav Rep. of Macedonia — 46 — — — 1 1 — 1 1 — — 1 —<br />
Turkey 116 -1 52 -1 2 -1 2 -1 2 -1 ... ... ... 3 -1 3 -1 3 -1 ... ... ...<br />
Ukraine 1 49 — — — — — * — * — — * — * — — * — *<br />
CENTRAL ASIA<br />
Armenia — 48 — — — — — — — — — — — —<br />
Azerbaijan 1 42 — — — 1 1 1 1 1 1 1 1 1<br />
Georgia — 44 — — — — — — — — — — — —<br />
Kazakhstan 1 +1 32 +1 — +1 — +1 — +1 — +1 — +1 — +1 — +1 — +1 — +1 — +1 — +1 — +1<br />
Kyrgyzstan — 43 — — — — — — — — — — — —<br />
Mongolia — 52 — — — — — — ... ... ... — — —<br />
Tajikistan 2 46 — — — — — — — — — — — —<br />
Turkmenistan ... ... ... ... ... ... ... ... ... ... ... ... ... ...<br />
Uzbekistan — +1 20 +1 — +1 — +1 — +1 — +1 — +1 — +1 — +1 — +1 — +1 — +1 — +1 — +1<br />
EAST ASIA AND THE PACIFIC<br />
Australia ... ... ... ... ... ... ... ... ... ... ... ... ... ...<br />
Brunei Darussalam — 24 — — — 7 8 6 2 3 1 12 15 10<br />
Cambodia 201 42 9 10 8 2 3 1 2 3 2 2 3 1<br />
China 280 41 — — — — — — — — — ... ... ...
OPPORTUNITIES LOST: THE IMPACT OF GRADE REPETITION AND EARLY SCHOOL LEAVING<br />
Primary education<br />
Secondary education<br />
REGION<br />
Repeaters<br />
Percentage of repeaters<br />
Secondary (ISCED 2 and 3),<br />
general programmes<br />
Percentage of repeaters<br />
Lower secondary (ISCED 2),<br />
general programmes<br />
Upper secondary (ISCED 3),<br />
general programmes<br />
Country or territory MF (000) % F MF M F MF M F MF M F MF M F<br />
(1) (2) (3) (4) (5) (6) (7) (8) (9) (10) (11) (12) (13) (14)<br />
China, Hong Kong SAR 3 * 39 * 1 * 1 * 1 * 5 * 6 * 4 * 3 * 4 * 3 * 7 * 7 * 6 *<br />
China, Macao SAR 1 36 6 7 4 11 14 9 15 17 13 7 10 5<br />
Cook Islands — +1 . +1 — +1 — +1 — +1 — +1 — +1 — +1 — +1 — +1 — +1 — +1 — +1 — +1<br />
Democratic People’s Republic of Korea ... ... ... ... ... ... ... ... ... ... ... ... ... ...<br />
Fiji 1 -1 36 -1 1 -1 1 -1 1 -1 2 -1 2 -1 2 -1 1 -1 1 -1 1 -1 4 -1 4 -1 5 -1<br />
Indonesia 1,004 41 3 4 3 1 -1 1 -1 — -1 1 -1 1 -1 — -1 1 -1 1 -1 — -1<br />
Japan — . — — — ... ... ... ... ... ... ... ... ...<br />
Kiribati . -2 . -2 . -2 . -2 . -2 ... ... ... ... ... ... ... ... ...<br />
Lao People’s Democratic Republic 129 43 14 15 13 1 2 1 2 2 1 1 1 —<br />
Malaysia . -1 . -1 . -1 . -1 . -1 . -1 . -1 . -1 . -1 . -1 . -1 . -1 . -1 . -1<br />
Marshall Islands . +1 . +1 . +1 . +1 . +1 . +1 . +1 . +1 . +1 . +1 . +1 . +1 . +1 . +1<br />
Micronesia (Federated States of) ... ... ... ... ... ... ... ... ... ... ... ... ... ...<br />
Myanmar 15 56 — — — 1 1 1 — — — 4 4 4<br />
Nauru ... ... ... ... ... ... ... ... ... ... ... ... ... ...<br />
New Zealand ... ... ... ... ... ... ... ... ... ... ... ... ... ...<br />
Niue ... ... ... ... ... ... ... ... ... ... ... ... ... ...<br />
Palau ... ... ... ... ... ... ... ... ... ... ... ... ... ...<br />
Papua New Guinea ... ... ... ... ... ... ... ... ... ... ... ... ... ...<br />
Philippines 346 -1 34 -1 3 -1 3 -1 2 -1 3 -1 4 -1 2 -1 3 -1 5 -1 2 -1 2 -1 2 -1 1 -1<br />
Republic of Korea — 18 — — — — -2 — -2 — -2 ... ... ... ... ... ...<br />
Samoa — 37 1 1 1 3 3 2 1 1 1 4 4 3<br />
Singapore 1 -1 44 -1 — -1 — -1 — -1 1 -1 2 -1 1 -1 1 -1 1 -1 1 -1 2 -1 3 -1 1 -1<br />
Solomon Islands ... ... ... ... ... ... ... ... ... ... ... ... ... ...<br />
Thailand ... ... ... ... ... ... ... ... ... ... ... ... ... ...<br />
Timor-Leste 39 43 17 19 15 3 3 2 3 4 3 1 1 1<br />
Tokelau ... ... ... ... ... ... ... ... ... ... ... ... ... ...<br />
Tonga ... ... ... ... ... ... ... ... ... ... ... ... ... ...<br />
Tuvalu ... ... ... ... ... ... ... ... ... ... ... ... ... ...<br />
Vanuatu 6 42 13 15 12 2 2 2 2 2 2 2 2 2<br />
Viet Nam ... ... ... ... ... ... ... ... ... ... ... ... ... ...<br />
LATIN AMERICA AND THE CARIBBEAN<br />
Anguilla — . — — — — — — — — — — — —<br />
Antigua and Barbuda 1 * 38 * 7 * 8 * 6 * 9 * 10 * 7 10 * 11 * 8 6 6 6<br />
Argentina 242 -1 39 -1 5 -1 6 -1 4 -1 ... ... ... 12 -1 14 -1 10 -1 7 -1 9 -1 6 -1<br />
Aruba 1 43 7 8 6 11 -1 12 -1 11 -1 7 -1 8 -1 7 -1 15 -1 15 -1 15 -1<br />
Bahamas 1 37 4 4 3 1 2 1 1 2 1 1 1 1<br />
Barbados . . . * . * . * . * , -2 . * , -2 . * , -2 . * , -2 . * , -2 . * , -2 . * , -2 . * , -2 . * , -2<br />
Belize 4 40 8 9 6 6 6 5 6 6 5 6 7 6<br />
Bermuda . . . . ** . ** ... ... ... ... ... ... ... ... ...<br />
Bolivia (Plurinational State of) 12 -2 44 -2 1 -2 1 -2 1 -2 6 -1 8 -1 4 -1 6 -1 8 -1 5 -1 6 -1 7 -1 4 -1<br />
Brazil ... ... ... ... ... ... ... ... ... ... ... ... ... ...<br />
British Virgin Islands — 37 6 7 4 8 12 5 10 13 7 ... ... ...<br />
Cayman Islands — -2 . -2 — -2 — -2 — -2 — -2 — -2 — -2 — -2 — -2 — -2 — -2 — -2 — -2<br />
Chile 16 -1 35 -1 1 -1 1 -1 1 -1 2 -1 2 -1 2 -1 1 -1 1 -1 1 -1 2 -1 2 -1 2 -1<br />
Colombia 99 41 2 2 2 2 3 2 2 3 2 2 2 1<br />
Costa Rica 30 40 6 7 5 9 -2 10 -2 8 -2 11 -2 13 -2 10 -2 7 -2 9 -2 6 -2<br />
Cuba 5 +1 27 +1 1 +1 1 +1 — +1 2 +1 2 +1 1 +1 1 +1 1 +1 1 +1 3 +1 5 +1 2 +1<br />
Dominica — 31 4 6 3 13 17 10 16 20 11 9 11 8<br />
Dominican Republic 96 31 7 9 5 7 9 6 7 8 6 7 9 6<br />
Ecuador ... ... ... ... ... ... ... ... 10 -1 12 -1 8 -1 8 -1 10 -1 6 -1<br />
El Salvador 54 38 6 7 5 4 6 3 4 5 3 6 8 5<br />
Grenada — 34 3 4 2 9 12 6 ... ... ... ... ... ...<br />
Guatemala 287 44 11 12 10 3 3 3 3 3 3 ... ... ...<br />
Guyana 1 38 1 1 — 10 13 8 12 15 9 6 8 5<br />
Haiti ... ... ... ... ... ... ... ... ... ... ... ... ... ...<br />
Honduras 10 41 1 1 1 ... ... ... ... ... ... ... ... ...<br />
Jamaica 7 43 2 3 2 1 2 1 1 1 1 ... ... ...<br />
Mexico 511 37 3 4 3 2 2 1 1 1 — 3 3 2<br />
111
TABLE<br />
5<br />
PRIMARY AND SECONDARY EDUCATION / ISCED 1, 2 and 3 / Repetition / 2010<br />
Primary education<br />
Secondary education<br />
REGION<br />
Repeaters<br />
Percentage of repeaters<br />
Secondary (ISCED 2 and 3),<br />
general programmes<br />
Percentage of repeaters<br />
Lower secondary (ISCED 2),<br />
general programmes<br />
Upper secondary (ISCED 3),<br />
general programmes<br />
Country or territory MF (000) % F MF M F MF M F MF M F MF M F<br />
(1) (2) (3) (4) (5) (6) (7) (8) (9) (10) (11) (12) (13) (14)<br />
112<br />
Montserrat — -1 45 -1 2 -1 2 -1 2 -1 — -1 — -1 — -1 — -1 — -1 — -1 — -1 — -1 — -1<br />
Netherlands Antilles a ... ... ... ... ... ... ... ... ... ... ... ... ... ...<br />
Nicaragua 73 40 8 9 7 6 7 4 7 8 5 3 4 3<br />
Panama 24 39 6 7 4 6 8 5 7 8 5 3 4 2<br />
Paraguay 42 -1 38 -1 5 -1 6 -1 4 -1 1 -1 1 -1 1 -1 1 -1 1 -1 1 -1 1 -1 1 -1 1 -1<br />
Peru 233 47 6 6 6 6 7 4 7 8 5 4 5 3<br />
Puerto Rico ... ... ... ... ... ... ... ... ... ... ... ... ... ...<br />
Saint Kitts and Nevis — 35 2 2 1 3 3 3 2 * 2 * 2 * 5 * 6 * 4 *<br />
Saint Lucia 1 41 3 3 2 — — — — — — 1 1 —<br />
Saint Vincent and the Grenadines 1 35 5 6 3 3 4 3 3 4 3 3 3 3<br />
Suriname 12 -1 41 -1 17 -1 20 -1 14 -1 18 -1 21 -1 17 -1 17 -1 20 -1 16 -1 22 -1 25 -1 20 -1<br />
Trinidad and Tobago 8 40 6 7 5 1 1 1 — — — 3 3 2<br />
Turks and Caicos Islands — -1 26 -1 2 -1 3 -1 1 -1 — -1 — -1 — -1 — -1 — -1 — -1 — -1 — -1 — -1<br />
Uruguay 19 -1 38 -1 5 -1 7 -1 4 -1 14 -1 17 -1 12 -1 18 -1 21 -1 16 -1 ... ... ...<br />
Venezuela (Bolivarian Republic of) 128 35 4 5 3 5 7 4 7 8 5 2 3 2<br />
NORTH AMERICA AND WESTERN EUROPE<br />
Andorra — 46 2 3 2 7 8 6 7 8 6 7 7 7<br />
Austria — . — — — — — — — — — — — —<br />
Belgium 24 -1 47 -1 3 -1 3 -1 3 -1 7 -1 8 -1 6 -1 7 -1 7 -1 6 -1 7 -1 10 -1 6 -1<br />
Canada — -2 . -2 — -2 — -2 — -2 ... ... ... ... ... ... ... ... ...<br />
Cyprus — 29 — — — 1 2 1 1 1 — 1 2 1<br />
Denmark 1 -1 36 -1 — -1 — -1 — -1 2 -1 2 -1 1 -1 1 -1 1 -1 1 -1 3 -1 3 -1 2 -1<br />
Finland 1 33 — 1 — — — — 1 1 — . . .<br />
France ... ... ... ... ... 6 6 5 4 5 3 9 10 8<br />
Germany 16 45 1 1 — 2 3 2 3 3 2 1 1 1<br />
Gibraltar ... ... ... ... ... ... ... ... ... ... ... ... ... ...<br />
Greece ... ... ... ... ... ... ... ... ... ... ... ... ... ...<br />
Holy See . . . . . . . . . . . . . .<br />
Iceland — -1 . -1 — -1 — -1 — -1 ... ... ... — -1 — -1 — -1 ... ... ...<br />
Ireland 3 44 1 1 1 2 2 2 — — — 6 7 6<br />
Israel 9 -1 35 -1 1 -1 1 -1 1 -1 2 -1 3 -1 1 -1 2 -1 2 -1 1 -1 2 -1 4 -1 1 -1<br />
Italy 9 33 — — — 4 5 3 4 6 3 4 5 3<br />
Liechtenstein — . — — — — — — — — — — — —<br />
Luxembourg 1 -2 46 -2 4 -2 4 -2 4 -2 10 -2 11 -2 8 -2 11 -2 12 -2 9 -2 7 -2 9 -2 6 -2<br />
Malta — 48 1 1 1 2 3 2 — 1 — 12 14 10<br />
Monaco — -1 . -1 — -1 — -1 — -1 — -1 — -1 — -1 — -1 — -1 — -1 — -1 — -1 — -1<br />
Netherlands . . . . . 5 6 5 4 4 3 9 10 8<br />
Norway . . . . . ... ... ... . . . ... ... ...<br />
Portugal ... ... ... ... ... ... ... ... ... ... ... ... ... ...<br />
San Marino — . — — — — — — — — — — — —<br />
Spain 72 42 3 3 2 12 14 11 13 15 12 14 16 13<br />
Sweden — . — — — — — — — — — — — —<br />
Switzerland 7 45 1 2 1 2 3 2 2 2 2 4 5 4<br />
United Kingdom — -1 . -1 — -1 — -1 — -1 ... ... ... ... ... ... ... ... ...<br />
United States of America — ** . ** — ** — ** — ** ... ... ... ... ... ... ... ... ...<br />
SOUTH AND WEST ASIA<br />
Afghanistan ... ... ... ... ... ... ... ... ... ... ... ... ... ...<br />
Bangladesh 2,117 * 50 * 12 * 13 * 12 * 4 4 4 3 3 3 4 4 4<br />
Bhutan 6 +1 42 +1 6 +1 7 +1 5 +1 3 +1 3 +1 3 +1 4 +1 4 +1 3 +1 3 +1 2 +1 3 +1<br />
India 4,929 -2 47 -2 3 -2 3 -2 3 -2 ... ... ... 5 -2 5 -2 4 -2 ... ... ...<br />
Iran (Islamic Republic of) 114 -1 38 -1 2 -1 2 -1 2 -1 ... ... ... 4 -1 6 -1 2 -1 ... ... ...<br />
Maldives 2 +1 44 +1 4 +1 4 +1 3 +1 7 -2 8 -2 7 -2 8 -2 8 -2 7 -2 — -2 — -2 — -2<br />
Nepal 593 +1 50 +1 12 +1 12 +1 12 +1 ... ... ... 6 +1 6 +1 6 +1 ... ... ...<br />
Pakistan 809 41 4 5 4 7 5 9 3 4 3 11 7 17<br />
Sri Lanka 13 42 1 1 1 1 1 — 1 1 1 — — —<br />
SUB-SAHARAN AFRICA<br />
Angola 463 48 11 10 12 19 -1 21 -1 17 -1 19 -1 22 -1 16 -1 17 -1 16 -1 19 -1<br />
Benin 239 ** 46 ** 13 ** 13 ** 13 ** ... ... ... ... ... ... ... ... ...
OPPORTUNITIES LOST: THE IMPACT OF GRADE REPETITION AND EARLY SCHOOL LEAVING<br />
Primary education<br />
Secondary education<br />
REGION<br />
Repeaters<br />
Percentage of repeaters<br />
Secondary (ISCED 2 and 3),<br />
general programmes<br />
Percentage of repeaters<br />
Lower secondary (ISCED 2),<br />
general programmes<br />
Upper secondary (ISCED 3),<br />
general programmes<br />
Country or territory MF (000) % F MF M F MF M F MF M F MF M F<br />
(1) (2) (3) (4) (5) (6) (7) (8) (9) (10) (11) (12) (13) (14)<br />
Botswana 15 ** , -1 38 ** , -1 5 ** , -1 5 ** , -1 4 ** , -1 ... ... ... ... ... ... ... ... ...<br />
Burkina Faso 207 47 10 10 10 26 +1 30 +1 21 +1 27 +1 31 +1 20 +1 21 +1 22 +1 21 +1<br />
Burundi 623 50 34 34 34 24 22 25 25 24 27 18 17 19<br />
Cameroon 461 44 13 14 13 19 -1 18 -1 19 -1 16 -1 15 -1 16 -1 25 -1 25 -1 25 -1<br />
Cape Verde 7 37 10 12 8 20 22 18 24 26 22 14 15 13<br />
Central African Republic 147 +1 44 +1 23 +1 22 +1 23 +1 14 14 14 15 15 15 13 13 14<br />
Chad 386 43 22 22 23 20 19 21 19 18 21 21 22 21<br />
Comoros 27 -2 47 -2 24 -2 24 -2 24 -2 ... ... ... ... ... ... ... ... ...<br />
Congo 135 47 19 20 18 24 -1 23 -1 24 -1 26 -1 26 -1 25 -1 17 -1 15 -1 19 -1<br />
Côte d’Ivoire 457 +1 ... 17 +1 ... ... 17 +1 18 +1 17 +1 14 +1 14 +1 14 +1 25 +1 25 +1 24 +1<br />
Democratic Republic of the Congo 1,493 47 14 14 14 19 -1 18 -1 20 -1 ... ... ... ... ... ...<br />
Equatorial Guinea 17 46 20 21 19 ... ... ... ... ... ... ... ... ...<br />
Eritrea 42 41 15 16 13 9 10 9 12 13 12 4 5 3<br />
Ethiopia 535 51 4 4 4 7 ** 7 ** 8 ** 8 7 8 1 ** 1 ** 1 **<br />
Gabon ... ... ... ... ... ... ... ... ... ... ... ... ... ...<br />
Gambia … … … … … 4 ** 4 ** 4 ** 4 ** 4 ** 4 ** 4 ** 4 ** 5 **<br />
Ghana 98 +1 50 +1 3 +1 2 +1 3 +1 3 -1 4 -1 2 -1 3 -1 4 -1 2 -1 3 -1 3 -1 3 -1<br />
Guinea 240 48 17 16 18 16 16 15 16 17 16 14 14 14<br />
Guinea-Bissau 39 49 14 14 14 13 13 14 15 15 16 6 6 6<br />
Kenya ... ... ... ... ... ... ... ... ... ... ... ... ... ...<br />
Lesotho 78 41 20 23 17 14 ** 14 ** 14 ** 15 ** 15 ** 14 ** 12 ** 12 ** 12 **<br />
Liberia 36 -2 48 -2 7 -2 6 -2 7 -2 6 -2 6 -2 6 -2 6 -2 6 -2 6 -2 6 -2 6 -2 7 -2<br />
Madagascar 845 47 20 21 19 9 9 9 9 9 9 9 9 8<br />
Malawi 648 50 19 19 19 10 10 10 11 11 11 6 5 6<br />
Mali 272 +1 46 +1 13 +1 13 +1 13 +1 20 +1 20 +1 20 +1 ... ... ... ... ... ...<br />
Mauritius 4 40 3 4 3 12 13 11 5 5 5 18 20 15<br />
Mozambique 403 +1 46 +1 8 +1 8 +1 7 +1 14 +1 14 +1 14 +1 15 +1 15 +1 15 +1 6 +1 6 +1 6 +1<br />
Namibia 64 -1 42 -1 16 -1 18 -1 14 -1 15 -1 15 -1 15 -1 19 -1 19 -1 19 -1 1 -1 1 -1 1 -1<br />
Niger 71 +1 45 +1 4 +1 4 +1 4 +1 19 +1 19 +1 19 +1 19 +1 20 +1 19 +1 16 +1 17 +1 14 +1<br />
Nigeria . . . . . ... ... ... . . . ... ... ...<br />
Rwanda 317 50 14 14 14 4 3 4 4 4 4 2 2 2<br />
Sao Tome and Principe 4 +1 44 +1 12 +1 14 +1 11 +1 21 +1 22 +1 21 +1 22 +1 23 +1 21 +1 19 +1 18 +1 19 +1<br />
Senegal 106 50 6 6 6 16 16 16 15 15 15 18 18 19<br />
Seychelles . . . . . . . . . . . . . .<br />
Sierra Leone 187 +1 50 +1 16 +1 15 +1 16 +1 13 +1 12 +1 14 +1 13 +1 11 +1 14 +1 13 +1 12 +1 15 +1<br />
Somalia ... ... ... ... ... ... ... ... ... ... ... ... ... ...<br />
South Africa ... ... ... ... ... ... ... ... ... ... ... ... ... ...<br />
Swaziland 36 41 15 17 13 11 11 10 11 11 10 10 10 10<br />
Togo 285 48 22 22 22 23 ** 23 ** 23 ** 23 ** 23 ** 23 ** 22 ** 23 ** 20 **<br />
Uganda 901 49 11 11 11 2 2 2 2 2 2 3 3 3<br />
United Republic of Tanzania 201 48 2 3 2 1 1 2 ... ... ... ... ... ...<br />
Zambia 175 47 6 6 6 6 5 6 9 9 9 1 ** 1 ** 1 **<br />
Zimbabwe ... ... ... ... ... ... ... ... ... ... ... ... ... ...<br />
REGIONAL AVERAGES<br />
WORLD 32,231 ** 46 ** 4.7 ** 4.8 ** 4.5 ** 4.8 ** 5.9 ** 3.7 ** 4.6 ** 5.5 ** 3.5 ** 5.3 ** 6.5 ** 4.0 **<br />
Arab States 2,857 38 ** 6.8 8.0 ** 5.6 ** 9.8 ** 11.8 ** 7.6 ** 9.8 ** 12.0 ** 7.4 ** 9.7 ** 11.4 ** 8.0 **<br />
Central and Eastern Europe 200 ** 65 ** 1.0 ** 0.7 ** 1.4 ** 1.2 ** 1.0 ** 1.5 ** 1.2 ** 0.9 ** 1.6 ** 1.1 ** 1.2 ** 1.0 **<br />
Central Asia 5 43 0.1 0.1 0.1 0.2 0.2 0.2 0.2 0.2 0.1 0.2 0.2 0.2<br />
East Asia and the Pacific 2,732 40 1.5 1.7 1.2 0.8 1.0 0.7 0.9 1.0 0.7 0.8 0.9 0.7<br />
Latin America and the Caribbean 5,382 ** 47 ** 8.1 ** 8.3 ** 7.8 ** 10.7 ** 16.8 ** 4.8 ** 10.7 ** 15.9 ** 5.5 ** 10.7 ** 18.9 ** 3.5 **<br />
North America and Western Europe 429 77 0.8 0.4 1.3 3.8 ** 4.4 ** 3.2 ** 3.8 ** 4.4 ** 3.2 ** 3.8 ** 4.3 ** 3.3 **<br />
South and West Asia 9,055 ** 46 ** 4.8 ** , -1 5.0 ** , -1 4.7 ** , -1 4.8 ** 5.3 ** 4.2 ** 4.6 ** , -1 5.0 ** , -1 4.1 ** , -1 5.1 ** 5.8 ** 4.3 **<br />
Sub-Saharan Africa 11,382 47 8.6 8.6 8.5 11.7 ** 11.8 ** 11.6 ** 9.7 ** 10.5 ** 8.8 ** 16.0 ** 14.5 ** 17.9 **<br />
113
TABLE<br />
6<br />
SECONDARY EDUCATION / ISCED 2 and 3 / Measures of enrolment / 2010<br />
Age<br />
Enrolment<br />
Enrolment in technical and vocational<br />
programmes as a % of total<br />
enrolment in secondary education<br />
Gross enrolment ratio<br />
Net enrolment rate<br />
114<br />
REGION<br />
Country or territory<br />
ARAB STATES<br />
ISCED<br />
2 and 3<br />
Secondary<br />
(ISCED 2 and 3),<br />
all programmes<br />
Secondary<br />
(ISCED 2 and 3)<br />
Upper secondary<br />
(ISCED 3)<br />
Secondary<br />
(ISCED 2 and 3), all programmes<br />
Secondary<br />
(ISCED 2 and 3), all programmes<br />
MF (000) % F MF % F MF % F MF M F GPI MF M F GPI<br />
(1) (2) (3) (4) (5) (6) (7) (8) (9) (10) (11) (12) (13) (14) (15)<br />
Algeria 11-17 4,585 -1 49 -1 10 -1 35 -1 12 -1 55 -1 95 -1 94 -1 96 -1 1.02 -1 ... ... ... ...<br />
Bahrain 12-17 80 50 8 13 17 13 ... ... ... ... ... ... ... ...<br />
Djibouti 11-17 51 +1 44 +1 4 +1 41 +1 12 +1 41 +1 36 +1 40 +1 32 +1 0.80 +1 24 ** , -2 28 ** , -2 20 ** , -2 0.72 ** , -2<br />
Egypt 12-17 6,846 48 18 ** 43 ** 51 45 72 74 71 0.96 70 ** 71 ** 69 ** 0.96 **<br />
Iraq 12-17 ... ... ... ... ... ... ... ... ... ... ... ... ... ...<br />
Jordan 12-17 710 50 4 -2 38 -2 15 -2 38 -2 87 85 89 1.06 86 83 88 1.06<br />
Kuwait 11-17 258 50 2 -1 10 -1 4 -1 13 -1 ... ... ... ... 89 -2 86 -2 93 -2 1.08 -2<br />
Lebanon 12-17 383 52 15 42 27 45 81 77 86 1.12 75 71 79 1.12<br />
Libya 12-17 ... ... ... ... ... ... ... ... ... ... ... ... ... ...<br />
Mauritania 12-17 111 ** 45 ** ... ... ... ... 24 ** 26 ** 22 ** 0.85 ** ... ... ... ...<br />
Morocco 12-17 ... ... ... ... ... ... ... ... ... ... ... ... ... ...<br />
Oman 12-17 322 -1 48 -1 . -1 . -1 . -1 . -1 100 -1 101 -1 100 -1 0.99 -1 90 -1 89 -1 90 -1 1.01 -1<br />
Palestine 10-17 711 51 1 35 6 35 86 83 89 1.08 84 81 87 1.07<br />
Qatar 12-17 69 49 1 . 2 . 94 86 104 1.21 83 76 93 1.22<br />
Saudi Arabia 12-17 3,036 48 — . ... ... 101 103 98 0.95 81 78 83 1.06<br />
Sudan (pre-secession) a 12-16 1,837 -1 46 -1 2 -1 24 -1 4 -1 24 -1 39 -1 41 -1 36 -1 0.88 -1 ... ... ... ...<br />
Syrian Arab Republic 10-17 2,732 49 4 40 21 40 72 72 73 1.01 67 67 67 1.01<br />
Tunisia 12-18 1,202 -1 50 ** , -1 12 -1 35 ** , -1 11 -1 30 ** , -1 90 -1 88 ** , -1 93 ** , -1 1.06 ** , -1 ... ... ... ...<br />
United Arab Emirates 11-17 337 ** 50 ** ... ... ... ... ... ... ... ... ... ... ... ...<br />
Yemen 12-17 1,562 ** 37 ** ... ... ... ... 44 ** 54 ** 34 ** 0.62 ** 40 ** 49 ** 31 ** 0.63 **<br />
CENTRAL AND EASTERN EUROPE<br />
Albania 11-17 356 48 6 31 14 31 89 90 88 0.98 ... ... ... ...<br />
Belarus 10-16 ... ... ... ... ... ... ... ... ... ... … ... ... ...<br />
Bosnia and Herzegovina 10-17 323 49 34 45 74 45 91 90 92 1.03 ... ... ... ...<br />
Bulgaria 11-18 532 48 30 39 51 39 89 91 87 0.95 83 84 82 0.97<br />
Croatia 11-18 389 50 37 49 72 47 96 93 99 1.07 91 88 94 1.06<br />
Czech Republic 11-18 868 -1 49 -1 39 -1 45 -1 73 -1 45 -1 90 -1 90 -1 91 -1 1.01 -1 ... ... ... ...<br />
Estonia 13-18 100 -1 49 -1 19 -1 34 -1 33 -1 35 -1 104 -1 103 -1 105 -1 1.02 -1 92 -1 91 -1 93 -1 1.02 -1<br />
Hungary 11-18 913 -1 49 -1 14 -1 38 -1 27 -1 37 -1 98 -1 99 -1 98 -1 0.99 -1 91 -1 91 -1 91 -1 0.99 -1<br />
Latvia 13-18 147 49 24 39 41 40 95 96 94 0.98 84 83 84 1.02<br />
Lithuania 11-18 343 48 11 33 30 35 99 100 98 0.98 91 91 91 1.01<br />
Montenegro 11-18 70 49 31 46 68 46 104 103 105 1.01 ... ... ... ...<br />
Poland 13-18 2,958 -1 49 -1 28 -1 37 -1 51 -1 37 -1 97 -1 98 -1 97 -1 0.99 -1 91 -1 90 -1 92 -1 1.02 -1<br />
Republic of Moldova 11-17 308 50 12 42 36 42 88 * 87 * 89 * 1.02 * 79 * 78 * 79 * 1.02 *<br />
Romania 11-18 1,822 48 33 43 64 43 97 98 97 0.99 82 -1 82 -1 83 -1 1.02 -1<br />
Russian Federation 11-17 9,614 -1 48 -1 16 -1 37 -1 48 -1 37 -1 89 -1 90 -1 87 -1 0.98 -1 ... ... ... ...<br />
Serbia 11-18 591 49 37 47 76 47 91 * 91 * 92 * 1.02 * 90 * 89 * 91 * 1.02 *<br />
Slovakia 10-18 550 49 35 45 71 46 90 90 91 1.01 ... ... ... ...<br />
Slovenia 12-18 142 -1 49 -1 36 -1 41 -1 59 -1 41 -1 97 -1 97 -1 97 -1 1.00 -1 92 -1 91 -1 92 -1 1.01 -1<br />
The former Yugoslav Rep. of Macedonia 11-18 197 48 29 44 60 44 84 84 83 0.99 ... ... ... ...<br />
Turkey 11-17 7,101 -1 47 -1 20 -1 42 -1 43 -1 42 -1 78 -1 81 -1 74 -1 0.91 -1 74 ** , -1 77 ** , -1 71 ** , -1 0.93 ** , -1<br />
Ukraine 10-16 3,133 48 * 8 36 29 36 96 97 * 94 * 0.98 * 86 * 86 * 86 * 1.01 *<br />
CENTRAL ASIA<br />
Armenia 10-16 281 48 2 25 6 25 92 91 93 1.02 86 85 88 1.03<br />
Azerbaijan 10-17 1,063 47 17 51 44 51 85 * 85 * 84 * 0.98 * ... ... ... ...<br />
Georgia 12-17 342 -1 ... 1 -1 ... 3 -1 ... 86 -1 ... ... ... 79 -1 ... ... ...<br />
Kazakhstan 11-17 1,680 +1 48 +1 7 +1 30 +1 24 +1 30 +1 100 +1 101 +1 98 +1 0.97 +1 90 +1 90 +1 89 +1 0.99 +1<br />
Kyrgyzstan 11-17 664 * 49 * 3 * 27 * 15 * 27 * 84 * 85 * 83 * 0.99 * 79 * 79 * 79 * 0.99 *<br />
Mongolia 11-16 276 51 10 47 29 47 89 86 92 1.07 ... ... ... ...<br />
Tajikistan 11-17 1,032 46 2 15 11 15 87 93 81 0.87 85 90 80 0.89<br />
Turkmenistan 10-16 ... ... ... ... ... ... ... ... ... ... ... ... ... ...<br />
Uzbekistan 11-17 4,370 +1 49 +1 … … … … 106 +1 107 +1 104 +1 0.98 +1 92 -1 93 -1 91 -1 0.98 -1<br />
EAST ASIA AND THE PACIFIC<br />
Australia 12-17 2,282 47 33 42 48 41 131 135 128 0.95 85 85 86 1.02<br />
Brunei Darussalam 12-18 49 49 8 41 12 41 110 108 112 1.03 97 -1 95 -1 99 -1 1.04 -1<br />
Cambodia 12-17 949 ** 46 ** ... ... ... ... 46 ** 49 ** 44 ** 0.90 ** ... ... ... ...<br />
China 12-17 99,218 47 21 45 46 45 81 80 83 1.04 ... ... ... ...
OPPORTUNITIES LOST: THE IMPACT OF GRADE REPETITION AND EARLY SCHOOL LEAVING<br />
Age<br />
Enrolment<br />
Enrolment in technical and vocational<br />
programmes as a % of total<br />
enrolment in secondary education<br />
Gross enrolment ratio<br />
Net enrolment rate<br />
REGION<br />
Country or territory<br />
ISCED<br />
2 and 3<br />
Secondary<br />
(ISCED 2 and 3),<br />
all programmes<br />
Secondary<br />
(ISCED 2 and 3)<br />
Upper secondary<br />
(ISCED 3)<br />
Secondary<br />
(ISCED 2 and 3), all programmes<br />
Secondary<br />
(ISCED 2 and 3), all programmes<br />
MF (000) % F MF % F MF % F MF M F GPI MF M F GPI<br />
(1) (2) (3) (4) (5) (6) (7) (8) (9) (10) (11) (12) (13) (14) (15)<br />
China, Hong Kong SAR 12-18 508 49 1 11 2 11 83 82 84 1.02 75 * 75 * 76 * 1.02 *<br />
China, Macao SAR 12-17 38 49 3 44 7 44 92 96 89 0.93 76 78 75 0.96<br />
Cook Islands 11-17 2 +1 52 +1 . +1 . +1 . +1 . +1 82 * , +1 75 * , +1 89 * , +1 1.20 * , +1 78 * , +1 72 * , +1 84 * , +1 1.18 * , +1<br />
Democratic People’s Rep. of Korea 11-16 ... ... ... ... ... ... ... ... ... ... ... ... ... ...<br />
Fiji 12-18 98 -1 51 -1 2 -1 31 -1 7 -1 31 -1 86 -1 83 -1 91 -1 1.09 -1 ... ... ... ...<br />
Indonesia 13-18 19,976 49 17 42 41 42 77 77 77 1.00 67 68 67 0.99<br />
Japan 12-17 7,296 49 12 43 24 43 102 102 102 1.00 100 99 100 1.00<br />
Kiribati 12-17 12 -2 51 -2 — -2 . -2 — -2 . -2 86 -2 81 -2 90 -2 1.11 -2 ... ... ... ...<br />
Lao People’s Democratic Republic 11-16 435 45 — 43 1 43 47 51 43 0.83 40 42 38 0.91<br />
Malaysia 12-18 2,546 -1 51 -1 6 -1 43 -1 15 -1 43 -1 68 -1 66 -1 71 -1 1.07 -1 68 -1 65 -1 71 -1 1.08 -1<br />
Marshall Islands 12-17 5 -1 50 -1 ... ... ... ... 99 -1 97 -1 100 -1 1.03 -1 ... ... ... ...<br />
Micronesia (Federated States of) 12-17 ... ... ... ... ... ... ... ... ... ... ... ... ... ...<br />
Myanmar 10-15 2,852 51 — . — . 54 53 56 1.06 51 49 52 1.06<br />
Nauru 12-17 1 -2 51 -2 ... ... ... ... 63 * , -2 58 * , -2 69 * , -2 1.20 * , -2 ... ... ... ...<br />
New Zealand 11-17 512 50 15 49 30 49 119 116 122 1.05 95 94 95 1.01<br />
Niue 11-16 ... ... ... ... ... ... ... ... ... ... ... ... ... ...<br />
Palau 11-17 ... ... ... ... ... ... ... ... ... ... ... ... ... ...<br />
Papua New Guinea 13-18 ... ... ... ... ... ... ... ... ... ... ... ... ... ...<br />
Philippines 12-15 6,767 -1 51 -1 . -1 . -1 . -1 . -1 85 -1 82 -1 88 -1 1.08 -1 62 -1 56 -1 67 -1 1.19 -1<br />
Republic of Korea 12-17 3,951 47 12 45 24 45 97 98 96 0.99 96 ** 96 ** 95 ** 0.99 **<br />
Samoa 11-17 26 51 . . . . 85 79 91 1.14 78 73 83 1.13<br />
Singapore 12-15 232 -1 48 -1 12 -1 35 -1 11 -1 36 -1 ... ... ... ... ... ... ... ...<br />
Solomon Islands 12-18 ... ... ... ... ... ... ... ... ... ... ... ... ... ...<br />
Thailand 12-17 4,893 +1 51 +1 15 +1 43 +1 36 +1 43 +1 79 +1 76 +1 82 +1 1.08 +1 74 +1 70 +1 78 +1 1.12 +1<br />
Timor-Leste 12-17 102 49 6 44 14 44 56 56 56 1.01 37 34 39 1.12<br />
Tokelau 11-15 ... ... ... ... ... ... ... ... ... ... ... ... ... ...<br />
Tonga 11-16 ... ... ... ... ... ... ... ... ... ... ... ... ... ...<br />
Tuvalu 12-17 ... ... ... ... ... ... ... ... ... ... ... ... ... ...<br />
Vanuatu 12-18 20 49 10 39 28 37 55 54 55 1.02 47 46 49 1.05<br />
Viet Nam 11-17 8,800 51 ... ... ... ... 77 74 81 1.09 ... ... ... ...<br />
LATIN AMERICA AND THE CARIBBEAN<br />
Anguilla 12-16 1 50 — 25 1 25 ... ... ... ... … ** , -2 … ** , -2 … ** , -2 … ** , -2<br />
Antigua and Barbuda 12-16 8 51 7 48 8 76 105 105 106 1.01 85 85 85 0.99<br />
Argentina 12-17 3,637 -1 52 -1 8 -1 38 -1 21 -1 38 -1 89 -1 83 -1 94 -1 1.12 -1 82 -1 78 -1 87 -1 1.11 -1<br />
Aruba 12-16 7 50 16 37 24 40 90 89 90 1.01 73 -1 72 -1 75 -1 1.04 -1<br />
Bahamas 11-16 34 51 . . . . 96 93 98 1.05 85 82 88 1.07<br />
Barbados 11-15 19 * 50 * . * . . * . 101 * 96 * 105 * 1.09 * 84 * 81 * 88 * 1.08 *<br />
Belize 11-16 33 52 4 50 18 50 ... ... ... ... ... ... ... ...<br />
Bermuda 11-17 4 53 . . . . 79 72 85 1.18 50 48 51 1.06<br />
Bolivia (Plurinational State of) 12-17 1,061 -1 49 -1 . -1 . -1 . -1 . -1 80 -1 81 -1 80 -1 0.99 -1 68 -1 68 -1 69 -1 1.02 -1<br />
Brazil 11-17 23,539 51 6 57 14 57 ... ... ... ... ... ... ... ...<br />
British Virgin Islands 12-16 2 50 21 40 52 46 102 * 100 * 104 * 1.03 * ... ... ... ...<br />
Cayman Islands 11-16 3 -2 52 -2 . -2 . -2 . -2 . -2 83 -2 78 -2 88 -2 1.13 -2 76 -2 74 -2 78 -2 1.06 -2<br />
Chile 12-17 1,528 -1 50 -1 23 -1 48 -1 37 -1 48 -1 88 -1 87 -1 89 -1 1.03 -1 83 -1 81 -1 84 -1 1.04 -1<br />
Colombia 11-16 5,080 51 8 54 28 54 96 92 101 1.10 74 72 77 1.08<br />
Costa Rica 12-16 414 50 15 50 18 52 100 97 103 1.06 ... ... ... ...<br />
Cuba 12-17 798 +1 48 +1 27 +1 38 +1 53 +1 40 +1 90 +1 91 +1 90 +1 0.99 +1 87 +1 87 +1 87 +1 1.00 +1<br />
Dominica 12-16 7 51 3 58 . . 98 94 103 1.09 ... ... ... ...<br />
Dominican Republic 12-17 905 52 4 62 7 62 76 72 81 1.12 62 58 67 1.15<br />
Ecuador 12-17 1,243 ** , -2 50 ** , -2 22 ** , -2 52 ** , -2 52 ** , -2 52 ** , -2 75 ** , -2 74 ** , -2 76 ** , -2 1.03 ** , -2 ... ... ... ...<br />
El Salvador 13-18 577 50 18 52 55 52 65 65 65 1.01 58 57 59 1.04<br />
Grenada 12-16 12 50 4 32 . . 108 106 109 1.03 91 -2 95 -2 86 -2 0.91 -2<br />
Guatemala 13-17 983 48 27 51 87 51 59 61 57 0.93 42 43 40 0.94<br />
Guyana 12-16 81 51 7 43 14 23 91 87 96 1.11 81 ** , -1 78 ** , -1 83 ** , -1 1.07 ** , -1<br />
Haiti 12-18 ... ... ... ... ... ... ... ... ... ... ... ... ... ...<br />
Honduras 12-16 655 54 46 -2 56 -2 82 -2 58 -2 73 66 81 1.23 ... ... ... ...<br />
Jamaica 12-16 265 50 . . . . 93 91 94 1.03 84 80 87 1.08<br />
Mexico 12-17 11,682 51 16 56 9 47 89 86 92 1.07 71 70 73 1.04<br />
115
TABLE<br />
6<br />
SECONDARY EDUCATION / ISCED 2 and 3 / Measures of enrolment / 2010<br />
Age<br />
Enrolment<br />
Enrolment in technical and vocational<br />
programmes as a % of total<br />
enrolment in secondary education<br />
Gross enrolment ratio<br />
Net enrolment rate<br />
116<br />
REGION<br />
Country or territory<br />
ISCED<br />
2 and 3<br />
Secondary<br />
(ISCED 2 and 3),<br />
all programmes<br />
Secondary<br />
(ISCED 2 and 3)<br />
Upper secondary<br />
(ISCED 3)<br />
Secondary<br />
(ISCED 2 and 3), all programmes<br />
Secondary<br />
(ISCED 2 and 3), all programmes<br />
MF (000) % F MF % F MF % F MF M F GPI MF M F GPI<br />
(1) (2) (3) (4) (5) (6) (7) (8) (9) (10) (11) (12) (13) (14) (15)<br />
Montserrat 12-16 0.4 -1 48 -1 . -1 . -1 . -1 . -1 ... ... ... ... ... ... ... ...<br />
Netherlands Antilles a 12-17 ... ... ... ... ... ... ... ... ... ... ... ... ... ...<br />
Nicaragua 12-16 465 52 1 60 5 60 69 66 73 1.10 46 43 49 1.14<br />
Panama 12-17 284 51 16 49 44 49 74 72 77 1.07 69 66 72 1.08<br />
Paraguay 12-17 549 -1 50 -1 10 -1 50 -1 24 -1 51 -1 67 -1 65 -1 68 -1 1.05 -1 60 -1 58 -1 62 -1 1.07 -1<br />
Peru 12-16 2,651 49 . . . . 91 92 91 0.98 78 77 78 1.01<br />
Puerto Rico 12-17 291 50 ... ... ... ... … … … … … … … …<br />
Saint Kitts and Nevis 12-16 4 49 . . . . 97 98 97 0.99 88 * 89 * 88 * 0.99 *<br />
Saint Lucia 12-16 16 49 1 19 . . 96 97 96 0.99 85 ** 85 ** 85 ** 1.00 **<br />
Saint Vincent and the Grenadines 12-16 11 50 . . . -1 . -1 107 106 109 1.02 90 -2 85 -2 96 -2 1.12 -2<br />
Suriname 12-18 47 -1 54 -1 46 ** , -1 47 ** , -1 63 -1 61 -1 75 -1 67 -1 83 -1 1.23 -1 50 ** , -1 46 ** , -1 55 ** , -1 1.20 ** , -1<br />
Trinidad and Tobago 12-16 95 ** , -2 51 ** , -2 ... ... ... ... 90 ** , -2 87 ** , -2 93 ** , -2 1.07 ** , -2 ... ... ... ...<br />
Turks and Caicos Islands 12-16 2 -1 52 -1 . -1 . -1 . -1 . -1 ... ... ... ... ... ... ... ...<br />
Uruguay 12-17 288 -1 ... 16 -1 ... 28 -1 44 -1 90 -1 ... ... ... 70 -2 66 -2 73 -2 1.11 -2<br />
Venezuela (Bolivarian Republic of) 12-16 2,255 51 5 50 16 50 83 79 86 1.10 72 68 76 1.11<br />
NORTH AMERICA AND WESTERN EUROPE<br />
Andorra 12-17 4 48 9 50 30 50 87 85 89 1.05 74 74 75 1.01<br />
Austria 10-17 744 48 40 44 77 44 99 101 97 0.96 ... ... ... ...<br />
Belgium 12-17 810 -1 48 -1 42 -1 44 -1 56 -1 45 -1 111 -1 112 -1 109 -1 0.97 -1 ... ... ... ...<br />
Canada 12-17 2,668 -2 48 -2 ... ... ... ... 101 -2 102 -2 100 -2 0.98 -2 ... ... ... ...<br />
Cyprus 12-17 64 49 7 16 13 16 99 * 99 * 99 * 1.00 * 96 * 96 * 96 * 1.01 *<br />
Denmark 13-18 493 -1 49 -1 26 -1 44 -1 52 -1 44 -1 117 -1 116 -1 119 -1 1.02 -1 89 -1 88 -1 91 -1 1.03 -1<br />
Finland 13-18 427 50 31 47 56 47 108 105 110 1.05 94 94 94 1.01<br />
France 11-17 5,873 49 20 44 44 44 113 113 114 1.01 98 98 99 1.02<br />
Germany 10-18 7,664 47 20 39 51 38 103 106 100 0.95 ... ... ... ...<br />
Gibraltar 11-14 2 -1 47 -1 — -1 . -1 — -1 . -1 ... ... ... ... ... ... ... ...<br />
Greece 12-17 ... ... ... ... ... ... ... ... ... ... ... ... ... ...<br />
Holy See . . . . . . . . . . . . . . .<br />
Iceland 13-19 35 -1 50 -1 21 -1 42 -1 34 -1 42 -1 107 -1 106 -1 109 -1 1.03 -1 88 -1 87 -1 89 -1 1.02 -1<br />
Ireland 13-17 336 50 19 53 36 53 121 118 124 1.05 99 98 100 1.02<br />
Israel 12-17 694 -1 49 -1 19 -1 44 -1 35 -1 44 -1 102 -1 101 -1 103 -1 1.02 -1 98 -1 97 -1 100 -1 1.03 -1<br />
Italy 11-18 4,626 48 37 40 60 40 100 101 100 0.99 94 94 94 1.00<br />
Liechtenstein 12-18 2 50 — . — . 69 * 68 * 70 * 1.03 * 64 * 64 * 64 * 1.01 *<br />
Luxembourg 12-18 39 -2 50 -2 31 -2 48 -2 60 -2 48 -2 98 -2 96 -2 99 -2 1.02 -2 85 -2 84 -2 86 -2 1.03 -2<br />
Malta 11-17 37 46 15 34 49 34 101 107 95 0.89 81 82 80 0.97<br />
Monaco 11-17 3 49 18 45 40 45 ... ... ... ... ... ... ... ...<br />
Netherlands 12-17 1,475 48 47 46 68 48 121 122 121 0.99 87 87 88 1.02<br />
Norway 13-18 435 48 30 41 54 41 111 112 110 0.98 94 94 94 1.00<br />
Portugal 12-17 710 -1 50 -1 25 -1 43 -1 41 -1 45 -1 107 -1 105 -1 109 -1 1.04 -1 ... ... ... ...<br />
San Marino 11-18 2 48 22 32 37 32 97 ** 96 ** 98 ** 1.02 ** ... ... ... ...<br />
Spain 12-17 3,185 49 17 47 45 47 125 123 126 1.02 95 94 96 1.02<br />
Sweden 13-18 731 48 32 44 60 44 99 100 99 0.99 94 94 94 1.00<br />
Switzerland 13-19 605 48 35 42 66 42 95 97 94 0.97 83 84 82 0.97<br />
United Kingdom 11-17 5,430 -1 49 -1 13 -1 48 -1 23 -1 48 -1 102 -1 101 -1 103 -1 1.02 -1 96 -1 95 -1 97 -1 1.03 -1<br />
United States of America 12-17 24,193 49 . . . . 96 96 97 1.01 89 89 90 1.02<br />
SOUTH AND WEST ASIA<br />
Afghanistan 13-18 2,044 32 1 -1 32 -1 5 -1 32 -1 46 60 30 0.51 ... ... ... ...<br />
Bangladesh 11-17 11,395 52 4 21 9 21 51 48 55 1.13 47 * 45 * 50 * 1.13 *<br />
Bhutan 13-18 63 +1 50 +1 — +1 . +1 — +1 . +1 70 +1 69 +1 71 +1 1.04 +1 54 +1 50 +1 57 +1 1.14 +1<br />
India 11-17 107,687 46 1 -2 25 -2 2 -2 25 -2 63 66 60 0.92 ... ... ... ...<br />
Iran (Islamic Republic of) 11-17 8,120 45 10 34 17 34 91 98 84 0.86 86 92 80 0.87<br />
Maldives 13-17 ... ... ... ... ... ... ... ... ... ... ... ... ... ...<br />
Nepal 10-16 2,305 -2 47 -2 1 -2 ... 2 -2 ... ... ... ... ... ... ... ... ...<br />
Pakistan 10-16 9,685 42 4 42 10 42 34 39 29 0.76 34 38 29 0.76<br />
Sri Lanka 10-17 ... ... ... ... ... ... ... ... ... ... ... ... ... ...<br />
SUB-SAHARAN AFRICA<br />
Angola 12-17 850 41 43 33 73 35 31 37 25 0.69 12 -1 12 -1 11 -1 0.89 -1<br />
Benin 12-18 ... ... ... ... ... ... ... ... ... ... ... ... ... ...
OPPORTUNITIES LOST: THE IMPACT OF GRADE REPETITION AND EARLY SCHOOL LEAVING<br />
Age<br />
Enrolment<br />
Enrolment in technical and vocational<br />
programmes as a % of total<br />
enrolment in secondary education<br />
Gross enrolment ratio<br />
Net enrolment rate<br />
REGION<br />
Country or territory<br />
ISCED<br />
2 and 3<br />
Secondary<br />
(ISCED 2 and 3),<br />
all programmes<br />
Secondary<br />
(ISCED 2 and 3)<br />
Upper secondary<br />
(ISCED 3)<br />
Secondary<br />
(ISCED 2 and 3), all programmes<br />
Secondary<br />
(ISCED 2 and 3), all programmes<br />
MF (000) % F MF % F MF % F MF M F GPI MF M F GPI<br />
(1) (2) (3) (4) (5) (6) (7) (8) (9) (10) (11) (12) (13) (14) (15)<br />
Botswana 13-17 180 ** , -1 51 ** , -1 ... ... ... ... 82 ** , -1 79 ** , -1 84 ** , -1 1.06 ** , -1 61 ** , -1 57 ** , -1 65 ** , -1 1.15 ** , -1<br />
Burkina Faso 12-18 604 +1 43 +1 4 +1 46 +1 18 +1 49 +1 23 +1 25 +1 20 +1 0.78 +1 18 +1 19 +1 16 +1 0.80 +1<br />
Burundi 13-19 338 42 5 36 19 37 25 29 21 0.72 16 18 15 0.82<br />
Cameroon 12-18 1,283 ** 45 ** 20 ** 37 ** ... ... 42 ** 46 ** 38 ** 0.83 ** ... ... ... ...<br />
Cape Verde 12-17 62 54 3 48 7 48 88 80 95 1.20 66 61 71 1.16<br />
Central African Republic 12-18 126 +1 36 +1 4 +1 38 +1 12 +1 42 +1 18 +1 23 +1 13 +1 0.55 +1 14 ** , +1 18 ** , +1 10 ** , +1 0.55 ** , +1<br />
Chad 12-18 430 29 1 38 4 44 25 35 15 0.42 ... ... ... ...<br />
Comoros 12-18 ... ... ... ... ... ... ... ... ... ... ... ... ... ...<br />
Congo 12-18 ... ... ... ... ... ... ... ... ... ... ... ... ... ...<br />
Côte d’Ivoire 12-18 ... ... ... ... ... ... ... ... ... ... ... ... ... ...<br />
Democratic Republic of the Congo 12-17 3,484 36 20 33 33 33 38 48 28 0.58 ... ... ... ...<br />
Equatorial Guinea 13-19 ... ... ... ... ... ... ... ... ... ... ... ... ... ...<br />
Eritrea 12-18 248 43 1 45 1 45 32 36 28 0.76 29 32 25 0.77<br />
Ethiopia 13-18 4,207 45 8 44 59 44 36 39 32 0.82 ... ... ... ...<br />
Gabon 11-17 ... ... ... ... ... ... ... ... ... ... ... ... ... ...<br />
Gambia 13-18 124 ** 49 ** 10 -1 48 ** , -1 24 -1 48 ** , -1 54 ** 56 ** 53 ** 0.95 ** ... ... ... ...<br />
Ghana 12-18 2,148 +1 46 +1 3 +1 44 +1 9 +1 44 +1 58 +1 61 +1 55 +1 0.91 +1 49 ** , +1 51 ** , +1 47 ** , +1 0.92 ** , +1<br />
Guinea 13-19 560 ** , -1 36 ** , -1 2 ** , -1 44 ** , -1 7 ** , -1 43 ** , -1 38 ** , -1 48 ** , -1 28 ** , -1 0.59 ** , -1 29 ** , -1 36 ** , -1 22 ** , -1 0.61 ** , -1<br />
Guinea-Bissau 13-17 ... ... ... ... ... ... ... ... ... ... ... ... ... ...<br />
Kenya 12-17 3,204 -1 47 -1 — -1 58 -1 1 -1 58 -1 60 -1 63 -1 57 -1 0.90 -1 50 -1 52 -1 48 -1 0.94 -1<br />
Lesotho 13-17 123 58 2 79 2 59 46 39 54 1.38 30 23 37 1.62<br />
Liberia 12-17 ... ... ... ... ... ... ... ... ... ... ... ... ... ...<br />
Madagascar 11-17 1,022 ** , -1 49 ** , -1 4 -2 36 -2 14 -2 34 -2 31 ** , -1 32 ** , -1 30 -1 0.94 ** , -1 24 -2 23 -2 24 -2 1.05 -2<br />
Malawi 12-17 692 47 — . — . 32 34 31 0.91 28 28 27 0.98<br />
Mali 13-18 820 +1 41 +1 12 +1 41 +1 40 +1 41 +1 39 +1 46 +1 33 +1 0.71 +1 31 +1 36 +1 25 +1 0.70 +1<br />
Mauritius 11-17 133 ** 49 ** ... ... ... ... 89 ** 89 ** 89 ** 1.00 ** ... ... ... ...<br />
Mozambique 13-17 716 +1 46 +1 5 +1 34 +1 8 +1 37 +1 26 +1 28 +1 24 +1 0.87 +1 17 +1 18 +1 17 +1 0.94 +1<br />
Namibia 14-18 ... ... ... ... ... ... ... ... ... ... ... ... ... ...<br />
Niger 13-19 303 40 1 14 6 16 13 16 11 0.66 10 ** , -2 13 ** , -2 8 ** , -2 0.61 ** , -2<br />
Nigeria 12-17 9,057 46 ... ... ... ... 44 47 41 0.88 ... ... ... ...<br />
Rwanda 13-18 486 +1 52 +1 12 +1 50 +1 41 +1 50 +1 36 +1 35 +1 37 +1 1.05 +1 ... ... ... ...<br />
Sao Tome and Principe 12-16 12 +1 53 +1 2 +1 47 +1 15 +1 47 +1 59 +1 55 +1 63 +1 1.15 +1 48 ** , +1 44 ** , +1 52 ** , +1 1.17 ** , +1<br />
Senegal 13-19 725 46 5 52 ... ... 37 40 35 0.88 ... ... ... ...<br />
Seychelles 12-16 7 49 . . . . 119 114 125 1.09 94 -2 ... ... ...<br />
Sierra Leone 12-17 ... ... ... ... ... ... ... ... ... ... ... ... ... ...<br />
Somalia 12-17 ... ... ... ... ... ... ... ... ... ... ... ... ... ...<br />
South Africa 14-18 4,688 -1 51 -1 6 -1 43 -1 10 -1 43 -1 94 -1 92 -1 96 -1 1.05 -1 ... ... ... ...<br />
Swaziland 13-17 89 50 — . . . 58 58 58 1.00 33 29 37 1.29<br />
Togo 12-18 ... ... ... ... ... ... ... ... ... ... ... ... ... ...<br />
Uganda 13-18 1,306 ** 46 ** 7 -2 43 -2 21 -2 47 -2 28 ** 30 ** 26 ** 0.85 ** ... ... ... ...<br />
United Republic of Tanzania 14-19 ... ... ... ... ... ... ... ... ... ... ... ... ... ...<br />
Zambia 14-18 ... ... ... ... ... ... ... ... ... ... ... ... ... ...<br />
Zimbabwe 13-18 ... ... ... ... ... ... ... ... ... ... ... ... ... ...<br />
REGIONAL AVERAGES<br />
WORLD 543,487 48 11 44 24 44 70 71 69 0.97 63 ** 64 ** 61 ** 0.96 **<br />
Arab States 29,722 ** 47 ** 8 ** 40 ** 18 ** 45 ** 69 ** 71 ** 67 ** 0.94 ** 61 ** 63 ** 59 ** 0.95 **<br />
Central and Eastern Europe 30,347 ** 48 ** 20 ** 40 ** 48 ** 40 ** 88 ** 90 ** 87 ** 0.97 ** 82 ** 83 ** 82 ** 0.99 **<br />
Central Asia 10,443 48 … … … … 95 97 94 0.97 87 ** 88 ** 86 ** 0.97 **<br />
East Asia and the Pacific 163,776 48 17 45 39 45 80 79 82 1.03 73 ** 72 ** 75 ** 1.05 **<br />
Latin America and the Caribbean 60,365 51 10 53 18 52 90 86 93 1.08 74 71 76 1.07<br />
North America and Western Europe 61,832 49 13 43 26 43 102 102 102 1.00 91 91 92 1.01<br />
South and West Asia 143,351 46 2 ** , -1 30 ** , -1 4 ** , -1 30 ** , -1 59 62 56 0.91 51 ** , -2 55 ** , -2 47 ** , -2 0.87 ** , -2<br />
Sub-Saharan Africa 43,653 45 8 ** 40 ** 17 ** 43 ** 40 44 36 0.82 29 ** , -1 33 ** , -1 26 ** , -1 0.78 ** , -1<br />
117
TABLE<br />
7<br />
PRE-PRIMARY, PRIMARY AND SECONDARY EDUCATION / ISCED 0-3 /<br />
Teaching staff b / 2010<br />
Pre-primary education Primary education Secondary education<br />
118<br />
REGION<br />
Country or territory<br />
ARAB STATES<br />
Teaching staff<br />
Pupil-teacher ratio<br />
Teaching staff Pupilteacheteacher<br />
Teaching staff Pupil-<br />
Total Lower secondary Upper secondary<br />
ratio<br />
MF<br />
MF<br />
ratio MF<br />
MF<br />
MF<br />
Total<br />
(000) % F<br />
(000) % F<br />
(000) % F (000) % F (000) % F<br />
(1) (2) (3) (4) (5) (6) (7) (8) (9) (10) (11) (12) (13) (14) (15)<br />
Algeria 19 74 26 142 53 23 ... ... ... ... ... ... ... ... ...<br />
Bahrain 2 100 16 ... ... ... ... ... ... ... ... ... ... ... ...<br />
Djibouti 0.1 -1 75 -1 16 -1 2 +1 24 +1 35 +1 2 +1 ... 1 +1 25 +1 1 +1 ... 28 +1 32 +1 22 +1<br />
Egypt 33 ** , -1 99 -1 25 ** , -1 380 53 26 506 42 238 45 269 39 14 19 9<br />
Iraq ... ... ... ... ... ... ... ... ... ... ... ... ... ... ...<br />
Jordan 5 100 18 ... ... ... ... ... ... ... 16 -2 52 -2 ... ... 12 -2<br />
Kuwait 7 100 11 26 90 8 32 55 19 55 14 54 8 9 7<br />
Lebanon 10 99 16 33 86 14 43 57 20 65 23 50 9 11 7<br />
Libya ... ... ... ... ... ... ... ... ... ... ... ... ... ... ...<br />
Mauritania ... ... ... 14 36 37 ... ... 2 -2 13 -2 ... ... ... 35 ** , -2 ...<br />
Morocco 37 +1 65 +1 20 +1 151 +1 51 +1 26 +1 ... ... ... ... 45 -1 33 -1 ... ... ...<br />
Oman 2 99 23 26 ** , -1 64 ** , -1 12 ** , -1 22 -1 58 -1 14 ** , -1 64 ** , -1 8 -1 47 -1 15 -1 12 ** , -1 20 -1<br />
Palestine 5 100 19 14 69 28 32 50 24 52 7 46 23 23 20<br />
Qatar 2 -1 99 -1 15 -1 7 89 12 7 55 3 57 4 54 10 11 9<br />
Saudi Arabia 19 100 10 298 50 11 311 52 180 50 131 55 10 9 11<br />
Sudan (pre-secession) a 21 -1 100 -1 30 -1 124 ** , -1 61 ** , -1 38 ** , -1 83 ** , -1 55 ** , -1 38 ** , -1 61 ** , -1 45 -1 50 -1 22 ** , -1 28 ** , -1 17 -1<br />
Syrian Arab Republic 8 95 20 132 ** , -2 66 ** , -2 18 ** , -2 ... ... 121 ** , -2 66 ** , -2 ... ... ... 18 ** , -2 ...<br />
Tunisia ... ... ... 60 -1 55 -1 17 -1 87 -1 ... 39 -1 54 -1 48 -1 ... 14 -1 16 -1 12 -1<br />
United Arab Emirates 7 98 19 19 86 17 27 ** 65 ** 15 66 12 ** 64 ** 12 ** 14 10 **<br />
Yemen 2 95 15 111 25 31 ... ... 83 28 ... ... ... 12 ...<br />
CENTRAL AND EASTERN EUROPE<br />
Albania 4 100 18 11 82 20 24 62 16 62 8 62 15 14 17<br />
Belarus 44 98 6 24 99 15 ... ... ... ... ... ... ... ... ...<br />
Bosnia and Herzegovina 1 97 14 ... ... ... ... ... ... ... 12 56 ... ... 13<br />
Bulgaria 18 100 12 15 94 17 44 79 18 81 26 77 12 12 12<br />
Croatia 8 99 13 12 92 14 48 69 22 74 26 65 8 9 7<br />
Czech Republic 22 -1 100 -1 14 -1 25 -1 98 -1 19 -1 78 -1 66 -1 35 -1 74 -1 43 -1 58 -1 11 -1 11 -1 11 -1<br />
Estonia 9 -1 100 -1 6 -1 6 -1 93 -1 12 -1 11 -1 77 -1 5 -1 81 -1 6 -1 74 -1 9 -1 9 -1 10 -1<br />
Hungary 30 -1 100 -1 11 -1 37 -1 96 -1 10 -1 88 -1 71 -1 42 -1 78 -1 46 -1 65 -1 10 -1 10 -1 10 -1<br />
Latvia 6 100 11 10 94 12 16 83 8 85 9 82 9 8 10<br />
Lithuania 12 100 7 10 97 13 39 81 ... ... ... ... 9 ... ...<br />
Montenegro 1 ... 13 ... ... ... ... ... ... ... ... ... ... ... ...<br />
Poland 54 -1 98 -1 17 -1 239 -1 84 -1 10 -1 277 -1 70 -1 114 -1 74 -1 163 -1 67 -1 11 -1 12 -1 10 -1<br />
Republic of Moldova 12 100 10 9 98 16 29 77 21 78 8 74 10 10 12<br />
Romania 38 100 17 52 86 16 146 68 83 68 63 67 12 10 15<br />
Russian Federation 607 -1 96 -1 8 -1 278 -1 98 -1 18 -1 1,136 -1 81 -1 ... ... ... ... 8 -1 ... ...<br />
Serbia 11 99 14 17 90 16 62 64 32 65 29 64 10 9 10<br />
Slovakia 11 100 12 14 89 15 46 75 24 77 22 72 12 12 12<br />
Slovenia 5 -1 98 -1 9 -1 6 -1 98 -1 17 -1 16 -1 72 -1 8 -1 79 -1 8 -1 65 -1 9 -1 7 -1 11 -1<br />
The former Yugoslav Rep. of Macedonia 2 99 7 7 79 16 17 56 10 55 7 58 12 11 14<br />
Turkey 29 -1 94 -1 27 -1 ... ... ... ... ... ... ... 197 -1 42 -1 ... ... 17 -1<br />
Ukraine 139 99 9 98 99 16 ... ... ... ... ... ... ... ... ...<br />
CENTRAL ASIA<br />
Armenia 5 99 10 ... ... ... 42 84 ... ... ... ... 7 ... ...<br />
Azerbaijan 10 100 9 44 88 11 ... ... ... ... ... ... ... ... ...<br />
Georgia ... ... ... 35 * 86 * 8 * 45 * , -1 86 * , -1 22 * , -1 86 * , -1 23 * , -1 85 * , -1 8 * , -1 8 * , -1 8 * , -1<br />
Kazakhstan 54 +1 98 +1 10 +1 60 +1 98 +1 16 +1 189 +1 85 +1 ... ... ... ... 9 +1 ... ...<br />
Kyrgyzstan 3 99 26 16 98 24 44 83 ... ... ... ... 15 * ... ...<br />
Mongolia 4 98 25 9 96 30 19 73 ... ... ... ... 14 ... ...<br />
Tajikistan 5 100 12 27 64 25 60 59 ... ... ... ... 17 ... ...<br />
Turkmenistan ... ... ... ... ... ... ... ... ... ... ... ... ... ... ...<br />
Uzbekistan 56 +1 96 +1 9 +1 125 +1 87 +1 16 +1 329 +1 62 +1 ... ... ... ... 13 +1 ... ...<br />
EAST ASIA AND THE PACIFIC<br />
Australia ... ... ... ... ... ... ... ... ... ... ... ... ... ... ...<br />
Brunei Darussalam 1 97 20 4 76 11 5 -1 63 -1 ... ... ... ... 10 -1 ... ...<br />
Cambodia 4 92 28 47 46 48 ... ... 25 36 ... ... ... 24 ...<br />
China 1,106 97 24 5,997 58 17 6,417 48 3,658 49 2,759 48 15 15 16<br />
Lower<br />
secondary<br />
Upper<br />
secondary
OPPORTUNITIES LOST: THE IMPACT OF GRADE REPETITION AND EARLY SCHOOL LEAVING<br />
Pre-primary education Primary education Secondary education<br />
REGION<br />
Country or territory<br />
Teaching staff<br />
Pupil-teacher ratio<br />
Teaching staff Pupilteacheteacher<br />
Teaching staff Pupil-<br />
Total Lower secondary Upper secondary<br />
ratio<br />
MF<br />
MF<br />
ratio MF<br />
MF<br />
MF<br />
Total<br />
(000) % F<br />
(000) % F<br />
(000) % F (000) % F (000) % F<br />
(1) (2) (3) (4) (5) (6) (7) (8) (9) (10) (11) (12) (13) (14) (15)<br />
China, Hong Kong SAR 10 99 14 23 78 15 ... ... ... ... ... ... ... ... ...<br />
China, Macao SAR 1 99 17 2 88 16 2 59 1 63 1 54 16 17 16<br />
Cook Islands 0.03 +1 97 +1 16 +1 0.1 +1 ... 16 +1 0.1 +1 57 +1 ... ... ... ... 14 +1 ... ...<br />
Democratic People’s Republic of Korea ... ... ... ... ... ... ... ... ... ... ... ... ... ... ...<br />
Fiji ... ... ... 4 -2 55 -2 26 -2 5 -2 71 -2 3 -2 77 -2 2 -2 60 -2 19 -2 20 -2 17 -2<br />
Indonesia 340 -1 97 -1 12 -1 1,900 60 16 1,641 48 915 49 725 47 12 13 11<br />
Japan 109 ... 27 399 ... 18 614 ... 269 ... 344 ... 12 14 11<br />
Kiribati ... ... ... 1 -2 82 -2 25 -2 1 -2 48 -2 0.4 -2 51 -2 0.3 -2 42 -2 17 -2 17 -2 19 -2<br />
Lao People’s Democratic Republic 5 97 18 32 51 29 18 -2 44 -2 12 -2 44 -2 6 -2 46 -2 23 -2 22 -2 24 -2<br />
Malaysia 43 -1 97 -1 18 -1 226 -1 69 -1 13 -1 186 -1 67 -1 ... ... ... ... 14 -1 ... ...<br />
Marshall Islands ... ... ... ... ... ... ... ... ... ... 0.2 -1 ... ... ... 12 -1<br />
Micronesia (Federated States of) ... ... ... ... ... ... ... ... ... ... ... ... ... ... ...<br />
Myanmar 9 97 17 182 84 28 84 85 60 86 24 83 34 36 28<br />
Nauru 0.04 -2 98 -2 16 -2 0.1 -2 93 -2 22 -2 ... ... ... ... ... ... ... ... ...<br />
New Zealand 10 98 11 24 84 14 35 62 17 65 19 58 15 15 14<br />
Niue ... ... ... ... ... ... ... ... ... ... ... ... ... ... ...<br />
Palau ... ... ... ... ... ... ... ... ... ... ... ... ... ... ...<br />
Papua New Guinea ... ... ... ... ... ... ... ... ... ... ... ... ... ... ...<br />
Philippines ... ... ... 435 -1 90 -1 31 -1 194 -1 76 -1 136 -1 76 -1 59 -1 77 -1 35 -1 39 -1 25 -1<br />
Republic of Korea 31 -1 99 -1 17 -1 158 78 21 225 55 103 68 122 45 18 19 16<br />
Samoa 0.3 96 12 1 77 30 1 58 0.4 62 1 56 21 24 20<br />
Singapore ... ... ... 17 -1 81 -1 17 -1 16 -1 66 -1 7 -1 66 -1 8 -1 66 -1 15 -1 15 -1 15 -1<br />
Solomon Islands 1 -1 ... 15 -1 ... ... ... ... ... ... ... ... ... ... ... ...<br />
Thailand 102 +1 77 +1 27 +1 320 +1 59 +1 ... 246 +1 51 +1 129 +1 56 +1 117 +1 47 +1 20 +1 22 +1 18 +1<br />
Timor-Leste ... ... ... 8 40 30 4 29 2 30 2 27 23 26 20<br />
Tokelau ... ... ... ... ... ... ... ... ... ... ... ... ... ... ...<br />
Tonga ... ... ... ... ... ... ... ... ... ... ... ... ... ... ...<br />
Tuvalu ... ... ... ... ... ... ... ... ... ... ... ... ... ... ...<br />
Vanuatu 1 94 14 2 54 22 ... ... ... ... ... ... ... ... ...<br />
Viet Nam 196 98 17 348 78 20 474 ... 314 69 160 ... 19 17 22<br />
LATIN AMERICA AND THE CARIBBEAN<br />
Anguilla 0.04 100 10 0.1 93 14 ... ... ... ... ... ... ... ... ...<br />
Antigua and Barbuda 0.3 100 ... 1 94 15 1 72 0.4 77 0.3 66 12 16 8<br />
Argentina 72 -2 96 -2 20 -2 289 -2 87 -2 16 -2 324 -2 68 -2 153 -2 73 -2 171 -2 65 -2 11 -2 14 -2 8 -2<br />
Aruba 0.1 98 20 1 84 17 1 59 ... ... ... ... 14 ... ...<br />
Bahamas ... ... ... 2 92 14 3 76 1 78 1 74 12 12 12<br />
Barbados 0.4 * 97 16 * 2 * 78 * 13 * ... ... ... ... ... ... ... ... ...<br />
Belize 0.4 98 17 2 73 22 2 60 1 62 1 56 17 18 14<br />
Bermuda ... ... ... 1 90 7 1 73 0.4 76 0.4 70 5 5 5<br />
Bolivia (Plurinational State of) ... ... ... ... ... ... ... ... ... ... ... ... ... ... ...<br />
Brazil 384 97 18 762 91 22 1,413 67 794 71 619 61 17 18 15<br />
British Virgin Islands 0.1 -1 100 -1 13 -1 0.2 92 13 0.2 82 0.1 81 0.1 83 9 10 7<br />
Cayman Islands 0.1 -2 97 -2 9 -2 0.3 -2 88 -2 12 -2 0.4 -2 61 -2 ... ... ... ... 9 -2 ... ...<br />
Chile 33 -1 97 -1 12 -1 70 -1 78 -1 23 -1 68 -1 63 -1 25 -1 78 -1 44 -1 54 -1 22 -1 22 -1 22 -1<br />
Colombia 49 96 27 181 78 28 187 50 122 52 65 47 27 30 22<br />
Costa Rica 8 94 14 29 80 18 27 59 18 58 8 62 16 16 15<br />
Cuba 30 +1 100 +1 13 +1 91 +1 78 +1 9 +1 88 +1 55 +1 40 +1 62 +1 48 +1 50 +1 9 +1 10 +1 8 +1<br />
Dominica 0.1 100 14 1 87 16 1 69 0.3 71 0.2 66 13 15 11<br />
Dominican Republic 10 94 24 52 76 26 32 66 12 80 20 58 28 30 27<br />
Ecuador 19 ** , -2 ... 18 ** , -2 120 * , -1 63 * , -1 17 * , -1 ... ... ... ... ... ... ... ... ...<br />
El Salvador 9 -1 68 -1 23 -1 31 -1 68 -1 31 -1 23 -1 68 -1 15 -1 68 -1 8 -1 68 -1 24 -1 25 -1 23 -1<br />
Grenada 0.2 100 14 1 79 16 1 62 ... ... ... ... 15 ... ...<br />
Guatemala 24 91 24 95 65 28 61 45 39 45 22 44 16 17 14<br />
Guyana 2 100 14 4 89 25 4 68 3 71 1 63 21 22 21<br />
Haiti ... ... ... ... ... ... ... ... ... ... ... ... ... ... ...<br />
Honduras 8 -2 94 -2 29 -2 38 -2 75 -2 33 -2 ... ... ... ... 18 -2 54 -2 ... ... 11 -2<br />
Jamaica 6 97 25 15 91 21 18 73 ... ... ... ... 15 ... ...<br />
Mexico 182 96 25 530 67 28 652 49 395 51 257 45 18 19 16<br />
Lower<br />
secondary<br />
Upper<br />
secondary<br />
119
TABLE<br />
7<br />
PRE-PRIMARY, PRIMARY AND SECONDARY EDUCATION / ISCED 0-3 /<br />
Teaching staff b / 2010<br />
Pre-primary education Primary education Secondary education<br />
REGION<br />
Country or territory<br />
Teaching staff<br />
Pupil-teacher ratio<br />
Teaching staff Pupilteacheteacher<br />
Teaching staff Pupil-<br />
Total Lower secondary Upper secondary<br />
ratio<br />
MF<br />
MF<br />
ratio MF<br />
MF<br />
MF<br />
Total<br />
(000) % F<br />
(000) % F<br />
(000) % F (000) % F (000) % F<br />
(1) (2) (3) (4) (5) (6) (7) (8) (9) (10) (11) (12) (13) (14) (15)<br />
Lower<br />
secondary<br />
Upper<br />
secondary<br />
120<br />
Montserrat 0.01 -1 100 -1 9 -1 0.04 -1 97 -1 13 -1 0.03 -1 74 -1 0.02 ** , -1 75 ** , -1 0.01 ** , -1 73 ** , -1 13 -1 15 ** , -1 11 ** , -1<br />
Netherlands Antilles a ... ... ... ... ... ... ... ... ... ... ... ... ... ... ...<br />
Nicaragua 10 96 21 31 77 30 15 55 ... ... ... ... 31 ... ...<br />
Panama 5 94 17 19 76 23 19 59 11 62 8 55 15 17 13<br />
Paraguay ... ... ... ... ... ... ... ... ... ... ... ... ... ... ...<br />
Peru 74 94 19 191 66 20 167 44 ... ... ... ... 16 ... ...<br />
Puerto Rico 7 83 13 26 81 12 26 78 9 79 17 78 11 18 8<br />
Saint Kitts and Nevis 0.1 100 20 0.4 87 14 0.5 61 0.3 60 0.2 61 9 9 9<br />
Saint Lucia 0.3 100 10 1 87 19 1 * 69 * 1 * 69 * ... ... 16 * 16 * ...<br />
Saint Vincent and the Grenadines 0.4 -1 100 -1 8 -1 1 78 16 1 64 0.4 64 0.3 65 17 18 15<br />
Suriname 1 -2 100 -2 21 -2 5 -1 93 -1 15 -1 4 -1 69 -1 2 -1 73 -1 1 -1 63 -1 13 -1 15 -1 11 -1<br />
Trinidad and Tobago ... ... ... 7 * 79 * 18 * 7 ** , -2 63 ** , -2 4 * , -2 ... 3 ** , -2 65 ** , -2 14 ** , -2 14 * , -2 14 ** , -2<br />
Turks and Caicos Islands ... ... ... ... ... ... ... ... ... ... ... ... ... ... ...<br />
Uruguay 5 -1 ... 25 -1 25 -1 ... 14 -1 23 -1 ... 16 -1 ... 7 -1 ... 12 -1 11 -1 15 -1<br />
Venezuela (Bolivarian Republic of) ... ... ... ... ... ... ... ... ... ... ... ... ... ... ...<br />
NORTH AMERICA AND WESTERN EUROPE<br />
Andorra 0.2 89 13 0.5 80 10 ... ... 0.4 63 ... ... ... 7 ...<br />
Austria 19 99 12 30 90 11 75 63 42 70 32 53 10 8 12<br />
Belgium 31 -1 98 -1 14 -1 66 -1 81 -1 11 -1 ... ... 42 -1 61 -1 ... ... ... 7 -1 ...<br />
Canada ... ... ... ... ... ... ... ... ... ... ... ... ... ... ...<br />
Cyprus 1 100 17 4 83 14 7 64 3 70 3 59 10 10 10<br />
Denmark ... ... ... ... ... ... ... ... ... ... ... ... ... ... ...<br />
Finland 14 97 11 25 79 14 43 -1 64 -1 20 -1 71 -1 24 -1 58 -1 10 -1 10 -1 10 -1<br />
France 125 83 20 234 83 18 463 59 230 65 234 54 13 14 11<br />
Germany 230 98 10 242 86 13 594 59 410 63 184 50 13 12 15<br />
Gibraltar ... ... ... 0.2 -1 78 -1 16 -1 0.3 -1 46 -1 0.1 -1 49 -1 0.1 -1 44 -1 6 -1 6 -1 6 -1<br />
Greece ... ... ... ... ... ... ... ... ... ... ... ... ... ... ...<br />
Holy See . . . . . . . . . . . . . . .<br />
Iceland 2 -1 96 -1 6 -1 ... ... ... ... ... ... ... 2 -1 54 -1 ... ... 12 -1<br />
Ireland ... ... ... 32 85 16 ... ... ... ... ... ... ... ... ...<br />
Israel ... ... ... 60 ** , -1 84 ** , -1 13 ** , -1 71 ** , -1 73 ** , -1 29 ** , -1 79 ** , -1 42 -1 68 -1 10 ** , -1 11 ** , -1 9 -1<br />
Italy ... ... ... ... ... ... ... ... ... ... ... ... ... ... ...<br />
Liechtenstein 0.1 99 8 0.3 77 6 0.4 50 0.3 50 0.04 43 6 6 8<br />
Luxembourg 1 -2 98 -2 12 -2 3 -2 72 -2 12 -2 4 -2 48 -2 ... ... ... ... 10 -2 ... ...<br />
Malta 1 100 14 2 85 14 4 60 3 64 1 43 9 8 15<br />
Monaco ... ... ... ... ... ... 1 -2 68 -2 ... ... ... ... 6 -2 ... ...<br />
Netherlands ... ... ... ... ... ... 107 49 ... ... ... ... 14 ... ...<br />
Norway ... ... ... ... ... ... ... ... ... ... ... ... ... ... ...<br />
Portugal 17 -1 97 -1 16 -1 66 -1 80 -1 11 -1 97 -1 69 -1 46 -1 71 -1 52 -1 68 -1 7 -1 8 -1 6 -1<br />
San Marino 0.1 98 7 0.2 93 6 0.2 78 ... ... ... ... 14 ... ...<br />
Spain 149 94 12 219 75 12 295 55 189 57 106 50 11 11 11<br />
Sweden ... ... ... 60 81 10 75 59 35 68 40 52 10 10 10<br />
Switzerland ... ... ... ... ... ... ... ... ... ... ... ... ... ... ...<br />
United Kingdom 60 -1 92 -1 19 -1 246 -1 81 -1 18 -1 375 * , -2 62 * , -2 152 -2 62 -2 223 * , -2 62 * , -2 14 * , -2 15 -2 14 * , -2<br />
United States of America 541 94 16 1,795 87 14 1,758 61 933 66 825 56 14 13 14<br />
SOUTH AND WEST ASIA<br />
Afghanistan ... ... ... 119 31 44 ... ... 34 31 ... ... ... 44 ...<br />
Bangladesh ... ... ... 395 49 43 * 400 20 205 20 195 19 28 31 26<br />
Bhutan 0.1 +1 100 +1 12 +1 4 +1 41 +1 25 +1 3 +1 38 +1 2 +1 41 +1 1 +1 33 +1 21 +1 22 +1 17 +1<br />
India ... ... ... ... ... ... 4,252 40 1,913 42 2,339 39 25 31 21<br />
Iran (Islamic Republic of) ... ... ... 278 -1 57 -1 20 -1 ... ... 173 -2 51 -2 ... ... ... 22 -2 ...<br />
Maldives 1 +1 98 +1 19 +1 4 +1 73 +1 12 +1 ... ... 3 +1 41 +1 ... ... ... 8 +1 ...<br />
Nepal 41 +1 90 +1 25 +1 167 +1 42 +1 30 +1 56 -2 15 -2 28 -2 19 -2 28 -2 11 -2 41 -2 52 -2 30 -2<br />
Pakistan ... ... ... 464 48 40 ... ... ... ... ... ... ... ... ...<br />
Sri Lanka ... ... ... 72 85 24 ... ... 77 66 ... ... ... 17 ...<br />
SUB-SAHARAN AFRICA<br />
Angola 18 ** 40 ** 37 ** 93 ** ... 46 ** 22 ** ... 15 ** ... 7 ** ... 39 ** 37 ** 43 **<br />
Benin 3 71 33 39 19 46 ... ... ... ... ... ... ... ... ...
OPPORTUNITIES LOST: THE IMPACT OF GRADE REPETITION AND EARLY SCHOOL LEAVING<br />
REGION<br />
Country or territory<br />
Pre-primary education Primary education Secondary education<br />
Teaching staff<br />
Pupil-teacher ratio<br />
Teaching staff Pupilteacheteacher<br />
Teaching staff Pupil-<br />
Total Lower secondary Upper secondary<br />
ratio<br />
MF<br />
MF<br />
ratio MF<br />
MF<br />
MF<br />
Total<br />
(000) % F<br />
(000) % F<br />
(000) % F (000) % F (000) % F<br />
(1) (2) (3) (4) (5) (6) (7) (8) (9) (10) (11) (12) (13) (14) (15)<br />
Botswana 2 -1 98 -1 13 -1 13 -1 76 -1 25 -1 ... ... ... ... ... ... ... ... ...<br />
Burkina Faso 2 +1 82 +1 23 +1 46 +1 37 +1 48 +1 23 +1 16 +1 ... ... ... ... 26 +1 ... ...<br />
Burundi 2 69 34 37 53 51 11 20 ... ... ... ... 30 ... ...<br />
Cameroon 15 97 22 77 48 46 ... ... ... ... ... ... ... ... ...<br />
Cape Verde 1 100 20 3 68 24 4 41 2 42 1 40 18 19 16<br />
Central African Republic 0.5 +1 88 +1 44 +1 8 +1 18 +1 81 +1 2 +1 12 +1 ... ... ... ... 67 +1 ... ...<br />
Chad 1 79 35 28 ... 62 13 6 7 6 6 6 32 43 20<br />
Comoros ... ... ... 4 -2 37 -2 30 -2 ... ... ... ... ... ... ... ... ...<br />
Congo 2 96 23 14 53 49 ... ... ... ... ... ... ... ... ...<br />
Côte d’Ivoire 4 +1 92 +1 19 +1 56 +1 27 +1 49 +1 ... ... ... ... ... ... ... ... ...<br />
Democratic Republic of the Congo 9 97 25 286 27 37 218 11 ... ... ... ... 16 ... ...<br />
Equatorial Guinea 2 -2 87 -2 24 -2 3 36 27 ... ... ... ... ... ... ... ... ...<br />
Eritrea 1 98 35 8 41 38 6 13 4 13 3 13 39 41 35<br />
Ethiopia 10 80 35 252 36 54 98 21 79 23 18 13 43 46 33<br />
Gabon ... ... ... 13 +1 53 +1 25 +1 ... ... ... ... ... ... ... ... ...<br />
Gambia ... ... ... 6 -1 33 -1 37 -1 ... ... 3 -1 21 -1 ... ... ... 27 -1 ...<br />
Ghana 38 ** , -1 85 -1 35 ** , -1 124 +1 37 +1 31 +1 115 +1 24 +1 83 +1 25 +1 32 +1 21 +1 19 +1 16 +1 25 +1<br />
Guinea 4 53 ** 34 34 29 42 18 ** , -1 6 ** , -1 11 -1 6 -1 6 ** , -1 5 ** , -1 32 ** , -1 36 -1 25 ** , -1<br />
Guinea-Bissau 0.3 69 29 5 22 52 ... ... ... ... ... ... ... ... ...<br />
Kenya 93 -1 83 -1 21 -1 153 ** , -1 44 ** , -1 47 ** , -1 108 ** , -1 41 ** , -1 51 ** , -1 44 ** , -1 57 -1 38 -1 30 ** , -1 33 ** , -1 27 -1<br />
Lesotho 2 ... 24 12 77 34 ... ... 5 ** 56 ** ... ... ... 18 ** ...<br />
Liberia ... ... ... 22 -2 12 -2 24 -2 ... ... ... ... ... ... ... ... ...<br />
Madagascar 7 97 23 106 56 40 44 -1 45 -1 33 -1 46 -1 11 -1 39 -1 23 ** , -1 25 -1 18 ** , -1<br />
Malawi ... ... ... 43 ** 40 ** 79 ** ... ... ... ... ... ... ... ... ...<br />
Mali 2 +1 94 +1 44 +1 44 +1 28 +1 48 +1 33 +1 ... 15 +1 ... 18 +1 9 +1 25 +1 38 +1 13 +1<br />
Mauritius 3 99 14 5 70 21 8 58 ... ... ... ... 16 ** ... ...<br />
Mozambique ... ... ... 95 +1 41 +1 55 +1 21 +1 19 +1 ... ... ... ... 34 +1 ... ...<br />
Namibia ... ... ... 14 -1 68 -1 30 -1 ... ... ... ... ... ... ... ... ...<br />
Niger 3 +1 91 +1 32 +1 49 +1 45 +1 39 +1 10 18 8 19 2 14 30 34 15<br />
Nigeria 60 ** , -2 65 -2 29 ** , -2 574 48 36 274 46 161 51 113 38 33 31 36<br />
Rwanda 3 +1 80 +1 38 +1 40 +1 52 +1 58 +1 21 +1 28 +1 ... ... ... ... 24 +1 ... ...<br />
Sao Tome and Principe 0.3 94 19 1 +1 56 +1 30 +1 1 +1 20 ** , +1 1 +1 20 +1 0.1 +1 20 ** , +1 20 +1 19 +1 21 +1<br />
Senegal 6 78 24 50 31 34 22 17 ... ... ... ... 32 ... ...<br />
Seychelles 0.2 100 13 1 83 13 1 60 ... ... ... ... 12 ... ...<br />
Sierra Leone 2 +1 82 +1 17 +1 38 +1 25 +1 31 +1 ... ... 13 +1 14 +1 ... ... ... 19 +1 ...<br />
Somalia ... ... ... ... ... ... ... ... ... ... ... ... ... ... ...<br />
South Africa ... ... ... 232 -1 77 -1 31 -1 187 -1 55 -1 ... ... ... ... 25 -1 ... ...<br />
Swaziland 2 95 11 7 71 32 5 48 ... ... ... ... 18 ... ...<br />
Togo 2 79 26 32 14 41 ... ... ... ... ... ... ... ... ...<br />
Uganda 20 83 25 172 41 49 71 ** , -1 23 ** , -1 ... ... ... ... 18 ** , -1 ... ...<br />
United Republic of Tanzania 16 54 57 166 50 51 ... ... ... ... ... ... ... ... ...<br />
Zambia ... ... ... 50 ** 51 ** 58 ** ... ... 14 ** , -2 50 ** , -2 ... ... ... 32 ** , -2 ...<br />
Zimbabwe ... ... ... ... ... ... ... ... ... ... ... ... ... ... ...<br />
Lower<br />
secondary<br />
Upper<br />
secondary<br />
REGIONAL AVERAGES<br />
WORLD 7,804 ** 94 ** 21 ** 28,532 62 24 32,003 52 17,535 54 14,468 49 17 18 16<br />
Arab States 193 ** 90 ** 20 ** 1,954 57 21 1,992 ** 46 ** 1,149 ** 50 ** 844 ** 41 ** 15 ** 17 ** 12 **<br />
Central and Eastern Europe 1,086 ** 97 ** 10 ** 1,113 ** 82 ** 17 ** 2,643 ** 72 ** ... ... ... ... 11 ** ... ...<br />
Central Asia 152 ** 97 ** 11 ** 323 90 17 920 71 ... ... ... ... 11 ... ...<br />
East Asia and the Pacific 2,106 96 21 10,399 62 18 10,484 50 5,928 52 4,556 47 16 16 15<br />
Latin America and the Caribbean 1,035 96 20 3,046 78 22 3,661 59 2,076 64 1,585 53 16 18 15<br />
North America and Western Europe 1,545 94 14 3,742 83 14 5,205 61 2,747 65 2,458 57 12 12 12<br />
South and West Asia ... ... ... 4,853 ** 46 ** 39 ** 5,376 39 2,454 41 2,923 38 27 32 22<br />
Sub-Saharan Africa 444 ** 76 ** 27 ** 3,103 43 43 1,722 ** 30 ** 1,076 ** 30 ** 646 ** 32 ** 25 ** 26 ** 24 **<br />
121
TABLE<br />
8<br />
TERTIARY EDUCATION / ISCED 5 and 6 / Enrolment, graduation and teaching staff / 2010<br />
REGION<br />
Enrolment<br />
Gross enrolment ratio<br />
Distribution of students by ISCED<br />
level (%)<br />
Country or territory<br />
ARAB STATES<br />
MF (000) % F % private MF M F GPI 5A 5B 6<br />
(1) (2) (3) (4) (5) (6) (7) (8) (9) (10)<br />
Algeria 1,144 58 . 31 25 37 1.46 89 5 5<br />
Bahrain 36 46 … … … … … … … …<br />
Djibouti 5 +1 40 +1 . +1 5 +1 6 +1 4 +1 0.67 +1 … … . +1<br />
Egypt 2,646 47 19 32 34 31 0.91 99 — 1<br />
Iraq … … … … … … … … … …<br />
Jordan 247 52 … 38 35 41 1.16 87 12 1<br />
Kuwait … … … … … … … … … …<br />
Lebanon 202 54 58 54 49 59 1.19 89 11 1<br />
Libya … … … … … … … … … …<br />
Mauritania 15 28 . 4 6 3 0.41 97 3 .<br />
Morocco 419 -1 47 -1 12 -1 13 -1 14 -1 12 -1 0.87 -1 71 -1 21 -1 8 -1<br />
Oman 78 50 45 24 21 29 1.39 80 20 —<br />
Palestine 197 56 … 50 43 58 1.34 85 15 —<br />
Qatar 14 63 38 10 5 26 5.38 79 21 .<br />
Saudi Arabia 904 52 4 37 35 39 1.12 86 14 —<br />
Sudan (pre-secession) a … … … … … … … … … …<br />
Syrian Arab Republic … … … … … … … … … …<br />
Tunisia 360 -1 60 -1 2 -1 34 -1 28 -1 41 -1 1.51 -1 … … …<br />
United Arab Emirates 87 -1 60 -1 60 -1 … … … … 91 -1 9 -1 — -1<br />
Yemen … … … … … … … … … …<br />
CENTRAL AND EASTERN EUROPE<br />
Albania … … … … … … … … … …<br />
Belarus 606 58 13 83 69 98 1.43 72 27 1<br />
Bosnia and Herzegovina 105 56 17 37 32 42 1.31 … … …<br />
Bulgaria 287 56 22 57 49 65 1.31 89 10 1<br />
Croatia 150 56 7 54 46 62 1.34 66 31 2<br />
Czech Republic 417 -1 56 -1 14 -1 61 -1 51 -1 71 -1 1.38 -1 86 -1 8 -1 6 -1<br />
Estonia 68 -1 62 -1 84 -1 63 -1 47 -1 79 -1 1.70 -1 63 -1 34 -1 4 -1<br />
Hungary 398 -1 57 -1 16 -1 62 -1 52 -1 71 -1 1.37 -1 90 -1 8 -1 2 -1<br />
Latvia 113 63 94 60 44 77 1.75 82 17 2<br />
Lithuania 201 59 12 74 59 90 1.52 70 28 1<br />
Montenegro 24 54 … 48 43 53 1.24 … … …<br />
Poland 2,150 -1 58 -1 33 -1 71 -1 58 -1 83 -1 1.43 -1 97 -1 1 -1 2 -1<br />
Republic of Moldova 130 56 16 38 * 33 * 44 * 1.34 * 85 13 1<br />
Romania 1,000 56 37 59 50 68 1.35 97 — 3<br />
Russian Federation 9,330 -1 57 -1 15 -1 76 -1 65 -1 87 -1 1.35 -1 81 -1 18 -1 2 -1<br />
Serbia 227 55 17 49 * 43 * 56 * 1.30 * 79 19 2<br />
Slovakia 235 60 16 55 43 67 1.55 94 1 5<br />
Slovenia 114 -1 58 -1 12 -1 87 -1 71 -1 103 -1 1.45 -1 67 -1 32 -1 2 -1<br />
The former Yugoslav Republic of Macedonia 62 53 21 39 36 42 1.18 96 4 —<br />
Turkey 2,924 -1 44 -1 6 -1 46 -1 51 -1 40 -1 0.79 -1 69 -1 30 -1 1 -1<br />
Ukraine 2,635 54 14 79 71 89 1.25 85 13 1<br />
CENTRAL ASIA<br />
Armenia 155 56 … 52 45 58 1.28 80 19 1<br />
Azerbaijan 181 49 13 19 * 19 * 19 * 0.98 * 80 19 1<br />
Georgia 106 55 27 28 25 31 1.25 91 6 3<br />
Kazakhstan 638 +1 58 +1 50 +1 41 +1 33 +1 48 +1 1.44 +1 100 +1 . +1 — +1<br />
Kyrgyzstan 294 -1 56 -1 10 -1 49 -1 42 -1 55 -1 1.30 -1 83 -1 17 -1 1 -1<br />
Mongolia 166 60 39 53 42 65 1.53 96 3 1<br />
Tajikistan 159 29 … 20 28 11 0.41 99 . 1<br />
Turkmenistan … … … … … … … … … …<br />
Uzbekistan 277 +1 39 +1 . +1 9 +1 11 +1 7 +1 0.65 +1 99 +1 . +1 1 +1<br />
EAST ASIA AND THE PACIFIC<br />
Australia 1,276 56 8 80 68 92 1.35 79 18 4<br />
Brunei Darussalam 6 63 1 17 12 22 1.79 66 33 1<br />
Cambodia 123 -2 34 -2 … 8 -2 10 -2 5 -2 0.53 -2 … … …<br />
China 31,047 50 … 26 25 27 1.10 … … …<br />
122
OPPORTUNITIES LOST: THE IMPACT OF GRADE REPETITION AND EARLY SCHOOL LEAVING<br />
Female students by ISCED level (%) Gross graduation ratio, ISCED 5A, first degree Teaching staff<br />
5A 5B 6 MF M F GPI MF (000) % F<br />
(11) (12) (13) (14) (15) (16) (17) (18) (19)<br />
ARAB STATES<br />
59 49 48 19 14 24 1.76 40 38<br />
… … … … … … … 2 33<br />
… … . +1 2 -1 … … … 0.2 +1 …<br />
47 91 39 … … … … … …<br />
… … … … … … … … …<br />
51 59 33 37 -1 33 -1 42 -1 1.25 -1 10 25<br />
… … … … … … … … …<br />
53 58 38 33 29 37 1.25 25 41<br />
… … … … … … … … …<br />
29 11 . … … … … 0.4 7<br />
47 -1 50 -1 37 -1 5 5 5 0.95 20 -1 17 -1<br />
48 59 54 15 10 22 2.17 5 37<br />
58 46 — 31 23 38 1.64 6 18<br />
72 29 . 3 1 11 10.35 2 38<br />
57 24 27 17 13 22 1.76 50 37<br />
… … … … … … … … …<br />
… … … … … … … … …<br />
… … … … … … … 20 -1 42 ** , -1<br />
61 -1 51 -1 100 -1 … … … … 5 -1 31 -1<br />
… … … … … … … … …<br />
CENTRAL AND EASTERN EUROPE<br />
… … … … … … … … …<br />
59 54 58 40 -2 … … … 43 57<br />
… … … … … … … 8 38<br />
55 57 50 28 23 34 1.50 21 49<br />
59 51 53 40 30 51 1.70 16 44<br />
56 -1 71 -1 41 -1 40 -1 31 -1 50 -1 1.62 -1 … …<br />
62 -1 62 -1 57 -1 23 -1 14 -1 32 -1 2.38 -1 … …<br />
56 -1 67 -1 49 -1 40 -1 28 -1 53 -1 1.91 -1 24 -1 38 -1<br />
63 63 59 39 22 57 2.59 7 58<br />
60 58 58 40 28 53 1.86 14 55<br />
… … … … … … … … …<br />
58 -1 81 -1 52 -1 53 -1 39 -1 69 -1 1.77 -1 101 -1 43 -1<br />
56 58 58 … … … … 8 57<br />
57 82 48 54 40 68 1.71 31 46<br />
58 -1 52 -1 45 -1 51 -2 … … … 670 -1 56 -1<br />
57 49 53 19 * 14 * 25 * 1.71 * 15 46<br />
60 67 47 48 33 63 1.91 13 44<br />
62 -1 50 -1 51 -1 30 -1 19 -1 42 -1 2.23 -1 6 -1 37 -1<br />
52 76 57 30 26 34 1.32 3 48<br />
44 -1 43 -1 45 -1 21 -1 22 -1 19 -1 0.85 -1 101 -1 41 -1<br />
55 53 59 … … … … 201 …<br />
CENTRAL ASIA<br />
54 63 39 38 31 44 1.41 16 56<br />
45 68 46 17 * 19 * 15 * 0.81 * 26 52<br />
56 42 60 41 -1 37 -1 46 -1 1.25 -1 13 52<br />
58 +1 . +1 57 +1 59 -1 50 -1 68 -1 1.37 -1 40 +1 63 +1<br />
56 -1 59 -1 62 -1 30 25 * 34 * 1.38 * 17 -1 59 -1<br />
60 84 61 44 32 57 1.76 9 57<br />
29 . 36 … … … … 10 34<br />
… … … … … … … … …<br />
39 +1 . +1 42 +1 12 +1 13 +1 10 +1 0.83 +1 23 +1 38 +1<br />
EAST ASIA AND THE PACIFIC<br />
56 56 50 57 -2 45 -2 68 -2 1.51 -2 … …<br />
67 57 31 10 7 14 2.12 1 45<br />
… … … … … … … … …<br />
49 51 45 13 -1 13 -1 13 -1 0.97 -1 1,557 45<br />
123
TABLE<br />
8<br />
TERTIARY EDUCATION / ISCED 5 and 6 / Enrolment, graduation and teaching staff / 2010<br />
REGION<br />
Enrolment<br />
Gross enrolment ratio<br />
Distribution of students by ISCED<br />
level (%)<br />
Country or territory<br />
MF (000) % F % private MF M F GPI 5A 5B 6<br />
(1) (2) (3) (4) (5) (6) (7) (8) (9) (10)<br />
China, Hong Kong SAR 265 51 * 16 60 58 * 61 * 1.04 * 63 34 3<br />
China, Macao SAR 29 51 64 65 65 64 0.99 88 10 2<br />
Cook Islands . +1 . +1 . +1 . * , +1 . * , +1 . * , +1 . * , +1 . +1 . +1 . +1<br />
Democratic People’s Rep. of Korea … … … … … … … … … …<br />
Fiji … … … … … … … … … …<br />
Indonesia 5,001 47 58 23 24 22 0.89 76 22 2<br />
Japan 3,836 46 79 60 63 56 0.89 78 20 2<br />
Kiribati . -1 . -1 . -1 . -1 . -1 . -1 . -1 . -1 . -1 . -1<br />
Lao People’s Democratic Republic 118 43 12 17 19 14 0.77 37 63 .<br />
Malaysia 1,001 -1 56 -1 41 -1 40 -1 35 -1 45 -1 1.29 -1 55 -1 44 -1 2 -1<br />
Marshall Islands … … … … … … … … … …<br />
Micronesia (Federated States of) … … … … … … … … … …<br />
Myanmar … … … … … … … … … …<br />
Nauru … … … … … … … … … …<br />
New Zealand 266 58 12 83 67 99 1.46 72 25 3<br />
Niue . -1 . -1 . -1 . * , -1 . * , -1 . * , -1 . * , -1 . -1 . -1 . -1<br />
Palau … … … … … … … … … …<br />
Papua New Guinea … … … … … … … … … …<br />
Philippines 2,651 -2 54 -2 66 -2 29 -2 26 -2 32 -2 1.25 -2 90 -2 10 -2 — -2<br />
Republic of Korea 3,270 39 81 103 119 86 0.72 75 23 2<br />
Samoa … … … … … … … … … …<br />
Singapore 213 50 62 … … … … 54 43 3<br />
Solomon Islands . -1 . -1 . -1 . -1 . -1 . -1 . -1 . -1 . -1 . -1<br />
Thailand 2,497 +1 56 +1 18 +1 48 +1 41 +1 54 +1 1.31 +1 84 +1 15 +1 1 +1<br />
Timor-Leste 17 -1 40 -1 43 -1 17 -1 19 -1 14 -1 0.70 -1 100 -1 . -1 . -1<br />
Tokelau . -1 . -1 . -1 . * , -1 . * , -1 . * , -1 . * , -1 . -1 . -1 . -1<br />
Tonga … … … … … … … … … …<br />
Tuvalu . -1 . -1 . -1 . * , -1 . * , -1 . * , -1 . * , -1 . -1 . -1 . -1<br />
Vanuatu … … … … … … … … … …<br />
Viet Nam 2,020 49 … 22 22 22 1.00 62 35 3<br />
LATIN AMERICA AND THE CARIBBEAN<br />
Anguilla 0.1 -2 83 -2 81 -2 5 ** , -2 2 ** , -2 8 ** , -2 5.01 ** , -2 81 -2 19 -2 . -2<br />
Antigua and Barbuda 1 74 66 16 9 23 2.58 8 92 —<br />
Argentina 2,387 -1 60 -1 27 -1 71 -1 57 -1 86 -1 1.51 -1 67 -1 32 -1 1 -1<br />
Aruba 2 57 19 31 27 35 1.30 26 74 .<br />
Bahamas … … … … … … … … … …<br />
Barbados 13 69 . 66 40 95 2.38 60 39 1<br />
Belize 7 62 90 21 17 26 1.57 57 43 .<br />
Bermuda 1 67 100 20 13 27 2.12 . 100 .<br />
Bolivia (Plurinational State of) … … … … … … … … … …<br />
Brazil 6,553 57 73 … … … … 87 12 1<br />
British Virgin Islands 1 -1 65 -1 . -1 64 ** , -1 48 ** , -1 79 ** , -1 1.64 ** , -1 92 -1 8 -1 . -1<br />
Cayman Islands 1 -2 69 -2 … 31 -2 19 -2 42 -2 2.24 -2 11 -2 89 -2 . -2<br />
Chile 876 -1 51 -1 80 -1 59 -1 57 -1 61 -1 1.06 -1 56 -1 43 -1 — -1<br />
Colombia 1,674 52 45 39 37 41 1.09 67 32 —<br />
Costa Rica … … … … … … … … … …<br />
Cuba 801 61 . 95 72 119 1.65 99 . 1<br />
Dominica 0.2 -2 76 -2 … 4 -2 2 -2 6 -2 3.35 -2 … … . -2<br />
Dominican Republic … … … … … … … … … …<br />
Ecuador 535 -2 53 -2 35 -2 40 -2 37 -2 43 -2 1.15 -2 … … …<br />
El Salvador 150 54 67 23 22 25 1.16 84 16 —<br />
Grenada 7 -1 57 -1 100 -1 53 -1 45 -1 61 -1 1.36 -1 75 -1 25 -1 — -1<br />
Guatemala … … … … … … … … … …<br />
Guyana 8 71 . 12 7 17 2.52 27 73 .<br />
Haiti … … … … … … … … … …<br />
Honduras 148 * , -2 60 * , -2 33 * , -2 19 * , -2 15 * , -2 23 * , -2 1.51 * , -2 … … …<br />
Jamaica 71 69 96 29 18 41 2.28 96 4 —<br />
Mexico 2,847 50 32 28 28 28 0.97 96 4 1<br />
124
OPPORTUNITIES LOST: THE IMPACT OF GRADE REPETITION AND EARLY SCHOOL LEAVING<br />
Female students by ISCED level (%) Gross graduation ratio, ISCED 5A, first degree Teaching staff<br />
5A 5B 6 MF M F GPI MF (000) % F<br />
(11) (12) (13) (14) (15) (16) (17) (18) (19)<br />
53 * 47 * 43 * … … … … … …<br />
50 62 28 43 36 50 1.39 2 32<br />
. +1 . +1 . +1 . -1 . -1 . -1 . -1 . +1 . +1<br />
… … … … … … … … …<br />
… … … … … … … 1 -2 36 -2<br />
45 51 35 13 … … … 271 41<br />
42 62 32 43 47 38 0.82 528 …<br />
. -1 . -1 . -1 . -1 . -1 . -1 . -1 . -1 . -1<br />
34 48 . 5 6 3 0.56 6 34<br />
57 -1 55 -1 39 -1 22 -1 16 -1 27 -1 1.69 -1 67 -1 50 -1<br />
… … … … … … … … …<br />
… … … … … … … … …<br />
… … … … … … … … …<br />
… … … … … … … … …<br />
59 56 51 49 -1 38 -1 62 -1 1.64 -1 17 51<br />
. -1 . -1 . -1 . -1 . -1 . -1 . -1 . -1 . -1<br />
… … … … … … … … …<br />
… … … … … … … … …<br />
55 -2 53 -2 61 -2 … … … … … …<br />
39 40 38 52 -1 54 -1 51 -1 0.95 -1 223 34<br />
… … … … … … … … …<br />
50 49 38 … … … … 15 35<br />
. -1 . -1 . -1 . -1 . -1 . -1 . -1 . -1 . -1<br />
58 +1 46 +1 50 +1 29 ** , -2 23 ** , -2 35 ** , -2 1.52 ** , -2 122 +1 69 +1<br />
40 -1 . -1 . -1 … … … … 1 -1 25 -1<br />
. -1 . -1 . -1 . -1 . -1 . -1 . -1 . -1 . -1<br />
… … … … … … … … …<br />
. -1 . -1 . -1 . -1 . -1 . -1 . -1 . -1 . -1<br />
… … … … … … … … …<br />
58 34 42 10 10 11 1.11 70 47<br />
LATIN AMERICA AND THE CARIBBEAN<br />
82 -2 90 -2 . -2 … … … … 0.01 -2 43 -2<br />
77 73 . 2 1 3 4.81 0.2 62<br />
56 -1 66 -1 54 -1 12 -1 9 -1 15 -1 1.57 -1 142 -1 49 -1<br />
72 52 . 4 2 7 3.52 0.2 54<br />
… … … … … … … … …<br />
68 70 57 26 12 42 3.34 … …<br />
65 57 . … … … … … …<br />
. 67 . . . . . 0.1 58<br />
… … … … … … … … …<br />
58 46 51 … … … … 345 45<br />
69 -1 15 -1 . -1 32 * , -1 18 * , -1 43 * , -1 2.39 * , -1 0.1 -1 44 -1<br />
73 -2 68 -2 . -2 2 -2 1 -2 3 -2 2.24 -2 0.03 -2 59 -2<br />
54 -1 47 -1 43 -1 19 -1 16 -1 23 -1 1.46 -1 63 -1 40 -1<br />
53 48 38 … … … … 110 * , -1 66 * , -1<br />
… … … … … … … … …<br />
61 . 47 45 35 55 1.57 153 60<br />
… … . -2 … … … … … …<br />
… … … … … … … … …<br />
… … … … … … … 27 -2 31 -2<br />
54 53 45 9 7 11 1.47 9 35<br />
53 -1 71 -1 25 -1 … … … … … …<br />
… … … … … … … … …<br />
68 72 . 3 2 4 2.09 1 55<br />
… … … … … … … … …<br />
… … … … … … … 5 * , -2 …<br />
69 69 . … … … … … …<br />
50 42 45 19 ** , -1 17 ** , -1 20 ** , -1 1.18 ** , -1 310 …<br />
125
TABLE<br />
8<br />
TERTIARY EDUCATION / ISCED 5 and 6 / Enrolment, graduation and teaching staff / 2010<br />
REGION<br />
Enrolment<br />
Gross enrolment ratio<br />
Distribution of students by ISCED<br />
level (%)<br />
Country or territory<br />
MF (000) % F % private MF M F GPI 5A 5B 6<br />
(1) (2) (3) (4) (5) (6) (7) (8) (9) (10)<br />
Montserrat 0.1 85 100 … … … … 75 25 .<br />
Netherlands Antilles a … … … … … … … … … …<br />
Nicaragua … … … … … … … … … …<br />
Panama 135 -1 60 -1 34 -1 45 -1 35 -1 54 -1 1.53 -1 93 -1 7 -1 — -1<br />
Paraguay 236 -1 58 -1 67 -1 37 -1 30 -1 43 -1 1.43 -1 95 -1 5 -1 …<br />
Peru 1,207 52 … 43 41 45 1.09 69 30 —<br />
Puerto Rico 249 59 71 86 70 103 1.48 … … …<br />
Saint Kitts and Nevis 1 -2 67 -2 … 18 -2 12 -2 25 -2 2.10 -2 19 -2 81 -2 . -2<br />
Saint Lucia 2 72 17 11 6 16 2.57 83 17 .<br />
Saint Vincent and the Grenadines … … … … … … … … … …<br />
Suriname … … … … … … … … … …<br />
Trinidad and Tobago … … … … … … … … … …<br />
Turks and Caicos Islands 0.0 -2 50 -2 … — ** , -2 — ** , -2 — ** , -2 0.90 ** , -2 100 -2 — -2 . -2<br />
Uruguay 161 -1 63 -1 13 -1 63 -1 46 -1 81 -1 1.74 -1 89 -1 11 -1 — -1<br />
Venezuela (Bolivarian Republic of) 2,123 -1 … 29 -1 78 -1 … … … … 24 -1 …<br />
NORTH AMERICA AND WESTERN EUROPE<br />
Andorra 0.5 -2 58 -2 … 11 -2 9 -2 13 -2 1.43 -2 33 -2 67 -2 . -2<br />
Austria 308 -1 53 -1 17 -1 60 -1 55 -1 65 -1 1.18 -1 84 -1 10 -1 6 -1<br />
Belgium 425 -1 55 -1 57 -1 67 -1 60 -1 75 -1 1.25 -1 48 -1 49 -1 3 -1<br />
Canada … … … … … … … … … …<br />
Cyprus 32 46 70 55 * 59 * 51 * 0.86 * 60 38 2<br />
Denmark 235 -1 58 -1 2 -1 74 -1 61 -1 88 -1 1.45 -1 85 -1 12 -1 3 -1<br />
Finland 304 54 19 94 85 103 1.22 93 — 7<br />
France 2,173 -1 55 -1 19 -1 55 -1 48 -1 61 -1 1.28 -1 71 -1 25 -1 3 -1<br />
Germany … … … … … … … … … …<br />
Gibraltar . . . . . . . . . .<br />
Greece … … … … … … … … … …<br />
Holy See … … … … … … … … … …<br />
Iceland 17 -1 64 -1 21 -1 74 -1 52 -1 97 -1 1.87 -1 96 -1 2 -1 2 -1<br />
Ireland 183 -1 54 -1 3 -1 61 -1 55 -1 67 -1 1.22 -1 69 -1 27 -1 4 -1<br />
Israel 343 -1 56 -1 86 -1 62 -1 55 -1 71 -1 1.30 -1 79 -1 18 -1 3 -1<br />
Italy 2,012 -1 58 -1 8 -1 66 -1 55 -1 77 -1 1.41 -1 98 -1 — -1 2 -1<br />
Liechtenstein 1 37 100 36 * 44 * 27 * 0.62 * 92 . 8<br />
Luxembourg 3 -2 48 -2 … 11 -2 11 -2 10 -2 0.97 -2 94 -2 — -2 6 -2<br />
Malta 11 56 . 35 30 41 1.36 88 11 1<br />
Monaco . . . . . . . . . .<br />
Netherlands 619 -1 52 -1 … 63 -1 59 -1 66 -1 1.12 -1 99 -1 — -1 1 -1<br />
Norway 225 61 … 74 57 93 1.63 96 — 3<br />
Portugal 373 -1 53 -1 24 -1 62 -1 57 -1 68 -1 1.19 -1 96 -1 — -1 4 -1<br />
San Marino 1 58 … … … … … 29 71 .<br />
Spain 1,801 -1 54 -1 12 -1 73 -1 66 -1 81 -1 1.24 -1 82 -1 14 -1 4 -1<br />
Sweden 455 59 9 74 58 90 1.54 89 6 4<br />
Switzerland 249 49 17 55 55 55 0.99 71 21 8<br />
United Kingdom 2,415 -1 57 -1 100 -1 59 -1 49 -1 69 -1 1.40 -1 75 -1 22 -1 3 -1<br />
United States of America 20,428 57 27 95 79 111 1.41 76 22 2<br />
SOUTH AND WEST ASIA<br />
Afghanistan 95 -1 18 -1 20 -1 3 -1 5 -1 1 -1 0.24 -1 … … …<br />
Bangladesh 1,582 -1 37 -1 43 -1 11 -1 13 -1 8 -1 0.61 -1 92 -1 8 -1 — -1<br />
Bhutan 7 +1 40 +1 … 9 +1 10 +1 7 +1 0.68 +1 79 +1 21 +1 . +1<br />
India 20,741 40 … 18 21 15 0.73 93 7 —<br />
Iran (Islamic Republic of) 3,791 49 … 43 43 43 1.01 72 27 1<br />
Maldives 5 -2 51 -2 … 13 -2 12 -2 13 -2 1.08 -2 … … …<br />
Nepal 377 41 59 … … … … 100 . —<br />
Pakistan 974 * , -2 45 * , -2 33 * , -2 5 * , -2 6 * , -2 5 * , -2 0.83 * , -2 94 * , -2 5 * , -2 1 * , -2<br />
Sri Lanka 253 65 … 15 11 20 1.92 97 2 1<br />
SUB-SAHARAN AFRICA<br />
Angola 66 45 37 4 4 3 0.82 98 1 —<br />
Benin 82 -1 28 -1 25 -1 11 -1 15 -1 6 -1 0.38 -1 … … …<br />
126
OPPORTUNITIES LOST: THE IMPACT OF GRADE REPETITION AND EARLY SCHOOL LEAVING<br />
Female students by ISCED level (%) Gross graduation ratio, ISCED 5A, first degree Teaching staff<br />
5A 5B 6 MF M F GPI MF (000) % F<br />
(11) (12) (13) (14) (15) (16) (17) (18) (19)<br />
83 93 . … … … … … …<br />
… … … … … … … … …<br />
… … … … … … … … …<br />
60 -1 57 -1 53 -1 23 -1 15 -1 31 -1 2.09 -1 14 -1 47 -1<br />
58 -1 64 -1 … … … … … … …<br />
49 57 40 … … … … … …<br />
… … … 46 -2 34 -2 57 -2 1.67 -2 16 …<br />
84 -2 63 -2 . -2 … … … … … …<br />
76 53 . … … … … 0.2 51<br />
… … … … … … … … …<br />
… … … … … … … … …<br />
… … … … … … … … …<br />
50 -2 . -2 . -2 … … … … … …<br />
63 -1 59 -1 48 -1 … … … … 15 -1 50 -1<br />
… 54 -1 … 18 -1 12 -1 25 -1 2.09 -1 165 * , -1 …<br />
NORTH AMERICA AND WESTERN EUROPE<br />
62 -2 55 -2 . -2 1 -2 1 -2 1 -2 0.79 -2 0.1 -1 61 -1<br />
54 -1 53 -1 45 -1 30 -1 25 -1 35 -1 1.37 -1 35 -1 33 -1<br />
52 -1 58 -1 44 -1 20 -1 17 -1 22 -1 1.28 -1 27 -1 43 -1<br />
… … … … … … … … …<br />
56 31 51 11 7 15 2.11 3 39<br />
60 -1 49 -1 47 -1 47 -1 34 -1 60 -1 1.76 -1 … …<br />
54 17 53 48 34 62 1.83 15 51<br />
55 -1 56 -1 47 -1 36 -2 31 -2 40 -2 1.27 -2 … …<br />
… … … 36 31 41 1.32 368 39<br />
. . . . . . . . .<br />
… … … … … … … … …<br />
… … … … … … … …<br />
65 -1 42 -1 59 -1 53 -1 32 -1 74 -1 2.28 -1 2 -1 49 -1<br />
57 -1 46 -1 48 -1 44 -1 35 -1 54 -1 1.54 -1 13 -1 38 -1<br />
56 -1 55 -1 53 -1 37 -1 31 -1 43 -1 1.37 -1 … …<br />
58 -1 53 -1 53 -1 36 -1 30 -1 43 -1 1.44 -1 110 -1 36 -1<br />
38 . 33 22 * 21 * 23 * 1.11 * … …<br />
49 -2 . -2 39 -2 6 -2 6 -2 6 -2 1.03 -2 … …<br />
58 42 30 … … … … 1 30<br />
. . . . -2 . -2 . -2 . -2 . .<br />
52 -1 58 -1 44 -1 46 -1 39 -1 53 -1 1.35 -1 50 -1 39 -1<br />
61 66 50 48 35 62 1.79 … …<br />
53 -1 71 -1 55 -1 47 -1 38 -1 56 -1 1.49 -1 35 -1 43 -1<br />
57 58 . … … … … … …<br />
55 -1 52 -1 52 -1 39 -1 30 -1 49 -1 1.60 -1 152 -1 39 -1<br />
60 51 50 33 22 45 2.05 29 43<br />
51 46 43 32 29 34 1.20 40 36<br />
55 -1 65 -1 47 -1 40 -1 33 -1 46 -1 1.38 -1 138 -1 43 -1<br />
56 60 50 38 32 45 1.42 1,439 47<br />
SOUTH AND WEST ASIA<br />
… … … … … … … 3 -1 16 -1<br />
38 -1 27 -1 25 -1 5 -1 … … … 59 -1 20 -1<br />
42 +1 31 +1 . +1 … … … … 1 +1 24 +1<br />
41 22 41 … … … … … …<br />
54 38 35 17 16 18 1.17 174 22<br />
… … … … … … … … …<br />
41 . 16 … … … … … …<br />
45 * , -2 45 * , -2 27 * , -2 … … … … 53 * , -2 37 * , -2<br />
65 60 39 … … … … … …<br />
SUB-SAHARAN AFRICA<br />
46 34 42 1 2 1 0.42 2 29<br />
… … … … … … … 4 -1 8 -1<br />
127
TABLE<br />
8<br />
TERTIARY EDUCATION / ISCED 5 and 6 / Enrolment, graduation and teaching staff / 2010<br />
REGION<br />
Enrolment<br />
Gross enrolment ratio<br />
Distribution of students by ISCED<br />
level (%)<br />
Country or territory<br />
MF (000) % F % private MF M F GPI 5A 5B 6<br />
(1) (2) (3) (4) (5) (6) (7) (8) (9) (10)<br />
Botswana … … … … … … … … … …<br />
Burkina Faso 61 +1 33 +1 22 +1 4 +1 5 +1 3 +1 0.50 +1 72 +1 24 +1 4 +1<br />
Burundi 29 35 58 3 4 2 0.54 … … …<br />
Cameroon 220 45 14 11 13 10 0.81 80 19 1<br />
Cape Verde 10 55 60 18 16 20 1.29 96 . 4<br />
Central African Republic 11 25 … 3 4 1 0.32 81 19 .<br />
Chad 22 ** 15 ** 32 ** 2 ** 4 ** 1 ** 0.17 ** … … …<br />
Comoros 5 42 23 8 9 7 0.74 59 41 .<br />
Congo 20 … … 6 … … … … … …<br />
Côte d’Ivoire … … … … … … … … … …<br />
Democratic Republic of the Congo 378 -1 24 -1 … 6 -1 9 -1 3 -1 0.31 -1 … … …<br />
Equatorial Guinea … … … … … … … … … …<br />
Eritrea 10 25 . 2 3 1 0.33 … … .<br />
Ethiopia 435 27 18 5 8 3 0.36 100 — —<br />
Gabon … … … … … … … … … …<br />
Gambia 6 -2 … — -2 4 -2 … … … 30 -2 70 -2 . -2<br />
Ghana 286 +1 37 +1 11 +1 12 +1 15 +1 9 +1 0.62 +1 66 +1 34 +1 — +1<br />
Guinea 80 -2 24 -2 10 -2 9 -2 14 -2 5 -2 0.33 -2 92 -2 8 -2 . -2<br />
Guinea-Bissau … … … … … … … … … …<br />
Kenya 168 -1 41 -1 13 -1 4 -1 5 -1 3 -1 0.70 -1 69 -1 27 -1 4 -1<br />
Lesotho … … … … … … … … … …<br />
Liberia … … … … … … … … … …<br />
Madagascar 74 48 23 4 4 4 0.91 63 34 2<br />
Malawi 10 38 6 1 1 1 0.62 … … 1<br />
Mali 88 +1 31 +1 … 6 +1 8 +1 4 +1 0.46 +1 88 +1 12 +1 — +1<br />
Mauritius 26 ** , -2 55 ** , -2 38 ** , -2 25 ** , -2 22 ** , -2 28 ** , -2 1.24 ** , -2 73 ** , -2 26 ** , -2 2 ** , -2<br />
Mozambique … … … … … … … … … …<br />
Namibia 20 -2 57 -2 88 -2 9 -2 8 -2 10 -2 1.32 -2 64 -2 35 -2 2 -2<br />
Niger 18 +1 30 +1 25 +1 2 +1 2 +1 1 +1 0.38 +1 80 +1 18 +1 2 +1<br />
Nigeria … … … … … … … … … …<br />
Rwanda 63 44 50 5 6 5 0.77 96 4 .<br />
Sao Tome and Principe 1 49 … 4 5 4 0.98 … … …<br />
Senegal 92 * 37 ** 33 * 8 * 10 ** 6 ** 0.60 ** … … …<br />
Seychelles . -2 . -2 . -2 . -2 . -2 . -2 . -2 . -2 . -2 . -2<br />
Sierra Leone … … … … … … … … … …<br />
Somalia … … … … … … … … … …<br />
South Africa … … … … … … … … … …<br />
Swaziland … … … … … … … … … …<br />
Togo … … … … … … … … … …<br />
Uganda 124 -1 44 -1 40 -1 4 -1 5 -1 4 -1 0.79 -1 … … …<br />
United Republic of Tanzania 85 45 … 2 2 2 0.82 100 … —<br />
Zambia … … … … … … … … … …<br />
Zimbabwe 95 45 13 6 7 5 0.80 … … …<br />
REGIONAL AVERAGES<br />
WORLD 177,684 51 … 29 28 30 1.08 76 22 2<br />
Arab States 8,048 ** 49 ** … 24 ** 23 ** 24 ** 1.02 ** 88 ** 10 ** 3 **<br />
Central and Eastern Europe 21,233 ** 55 ** … 66 ** 58 ** 73 ** 1.26 ** 82 ** 16 ** 2 **<br />
Central Asia 2,088 ** 52 ** … 24 ** 23 ** 25 ** 1.09 ** 93 ** 7 ** 1 **<br />
East Asia and the Pacific 54,886 49 … 29 28 30 1.05 61 34 4<br />
Latin America and the Caribbean 21,448 56 … 41 36 46 1.28 82 18 1<br />
North America and Western Europe 36,896 ** 56 ** … 76 ** 65 ** 86 ** 1.32 ** 77 ** 20 ** 3 **<br />
South and West Asia 27,857 41 … 17 19 14 0.76 90 10 1<br />
Sub-Saharan Africa 5,228 ** 38 ** … 7 ** 8 ** 5 ** 0.62 ** 70 ** 29 ** 1 **<br />
128
OPPORTUNITIES LOST: THE IMPACT OF GRADE REPETITION AND EARLY SCHOOL LEAVING<br />
Female students by ISCED level (%) Gross graduation ratio, ISCED 5A, first degree Teaching staff<br />
5A 5B 6 MF M F GPI MF (000) % F<br />
(11) (12) (13) (14) (15) (16) (17) (18) (19)<br />
… … … … … … … … …<br />
32 +1 34 +1 28 +1 2 -2 3 -2 1 -2 0.38 -2 4 +1 8 +1<br />
… … … … … … … 2 12<br />
44 47 35 … … … … 4 ** 19 **<br />
56 . 36 … … … … 1 42<br />
24 27 . … … … … 0.3 -1 …<br />
… … … … … … … 2 -1 4 -1<br />
42 42 . … … … … 0.4 20<br />
… … … … … … … 1 -1 5 -1<br />
… … … … … … … … …<br />
… … … … … … … 23 -1 …<br />
… … … … … … … … …<br />
… … . … … … … 1 14<br />
27 . 6 5 7 2 0.30 16 11<br />
… … … … … … … … …<br />
… … . -2 … … … … 0.4 -2 …<br />
37 +1 38 +1 22 +1 4 +1 … … … 8 +1 18 +1<br />
23 -2 38 -2 . -2 … … … … 2 -2 5 -2<br />
… … … … … … … … …<br />
40 -1 44 -1 40 -1 … … … … … …<br />
… … … … … … … … …<br />
… … … … … … … … …<br />
47 49 43 1 1 1 0.99 4 30<br />
… … 32 … … … … 1 30<br />
29 +1 48 +1 13 +1 … … … … … …<br />
55 ** , -2 55 ** , -2 40 ** , -2 … … … … … …<br />
… … … … … … … … …<br />
57 -2 57 -2 48 -2 7 -2 5 -2 8 -2 1.55 -2 1 -2 41 -2<br />
24 +1 59 +1 12 +1 1 1 — 0.33 2 12<br />
… … … … … … … … …<br />
43 53 . … … … … 3 16<br />
… … … . -2 . -2 . -2 . -2 0.1 26<br />
… … … … … … … … …<br />
. -2 . -2 . -2 . -2 . -2 . -2 . -2 . -2 . -2<br />
… … … … … … … … …<br />
… … … … … … … … …<br />
… … … … … … … … …<br />
… … … … … … … … …<br />
… … … … … … … … …<br />
… … … … … … … 4 -1 …<br />
45 … 21 … … … … 4 24<br />
… … … … … … … … …<br />
… … … … … … … 4 32<br />
REGIONAL AVERAGES<br />
51 50 45 … … … … 10,983 ** 42 **<br />
51 ** 37 ** 43 ** … … … … 343 ** 30 **<br />
56 ** 51 ** 48 ** … … … … 1,321 ** 51 **<br />
51 ** 61 ** 52 ** … … … … 162 53<br />
49 51 44 … … … … 3,122 40<br />
56 53 50 … … … … 1,694 ** 43 **<br />
55 ** 59 ** 49 ** … … … … 2,864 43<br />
43 29 37 … … … … … …<br />
37 ** 41 ** 27 ** … … … … 217 ** …<br />
129
TABLE<br />
9<br />
TERTIARY EDUCATION / ISCED 5 and 6 / <strong>International</strong>ly mobile students by host country<br />
and region of origin t / 2010<br />
REGION<br />
Host country or territory<br />
ARAB STATES<br />
Students from abroad<br />
studying in given country<br />
(inbound mobile students)<br />
Mobile students by region of origin<br />
Inbound<br />
Central<br />
East Asia Latin America North America<br />
MF % F<br />
mobility<br />
rate (%)<br />
Arab<br />
States<br />
and Eastern<br />
Europe<br />
Central<br />
Asia<br />
and<br />
the Pacific<br />
and the<br />
Caribbean<br />
and Western<br />
Europe<br />
South and<br />
West Asia<br />
Sub-Saharan<br />
Africa Unspecified<br />
(1) (2) (3) (4) (5) (6) (7) (8) (9) (10) (11) (12)<br />
Algeria 6,544 … 0.6 … … … … … … … … …<br />
Bahrain 8,640 … 24.1 7,386 10 184 248 4 184 478 25 121<br />
Djibouti — +1 . +1 — +1 — +1 — +1 — +1 — +1 — +1 — +1 — +1 — +1 — +1<br />
Egypt 49,011 31 1.9 … … … … … … … … …<br />
Iraq … … … … … … … … … … … …<br />
Jordan 27,437 34 11.1 22,988 239 3 404 19 3,396 76 308 4<br />
Kuwait c 7,984 -1 … … 1,769 -1 16 -1 6 -1 47 -1 11 -1 86 -1 199 -1 155 -1 5,695 -1<br />
Lebanon 30,436 53 15.0 … … … … … … … … …<br />
Libya … … … … … … … … … … … …<br />
Mauritania … … … … … … … … … … … …<br />
Morocco 8,604 26 … 3,040 37 9 176 27 103 33 4,856 323<br />
Oman 1,787 35 2.3 933 4 26 27 4 24 683 79 7<br />
Palestine — . — — — — — — — — — —<br />
Qatar 5,387 58 38.9 3,791 47 3 83 13 282 951 174 43<br />
Saudi Arabia 26,871 40 3.0 3,738 598 1,584 2,140 45 637 2,016 2,550 13,563<br />
Sudan (pre-secession) a … … … … … … … … … … … …<br />
Syrian Arab Republic … … … … … … … … … … … …<br />
Tunisia 2,404 -1 … 0.7 -1 … … … … … … … … …<br />
United Arab Emirates 34,122 -1 52 -1 39.2 -1 … … … … … … … … …<br />
Yemen … … … … … … … … … … … …<br />
CENTRAL AND EASTERN EUROPE<br />
Albania … … … … … … … … … … … …<br />
Belarus 8,554 … 1.4 623 3,114 2,566 1,167 21 86 794 176 7<br />
Bosnia and Herzegovina … … … … … … … … … … … …<br />
Bulgaria 10,060 37 3.5 199 7,841 154 79 10 1,644 95 38 —<br />
Croatia 838 49 0.6 7 655 — 2 — 25 — 2 147<br />
Czech Republic 34,992 52 … 337 28,005 1,280 1,303 … 2,888 224 406 …<br />
Estonia 1,087 -1 22 -1 1.6 -1 — -1 233 -1 20 -1 66 -1 6 -1 728 -1 13 -1 19 -1 2 -1<br />
Hungary 14,518 -1 49 -1 3.7 -1 149 -1 7,278 -1 98 -1 520 -1 30 -1 5,374 -1 719 -1 350 -1 — -1<br />
Latvia 1,760 51 1.6 25 1,061 192 15 2 386 68 10 1<br />
Lithuania 2,973 61 1.5 80 2,513 41 27 8 200 81 23 —<br />
Montenegro … … … … … … … … … … … …<br />
Poland 16,976 -1 51 -1 0.8 -1 380 -1 8,340 -1 830 -1 716 -1 163 -1 4,647 -1 605 -1 658 -1 637 -1<br />
Republic of Moldova 1,574 31 1.2 100 881 18 11 — 547 11 — 6<br />
Romania 13,459 40 1.3 2,467 6,023 59 342 32 3,514 431 568 23<br />
Russian Federation c 129,690 -1 … 1.4 -1 4,014 -1 39,830 -1 55,599 -1 17,611 -1 876 -1 1,312 -1 5,803 -1 4,475 -1 170 -1<br />
Serbia 9,483 48 4.2 29 9,258 4 7 27 122 5 21 10<br />
Slovakia 7,946 50 3.4 411 5,366 41 71 … 1,947 23 59 …<br />
Slovenia 1,934 60 … 10 1,540 7 23 15 269 20 12 38<br />
The former Yugoslav Rep. of Macedonia 1,431 -1 41 -1 2.2 -1 3 -1 1,403 -1 — -1 2 -1 — -1 12 -1 2 -1 — -1 9 -1<br />
Turkey 25,838 34 … 1,258 3,761 7,853 493 30 2,422 2,015 628 7,378<br />
Ukraine 37,674 … 1.4 5,580 5,958 3,279 6,470 — — 4,150 — 12,237<br />
CENTRAL ASIA<br />
Armenia 4,016 46 2.6 149 1,241 992 11 2 55 781 — 785<br />
Azerbaijan 5,726 19 3.2 157 3,760 376 … — 21 1,185 28 …<br />
Georgia 832 … 0.8 15 240 250 7 18 17 283 2 —<br />
Kazakhstan 11,974 … 2.0 7 4,238 4,594 2,420 3 38 657 2 15<br />
Kyrgyzstan 16,425 48 … 22 2,012 12,078 601 — — 1,565 — 147<br />
Mongolia 996 48 0.6 — 450 8 524 1 6 6 1 —<br />
Tajikistan 3,380 46 2.1 59 128 2,686 12 — — 495 — —<br />
Turkmenistan … … … … … … … … … … … …<br />
Uzbekistan 433 … … — 72 219 — — — — — 142<br />
EAST ASIA AND THE PACIFIC<br />
Australia 271,231 48 21.2 9,293 2,097 371 173,277 … 17,433 37,946 6,914 …<br />
Brunei Darussalam 229 45 4.0 9 3 — 152 — 4 39 18 4<br />
Cambodia … … … … … … … … … … … …<br />
China 71,673 45 0.2 … … … … … … … … …<br />
130
OPPORTUNITIES LOST: THE IMPACT OF GRADE REPETITION AND EARLY SCHOOL LEAVING<br />
REGION<br />
Host country or territory<br />
Students from abroad<br />
studying in given country<br />
(inbound mobile students)<br />
Mobile students by region of origin<br />
Inbound<br />
Central<br />
East Asia Latin America North America<br />
MF % F<br />
mobility<br />
rate (%)<br />
Arab<br />
States<br />
and Eastern<br />
Europe<br />
Central<br />
Asia<br />
and<br />
the Pacific<br />
and the<br />
Caribbean<br />
and Western<br />
Europe<br />
South and<br />
West Asia<br />
Sub-Saharan<br />
Africa Unspecified<br />
(1) (2) (3) (4) (5) (6) (7) (8) (9) (10) (11) (12)<br />
China, Hong Kong SAR 10,325 52 3.9 2 22 1 9,849 26 232 140 14 39<br />
China, Macao SAR 13,508 43 45.8 1 7 3 13,304 15 99 4 70 5<br />
Cook Islands . . . . . . . . . . . .<br />
Democratic People’s Republic of Korea … … … … … … … … … … … …<br />
Fiji 7,444 -2 55 -2 … 2 -2 — -2 — -2 7,282 -2 1 -2 51 -2 14 -2 2 -2 92 -2<br />
Indonesia 6,437 … 0.1 … … … … … … … … …<br />
Japan 141,599 49 3.7 858 1,256 1,589 … … 5,242 5,318 682 …<br />
Kiribati . -2 . -2 . -2 . -2 . -2 . -2 . -2 . -2 . -2 . -2 . -2 . -2<br />
Lao People’s Democratic Republic 725 … 0.6 — 8 12 704 — 1 — — —<br />
Malaysia 57,824 -1 34 -1 5.8 -1 10,211 -1 322 -1 785 -1 19,831 -1 … 381 -1 12,803 -1 11,825 -1 …<br />
Marshall Islands … … … … … … … … … … … …<br />
Micronesia (Federated States of) … … … … … … … … … … … …<br />
Myanmar … … … … … … … … … … … …<br />
Nauru … … … … … … … … … … … …<br />
New Zealand 37,878 46 14.2 1,000 451 70 22,183 … 5,630 7,667 369 …<br />
Niue . -2 . -2 . -2 . -2 . -2 . -2 . -2 . -2 . -2 . -2 . -2 . -2<br />
Palau … … … … … … … … … … … …<br />
Papua New Guinea … … … … … … … … … … … …<br />
Philippines 2,665 -2 … 0.1 -2 35 -2 19 -2 1 -2 1,559 -2 46 -2 335 -2 438 -2 80 -2 152 -2<br />
Republic of Korea 59,194 52 1.8 220 540 2,775 50,571 … 1,721 1,617 486 …<br />
Samoa … … … … … … … … … … … …<br />
Singapore 48,623 47 22.8 … … … … … … … … …<br />
Solomon Islands . -2 . -2 . -2 . -2 . -2 . -2 . -2 . -2 . -2 . -2 . -2 . -2<br />
Thailand 19,052 48 0.8 45 132 41 15,022 … 2,112 1,417 225 …<br />
Timor-Leste … … … … … … … … … … … …<br />
Tokelau . -2 . -2 . -2 . -2 . -2 . -2 . -2 . -2 . -2 . -2 . -2 . -2<br />
Tonga … … … … … … … … … … … …<br />
Tuvalu . -2 . -2 . -2 . -2 . -2 . -2 . -2 . -2 . -2 . -2 . -2 . -2<br />
Vanuatu … … … … … … … … … … … …<br />
Viet Nam 3,260 27 0.2 — 29 58 3,140 12 12 2 7 —<br />
LATIN AMERICA AND THE CARIBBEAN<br />
Anguilla — -2 . -2 — -2 — -2 — -2 — -2 — -2 — -2 — -2 — -2 — -2 — -2<br />
Antigua and Barbuda 164 … 14.0 1 — — — 142 18 — — 3<br />
Argentina … … … … … … … … … … … …<br />
Aruba 63 81 2.7 — — — 1 53 9 — — —<br />
Bahamas … … … … … … … … … … … …<br />
Barbados 1,714 … 13.0 — 1 — 4 1,593 55 4 17 40<br />
Belize … … … … … … … … … … … …<br />
Bermuda 76 68 9.1 — 1 — 2 24 46 1 1 1<br />
Bolivia (Plurinational State of) … … … … … … … … … … … …<br />
Brazil 14,738 47 0.2 162 151 1 952 … 2,951 65 4,135 …<br />
British Virgin Islands 247 -1 … 20.4 -1 1 -1 — -1 — -1 — -1 206 -1 … 1 -1 3 -1 …<br />
Cayman Islands 346 -2 … 37.9 -2 — -2 1 -2 — -2 11 -2 238 -2 93 -2 — -2 3 -2 — -2<br />
Chile … … … … … … … … … … … …<br />
Colombia … … … … … … … … … … … …<br />
Costa Rica c 1,480 -2 … … 1 -2 20 -2 — -2 … 1,058 -2 316 -2 1 -2 1 -2 …<br />
Cuba 30,234 … 3.8 210 8 30 2,962 22,520 110 993 2,082 1,319<br />
Dominica … … … … … … … … … … … …<br />
Dominican Republic … … … … … … … … … … … …<br />
Ecuador … … … … … … … … … … … …<br />
El Salvador 764 47 0.5 — 16 — 23 564 161 — — —<br />
Grenada 4,235 -1 … 63.3 -1 10 -1 15 -1 — -1 48 -1 354 -1 3,503 -1 119 -1 178 -1 8 -1<br />
Guatemala … … … … … … … … … … … …<br />
Guyana 40 43 0.5 — 1 — — 28 1 1 9 —<br />
Haiti … … … … … … … … … … … …<br />
Honduras … … … … … … … … … … … …<br />
Jamaica … … … … … … … … … … … …<br />
Mexico … … … … … … … … … … … …<br />
131
TABLE<br />
9<br />
TERTIARY EDUCATION / ISCED 5 and 6 / <strong>International</strong>ly mobile students by host country<br />
and region of origin t / 2010<br />
REGION<br />
Host country or territory<br />
Students from abroad<br />
studying in given country<br />
(inbound mobile students)<br />
Mobile students by region of origin<br />
Inbound<br />
Central<br />
East Asia Latin America North America<br />
MF % F<br />
mobility<br />
rate (%)<br />
Arab<br />
States<br />
and Eastern<br />
Europe<br />
Central<br />
Asia<br />
and<br />
the Pacific<br />
and the<br />
Caribbean<br />
and Western<br />
Europe<br />
South and<br />
West Asia<br />
Sub-Saharan<br />
Africa Unspecified<br />
(1) (2) (3) (4) (5) (6) (7) (8) (9) (10) (11) (12)<br />
Montserrat — -1 . -1 — -1 … … … … … … … … …<br />
Netherlands Antilles a … … … … … … … … … … … …<br />
Nicaragua … … … … … … … … … … … …<br />
Panama … … … … … … … … … … … …<br />
Paraguay … … … … … … … … … … … …<br />
Peru … … … … … … … … … … … …<br />
Puerto Rico … … … … … … … … … … … …<br />
Saint Kitts and Nevis — -2 . -2 — -2 … … … … … … … … …<br />
Saint Lucia 331 … 16.8 — — — — 32 79 107 15 98<br />
Saint Vincent and the Grenadines … … … … … … … … … … … …<br />
Suriname … … … … … … … … … … … …<br />
Trinidad and Tobago … … … … … … … … … … … …<br />
Turks and Caicos Islands — -2 . -2 — -2 … … … … … … … … …<br />
Uruguay … … … … … … … … … … … …<br />
Venezuela (Bolivarian Republic of) 1,913 -2 … 0.1 -2 — -2 — -2 — -2 — -2 1,853 -2 — -2 — -2 55 -2 5 -2<br />
NORTH AMERICA AND WESTERN EUROPE<br />
Andorra 102 -1 … … … … … … … … … … …<br />
Austria 68,619 54 … 679 22,680 742 2,767 … 38,602 1,649 645 …<br />
Belgium 36,126 56 … 546 1,556 109 1,395 586 10,994 887 1,734 18,319<br />
Canada c 95,590 -1 45 -1 … 7,458 -1 2,100 -1 261 -1 36,010 -1 7,254 -1 16,578 -1 10,194 -1 6,780 -1 8,955 -1<br />
Cyprus 10,292 24 31.9 323 672 59 974 14 1,232 6,404 614 —<br />
Denmark 12,582 -1 52 -1 5.4 -1 47 -1 2,727 -1 45 -1 1,059 -1 151 -1 6,961 -1 1,025 -1 335 -1 232 -1<br />
Finland 14,097 40 4.6 178 3,479 96 2,881 … 2,557 2,015 2,511 …<br />
France 259,935 51 … 72,037 21,598 2,021 … 14,357 39,936 4,576 48,063 …<br />
Germany c 200,862 … … 12,648 ** 62,758 ** 5,820 ** 32,989 ** 8,745 ** 42,049 ** 9,232 ** 8,783 ** 17,838<br />
Gibraltar . -2 . -2 . -2 . -2 . -2 . -2 . -2 . -2 . -2 . -2 . -2 . -2<br />
Greece … … … … … … … … … … … …<br />
Holy See … … … … … … … … … … … …<br />
Iceland 889 60 … 5 207 2 66 … 549 14 10 …<br />
Ireland 13,489 53 ** … 521 960 39 2,287 … 5,603 1,626 832 …<br />
Israel … … … … … … … … … … … …<br />
Italy 69,905 59 … 3,907 27,265 398 6,108 5,271 10,613 2,825 4,669 8,849<br />
Liechtenstein 592 37 75.2 2 11 — 1 1 577 — — —<br />
Luxembourg 1,319 -2 … 43.8 -2 37 -2 182 -2 6 -2 30 -2 17 -2 962 -2 10 -2 72 -2 3 -2<br />
Malta 32 53 0.3 — 15 1 8 1 7 — — —<br />
Monaco . . . . . . . . . . . .<br />
Netherlands c 27,968 60 … 209 2,586 71 2,737 678 20,631 305 381 370<br />
Norway 15,737 58 7.0 307 2,782 119 1,306 … 5,292 1,389 1,452 …<br />
Portugal 11,034 52 … 53 662 11 239 3,072 2,467 116 4,387 27<br />
San Marino … … … … … … … … … … … …<br />
Spain 56,018 55 … 4,029 4,887 139 1,178 30,272 13,068 448 1,649 348<br />
Sweden 31,534 41 6.9 473 2,651 307 4,818 … 6,003 8,341 1,606 …<br />
Switzerland 38,195 49 15.4 1,257 4,330 229 1,737 … 25,535 1,122 1,150 …<br />
United Kingdom 389,958 48 … 24,678 32,319 3,234 105,045 … 125,346 60,648 31,744 …<br />
United States of America 684,714 … 3.4 31,216 32,849 5,644 279,595 65,476 80,767 131,080 31,566 26,521<br />
SOUTH AND WEST ASIA<br />
Afghanistan — -1 . -1 — -1 — -1 — -1 — -1 — -1 — -1 — -1 — -1 — -1 — -1<br />
Bangladesh 1,589 -1 … 0.1 -1 … … … … … … … … …<br />
Bhutan … … … … … … … … … … … …<br />
India … … … … … … … … … … … …<br />
Iran (Islamic Republic of) 3,182 43 0.1 614 33 82 51 5 6 2,211 11 169<br />
Maldives … … … … … … … … … … … …<br />
Nepal 95 -1 55 -1 0.03 -1 — -1 — -1 — -1 21 -1 2 -1 7 -1 65 -1 — -1 — -1<br />
Pakistan … … … … … … … … … … … …<br />
Sri Lanka … … … … … … … … … … … …<br />
SUB-SAHARAN AFRICA<br />
Angola 6,530 45 9.9 — — — — — — — 6,530 —<br />
Benin … … … … … … … … … … … …<br />
132
OPPORTUNITIES LOST: THE IMPACT OF GRADE REPETITION AND EARLY SCHOOL LEAVING<br />
REGION<br />
Host country or territory<br />
Students from abroad<br />
studying in given country<br />
(inbound mobile students)<br />
Mobile students by region of origin<br />
Inbound<br />
Central<br />
East Asia Latin America North America<br />
MF % F<br />
mobility<br />
rate (%)<br />
Arab<br />
States<br />
and Eastern<br />
Europe<br />
Central<br />
Asia<br />
and<br />
the Pacific<br />
and the<br />
Caribbean<br />
and Western<br />
Europe<br />
South and<br />
West Asia<br />
Sub-Saharan<br />
Africa Unspecified<br />
(1) (2) (3) (4) (5) (6) (7) (8) (9) (10) (11) (12)<br />
Botswana … … … … … … … … … … … …<br />
Burkina Faso 2,187 +1 42 +1 3.6 +1 … … … … … … … … …<br />
Burundi 1,813 34 6.2 — — — — — — — 1,813 —<br />
Cameroon 1,854 … 0.8 2 1 — — 1 4 — 1,846 —<br />
Cape Verde … … … … … … … … … … … …<br />
Central African Republic … … … … … … … … … … … …<br />
Chad 80 -2 … 0.4 -2 … … … … … … … … …<br />
Comoros . . . . . . . . . . . .<br />
Congo 39 … 0.2 … … … … … … … … …<br />
Côte d’Ivoire … … … … … … … … … … … …<br />
Democratic Republic of the Congo 914 -2 28 -2 0.3 -2 … … … … … … … … …<br />
Equatorial Guinea … … … … … … … … … … … …<br />
Eritrea … … … … … … … … … … … …<br />
Ethiopia … … … … … … … … … … … …<br />
Gabon … … … … … … … … … … … …<br />
Gambia … … … … … … … … … … … …<br />
Ghana 5,682 +1 … 2.0 +1 6 +1 6 +1 1 +1 32 +1 2 +1 435 +1 7 +1 2,116 +1 3,077 +1<br />
Guinea 748 -2 … 0.9 -2 — -2 — -2 — -2 — -2 — -2 — -2 — -2 … …<br />
Guinea-Bissau … … … … … … … … … … … …<br />
Kenya … … … … … … … … … … … …<br />
Lesotho … … … … … … … … … … … …<br />
Liberia … … … … … … … … … … … …<br />
Madagascar 1,313 32 1.8 … … … … … … … … …<br />
Malawi 117 … 1.1 … … … … … … … … …<br />
Mali 462 +1 31 +1 0.5 +1 13 +1 1 +1 — +1 — +1 — +1 — +1 — +1 448 +1 — +1<br />
Mauritius 62 -1 … … — -1 — -1 — -1 — -1 — -1 13 -1 11 -1 38 -1 — -1<br />
Mozambique … … … … … … … … … … … …<br />
Namibia 2,004 -2 … 10.2 -2 1 -2 1 -2 — -2 15 -2 2 -2 46 -2 4 -2 1,218 -2 717 -2<br />
Niger 1,125 23 6.6 … … … … … … … … …<br />
Nigeria … … … … … … … … … … … …<br />
Rwanda … … … … … … … … … … … …<br />
Sao Tome and Principe . -2 . -2 . -2 . -2 . -2 . -2 . -2 . -2 . -2 . -2 . -2 . -2<br />
Senegal … … … … … … … … … … … …<br />
Seychelles . -2 . -2 . -2 . -2 . -2 . -2 . -2 . -2 . -2 . -2 . -2 . -2<br />
Sierra Leone … … … … … … … … … … … …<br />
Somalia … … … … … … … … … … … …<br />
South Africa c 60,856 -1 47 -1 … … … … … … … … 43,587 -1 …<br />
Swaziland … … … … … … … … … … … …<br />
Togo … … … … … … … … … … … …<br />
Uganda … … … … … … … … … … … …<br />
United Republic of Tanzania … … … … … … … … … … … …<br />
Zambia … … … … … … … … … … … …<br />
Zimbabwe 884 38 0.9 9 — — 3 — — 1 871 —<br />
REGIONAL AVERAGES u<br />
WORLD 3,572,840 47 2.0 ** 249,277 387,245 120,795 1,008,732 196,888 542,654 343,377 257,099 466,772<br />
Arab States 219,389 40 2.7 ** 44,925 951 1,815 3,124 123 4,711 4,436 8,173 151,131<br />
Central and Eastern Europe 321,270 45 1.5 ** 15,672 133,542 72,041 28,925 1,470 26,123 15,059 7,445 20,993<br />
Central Asia 43,782 42 2.1 ** 409 12,141 21,203 3,774 24 137 4,972 33 1,089<br />
East Asia and the Pacific 752,253 47 1.4 ** 21,678 4,962 5,706 446,049 6,422 33,318 67,407 20,693 146,018<br />
Latin America and the Caribbean 68,306 49 0.3 ** 391 226 31 4,093 40,931 8,457 1,315 6,553 6,309<br />
North America and Western Europe 2,060,749 49 5.6 ** 161,796 235,260 19,776 520,795 147,867 468,614 243,985 149,585 113,073<br />
South and West Asia 17,629 40 0.1 ** 4,171 102 222 1,829 47 788 6,181 1,998 2,291<br />
Sub-Saharan Africa 89,462 45 1.7 ** 235 62 1 143 4 507 22 62,619 25,869<br />
133
TABLE<br />
10<br />
TERTIARY EDUCATION / ISCED 5 and 6 / <strong>International</strong> flows of mobile students u / 2010<br />
134<br />
REGION<br />
Country or territory<br />
ARAB STATES<br />
Students from given country<br />
studying abroad (outbound<br />
mobile students)<br />
Outbound<br />
mobility ratio<br />
(%)<br />
Gross<br />
outbound<br />
enrolment<br />
ratio<br />
Top five destinations (host countries) for outbound mobile<br />
students (the number of students from given country studying<br />
in the host countries is shown in brackets)<br />
Number of students<br />
from abroad<br />
studying in given<br />
country (inbound<br />
mobile students)<br />
Net flow of mobile<br />
students<br />
(inbound - outbound)<br />
MF<br />
MF<br />
(1) (2) (3) (4) (5) (6) (7)<br />
Algeria 22,465 ** 2.0 ** 0.6 ** France (20,066), Canada (366) - ¹, U.K. (237), Spain (180), U.S.A. (176) 6,544 ** -15,921 ** -1.4 **<br />
Bahrain 3,831 ** 10.7 ** ... U.K. (1,042), Jordan (739), India (435) -4 , U.S.A. (411), Saudi Arabia (248) 8,640 ** 4,809 ** 13.4 **<br />
Net flow<br />
ratio (%)<br />
Djibouti 1,635 ** 51.6 ** , -1 1.8 ** , -1 France (989), Morocco (309), Cuba (93), Malaysia (73) - ¹, India (54) -4 — ** , +1 -1,635 ** , +1 -34.8 ** , +1<br />
Egypt 11,627 ** 0.4 ** 0.1 ** U.S.A. (2,251), U.K. (1,396), Germany (1,275), France (1,256), Saudi Arabia (891) 49,011 ** 37,384 ** 1.4 **<br />
Iraq 9,640 ... ... Jordan (3,363), Malaysia (1,442) - ¹, U.K. (779), U.S.A. (419), Germany (364) ... … …<br />
Jordan 10,922 ** 4.4 ** 1.7 ** Ukraine (2,236), U.S.A. (1,977), U.K. (1,355), Saudi Arabia (752), Malaysia (640) - ¹ 27,437 ** 16,515 ** 6.7 **<br />
Kuwait 12,350 ** ... ... Bahrain (4,852), U.S.A. (2,420), Jordan (1,661), U.K. (1,643), Australia (268) 7,984 ** , -1 -4,401 ** , -1 …<br />
Lebanon 12,109 ** 6.0 ** 3.2 ** France (5,137), U.S.A. (1,594), Germany (726), Italy (686), Canada (594) - ¹ 30,436 ** 18,327 ** 9.1 **<br />
Libya 7,009 ... ... U.K. (2,827), Malaysia (1,453) - ¹, U.S.A. (1,055), France (277), Canada (243) - ¹ ... … …<br />
Mauritania 3,527 24.3 ** 1.1 ** France (1,357), Morocco (1,326), Tunisia (346) - ¹, Saudi Arabia (109), Germany (109) ... … …<br />
Morocco 42,800 ** 10.1 ** , -1 1.3 ** , -1 France (27,467), Spain (3,514), Germany (3,306), Italy (1,554), Canada (1,440) - ¹ 8,604 ** -34,196 ** …<br />
Oman 4,891 ** 6.3 ** 1.5 ** Jordan (7,755), Qatar (654), Malaysia (363) - ¹, Russian Fed. (311) - ¹, Germany (302) 1,787 ** -3,104 ** -4.0 **<br />
Palestine 11,249 ** 5.7 ** 2.9 ** U.K. (1,212), Jordan (1,051), Australia (517), India (432) -4 , U.S.A. (283) — ** -11,249 ** -5.7 **<br />
Qatar 2,798 ** 20.2 ** 2.0 ** U.K. (1,059), U.S.A. (657), Jordan (247), India (231) -4 , Bahrain (164) 5,387 ** 2,589 ** 18.7 **<br />
Saudi Arabia 41,532 ** 4.6 ** 1.7 ** U.S.A. (15,670), U.K. (8,055), Australia (5,403), Jordan (4,350), Bahrain (1,639) 26,871 ** -14,661 ** -1.6 **<br />
Sudan (pre-secession) a 4,291 ... ... Malaysia (1,449) - ¹, Saudi Arabia (378), U.K. (352), Qatar (321), Germany (214) ... … …<br />
Syrian Arab Republic 12,651 ... ... France (2,166), Germany (2,021), Jordan (1,810), Ukraine (1,455), Russian Fed. (988) - ¹ ... … …<br />
Tunisia 19,506 ** 5.2 ** , -1 1.8 ** , -1 France (11,659), Germany (2,657), Romania (1,282), Italy (753), Canada (750) - ¹ 2,404 ** , -1 -16,383 ** , -1 -4.5 ** , -1<br />
United Arab Emirates 8,485 ** 8.6 ** , -1 ... U.K. (2,975), U.S.A. (1,638), Australia (1,433), India (1,110) -4 , France (265) 34,122 ** , -1 26,674 ** , -1 30.7 ** , -1<br />
Yemen 5,959 ... ... Malaysia (2,353) - ¹, Jordan (969), Germany (431), Qatar (367), Russian Fed. (316) - ¹ ... … …<br />
CENTRAL AND EASTERN EUROPE<br />
Albania 21,194 ... ... Italy (12,234), Greece (4,253) - ³, U.S.A. (783), Germany (644), Turkey (542) ... … …<br />
Belarus 28,789 ** 4.8 ** 3.9 ** Russian Fed. (20,063) - ¹, Lithuania (2,113), Poland (2,074) - ¹, Germany (1,643), France (496) 8,554 ** -20,235 ** -3.3 **<br />
Bosnia and Herzegovina 12,452 11.8 ** 4.4 ** Serbia (5,446), Austria (3,061), Germany (1,044), Turkey (529), Croatia (432) ... … …<br />
Bulgaria 23,889 ** 8.3 ** 4.7 ** Germany (8,014), U.K. (3,365), U.S.A. (2,473), France (2,047), Austria (1,487) 10,060 ** -13,829 ** -4.8 **<br />
Croatia 6,907 ** 4.6 ** 2.5 ** Austria (1,891), Italy (1,184), Germany (1,013), Slovenia (692), U.S.A. (617) 838 ** -6,069 ** -4.0 **<br />
Czech Republic 11,929 ** 2.5 ** , -1 1.5 ** , -1 Slovakia (4,622), Germany (1,532), U.K. (1,186), Poland (926) - ¹, U.S.A. (821) 34,992 ** 23,063 ** …<br />
Estonia 3,951 ** 5.5 ** , -1 3.5 ** , -1 U.K. (952), Finland (700), Germany (548), Russian Fed. (543) - ¹, U.S.A. (218) 1,087 ** , -1 -2,695 ** , -1 -3.9 ** , -1<br />
Hungary 7,948 ** 1.9 ** , -1 1.2 ** , -1 Germany (1,849), Austria (1,744), U.K. (1,158), U.S.A. (658), France (613) 14,518 ** , -1 7,060 ** , -1 1.8 ** , -1<br />
Latvia 4,720 ** 4.2 ** 2.5 ** U.K. (1,623), Russian Fed. (711) - ¹, Germany (674), U.S.A. (283), Denmark (179) - ¹ 1,760 ** -2,960 ** -2.6 **<br />
Lithuania 8,230 ** 4.1 ** 3.0 ** U.K. (2,913), Germany (1,094), Russian Fed. (821) - ¹, Poland (570) - ¹, Denmark (496) - ¹ 2,973 ** -5,257 ** -2.6 **<br />
Montenegro 3,903 16.4 ** 7.8 ** Serbia (3,148), Italy (269), U.S.A. (93), Germany (74), Turkey (55) ... … …<br />
Poland 30,895 ** 1.5 ** , -1 1.1 ** , -1 Germany (9,238), U.K. (8,316), France (2,809), U.S.A. (2,244), Austria (1,871) 16,976 ** , -1 -15,644 ** , -1 -0.7 ** , -1<br />
Republic of Moldova 14,064 ** 10.8 ** 4.1 ** Romania (4,504), Russian Fed. (3,564) - ¹, Italy (1,246), Ukraine (1,031), France (922) 1,574 ** -12,490 ** -9.6 **<br />
Romania 25,299 ** 2.5 ** 1.5 ** Italy (4,174), France (3,856), Germany (3,232), U.K. (3,165), Hungary (2,307) - ¹ 13,459 ** -11,840 ** -1.2 **<br />
Russian Federation 49,585 ** 0.5 ** , -1 0.4 ** , -1 Germany (10,342), U.S.A. (4,784), Ukraine (3,931), France (3,822), Kazakhstan (3,600) 129,690 ** , -1 82,583 ** , -1 0.9 ** , -1<br />
Serbia 10,875 ** 4.8 ** 2.4 ** Austria (1,942), Germany (1,176), Hungary (1,171) - ¹, U.S.A. (1,165), TFYR Macedonia (954) - ¹ 9,483 ** -1,392 ** -0.6 **<br />
Slovakia 30,835 ** 13.1 ** 7.2 ** Czech Rep. (22,427), Hungary (2,109) - ¹, Austria (1,638), U.K. (1,381), Germany (1,000) 7,946 ** -22,889 ** -9.8 **<br />
Slovenia 2,434 ** 2.1 ** , -1 1.9 ** , -1 Austria (831), Germany (310), Italy (298), U.K. (281), U.S.A. (190) 1,934 ** -500 ** …<br />
The former Yugoslav Rep. of Macedonia 5,166 ** 8.4 ** 3.2 ** Bulgaria (1,703), Germany (457), Italy (424), Austria (389), Turkey (356) 1,431 ** , -1 -4,298 ** , -1 -6.6 ** , -1<br />
Turkey 49,116 ** 1.6 ** , -1 0.7 ** , -1 U.S.A. (12,287), Germany (11,799), Bulgaria (4,424), Azerbaijan (3,445), U.K. (3,096) 25,838 ** -23,278 ** …<br />
Ukraine 35,066 ** 1.3 ** 1.1 ** Russian Fed. (12,793) - ¹, Germany (6,438), Poland (3,210) - ¹, U.S.A. (1,712), France (1,449) 37,674 ** 2,608 ** 0.1 **<br />
CENTRAL ASIA<br />
Armenia 5,775 ** 3.7 ** 1.9 ** Russian Fed. (3,276) - ¹, France (777), U.S.A. (371), Germany (311), Greece (175) - ³ 4,016 ** -1,759 ** -1.1 **<br />
Azerbaijan 10,959 ** 6.1 ** 1.2 ** Russian Fed. (5,717) - ¹, Turkey (2,819), U.S.A. (405), Germany (384), U.K. (302) 5,726 ** -5,233 ** -2.9 **<br />
Georgia 8,668 ** 8.2 ** 2.3 ** Russian Fed. (2,349) - ¹, Germany (2,328), Armenia (928), U.S.A. (444), France (419) 832 ** -7,836 ** -7.4 **<br />
Kazakhstan 36,594 ** 6.0 ** 2.3 ** Russian Fed. (24,772) - ¹, Kyrgyzstan (3,107), U.K. (2,054), U.S.A. (1,919), Turkey (711) 11,974 ** -24,620 ** -4.0 **<br />
Kyrgyzstan 4,451 ** 1.5 ** , -1 0.7 ** , -1 Russian Fed. (1,713) - ¹, Turkey (565), Germany (524), Kazakhstan (486), U.S.A. (272) 16,425 ** 11,974 ** …<br />
Mongolia 9,798 ** 5.9 ** 3.2 ** Rep. of Korea (2,190), Russian Fed. (1,654) - ¹, U.S.A. (1,247), Japan (1,153), Turkey (939) 996 ** -8,802 ** -5.3 **<br />
Tajikistan 6,580 ** 4.1 ** 0.8 ** Russian Fed. (3,228) - ¹, Saudi Arabia (1,238), Kyrgyzstan (1,196), U.S.A. (285), Turkey (194) 3,380 ** -3,200 ** -2.0 **<br />
Turkmenistan 14,523 ... ... Ukraine (3,279), Russian Fed. (2,972) - ¹, Turkey (2,163), Belarus (2,059), Kyrgyzstan (1,751) ... … …<br />
Uzbekistan 23,447 ** 9.6 ** , -1 1.0 ** , -1 Russian Fed. (9,918) - ¹, Kyrgyzstan (5,967), Tajikistan (2,151), Kazakhstan (2,071), Germany (736) 433 ** -23,014 ** …<br />
EAST ASIA AND THE PACIFIC<br />
Australia 10,330 ** 0.8 ** 0.6 ** U.S.A. (3,267), New Zealand (2,966), U.K. (1,643), Germany (421), France (352) 271,231 ** 260,901 ** 20.4 **<br />
Brunei Darussalam 3,208 ** 55.5 ** 9.6 ** U.K. (1,908), Australia (737), Malaysia (317) - ¹, New Zealand (71), U.S.A. (43) 229 ** -2,979 ** -51.6 **<br />
Cambodia 4,060 2.5 ** , -2 0.2 ** , -2 Thailand (1,009), France (566), Viet Nam (517), Australia (419), U.S.A. (344) ... … …<br />
China 562,889 ** 1.8 ** 0.5 ** U.S.A. (126,498), Australia (87,588), Japan (86,553), U.K. (55,496), Rep. of Korea (45,757) 71,673 ** -491,216 ** -1.6 **<br />
China, Hong Kong SAR 32,842 ** 12.4 ** 7.4 ** Australia (12,652), U.K. (9,839), U.S.A. (7,963), Canada (1,797) - ¹, China, Macao (274) 10,325 ** -22,517 ** -8.5 **<br />
China, Macao SAR 1,733 ** 5.9 ** 3.8 ** Australia (718), U.S.A. (464), U.K. (254), China, Hong Kong (93), Canada (87) - ¹ 13,508 ** 11,775 ** 39.9 **
OPPORTUNITIES LOST: THE IMPACT OF GRADE REPETITION AND EARLY SCHOOL LEAVING<br />
REGION<br />
Country or territory<br />
Students from given country<br />
studying abroad (outbound<br />
mobile students)<br />
Outbound<br />
mobility ratio<br />
(%)<br />
Gross<br />
outbound<br />
enrolment<br />
ratio<br />
Top five destinations (host countries) for outbound mobile<br />
students (the number of students from given country studying<br />
in the host countries is shown in brackets)<br />
Number of students<br />
from abroad<br />
studying in given<br />
country (inbound<br />
mobile students)<br />
Net flow of mobile<br />
students<br />
(inbound - outbound)<br />
MF<br />
MF<br />
(1) (2) (3) (4) (5) (6) (7)<br />
Cook Islands 235 ** ... 14.7 ** Fiji (184) - ², Papua New Guinea (19) -12 , Romania (16), U.S.A. (9), Australia (2) . … …<br />
Democratic People’s Rep. of Korea 2,079 ... ... Australia (736), Canada (288) - ¹, France (170), India (168) -4 , Philippines (142) - ² ... … …<br />
Fiji 1,647 ** ... ... New Zealand (685), Australia (572), U.S.A. (156), India (37) -4 , Samoa (35) - ¹ 0 7,444 ** , -2 5,718 ** , -2 …<br />
Indonesia 34,067 ** 0.7 ** 0.2 ** Australia (10,135), Malaysia (8,604) - ¹, U.S.A. (6,882), Japan (1,974), Germany (1,676) 6,437 ** -27,630 ** -0.6 **<br />
Japan 40,487 ** 1.1 ** 0.6 ** U.S.A. (24,622), U.K. (3,354), Australia (2,413), Canada (1,815) - ¹, Germany (1,784) 141,599 ** 101,112 ** 2.6 **<br />
Kiribati 1,034 ** ... 9.6 ** , -1 Fiji (850) - ², Australia (76), Cuba (34), U.S.A. (31), New Zealand (19) . -2 … …<br />
Lao People’s Democratic Republic 3,854 ** 3.3 ** 0.5 ** Viet Nam (1,744), Thailand (1,254), Japan (275), Australia (163), France (102) 725 ** -3,129 ** -2.6 **<br />
Net flow<br />
ratio (%)<br />
Malaysia 53,884 ** 5.5 ** , -1 2.2 ** , -1 Australia (19,578), U.K. (12,453), U.S.A. (6,135), Russian Fed. (2,671) - ¹, Indonesia (2,516) 57,824 ** , -1 3,168 ** , -1 0.3 ** , -1<br />
Marshall Islands 235 ... ... Fiji (132) - ², U.S.A. (51), Spain (37), Papua New Guinea (6) -12 , Australia (3) ... … …<br />
Micronesia (Federated States of) ... ... ... U.S.A. (114), Fiji (22) - ², Australia (3), Japan (3), U.K. (3) ... … …<br />
Myanmar 6,288 ... ... Russian Fed. (1,627) - ¹, Thailand (1,205), Japan (1,011), U.S.A. (689), Australia (590) ... … …<br />
Nauru 141 ... ... Fiji (102) - ², Cuba (17), Australia (13), Thailand (4), U.S.A. (2) ... … …<br />
New Zealand 4,694 ** 1.8 ** 1.5 ** Australia (2,500), U.S.A. (1,093), U.K. (503), Germany (104), Japan (78) 37,878 ** 33,184 ** 12.5 **<br />
Niue 75 ** ... 32.6 ** , -1 U.S.A. (36), Fiji (31) - ², Australia (5) . -2 … …<br />
Palau 44 ... 2.8 U.S.A. (32), Australia (3), Japan (2), New Zealand (2), Germany (2) ... … …<br />
Papua New Guinea 1,032 ... ... Australia (675), New Zealand (84), Brazil (75), U.S.A. (52), Malaysia (44) - ¹ ... … …<br />
Philippines 11,748 ** 0.3 ** , -2 0.1 ** , -2 U.S.A. (3,781), U.K. (1,772), Australia (1,596), Saudi Arabia (1,152), Japan (614) 2,665 ** , -2 -6,011 ** , -2 -0.2 ** , -2<br />
Republic of Korea 126,447 ** 3.9 ** 4.0 ** U.S.A. (71,514), Japan (25,660), Australia (7,311), U.K. (4,347), Canada (4,326) - ¹ 59,194 ** -67,253 ** -2.1 **<br />
Samoa 678 ... ... Fiji (427) - ², Australia (83), New Zealand (81), U.S.A. (43), Papua New Guinea (13) -12 ... … …<br />
Singapore 20,030 ** 9.4 ** ... Australia (10,086), U.S.A. (4,015), U.K. (3,702), Malaysia (624) - ¹, Canada (345) - ¹ 48,623 ** 28,593 ** 13.4 **<br />
Solomon Islands 3,139 ** ... 6.3 ** , -1 Fiji (2,747) - ², Australia (120), Papua New Guinea (104) -12 , New Zealand (58), Cuba (50) . -2 … …<br />
Thailand 26,233 ** 1.1 ** 0.5 ** U.S.A. (8,455), U.K. (5,348), Australia (4,229), Japan (2,419), Malaysia (1,301) - ¹ 19,052 ** -7,181 ** -0.3 **<br />
Timor-Leste 3,699 20.2 ** , -1 3.4 ** , -1 Indonesia (2,675), Cuba (702), Saudi Arabia (107), Australia (88), Portugal (37) ... … …<br />
Tokelau 63 ** ... 52.0 ** , -1 Fiji (63) - ² . -2 … …<br />
Tonga 1,507 ... ... Fiji (750) - ², New Zealand (513), U.S.A. (101), Australia (56), Japan (34) ... … …<br />
Tuvalu 428 ** ... 39.7 ** , -1 Fiji (348) - ², Cuba (20), New Zealand (17), Samoa (17) -10 , Australia (16) . -2 … …<br />
Vanuatu 1,773 ... ... Fiji (1,539) - ², Papua New Guinea (68) -12 , Australia (66), New Zealand (40), Cuba (27) ... … …<br />
Viet Nam 47,979 ** 2.4 ** 0.5 ** U.S.A. (12,996), Australia (9,609), France (5,820), Japan (3,280), Russian Fed. (3,117) - ¹ 3,260 ** -44,719 ** -2.2 **<br />
LATIN AMERICA AND THE CARIBBEAN<br />
Anguilla 129 ** 279.0 ** , -2 13.9 ** , -2 U.S.A. (64), U.K. (40), Canada (9) - ¹, Barbados (7), Antigua/Barbuda (3) — ** , -2 -129 ** , -2 279.0 ** , -2<br />
Antigua and Barbuda 662 ** 56.6 ** 9.3 ** U.S.A. (211), Cuba (167), Barbados (100), Canada (63) - ¹, U.K. (44) 164 ** -498 ** -42.6 **<br />
Argentina 9,314 0.4 ** , -1 0.3 ** , -1 Spain (3,005), U.S.A. (2,146), Cuba (827), France (782), Brazil (757) ... … …<br />
Aruba 393 ** 16.9 ** 5.2 ** Brazil (306), U.S.A. (71), Grenada (5) - ¹, U.K. (4), Canada (3) - ¹ 63 ** -330 ** -14.2 **<br />
Bahamas 2,723 ... ... U.S.A. (1,812), Canada (405) - ¹, U.K. (192), Trinidad/Tobago (85) -7 , Jamaica (77) -10 ... … …<br />
Barbados 1,282 ** 9.7 ** 6.4 ** U.S.A. (357), U.K. (306), Trinidad/Tobago (200) -7 , Canada (162) - ¹, Jamaica (115) -10 1,714 ** 432 ** 3.3 **<br />
Belize 844 12.0 ** 2.6 ** U.S.A. (411), Cuba (199), Barbados (58), Jamaica (33) -10 , Canada (33) -1 ... … …<br />
Bermuda 1,234 ** 148.0 ** 29.0 ** U.S.A. (425), Canada (393) - ¹, U.K. (393), Australia (11), Grenada (5) - ¹ 76 ** -1,158 ** -138.8 **<br />
Bolivia (Plurinational State of) 10,056 ... ... Cuba (5,108), Spain (1,060), U.S.A. (1,030), Venezuela (796) - ², Argentina (491) -10 ... … …<br />
Brazil 27,148 ** 0.4 ** 0.2 ** U.S.A. (8,708), France (3,540), Portugal (2,801), Germany (2,251), Spain (1,969) 14,738 ** -12,410 ** -0.2 **<br />
British Virgin Islands 393 ** 30.5 ** , -1 19.6 ** , -1 U.K. (155), U.S.A. (121), Malaysia (62) - ¹, Philippines (25) - ², Barbados (13) 247 ** , -1 -122 ** , -1 -10.1 ** , -1<br />
Cayman Islands 324 ** 39.0 ** , -2 11.9 ** , -2 U.S.A. (157), U.K. (121), Canada (36) - ¹, Ireland (3), Australia (2) 346 ** , -2 -10 ** , -2 -1.1 ** , -2<br />
Chile 8,850 ** 0.9 ** , -1 0.5 ** , -1 U.S.A. (2,037), Spain (1,881), France (802), Germany (675), Argentina (656) -10 2,222 ** , -1 -5,799 ** , -1 -0.7 ** , -1<br />
Colombia 22,153 1.3 ** 0.5 ** U.S.A. (6,859), Spain (5,792), France (2,578), Germany (1,292), Australia (1,094) ... … …<br />
Costa Rica 2,106 ** ... ... U.S.A. (1,079), Cuba (228), Spain (186), Germany (123), France (96) 1,480 ** , -2 -392 ** , -2 …<br />
Cuba 1,820 ** 0.2 ** 0.2 ** Spain (958), Germany (124), Italy (118), France (117), U.S.A. (87) 30,234 ** 28,414 ** 3.5 **<br />
Dominica 781 295.3 ** , -2 10.5 ** , -2 U.S.A. (298), Barbados (92), Cuba (84), Venezuela (66) - ², France (43) ... … …<br />
Dominican Republic 3,306 ... ... U.S.A. (1,388), Spain (1,118), Cuba (352), Italy (96), France (85) ... … …<br />
Ecuador 9,813 1.6 ** , -2 0.7 ** , -2 Spain (2,825), U.S.A. (2,212), Cuba (1,711), Italy (686), France (362) ... … …<br />
El Salvador 3,101 ** 2.1 ** 0.5 ** U.S.A. (1,197), Cuba (841), Spain (263), France (176), Honduras (100) -7 764 ** -2,337 ** -1.6 **<br />
Grenada 557 ** 9.1 ** , -1 4.8 ** , -1 U.S.A. (229), Cuba (108), Barbados (73), U.K. (42), Trinidad/Tobago (40) -7 4,235 ** , -1 3,623 ** , -1 54.2 ** , -1<br />
Guatemala 2,723 ... ... U.S.A. (983), Cuba (621), Spain (236), El Salvador (112), Honduras (102) -7 ... … …<br />
Guyana 812 ** 10.2 ** 1.2 ** U.S.A. (293), Canada (138) - ¹, Barbados (79), U.K. (68), France (62) 40 ** -772 ** -9.7 **<br />
Haiti 3,586 ... ... France (1,248), U.S.A. (1,003), Cuba (604), Canada (423) - ¹, Venezuela (62) - ² ... … …<br />
Honduras 2,925 1.7 ** , -2 0.3 ** , -2 U.S.A. (1,325), Cuba (919), Spain (230), El Salvador (72), France (56) ... … …<br />
Jamaica 5,406 7.6 ** 2.2 ** U.S.A. (3,499), Canada (432) - ¹, U.K. (405), Cuba (267), Barbados (190) ... … …<br />
Mexico 25,836 0.9 ** 0.3 ** U.S.A. (13,331), Spain (2,933), France (1,954), Germany (1,503), U.K. (1,337) ... … …<br />
Montserrat 68 ** 111.5 ** ... U.K. (17), U.S.A. (15), Barbados (10), Ireland (10), Antigua/Barbuda (4) — ** , -1 -68 ** , -1 -96.4 ** , -1<br />
Netherlands Antilles a 16 ... ... Aruba (9), Australia (4) ... … …<br />
Nicaragua 2,508 ... ... Cuba (951), Costa Rica (402) - ², U.S.A. (380), Venezuela (173) - ², Honduras (117) -7 ... … …<br />
Panama 2,403 1.8 ** , -1 0.8 ** , -1 U.S.A. (1,072), Cuba (558), Spain (203), Chile (104) - ¹, Germany (56) ... … …<br />
135
TABLE<br />
10<br />
TERTIARY EDUCATION / ISCED 5 and 6 / <strong>International</strong> flows of mobile students u / 2010<br />
136<br />
REGION<br />
Country or territory<br />
Students from given country<br />
studying abroad (outbound<br />
mobile students)<br />
Outbound<br />
mobility ratio<br />
(%)<br />
Gross<br />
outbound<br />
enrolment<br />
ratio<br />
Top five destinations (host countries) for outbound mobile<br />
students (the number of students from given country studying<br />
in the host countries is shown in brackets)<br />
Number of students<br />
from abroad<br />
studying in given<br />
country (inbound<br />
mobile students)<br />
Net flow of mobile<br />
students<br />
(inbound - outbound)<br />
MF<br />
MF<br />
(1) (2) (3) (4) (5) (6) (7)<br />
Paraguay 2,744 1.1 ** , -1 0.4 ** , -1 Cuba (685), Brazil (536), Argentina (392) - ¹ 0 , Spain (371), U.S.A. (337) ... … …<br />
Peru 15,507 1.3 ** 0.6 ** Spain (3,864), U.S.A. (3,250), Italy (1,559), Cuba (1,340), France (1,103) ... … …<br />
Puerto Rico ... ... ... ... ... … …<br />
Net flow<br />
ratio (%)<br />
Saint Kitts and Nevis 491 ** 57.3 ** , -2 10.4 ** , -2 U.S.A. (242), Cuba (55), Barbados (54), Jamaica (30) -10 , Jamaica (30) -10 — ** , -2 -491 ** , -2 -57.2 ** , -2<br />
Saint Lucia 1,414 ** 71.7 ** 8.1 ** U.S.A. (524), Cuba (269), Trinidad/Tobago (136) -7 , Canada (129) - ¹, U.K. (125) 331 ** -1,083 ** -54.9 **<br />
Saint Vincent and the Grenadines 907 ... ... Barbados (261), U.S.A. (123), U.K. (122), Cuba (120), Trinidad/Tobago (72) -7 ... … …<br />
Suriname 774 ... ... Netherlands (443), U.S.A. (100), France (77), Belgium (76), Serbia (22) ... … …<br />
Trinidad and Tobago 5,625 ... ... U.S.A. (2,381), Canada (1,329) - ¹, U.K. (888), Barbados (434), Grenada (229) - ¹ ... … …<br />
Turks and Caicos Islands 227 ** … ** , -2 9.5 ** , -2 U.S.A. (145), U.K. (52), Canada (9) - ¹, Jamaica (8) -10 , Cayman Islands (7) - ² — ** , -2 -227 ** , -2 …<br />
Uruguay 2,692 1.5 ** , -1 1.0 ** , -1 Spain (652), Argentina (500) -10 , Brazil (407), U.S.A. (387), Cuba (373) ... … …<br />
Venezuela (Bolivarian Republic of) 13,234 ** 0.6 ** , -1 0.5 ** , -1 U.S.A. (4,914), Cuba (3,144), Spain (2,550), France (550), Germany (353) 1,913 ** , -2 -10,269 ** , -2 -0.5 ** , -2<br />
NORTH AMERICA AND WESTERN EUROPE<br />
Andorra 1,243 ** 261.0 ** , -2 29.3 ** , -2 Spain (999), France (145), Saudi Arabia (59), Portugal (14), U.S.A. (11) 102 ** , -1 -1,208 ** , -1 …<br />
Austria 12,721 ** 3.7 ** , -1 2.3 ** , -1 Germany (6,680), U.K. (1,472), U.S.A. (985), Switzerland (970), France (479) 68,619 ** 55,898 ** …<br />
Belgium 10,770 ** 2.4 ** , -1 1.6 ** , -1 France (3,238), U.K. (2,723), Netherlands (1,136), Germany (936), U.S.A. (838) 36,126 ** 25,356 ** …<br />
Canada 45,090 ** ... ... U.S.A. (27,896), U.K. (5,508), Australia (4,320), France (1,442), Ireland (594) 95,590 ** , -1 49,591 ** , -1 …<br />
Cyprus 25,340 ** 78.6 ** 43.0 ** Greece (11,449) - ³, U.K. (11,342), U.S.A. (581), Hungary (282) - ¹, Bulgaria (272) 10,292 ** -15,048 ** -46.7 **<br />
Denmark 5,228 ** 2.2 ** , -1 1.6 ** , -1 U.K. (1,536), U.S.A. (980), Norway (806), Germany (359), Sweden (229) 12,582 ** , -1 7,442 ** , -1 3.2 ** , -1<br />
Finland 7,282 ** 2.4 ** 2.2 ** U.K. (1,737), Sweden (1,386), Germany (697), U.S.A. (657), Estonia (602) - ¹ 14,097 ** 6,815 ** 2.2 **<br />
France 54,407 ** 2.4 ** , -1 1.3 ** , -1 U.K. (13,602), U.S.A. (7,648), Switzerland (6,006), Canada (5,859) - ¹, Germany (5,834) 259,935 ** 205,528 ** …<br />
Germany 103,110 ** ... ... Austria (25,186), Netherlands (17,052), U.K. (15,162), Switzerland (10,808), U.S.A. (9,463) 200,862 ** 97,752 ** …<br />
Gibraltar 668 ** ... ... U.K. (625), U.S.A. (18), Saudi Arabia (18), Ireland (4), Brazil (2) . -2 … …<br />
Greece 29,074 ... ... U.K. (11,733), Italy (3,476), Germany (2,762), France (1,902), U.S.A. (1,821) ... … …<br />
Holy See 22 ** ... ... U.K. (7), Brazil (4), Germany (4), Spain (3) … … …<br />
Iceland 2,635 ** 15.5 ** , -1 11.5 ** , -1 Denmark (1,009) - ¹, U.S.A. (403), Norway (300), U.K. (288), Sweden (194) 889 ** -1,746 ** …<br />
Ireland 19,617 ** 10.0 ** , -1 6.1 ** , -1 U.K. (16,469), U.S.A. (1,201), France (407), Germany (301), Australia (244) 13,489 ** -6,128 ** …<br />
Israel 13,565 3.9 ** , -1 2.4 ** , -1 Jordan (2,913), U.S.A. (2,753), Italy (1,525), Germany (1,500), Hungary (795) - ¹ ... … …<br />
Italy 39,761 ** 1.8 ** , -1 1.2 ** , -1 Austria (7,594), U.K. (6,484), France (5,851), Germany (5,171), U.S.A. (4,036) 69,905 ** 30,144 ** …<br />
Liechtenstein 965 ** 122.6 ** 44.1 ** Switzerland (736), Austria (167), Germany (19), U.K. (16), Australia (8) 592 ** -373 ** -47.3 **<br />
Luxembourg 6,996 ** 207.8 ** , -2 21.9 ** , -2 Germany (2,879), France (1,388), U.K. (957), Austria (653), Belgium (451) 1,319 ** , -2 -4,939 ** , -2 -164.0 ** , -2<br />
Malta 1,199 ** 11.1 ** 3.9 ** U.K. (989), Germany (32), U.S.A. (32), Italy (24), France (17) 32 ** -1,167 ** -10.8 **<br />
Monaco 441 ... ... France (326), U.K. (54), U.S.A. (23), Switzerland (15), Australia (8) . -441 …<br />
Netherlands 12,374 ** 1.8 ** , -1 1.1 ** , -1 U.K. (3,208), Belgium (3,117), U.S.A. (1,814), Germany (840), France (712) 27,968 ** 15,594 ** …<br />
Norway 12,973 ** 5.8 ** 4.3 ** U.K. (3,295), Denmark (1,872) - ¹, Australia (1,462), U.S.A. (1,454), Poland (1,169) - ¹ 15,737 ** 2,764 ** 1.2 **<br />
Portugal 12,904 ** 3.3 ** , -1 2.1 ** , -1 France (3,049), U.K. (2,662), Spain (2,561), U.S.A. (1,006), Brazil (830) 11,034 ** -1,870 ** …<br />
San Marino 800 85.4 ** ... Italy (776), U.K. (15), Romania (2), Switzerland (2), U.S.A. (2) ... … …<br />
Spain 22,919 ** 1.2 ** , -1 0.9 ** , -1 U.K. (5,617), Germany (4,144), France (4,129), U.S.A. (3,936), Portugal (855) 56,018 ** 33,099 ** …<br />
Sweden 14,794 ** 3.3 ** 2.4 ** U.K. (3,159), U.S.A. (3,088), Denmark (1,524) - ¹, Norway (1,388), Poland (833) - ¹ 31,534 ** 16,740 ** 3.7 **<br />
Switzerland 11,152 ** 4.5 ** 2.5 ** U.K. (2,260), Germany (2,127), France (1,770), U.S.A. (1,273), Austria (872) 38,195 ** 27,043 ** 10.9 **<br />
U.K. 23,039 ** 0.9 ** , -1 0.5 ** , -1 U.S.A. (8,783), France (2,704), Ireland (1,804), Australia (1,661), Germany (1,342) 389,958 ** 366,920 ** …<br />
United States of America 51,565 ** 0.3 ** 0.2 ** U.K. (13,855), Canada (7,080) - ¹, Germany (3,569), France (3,435), Australia (3,018) 684,714 ** 633,149 ** 3.1 **<br />
SOUTH AND WEST ASIA<br />
Afghanistan 5,757 ** 4.2 ** , -1 0.1 ** , -1 Iran (2,132), Turkey (796), U.S.A. (422), Germany (285), Russian Fed. (282) - ¹ — ** , -1 -5,757 ** , -1 -6.0 ** , -1<br />
Bangladesh 20,831 ** 1.2 ** , -1 0.1 ** , -1 U.K. (4,140), Australia (2,656), U.S.A. (2,596), Cyprus (2,471), Japan (1,693) 1,589 ** , -1 -17,138 ** , -1 -1.1 ** , -1<br />
Bhutan 1,229 22.3 ** 1.6 ** India (365) -4 , Australia (334), Thailand (243), U.S.A. (125), Canada (33) - ¹ ... … …<br />
India 200,621 1.0 ** 0.2 ** U.S.A. (103,968), U.K. (38,205), Australia (20,429), New Zealand (6,650), Canada (4,617) - ¹ ... … …<br />
Iran (Islamic Republic of) 38,380 ** 1.0 ** 0.4 ** Malaysia (6,588) - ¹, U.S.A. (4,689), U.K. (3,163), Germany (2,745), Canada (2,364) - ¹ 3,182 ** -35,198 ** -0.9 **<br />
Maldives 1,897 38.3 ** , -2 4.8 ** , -2 Malaysia (1,092) - ¹, Australia (231), U.K. (143), Saudi Arabia (125), New Zealand (54) ... … …<br />
Nepal 24,238 ** 6.4 ** ... U.S.A. (11,134), Australia (4,986), Japan (1,641), India (1,252) -4 , U.K. (1,121) 95 ** , -1 -22,197 ** , -1 -7.7 ** , -1<br />
Pakistan 34,290 2.8 ** , -2 0.2 ** , -2 U.K. (9,754), U.S.A. (5,176), Australia (3,078), Sweden (3,044), Canada (1,560) - ¹ ... … …<br />
Sri Lanka 16,135 6.4 ** 1.0 ** Australia (4,153), U.K. (3,904), U.S.A. (2,931), Japan (929), Malaysia (812) - ¹ ... … …<br />
SUB-SAHARAN AFRICA<br />
Angola 7,052 ** 10.6 ** 0.4 ** Portugal (1,654), Brazil (1,631), South Africa (1,135) - ¹, U.S.A. (610), Russian Fed. (382) - ¹ 6,530 ** -522 ** -0.8 **<br />
Benin 3,549 4.2 ** , -1 0.4 ** , -1 France (1,930), U.S.A. (339), Canada (219) - ¹, Morocco (186), Germany (121) ... … …<br />
Botswana 8,562 ... ... South Africa (4,849) - ¹, Malaysia (1,598) - ¹, U.K. (668), Australia (364), Canada (240) - ¹ ... … …<br />
Burkina Faso 2,925 ** 5.7 ** 0.2 ** France (1,197), U.S.A. (674), Morocco (220), Canada (216) - ¹, Niger (96) 2,187 ** , +1 -745 ** , +1 -1.2 ** , +1<br />
Burundi 1,218 ** 4.2 ** 0.1 ** France (384), U.S.A. (112), Canada (111) - ¹, Norway (90), Russian Fed. (82) - ¹ 1,813 ** 595 ** 2.0 **<br />
Cameroon 20,093 ** 9.1 ** 1.0 ** France (6,264), Germany (5,121), Italy (2,292), U.S.A. (1,864), Belgium (671) 1,854 ** -18,239 ** -8.3 **<br />
Cape Verde 5,176 51.0 ** 9.1 ** Angola (1,959), Portugal (1,774), Brazil (892), France (158), Spain (94) ... … …<br />
Central African Republic 1,075 9.6 ** 0.2 ** France (591), Ireland (177), Morocco (105), Cameroon (69), U.S.A. (32) ... … …
OPPORTUNITIES LOST: THE IMPACT OF GRADE REPETITION AND EARLY SCHOOL LEAVING<br />
REGION<br />
Country or territory<br />
Students from given country<br />
studying abroad (outbound<br />
mobile students)<br />
Outbound<br />
mobility ratio<br />
(%)<br />
Gross<br />
outbound<br />
enrolment<br />
ratio<br />
Top five destinations (host countries) for outbound mobile<br />
students (the number of students from given country studying<br />
in the host countries is shown in brackets)<br />
Number of students<br />
from abroad<br />
studying in given<br />
country (inbound<br />
mobile students)<br />
Net flow of mobile<br />
students<br />
(inbound - outbound)<br />
MF<br />
MF<br />
(1) (2) (3) (4) (5) (6) (7)<br />
Net flow<br />
ratio (%)<br />
Chad 3,205 ** 14.5 ** 0.3 ** Cameroon (1,336), France (441), C. African Rep. (397) -4 , Morocco (235), Russian Fed. (168) - ¹ 80 ** , -2 -2,967 ** , -2 -15.6 ** , -2<br />
Comoros 3,100 ** 60.9 ** 4.8 ** France (1,493), Madagascar (1,157), Morocco (232), Spain (64), U.S.A. (50) . -3,100 -60.9<br />
Congo 5,986 ** 29.4 ** 1.6 ** France (2,872), Burundi (999), Italy (368), Morocco (317), Russian Fed. (296) - ¹ 39 ** -5,947 ** -29.2 **<br />
Côte d’Ivoire 6,197 ... ... France (3,544), U.S.A. (859), Morocco (354), Canada (354) - ¹, Germany (182) ... … …<br />
Democratic Republic of the Congo 5,426 ** 1.4 ** , -1 0.1 ** , -1 South Africa (1,815) - ¹, Angola (1,306), France (757), U.S.A. (247), Italy (158) 914 ** , -2 -4,166 ** , -2 -1.3 ** , -2<br />
Equatorial Guinea 1,197 ... ... Spain (711), Russian Fed. (121) - ¹, Cuba (88), U.S.A. (77), Morocco (52) ... … …<br />
Eritrea 869 8.5 ** 0.2 ** U.S.A. (163), Saudi Arabia (140), Jordan (101), Italy (91), Malaysia (74) - ¹ ... … …<br />
Ethiopia 5,093 1.2 ** 0.1 ** U.S.A. (1,539), Finland (467), Germany (350), Sweden (325), Norway (299) ... … …<br />
Gabon 5,793 ... ... France (4,205), South Africa (327) - ¹, U.S.A. (303), Canada (189) - ¹, Germany (187) ... … …<br />
Gambia 970 15.5 ** , -2 0.6 ** , -2 U.K. (305), U.S.A. (296), Venezuela (55) - ², Canada (42) - ¹, Malaysia (33) - ¹ ... … …<br />
Ghana 7,845 ** 3.8 ** , -1 0.3 ** , -1 U.S.A. (2,925), U.K. (1,881), Finland (395), Germany (313), Canada (306) - ¹ 5,682 ** , +1 -2,188 ** , +1 -0.8 ** , +1<br />
Guinea 5,494 ** 5.5 ** , -2 0.5 ** , -2 France (3,631), Morocco (518), Spain (178), U.S.A. (178), Canada (162) - ¹ 748 ** , -2 -3,652 ** , -2 -4.6 ** , -2<br />
Guinea-Bissau 2,115 ... ... Brazil (830), Angola (653), Russian Fed. (114) - ¹, Portugal (114), Morocco (99) ... … …<br />
Kenya 13,285 8.1 ** , -1 0.3 ** , -1 U.S.A. (5,336), U.K. (2,410), Australia (1,411), Malaysia (618) - ¹, India (508) -4 ... … …<br />
Lesotho 4,206 ... ... South Africa (4,004) - ¹, U.S.A. (48), Cuba (33), U.K. (29), Australia (15) ... … …<br />
Liberia 583 ... ... U.S.A. (229), Norway (61), Ghana (53)¹, Morocco (48), Saudi Arabia (35) ... … …<br />
Madagascar 4,128 ** 5.5 ** 0.2 ** France (3,465), U.S.A. (141), Morocco (112), Canada (78) - ¹, Germany (60) 1,313 ** -2,815 ** -3.8 **<br />
Malawi 2,053 ** 19.9 ** 0.1 ** South Africa (854) - ¹, U.K. (466), U.S.A. (272), Australia (94), Namibia (54) - ² 117 ** -1,936 ** -18.8 **<br />
Mali 3,825 ** 4.7 ** 0.3 ** France (1,940), U.S.A. (496), Morocco (450), Canada (225) - ¹, Niger (202) 462 ** , +1 -3,370 ** , +1 -3.8 ** , +1<br />
Mauritius 7,631 ** 30.1 ** , -2 7.5 ** , -2 France (1,658), U.K. (1,556), Australia (1,533), South Africa (1,108) - ¹, India (497) -4 62 ** , -1 -7,858 ** , -1 …<br />
Mozambique 2,715 ... ... South Africa (823) - ¹, Angola (653), Portugal (492), Brazil (122), U.S.A. (87) ... … …<br />
Namibia 7,832 ** 42.5 ** , -2 3.8 ** , -2 South Africa (7,264) - ¹, Cuba (141), Russian Fed. (99) - ¹, U.S.A. (75), U.K. (66) 2,004 ** , -2 -6,374 ** , -2 -32.3 ** , -2<br />
Niger 2,235 ** 13.1 ** 0.2 ** France (740), Morocco (305), Togo (234) - ³, U.S.A. (226), Malaysia (190) - ¹ 1,125 ** -1,110 ** -6.5 **<br />
Nigeria 38,851 ... ... U.K. (16,486), U.S.A. (6,510), Malaysia (5,443) - ¹, Ghana (1,649)¹, Canada (1,302) - ¹ ... … …<br />
Rwanda 2,756 4.4 ** 0.2 ** Burundi (697), France (599), U.S.A. (447), South Africa (193) - ¹, Canada (93) - ¹ ... … …<br />
Sao Tome and Principe 2,442 ** 318.8 ** 14.3 ** Angola (1,959), Portugal (187), Brazil (100), Cuba (80), Morocco (44) . -2 … …<br />
Senegal 11,928 13.0 ** 1.0 ** France (9,278), U.S.A. (618), Canada (612) - ¹, Morocco (504), Germany (165) ... … …<br />
Seychelles 398 ** ... 6.9 ** , -2 U.K. (104), Australia (49), South Africa (48) - ¹, France (41), Ireland (37) . -2 … …<br />
Sierra Leone 684 ... ... U.K. (201), U.S.A. (171), Saudi Arabia (47), Ghana (38)¹, Germany (31) ... … …<br />
Somalia 2,110 ... ... Malaysia (1,030) - ¹, Saudi Arabia (194), Jordan (163), U.K. (98), Qatar (90) ... … …<br />
South Africa 6,166 ** ... ... U.S.A. (1,641), U.K. (1,543), Australia (839), Cuba (377), Malaysia (198) - ¹ 60,856 ** , -1 54,629 ** , -1 …<br />
Swaziland 3,870 ... ... South Africa (3,453) - ¹, U.S.A. (139), Zimbabwe (131), U.K. (39), Russian Fed. (29) - ¹ ... … …<br />
Togo 2,878 ... ... France (1,326), U.S.A. (307), Germany (301), Italy (207), Morocco (191) ... … …<br />
Uganda 3,364 2.9 ** , -1 0.1 ** , -1 U.K. (961), U.S.A. (844), Malaysia (370) - ¹, Canada (150) - ¹, Germany (124) ... … …<br />
United Republic of Tanzania 5,610 6.6 ** 0.1 ** U.K. (1,119), U.S.A. (1,088), Malaysia (672) - ¹, South Africa (651) - ¹, Russian Fed. (303) - ¹ ... … …<br />
Zambia 4,951 ... ... South Africa (1,529) - ¹, U.S.A. (635), U.K. (606), Australia (510), Namibia (419) - ² ... … …<br />
Zimbabwe 19,658 ** 20.8 ** 1.3 ** South Africa (14,359) - ¹, U.K. (1,413), U.S.A. (1,149), Australia (1,132), Malaysia (460) - ¹ 884 ** -18,774 ** -19.8 **<br />
REGIONAL AVERAGES v<br />
WORLD 3,572,840 ** 2.0 ** 0.6 **<br />
Arab States 249,277 ** 3.1 ** 0.7 **<br />
Central and Eastern Europe 387,245 ** 1.8 ** 1.2 **<br />
Central Asia 120,795 ** 5.8 ** 1.4 **<br />
East Asia and the Pacific 1,008,732 ** 1.8 ** 0.5 **<br />
Latin America and the Caribbean 196,888 ** 0.9 ** 0.4 **<br />
North America and Western Europe 542,654 ** 1.5 ** 1.1 **<br />
South and West Asia 343,377 ** 1.2 ** 0.2 **<br />
Sub-Saharan Africa 257,099 ** 4.9 ** 0.3 **<br />
North America and Western Europe (57.7%), East Asia and the Pacific (21.1%), Central and<br />
Eastern Europe (9.0%), Arab States (6.1%), Sub-Saharan Africa (2.5%), Latin America and<br />
the Caribbean (2.0%), Central Asia (1.2%), South and West Asia (0.5%)<br />
North America and Western Europe (65.0%), Arab States (18.0%), East Asia and the Pacific<br />
(8.7%), Central and Eastern Europe (6.3%), South and West Asia (1.7%), Central Asia (0.2%),<br />
Latin America and the Caribbean (0.2%), Sub-Saharan Africa (0.1%)<br />
North America and Western Europe (60.8%), Central and Eastern Europe (34.5%), Central Asia<br />
(3.1%), East Asia and the Pacific (1.3%), Arab States (0.2%), Latin America and the Caribbean<br />
(0.1%), South and West Asia (0.03%), Sub-Saharan Africa (0.02%)<br />
Central and Eastern Europe (60.0%), Central Asia (17.6%), North America and Western Europe<br />
(16.4%), East Asia and the Pacific (4.7%), Arab States (1.5%), South and West Asia (0.2%), Latin<br />
America and the Caribbean (0.03%), Sub-Saharan Africa (0.001%)<br />
North America and Western Europe (51.6%), East Asia and the Pacific (44.2%), Central and<br />
Eastern Europe (2.9%), Latin America and the Caribbean (0.4%), Central Asia (0.4%), Arab States<br />
(0.3%), South and West Asia (0.2%), Sub-Saharan Africa (0.01%)<br />
North America and Western Europe (75.1%), Latin America and the Caribbean (20.8%), East Asia<br />
and the Pacific (3.3%), Central and Eastern Europe (0.7%), Arab States (0.1%), South and West<br />
Asia (0.02%), Central Asia (0.01%), Sub-Saharan Africa (0.002%)<br />
North America and Western Europe (86.4%), East Asia and the Pacific (6.1%), Central and Eastern<br />
Europe (4.8%), Latin America and the Caribbean (1.6%), Arab States (0.9%), South and West<br />
Asia (0.1%), Sub-Saharan Africa (0.1%), Central Asia (0.03%)<br />
North America and Western Europe (71.1%), East Asia and the Pacific (19.6%), Central and<br />
Eastern Europe (4.4%), South and West Asia (1.8%), Central Asia (1.4%), Arab States (1.3%),<br />
Latin America and the Caribbean (0.4%), Sub-Saharan Africa (0.007%)<br />
North America and Western Europe (58.2%), Sub-Saharan Africa (24.4%), East Asia and the<br />
Pacific (8.0%), Arab States (3.2%), Central and Eastern Europe (2.9%), Latin America and the<br />
Caribbean (2.5%), South and West Asia (0.8%), Central Asia (0.01%)<br />
3,572,840 — —<br />
219,389 -29,888 ** -0.4 **<br />
321,270 -65,975 ** -0.3 **<br />
43,782 -77,013 ** -3.7 **<br />
752,253 -256,479 ** -0.5 **<br />
68,306 -128,582 ** -0.6 **<br />
2,060,749 1,518,095 ** 4.1 **<br />
17,629 -325,748 ** -1.2 **<br />
89,462 -167,637 ** -3.2 **<br />
World not specified l 466,772 ** . . . . . .<br />
137
TABLE<br />
11<br />
TERTIARY EDUCATION / ISCED 5 and 6 / Graduates by broad fields of education / 2010<br />
Graduates by field of education as a percentage of total<br />
REGION<br />
Graduates<br />
Total<br />
Science and technology fields<br />
Science<br />
Engineering, manufacturing<br />
and construction<br />
Other fields<br />
Total<br />
138<br />
Country or territory<br />
ARAB STATES<br />
MF (000) %F MF %F MF %F MF %F MF %F<br />
(1) (2) (3) (4) (5) (6) (7) (8) (9) (10)<br />
Algeria 158 61 28 49 14 65 14 32 72 66<br />
Bahrain ... ... ... ... ... ... ... ... ... ...<br />
Djibouti 1 -1 ... 46 -1 ... 28 -1 ... 19 -1 ... 54 -1 ...<br />
Egypt d 414 51 ... ... ... ... ... ... ... ...<br />
Iraq ... ... ... ... ... ... ... ... ... ...<br />
Jordan d ... ... ... ... ... ... ... ... ... ...<br />
Kuwait ... ... ... ... ... ... ... ... ... ...<br />
Lebanon 35 56 25 43 12 62 13 26 75 60<br />
Libya ... ... ... ... ... ... ... ... ... ...<br />
Mauritania ... ... ... ... ... ... . . ... ...<br />
Morocco 76 47 35 38 23 45 12 26 64 52<br />
Oman 14 59 39 50 22 67 17 29 61 64<br />
Palestine 30 59 17 44 9 54 7 30 83 61<br />
Qatar 2 63 24 44 7 63 17 35 76 70<br />
Saudi Arabia 123 -1 57 -1 25 -1 58 -1 20 -1 69 -1 4 -1 6 -1 73 -1 57 -1<br />
Sudan (pre-secession) a ... ... ... ... ... ... ... ... ... ...<br />
Syrian Arab Republic ... ... ... ... ... ... ... ... ... ...<br />
Tunisia d 66 -1 63 -1 ... ... ... ... ... ... ... ...<br />
United Arab Emirates 16 -1 60 -1 … … 16 -1 64 -1 11 -1 20 -1 … …<br />
Yemen ... ... ... ... ... ... ... ... ... ...<br />
CENTRAL AND EASTERN EUROPE<br />
Albania ... ... ... ... ... ... ... ... ... ...<br />
Belarus 120 ... 27 ... 2 ... 24 ... 73 ...<br />
Bosnia and Herzegovina 16 -2 59 -2 ... ... ... ... ... ... ... ...<br />
Bulgaria e 61 61 20 39 5 54 15 34 80 66<br />
Croatia e 34 60 20 38 8 53 12 28 80 66<br />
Czech Republic e 96 -1 60 -1 24 -1 31 -1 9 -1 39 -1 14 -1 26 -1 72 -1 70 -1<br />
Estonia e 11 -1 70 -1 19 -1 40 -1 9 -1 45 -1 10 -1 36 -1 81 -1 78 -1<br />
Hungary e 68 -1 66 -1 15 -1 29 -1 6 -1 35 -1 8 -1 24 -1 85 -1 73 -1<br />
Latvia e 27 71 14 32 5 40 9 27 86 78<br />
Lithuania e 45 66 21 29 5 37 16 26 79 76<br />
Montenegro ... ... ... ... ... ... ... ... ... ...<br />
Poland e 575 -1 65 -1 16 -1 38 -1 7 -1 44 -1 9 -1 34 -1 84 -1 70 -1<br />
Republic of Moldova 34 60 ... ... ... ... ... ... ... ...<br />
Romania e 305 63 17 40 5 56 12 33 83 68<br />
Russian Federation e 2,064 -1 1 -1 28 -1 ... 6 -1 ... 22 -1 ... 70 -1 ...<br />
Serbia 44 61 24 41 8 45 16 40 76 66<br />
Slovakia e 77 64 21 36 8 43 13 31 79 72<br />
Slovenia e 18 -1 61 -1 18 -1 25 -1 5 -1 36 -1 14 -1 22 -1 82 -1 69 -1<br />
The former Yugoslav Rep. of Macedonia (e) 11 56 19 39 12 39 8 40 81 60<br />
Turkey e 489 -1 46 -1 21 -1 30 -1 8 -1 42 -1 13 -1 23 -1 79 -1 50 -1<br />
Ukraine 650 ... 26 ... 5 ... 21 ... 72 ...<br />
CENTRAL ASIA<br />
Armenia 35 61 16 38 8 49 8 29 80 67<br />
Azerbaijan 51 54 17 43 10 56 7 24 83 56<br />
Georgia 38 -1 ... ... ... ... ... ... ... ... ...<br />
Kazakhstan ... ... ... ... ... ... ... ... ... ...<br />
Kyrgyzstan 44 -1 61 -1 15 -1 42 -1 5 -1 51 -1 10 -1 38 -1 83 -1 65 -1<br />
Mongolia 34 65 17 43 5 48 12 40 83 69<br />
Tajikistan 24 ... 26 ... 13 ... 13 ... 74 ...<br />
Turkmenistan ... ... ... ... ... ... ... ... ... ...<br />
Uzbekistan 77 +1 44 +1 21 +1 28 +1 8 +1 59 +1 14 +1 11 +1 79 +1 49 +1<br />
EAST ASIA AND THE PACIFIC<br />
Australia e 307 -2 56 -2 18 -2 30 -2 10 -2 36 -2 8 -2 24 -2 82 -2 61 -2<br />
Brunei Darussalam 2 62 22 42 12 54 10 28 74 68<br />
Cambodia 17 -2 27 -2 12 -2 10 -2 9 -2 11 -2 3 -2 5 -2 88 -2 30 -2<br />
China d 7,864 49 ... ... ... ... ... ... ... ...
OPPORTUNITIES LOST: THE IMPACT OF GRADE REPETITION AND EARLY SCHOOL LEAVING<br />
Graduates by field of education as a percentage of total<br />
<strong>Education</strong><br />
Humanities and arts<br />
Social science, business<br />
and law<br />
Other fields<br />
Agriculture Health and welfare Services<br />
Not known or<br />
unspecified<br />
MF %F MF %F MF %F MF %F MF %F MF %F MF %F<br />
(11) (12) (13) (14) (15) (16) (17) (18) (19) (20) (21) (22) (23) (24)<br />
ARAB STATES<br />
2 72 19 77 41 64 2 51 5 63 3 31 — .<br />
... ... ... ... ... ... ... ... ... ... ... ... ... ...<br />
— -1 . -1 31 -1 ... 17 -1 ... — -1 . -1 — -1 . -1 5 -1 ... — -1 . -1<br />
... ... ... ... ... ... ... ... ... ... ... ... ... ...<br />
... ... ... ... ... ... ... ... ... ... ... ... ... ...<br />
... ... ... ... ... ... ... ... ... ... ... ... ... ...<br />
... ... ... ... ... ... ... ... ... ... ... ... ... ...<br />
5 89 12 71 46 52 - 63 12 67 1 56 — —<br />
... ... ... ... ... ... ... ... ... ... ... ... ... ...<br />
... ... ... ... ... ... . . ... ... . . ... ...<br />
6 20 13 52 33 56 1 34 6 69 5 52 1 34<br />
9 66 16 75 25 56 1 57 10 70 1 52 — .<br />
33 75 11 69 31 48 — 15 9 52 - 36 — .<br />
6 61 21 84 37 67 . . 8 84 4 12 . .<br />
7 -1 49 -1 41 -1 56 -1 15 -1 66 -1 — -1 58 -1 9 -1 54 -1 — -1 — -1 3 -1 40 -1<br />
... ... ... ... ... ... ... ... ... ... ... ... ... ...<br />
... ... ... ... ... ... ... ... ... ... ... ... ... ...<br />
... ... ... ... ... ... ... ... ... ... ... ... ... ...<br />
13 -1 79 -1 7 -1 82 -1 44 -1 55 -1 2 -1 67 -1 5 -1 83 -1 — -1 . -1 2 -1 85 -1<br />
... ... ... ... ... ... ... ... ... ... ... ... ... ...<br />
CENTRAL AND EASTERN EUROPE<br />
... ... ... ... ... ... ... ... ... ... ... ... ... ...<br />
13 ... 5 ... 39 ... 8 ... 4 ... 4 ... — ...<br />
... ... ... ... ... ... ... ... ... ... ... ... ... ...<br />
5 74 7 70 52 67 2 48 7 71 8 51 — .<br />
5 94 12 74 44 67 3 51 7 76 9 32 — .<br />
14 -1 79 -1 7 -1 69 -1 33 -1 67 -1 4 -1 57 -1 9 -1 83 -1 5 -1 48 -1 4 -1 59 -1<br />
8 -1 93 -1 11 -1 80 -1 39 -1 75 -1 2 -1 53 -1 11 -1 92 -1 9 -1 62 -1 — -1 . -1<br />
13 -1 78 -1 12 -1 74 -1 40 -1 72 -1 2 -1 51 -1 10 -1 81 -1 8 -1 62 -1 — -1 . -1<br />
8 88 7 84 54 75 1 57 9 93 6 62 — 95<br />
11 81 7 75 46 75 2 58 10 85 3 52 — .<br />
... ... ... ... ... ... ... ... ... ... ... ... ... ...<br />
16 -1 78 -1 8 -1 76 -1 44 -1 68 -1 2 -1 56 -1 9 -1 73 -1 6 -1 55 -1 — -1 . -1<br />
... ... ... ... ... ... ... ... ... ... ... ... ... ...<br />
1 90 8 70 60 68 2 40 9 73 3 46 — .<br />
9 -1 ... 4 -1 ... 46 -1 ... 2 -1 ... 5 -1 ... 5 -1 ... 2 -1 ...<br />
9 91 10 75 37 62 3 47 9 75 8 48 — .<br />
14 78 7 69 32 69 2 47 19 84 6 45 — .<br />
8 -1 87 -1 6 -1 71 -1 47 -1 69 -1 3 -1 59 -1 8 -1 82 -1 10 -1 48 -1 — -1 . -1<br />
10 75 13 66 38 57 2 28 11 74 6 32 — .<br />
15 -1 55 -1 7 -1 53 -1 41 -1 48 -1 6 -1 57 -1 6 -1 65 -1 5 -1 27 -1 — -1 . -1<br />
9 ... 5 ... 44 ... 4 ... 5 ... 5 ... 1 ...<br />
CENTRAL ASIA<br />
16 83 26 66 19 57 4 39 13 77 2 17 4 50<br />
18 91 20 76 30 26 — 27 8 78 8 15 — .<br />
... ... ... ... ... ... ... ... ... ... ... ... ... ...<br />
... ... ... ... ... ... ... ... ... ... ... ... ... ...<br />
20 -1 87 -1 6 -1 69 -1 38 -1 55 -1 2 -1 29 -1 11 -1 79 -1 6 -1 29 -1 2 -1 58 -1<br />
15 83 10 74 41 65 2 67 8 85 6 39 — 100<br />
5 ... 32 ... 30 ... 3 ... 4 ... 1 ... — ...<br />
... ... ... ... ... ... ... ... ... ... ... ... ... ...<br />
37 +1 60 +1 12 +1 68 +1 19 +1 23 +1 4 +1 16 +1 5 +1 53 +1 3 +1 32 +1 — +1 50 +1<br />
EAST ASIA AND THE PACIFIC<br />
9 -2 74 -2 10 -2 63 -2 44 -2 54 -2 1 -2 49 -2 15 -2 77 -2 3 -2 53 -2 — -2 67 -2<br />
42 69 9 61 12 68 — . 11 72 . . 4 71<br />
2 -2 24 -2 14 -2 31 -2 66 -2 31 -2 2 -2 20 -2 3 -2 23 -2 — -2 56 -2 — -2 . -2<br />
... ... ... ... ... ... ... ... ... ... ... ... ... ...<br />
139
TABLE<br />
11<br />
TERTIARY EDUCATION / ISCED 5 and 6 / Graduates by broad fields of education / 2010<br />
Graduates by field of education as a percentage of total<br />
REGION<br />
Graduates<br />
Total<br />
Science and technology fields<br />
Science<br />
Engineering, manufacturing<br />
and construction<br />
Other fields<br />
Total<br />
140<br />
Country or territory<br />
MF (000) %F MF %F MF %F MF %F MF %F<br />
(1) (2) (3) (4) (5) (6) (7) (8) (9) (10)<br />
China, Hong Kong SAR ... ... ... ... ... ... ... ... ... ...<br />
China, Macao SAR 7 52 5 15 3 15 2 16 95 54<br />
Cook Islands . +1 . +1 . +1 . +1 . +1 . +1 . +1 . +1 . +1 . +1<br />
Democratic People’s Republic of Korea ... ... ... ... ... ... ... ... ... ...<br />
Fiji ... ... ... ... ... ... ... ... ... ...<br />
Indonesia d 811 ... 23 ... 6 ... 17 ... ... ...<br />
Japan e 967 49 21 14 3 26 17 12 73 57<br />
Kiribati . -2 . -2 . -2 . -2 . -2 . -2 . -2 . -2 . -2 . -2<br />
Lao People’s Democratic Republic 11 37 21 24 7 34 14 18 79 41<br />
Malaysia d 227 -1 59 -1 38 -1 42 -1 14 -1 56 -1 24 -1 33 -1 62 -1 70 -1<br />
Marshall Islands ... ... ... ... ... ... ... ... ... ...<br />
Micronesia (Federated States of) ... ... ... ... ... ... ... ... ... ...<br />
Myanmar ... ... ... ... ... ... ... ... ... ...<br />
Nauru ... ... ... ... ... ... ... ... ... ...<br />
New Zealand e 61 -1 59 -1 19 -1 35 -1 13 -1 38 -1 6 -1 28 -1 76 -1 66 -1<br />
Niue . -2 . -2 . -2 . -2 . -2 . -2 . -2 . -2 . -2 . -2<br />
Palau ... ... ... ... ... ... ... ... ... ...<br />
Papua New Guinea ... ... ... ... ... ... ... ... ... ...<br />
Philippines d ... ... ... ... ... ... ... ... ... ...<br />
Republic of Korea e 595 -1 50 -1 31 -1 27 -1 8 -1 37 -1 24 -1 24 -1 69 -1 60 -1<br />
Samoa ... ... ... ... ... ... ... ... ... ...<br />
Singapore ... ... ... ... ... ... ... ... ... ...<br />
Solomon Islands . -2 . -2 . -2 . -2 . -2 . -2 . -2 . -2 . -2 . -2<br />
Thailand d 541 -1 56 -1 ... ... ... ... ... ... ... ...<br />
Timor-Leste ... ... ... ... ... ... ... ... ... ...<br />
Tokelau . -2 . -2 . -2 . -2 . -2 . -2 . -2 . -2 . -2 . -2<br />
Tonga ... ... ... ... ... ... ... ... ... ...<br />
Tuvalu . -2 . -2 . -2 . -2 . -2 . -2 . -2 . -2 . -2 . -2<br />
Vanuatu ... ... ... ... ... ... ... ... ... ...<br />
Viet Nam 273 45 17 23 - . 17 23 80 50<br />
LATIN AMERICA AND THE CARIBBEAN<br />
Anguilla ... ... ... ... ... ... ... ... ... ...<br />
Antigua and Barbuda 0.2 81 9 71 9 71 - . 91 82<br />
Argentina e 208 -1 64 -1 14 -1 44 -1 7 -1 54 -1 7 -1 35 -1 85 -1 68 -1<br />
Aruba 0.3 67 21 8 . . 21 8 79 82<br />
Bahamas ... ... ... ... ... ... ... ... ... ...<br />
Barbados 2 ... 9 53 6 49 3 61 91 ...<br />
Belize ... ... ... ... ... ... ... ... ... ...<br />
Bermuda 0.1 73 22 38 15 57 7 - 73 83<br />
Bolivia (Plurinational State of) ... ... ... ... ... ... ... ... ... ...<br />
Brazil e 1,025 60 11 29 5 31 6 28 84 65<br />
British Virgin Islands 0.1 -1 64 -1 27 -1 56 -1 18 -1 73 -1 9 -1 23 -1 64 -1 68 -1<br />
Cayman Islands 0.2 -2 62 -2 35 -2 33 -2 17 -2 28 -2 18 -2 38 -2 65 -2 77 -2<br />
Chile e 122 -1 55 -1 20 -1 21 -1 6 -1 24 -1 15 -1 20 -1 80 -1 64 -1<br />
Colombia 190 56 23 37 9 42 14 34 77 62<br />
Costa Rica ... ... ... ... ... ... ... ... ... ...<br />
Cuba 148 57 ... ... ... ... ... ... ... ...<br />
Dominica ... ... ... ... ... ... ... ... ... ...<br />
Dominican Republic ... ... ... ... ... ... ... ... ... ...<br />
Ecuador 70 -2 59 -2 13 -2 32 -2 6 -2 41 -2 7 -2 25 -2 87 -2 63 -2<br />
El Salvador 17 59 26 31 15 39 11 20 74 69<br />
Grenada ... ... ... ... ... ... ... ... ... ...<br />
Guatemala ... ... ... ... ... ... ... ... ... ...<br />
Guyana 2 74 14 25 6 42 9 13 86 82<br />
Haiti ... ... ... ... ... ... ... ... ... ...<br />
Honduras 14 -2 60 -2 ... ... ... ... ... ... ... ...<br />
Jamaica d 25 -1 56 -1 ... ... ... ... ... ... ... ...<br />
Mexico e 466 54 25 33 6 48 19 28 74 62
OPPORTUNITIES LOST: THE IMPACT OF GRADE REPETITION AND EARLY SCHOOL LEAVING<br />
Graduates by field of education as a percentage of total<br />
<strong>Education</strong><br />
Humanities and arts<br />
Social science, business<br />
and law<br />
Other fields<br />
Agriculture Health and welfare Services<br />
Not known or<br />
unspecified<br />
MF %F MF %F MF %F MF %F MF %F MF %F MF %F<br />
(11) (12) (13) (14) (15) (16) (17) (18) (19) (20) (21) (22) (23) (24)<br />
... ... ... ... ... ... ... ... ... ... ... ... ... ...<br />
5 67 7 77 64 46 — . 6 69 13 67 — .<br />
... ... ... ... ... ... ... ... ... ... ... ... ... ...<br />
... ... ... ... ... ... ... ... ... ... ... ... ... ...<br />
... ... ... ... ... ... ... ... ... ... ... ... ... ...<br />
20 ... — ... 39 ... 6 ... 6 ... ... ... 6 ...<br />
7 72 15 69 27 39 3 38 13 63 9 79 7 58<br />
. -2 . -2 . -2 . -2 . -2 . -2 . -2 . -2 . -2 . -2 . -2 . -2 . -2 . -2<br />
1 35 12 48 51 40 6 27 4 60 5 33 — .<br />
17 -1 70 -1 4 -1 68 -1 31 -1 69 -1 1 -1 63 -1 8 -1 78 -1 3 -1 66 -1 1 -1 62 -1<br />
... ... ... ... ... ... ... ... ... ... ... ... ... ...<br />
... ... ... ... ... ... ... ... ... ... ... ... ... ...<br />
... ... ... ... ... ... ... ... ... ... ... ... ... ...<br />
... ... ... ... ... ... ... ... ... ... ... ... ... ...<br />
12 -1 82 -1 14 -1 64 -1 32 -1 58 -1 1 -1 58 -1 13 -1 79 -1 4 -1 55 -1 5 -1 38 -1<br />
. -2 . -2 . -2 . -2 . -2 . -2 . -2 . -2 . -2 . -2 . -2 . -2 . -2 . -2<br />
... ... ... ... ... ... ... ... ... ... ... ... ... ...<br />
... ... ... ... ... ... ... ... ... ... ... ... ... ...<br />
... ... ... ... ... ... ... ... ... ... ... ... ... ...<br />
8 -1 76 -1 18 -1 67 -1 21 -1 46 -1 1 -1 40 -1 14 -1 71 -1 6 -1 46 -1 — -1 . -1<br />
... ... ... ... ... ... ... ... ... ... ... ... ... ...<br />
... ... ... ... ... ... ... ... ... ... ... ... ... ...<br />
. -2 . -2 . -2 . -2 . -2 . -2 . -2 . -2 . -2 . -2 . -2 . -2 . -2 . -2<br />
... ... ... ... ... ... ... ... ... ... ... ... ... ...<br />
... ... ... ... ... ... ... ... ... ... ... ... ... ...<br />
. -2 . -2 . -2 . -2 . -2 . -2 . -2 . -2 . -2 . -2 . -2 . -2 . -2 . -2<br />
... ... ... ... ... ... ... ... ... ... ... ... ... ...<br />
. -2 . -2 . -2 . -2 . -2 . -2 . -2 . -2 . -2 . -2 . -2 . -2 . -2 . -2<br />
... ... ... ... ... ... ... ... ... ... ... ... ... ...<br />
28 52 4 47 33 54 8 41 4 39 3 19 4 37<br />
LATIN AMERICA AND THE CARIBBEAN<br />
... ... ... ... ... ... ... ... ... ... ... ... ... ...<br />
41 75 5 78 34 84 — . 11 100 — . — .<br />
18 -1 83 -1 10 -1 72 -1 35 -1 62 -1 3 -1 42 -1 16 -1 73 -1 4 -1 29 -1 — -1 68 -1<br />
12 90 . . 40 73 . . 28 93 . . . .<br />
... ... ... ... ... ... ... ... ... ... ... ... ... ...<br />
29 ... 7 83 40 76 . . 1 70 13 61 . .<br />
... ... ... ... ... ... ... ... ... ... ... ... ... ...<br />
14 92 9 78 44 83 — . — . 5 60 5 80<br />
... ... ... ... ... ... ... ... ... ... ... ... ... ...<br />
23 77 2 55 40 57 2 40 14 77 3 56 5 53<br />
4 -1 100 -1 4 -1 100 -1 38 -1 73 -1 — -1 . -1 8 -1 91 -1 10 -1 7 -1 9 -1 62 -1<br />
— -2 . -2 — -2 . -2 56 -2 77 -2 — -2 . -2 — -2 . -2 9 -2 80 -2 — -2 . -2<br />
18 -1 76 -1 5 -1 56 -1 30 -1 56 -1 3 -1 42 -1 18 -1 77 -1 6 -1 47 -1 — -1 71 -1<br />
15 68 3 53 49 60 1 42 8 68 — . — 52<br />
... ... ... ... ... ... ... ... ... ... ... ... ... ...<br />
... ... ... ... ... ... ... ... ... ... ... ... ... ...<br />
... ... ... ... ... ... ... ... ... ... ... ... ... ...<br />
... ... ... ... ... ... ... ... ... ... ... ... ... ...<br />
22 -2 70 -2 1 -2 58 -2 48 -2 60 -2 3 -2 30 -2 10 -2 69 -2 3 -2 66 -2 — -2 . -2<br />
15 76 3 58 35 61 1 30 19 81 — 57 . .<br />
... ... ... ... ... ... ... ... ... ... ... ... ... ...<br />
... ... ... ... ... ... ... ... ... ... ... ... ... ...<br />
39 86 1 76 25 71 1 65 18 90 2 82 — .<br />
... ... ... ... ... ... ... ... ... ... ... ... ... ...<br />
... ... ... ... ... ... ... ... ... ... ... ... ... ...<br />
... ... ... ... ... ... ... ... ... ... ... ... ... ...<br />
12 73 4 59 47 60 2 35 9 66 1 27 — 69<br />
141
TABLE<br />
11<br />
TERTIARY EDUCATION / ISCED 5 and 6 / Graduates by broad fields of education / 2010<br />
Graduates by field of education as a percentage of total<br />
REGION<br />
Graduates<br />
Total<br />
Science and technology fields<br />
Science<br />
Engineering, manufacturing<br />
and construction<br />
Other fields<br />
Total<br />
142<br />
Country or territory<br />
MF (000) %F MF %F MF %F MF %F MF %F<br />
(1) (2) (3) (4) (5) (6) (7) (8) (9) (10)<br />
Montserrat ... ... ... ... ... ... ... ... ... ...<br />
Netherlands Antilles a ... ... ... ... ... ... ... ... ... ...<br />
Nicaragua ... ... ... ... ... ... ... ... ... ...<br />
Panama 22 -1 66 -1 19 -1 41 -1 5 -1 51 -1 15 -1 37 -1 81 -1 72 -1<br />
Paraguay d ... ... ... ... ... ... ... ... ... ...<br />
Peru d ... ... ... ... ... ... ... ... ... ...<br />
Puerto Rico 30 -1 66 -1 17 -1 38 -1 8 -1 52 -1 9 -1 26 -1 83 -1 72 -1<br />
Saint Kitts and Nevis ... ... ... ... ... ... ... ... ... ...<br />
Saint Lucia ... ... ... ... ... ... ... ... ... ...<br />
Saint Vincent and the Grenadines ... ... ... ... ... ... ... ... ... ...<br />
Suriname ... ... ... ... ... ... ... ... ... ...<br />
Trinidad and Tobago ... ... ... ... ... ... ... ... ... ...<br />
Turks and Caicos Islands ... ... ... ... ... ... ... ... ... ...<br />
Uruguay e 9 -1 66 -1 14 -1 45 -1 7 -1 49 -1 7 -1 40 -1 86 -1 69 -1<br />
Venezuela (Bolivarian Republic of) ... ... ... ... ... ... ... ... ... ...<br />
NORTH AMERICA AND WESTERN EUROPE<br />
Andorra 0.04 -2 48 -2 24 -2 10 -2 24 -2 10 -2 — -2 . -2 76 -2 59 -2<br />
Austria e 52 -1 53 -1 29 -1 24 -1 11 -1 33 -1 18 -1 19 -1 71 -1 64 -1<br />
Belgium e 99 -1 59 -1 16 -1 27 -1 6 -1 33 -1 11 -1 24 -1 80 -1 65 -1<br />
Canada e ... ... ... ... ... ... ... ... ... ...<br />
Cyprus e 5 60 13 39 7 48 6 30 87 63<br />
Denmark e 49 -1 59 -1 20 -1 36 -1 8 -1 36 -1 12 -1 37 -1 80 -1 64 -1<br />
Finland e 51 60 32 28 8 46 24 21 68 75<br />
France e 621 -2 55 -2 26 -2 28 -2 11 -2 36 -2 16 -2 23 -2 74 -2 65 -2<br />
Germany e 573 58 26 31 13 44 13 18 74 68<br />
Gibraltar . -2 . -2 . -2 . -2 . -2 . -2 . -2 . -2 . -2 . -2<br />
Greece e 67 -2 59 -2 25 -2 42 -2 11 -2 47 -2 14 -2 38 -2 75 -2 65 -2<br />
Holy See ... ... ... ... ... ... ... ... ... ...<br />
Iceland e 3 -1 66 -1 15 37 6 -1 39 -1 8 -1 35 -1 85 71<br />
Ireland e 58 -1 57 -1 22 -1 31 -1 11 -1 43 -1 11 -1 18 -1 77 -1 64 -1<br />
Israel e ... ... ... ... ... ... ... ... ... ...<br />
Italy e ... ... ... ... ... ... ... ... ... ...<br />
Liechtenstein e 0.2 38 19 62 — . 19 62 82 32<br />
Luxembourg e 0.3 -2 49 -2 33 -2 48 -2 29 -2 55 -2 4 -2 — -2 65 -2 51 -2<br />
Malta e 3 59 16 32 9 33 7 31 83 64<br />
Monaco . -2 . -2 . -2 . -2 . -2 . -2 . -2 . -2 . -2 . -2<br />
Netherlands e 127 -1 57 -1 14 -1 20 -1 6 -1 21 -1 8 -1 19 -1 85 -1 63 -1<br />
Norway e 38 61 16 31 7 36 9 27 84 67<br />
Portugal e 77 -1 59 -1 29 -1 34 -1 11 -1 41 -1 17 -1 30 -1 71 67<br />
San Marino ... ... ... ... ... ... ... ... ... ...<br />
Spain e 310 -1 58 -1 25 -1 30 -1 9 -1 35 -1 16 -1 28 -1 74 -1 68 -1<br />
Sweden e 61 63 25 34 8 43 18 30 75 73<br />
Switzerland e 85 49 20 19 8 30 12 13 80 57<br />
United Kingdom e 674 -1 57 -1 22 -1 31 -1 13 -1 38 -1 9 -1 21 -1 77 -1 65 -1<br />
United States of America e 2,998 59 15 31 8 41 7 19 85 64<br />
SOUTH AND WEST ASIA<br />
Afghanistan 10 -1 19 -1 ... ... ... ... ... ... ... ...<br />
Bangladesh 185 -2 ... ... ... ... ... ... ... ... ...<br />
Bhutan ... ... ... ... ... ... ... ... ... ...<br />
India d ... ... ... ... ... ... ... ... ... ...<br />
Iran (Islamic Republic of) 769 48 44 37 6 67 39 33 56 57<br />
Maldives ... ... ... ... ... ... ... ... ... ...<br />
Nepal 55 ... 23 ... 6 ... 17 ... 77 ...<br />
Pakistan ... ... ... ... ... ... ... ... ... ...<br />
Sri Lanka d ... ... ... ... ... ... ... ... ... ...<br />
SUB-SAHARAN AFRICA<br />
Angola 6 31 12 40 7 31 5 53 88 30<br />
Benin 15 -1 31 -1 9 -1 19 -1 4 -1 27 -1 6 -1 14 -1 78 -1 32 -1
OPPORTUNITIES LOST: THE IMPACT OF GRADE REPETITION AND EARLY SCHOOL LEAVING<br />
Graduates by field of education as a percentage of total<br />
<strong>Education</strong><br />
Humanities and arts<br />
Social science, business<br />
and law<br />
Other fields<br />
Agriculture Health and welfare Services<br />
Not known or<br />
unspecified<br />
MF %F MF %F MF %F MF %F MF %F MF %F MF %F<br />
(11) (12) (13) (14) (15) (16) (17) (18) (19) (20) (21) (22) (23) (24)<br />
... ... ... ... ... ... ... ... ... ... ... ... ... ...<br />
... ... ... ... ... ... ... ... ... ... ... ... ... ...<br />
... ... ... ... ... ... ... ... ... ... ... ... ... ...<br />
23 -1 80 -1 6 -1 59 -1 38 -1 71 -1 1 -1 48 -1 7 -1 75 -1 5 -1 59 -1 — -1 . -1<br />
... ... ... ... ... ... ... ... ... ... ... ... ... ...<br />
... ... ... ... ... ... ... ... ... ... ... ... . .<br />
16 -1 80 -1 4 -1 62 -1 36 -1 67 -1 1 -1 49 -1 22 -1 80 -1 4 -1 55 -1 — -1 99 -1<br />
... ... ... ... ... ... ... ... ... ... ... ... ... ...<br />
... ... ... ... ... ... ... ... ... ... ... ... ... ...<br />
... ... ... ... ... ... ... ... ... ... ... ... ... ...<br />
... ... ... ... ... ... ... ... ... ... ... ... ... ...<br />
... ... ... ... ... ... ... ... ... ... ... ... ... ...<br />
... ... ... ... ... ... ... ... ... ... ... ... ... ...<br />
17 -1 84 -1 3 -1 72 -1 36 -1 66 -1 5 -1 31 -1 23 -1 75 -1 3 -1 19 -1 — -1 . -1<br />
... ... ... ... ... ... ... ... ... ... ... ... ... ...<br />
NORTH AMERICA AND WESTERN EUROPE<br />
— -2 . -2 — -2 . -2 40 -2 59 -2 — -2 . -2 36 -2 60 -2 — -2 . -2 — -2 . -2<br />
13 -1 82 -1 9 -1 66 -1 33 -1 58 -1 2 -1 41 -1 10 -1 69 -1 4 -1 58 -1 — -1 50 -1<br />
13 -1 76 -1 11 -1 61 -1 31 -1 58 -1 3 -1 48 -1 21 -1 75 -1 1 -1 57 -1 4 -1 57 -1<br />
... ... ... ... ... ... ... ... ... ... ... ... ... ...<br />
11 84 10 73 49 57 - - 8 56 9 65 — .<br />
7 -1 72 -1 14 -1 65 -1 29 -1 53 -1 2 -1 52 -1 25 -1 80 -1 3 -1 22 -1 — -1 . -1<br />
6 82 13 74 23 66 2 55 18 86 5 74 — .<br />
2 -2 71 -2 11 -2 71 -2 41 -2 63 -2 1 -2 38 -2 15 -2 73 -2 4 -2 47 -2 — -2 . -2<br />
9 77 16 73 22 54 2 40 21 79 3 54 — 68<br />
. -2 . -2 . -2 . -2 . -2 . -2 . -2 . -2 . -2 . -2 . -2 . -2 . -2 . -2<br />
8 -2 76 -2 13 -2 80 -2 30 -2 64 -2 4 -2 54 -2 12 -2 71 -2 8 -2 31 -2 — -2 . -2<br />
... ... ... ... ... ... ... ... ... ... ... ... ... ...<br />
21 -1 83 -1 11 -1 65 -1 40 -1 62 -1 — -1 27 -1 12 -1 85 -1 2 -1 85 -1 — -1 . -1<br />
11 -1 74 -1 16 -1 63 -1 31 -1 56 -1 1 -1 46 -1 14 -1 82 -1 5 -1 46 -1 1 -1 64 -1<br />
... ... ... ... ... ... ... ... ... ... ... ... ... ...<br />
... ... ... ... ... ... ... ... ... ... ... ... ... ...<br />
- . - . 81 32 - . 1 - - . - .<br />
— -2 . -2 15 -2 53 -2 48 -2 49 -2 — -2 . -2 - -2 . -2 2 -2 83 -2 2 -2 25 -2<br />
10 85 19 57 38 61 — 40 13 69 3 47 1 59<br />
. -2 . -2 . -2 . -2 . -2 . -2 . -2 . -2 . -2 . -2 . -2 . -2 . -2 . -2<br />
14 -1 81 -1 9 -1 57 -1 37 -1 52 -1 1 -1 52 -1 19 -1 75 -1 5 -1 53 -1 1 -1 61 -1<br />
18 74 9 59 29 56 1 61 22 83 5 46 — 51<br />
7 -1 84 -1 8 -1 62 -1 28 -1 62 -1 2 -1 55 -1 21 -1 78 -1 6 -1 47 -1 — -1 . -1<br />
... ... ... ... ... ... ... ... ... ... ... ... ... ...<br />
13 -1 82 -1 9 -1 61 -1 26 -1 63 -1 2 -1 47 -1 16 -1 77 -1 8 -1 54 -1 1 -1 52 -1<br />
15 79 6 60 24 64 1 71 25 83 3 65 - .<br />
10 70 8 61 37 48 2 45 16 75 7 42 1 58<br />
11 -1 76 -1 16 -1 62 -1 31 -1 55 -1 1 -1 62 -1 18 -1 78 -1 1 -1 59 -1 1 -1 61 -1<br />
10 78 12 59 38 56 1 48 16 82 7 55 — .<br />
SOUTH AND WEST ASIA<br />
... ... ... ... ... ... ... ... ... ... ... ... ... ...<br />
... ... ... ... ... ... ... ... ... ... ... ... ... ...<br />
... ... ... ... ... ... ... ... ... ... ... ... ... ...<br />
... ... ... ... ... ... ... ... ... ... ... ... ... ...<br />
4 70 11 64 26 55 7 43 4 70 3 49 - .<br />
... ... ... ... ... ... ... ... ... ... ... ... ... ...<br />
25 ... 22 ... 25 ... 1 ... 3 ... 1 ... - .<br />
... ... ... ... ... ... ... ... ... ... ... ... ... ...<br />
... ... ... ... ... ... ... ... ... ... ... ... ... ...<br />
SUB-SAHARAN AFRICA<br />
68 28 3 33 13 37 2 36 2 38 . . . .<br />
— -1 83 -1 15 -1 19 -1 53 -1 33 -1 1 -1 30 -1 3 -1 42 -1 8 -1 49 -1 13 -1 34 -1<br />
143
TABLE<br />
11<br />
REGION<br />
TERTIARY EDUCATION / ISCED 5 and 6 / Graduates by broad fields of education / 2010<br />
Graduates<br />
Total<br />
Graduates by field of education as a percentage of total<br />
Science and technology fields<br />
Science<br />
Engineering, manufacturing<br />
and construction<br />
Other fields<br />
Total<br />
Country or territory<br />
MF (000) %F MF %F MF %F MF %F MF %F<br />
(1) (2) (3) (4) (5) (6) (7) (8) (9) (10)<br />
Botswana ... ... ... ... ... ... ... ... ... ...<br />
Burkina Faso 15 +1 27 +1 18 +1 15 +1 15 +1 16 +1 3 +1 9 +1 82 +1 30 +1<br />
Burundi 3 28 10 35 9 37 1 18 90 28<br />
Cameroon 40 ... 21 ... 17 ... 4 ... 79 ...<br />
Cape Verde ... ... ... ... ... ... ... ... ... ...<br />
Central African Republic ... ... ... ... ... ... ... ... ... ...<br />
Chad ... ... ... ... ... ... ... ... ... ...<br />
Comoros 1 44 12 30 11 33 1 8 78 47<br />
Congo ... ... ... ... ... ... ... ... ... ...<br />
Côte d’Ivoire ... ... ... ... ... ... ... ... ... ...<br />
Democratic Republic of the Congo ... ... ... ... ... ... ... ... ... ...<br />
Equatorial Guinea ... ... ... ... ... ... ... ... ... ...<br />
Eritrea 3 ... ... ... ... ... ... ... ... ...<br />
Ethiopia 75 23 21 17 14 19 7 14 79 24<br />
Gabon ... ... ... ... ... ... ... ... ... ...<br />
Gambia ... ... ... ... ... ... ... ... ... ...<br />
Ghana 28 +1 ... 19 +1 ... 15 +1 ... 4 +1 ... ... ...<br />
Guinea ... ... ... ... ... ... ... ... ... ...<br />
Guinea-Bissau ... ... ... ... ... ... ... ... ... ...<br />
Kenya ... ... ... ... ... ... ... ... ... ...<br />
Lesotho ... ... ... ... ... ... ... ... ... ...<br />
Liberia ... ... ... ... ... ... ... ... ... ...<br />
Madagascar 16 51 18 30 13 35 5 18 81 55<br />
Malawi ... ... ... ... ... ... ... ... ... ...<br />
Mali ... ... ... ... ... ... ... ... ... ...<br />
Mauritius ... ... ... ... ... ... ... ... ... ...<br />
Mozambique ... ... ... ... ... ... ... ... ... ...<br />
Namibia 6 -2 58 -2 3 -2 38 -2 1 -2 60 -2 1 -2 18 -2 96 -2 59 -2<br />
Niger 3 28 ... ... ... ... ... ... ... ...<br />
Nigeria ... ... ... ... ... ... ... ... ... ...<br />
Rwanda 10 44 ... ... ... ... ... ... ... ...<br />
Sao Tome and Principe . -2 . -2 . -2 . -2 . -2 . -2 . -2 . -2 . -2 . -2<br />
Senegal ... ... ... ... ... ... ... ... ... ...<br />
Seychelles . -2 . -2 . -2 . -2 . -2 . -2 . -2 . -2 . -2 . -2<br />
Sierra Leone ... ... ... ... ... ... ... ... ... ...<br />
Somalia ... ... ... ... ... ... ... ... ... ...<br />
South Africa ... ... ... ... ... ... ... ... ... ...<br />
Swaziland ... ... ... ... ... ... ... ... ... ...<br />
Togo ... ... ... ... ... ... ... ... ... ...<br />
Uganda ... ... ... ... ... ... ... ... ... ...<br />
United Republic of Tanzania ... ... ... ... ... ... ... ... ... ...<br />
Zambia ... ... ... ... ... ... ... ... ... ...<br />
Zimbabwe 31 45 25 19 5 41 19 13 75 54<br />
144
OPPORTUNITIES LOST: THE IMPACT OF GRADE REPETITION AND EARLY SCHOOL LEAVING<br />
Graduates by field of education as a percentage of total<br />
<strong>Education</strong><br />
Humanities and arts<br />
Social science, business<br />
and law<br />
Other fields<br />
Agriculture Health and welfare Services<br />
Not known or<br />
unspecified<br />
MF %F MF %F MF %F MF %F MF %F MF %F MF %F<br />
(11) (12) (13) (14) (15) (16) (17) (18) (19) (20) (21) (22) (23) (24)<br />
... ... ... ... ... ... ... ... ... ... ... ... ... ...<br />
8 +1 18 +1 11 +1 22 +1 56 +1 34 +1 1 +1 24 +1 1 +1 45 +1 6 +1 18 +1 — +1 55 +1<br />
30 22 1 — 40 36 5 9 9 24 5 31 — .<br />
10 ... 6 ... 59 ... — ... 2 ... — ... — .<br />
... ... ... ... ... ... ... ... ... ... ... ... ... ...<br />
... ... ... ... ... ... ... ... ... ... ... ... ... ...<br />
... ... ... ... ... ... ... ... ... ... ... ... ... ...<br />
12 45 14 43 44 47 2 17 5 65 . . 10 44<br />
... ... ... ... ... ... ... ... ... ... ... ... ... ...<br />
... ... ... ... ... ... ... ... ... ... ... ... ... ...<br />
... ... ... ... ... ... ... ... ... ... ... ... ... ...<br />
... ... ... ... ... ... ... ... ... ... ... ... ... ...<br />
... ... ... ... ... ... ... ... ... ... ... ... ... ...<br />
9 19 11 26 41 27 11 13 7 27 — 34 — 9<br />
... ... ... ... ... ... ... ... ... ... ... ... ... ...<br />
... ... ... ... ... ... ... ... ... ... ... ... ... ...<br />
26 +1 ... ... ... 43 +1 ... 7 +1 ... 3 +1 ... — +1 . +1 1 +1 ...<br />
... ... ... ... ... ... ... ... ... ... ... ... ... ...<br />
... ... ... ... ... ... ... ... ... ... ... ... ... ...<br />
... ... ... ... ... ... ... ... ... ... ... ... ... ...<br />
... ... ... ... ... ... ... ... ... ... ... ... ... ...<br />
... ... ... ... ... ... ... ... ... ... ... ... ... ...<br />
1 37 15 62 60 54 1 44 3 69 1 47 1 62<br />
... ... ... ... ... ... ... ... ... ... ... ... ... ...<br />
... ... ... ... ... ... ... ... ... ... ... ... ... ...<br />
... ... ... ... ... ... ... ... ... ... ... ... ... ...<br />
... ... ... ... ... ... ... ... ... ... ... ... ... ...<br />
48 -2 57 -2 7 -2 65 -2 35 -2 59 -2 3 -2 49 -2 3 -2 84 -2 — -2 43 -2 1 -2 72 -2<br />
... ... ... ... ... ... ... ... ... ... ... ... ... ...<br />
... ... ... ... ... ... ... ... ... ... ... ... ... ...<br />
... ... ... ... ... ... ... ... ... ... ... ... ... ...<br />
. -2 . -2 . -2 . -2 . -2 . -2 . -2 . -2 . -2 . -2 . -2 . -2 . -2 . -2<br />
... ... ... ... ... ... ... ... ... ... ... ... ... ...<br />
. -2 . -2 . -2 . -2 . -2 . -2 . -2 . -2 . -2 . -2 . -2 . -2 . -2 . -2<br />
... ... ... ... ... ... ... ... ... ... ... ... ... ...<br />
... ... ... ... ... ... ... ... ... ... ... ... ... ...<br />
... ... ... ... ... ... ... ... ... ... ... ... ... ...<br />
... ... ... ... ... ... ... ... ... ... ... ... ... ...<br />
... ... ... ... ... ... ... ... ... ... ... ... ... ...<br />
... ... ... ... ... ... ... ... ... ... ... ... ... ...<br />
... ... ... ... ... ... ... ... ... ... ... ... ... ...<br />
... ... ... ... ... ... ... ... ... ... ... ... ... ...<br />
25 61 8 65 35 46 2 35 6 55 — 70 — .<br />
145
TABLE<br />
12<br />
SCHOOL LIFE EXPECTANCY / ISCED 0-6 / 2010<br />
School life expectancy (approximation method) in years<br />
REGION<br />
Pre-primary (ISCED 0)<br />
Primary and lower secondary (ISCED 1 and 2)<br />
net of repetition<br />
Country or territory<br />
ARAB STATES<br />
MF M F GPI MF M F GPI<br />
(1) (2) (3) (4) (5) (6) (7) (8)<br />
Algeria 0.8 0.8 0.8 0.96 9.3 -1 9.3 -1 9.2 -1 0.99 -1<br />
Bahrain ... ... ... ... ... ... ... ...<br />
Djibouti 0.1 +1 0.1 +1 0.1 +1 0.97 +1 4.3 ** , +1 4.6 ** , +1 4.0 ** , +1 0.88 ** , +1<br />
Egypt 0.5 ** , -1 0.5 ** , -1 0.5 ** , -1 0.95 ** , -1 8.7 ** , -1 8.8 ** , -1 8.6 ** , -1 0.98 ** , -1<br />
Iraq ... ... ... ... ... ... ... ...<br />
Jordan 0.6 0.7 0.6 0.94 9.2 9.2 9.2 1.00<br />
Kuwait 1.6 -2 1.6 -2 1.7 -2 1.02 -2 ... ... ... ...<br />
Lebanon 2.4 2.5 2.4 0.98 8.2 8.1 8.3 1.03<br />
Libya ... ... ... ... ... ... ... ...<br />
Mauritania ... ... ... ... 6.9 ** , -1 6.9 ** , -1 7.0 ** , -1 1.02 ** , -1<br />
Morocco 1.3 +1 1.5 +1 1.1 +1 0.72 +1 7.9 ** 8.1 ** 7.7 ** 0.96 **<br />
Oman 0.9 0.9 0.9 0.98 ... ... ... ...<br />
Palestine 0.8 0.8 0.8 0.98 8.8 7.9 8.1 1.03<br />
Qatar 1.7 -1 1.7 -1 1.6 -1 0.95 -1 9.4 -1 9.4 -1 9.4 -1 1.00 -1<br />
Saudi Arabia 0.3 ... ... ... 8.7 -2 8.8 -2 8.5 -2 0.97 -2<br />
Sudan (pre-secession) a 0.5 -1 0.5 -1 0.5 -1 1.04 -1 5.2 -1 5.5 -1 4.9 -1 0.89 -1<br />
Syrian Arab Republic 0.3 0.3 0.3 0.97 8.6 ** 8.6 ** 8.6 ** 1.01 **<br />
Tunisia ... ... ... ... 9.0 ** , -1 8.9 ** , -1 9.0 ** , -1 1.01 ** , -1<br />
United Arab Emirates ... ... ... ... ... ... ... ...<br />
Yemen 0.04 0.04 0.03 0.89 6.5 7.2 5.7 0.78<br />
CENTRAL AND EASTERN EUROPE<br />
Albania 1.7 1.7 1.6 0.98 8.0 8.0 8.0 1.00<br />
Belarus 3.0 3.0 3.0 0.98 8.8 ... ... ...<br />
Bosnia and Herzegovina 0.5 0.5 0.5 0.99 8.3 8.2 8.4 1.02<br />
Bulgaria 3.2 3.2 3.2 0.99 7.4 -2 7.4 -2 7.3 -2 0.98 -2<br />
Croatia 2.5 2.5 2.4 0.98 7.9 7.8 8.0 1.02<br />
Czech Republic 3.2 ** , -1 3.3 ** , -1 3.2 ** , -1 0.97 ** , -1 8.9 ** , -1 8.9 ** , -1 8.9 ** , -1 1.00 ** , -1<br />
Estonia 3.9 -1 3.9 -1 3.9 -1 1.00 -1 8.9 -1 9.0 -1 8.9 -1 0.98 -1<br />
Hungary 3.4 -1 3.4 -1 3.4 -1 0.98 -1 ... ... ... ...<br />
Latvia 3.4 3.4 3.3 0.96 8.6 8.6 8.6 0.99<br />
Lithuania 3.0 3.0 2.9 0.98 ... ... ... ...<br />
Montenegro 1.2 1.3 1.2 0.96 ... ... ... ...<br />
Poland 2.6 -1 2.6 -1 2.6 -1 1.01 -1 ... ... ... ...<br />
Republic of Moldova 3.0 * 3.0 * 3.0 * 0.98 * 8.2 * , -1 8.2 * , -1 8.1 * , -1 0.99 * , -1<br />
Romania 3.2 3.1 3.2 1.01 7.5 7.5 7.5 1.00<br />
Russian Federation 3.6 -1 3.6 -1 3.5 -1 0.98 -1 8.4 -1 ... ... ...<br />
Serbia 2.1 * 2.1 * 2.1 * 1.01 * 7.7 * 7.7 * 7.7 * 1.00 *<br />
Slovakia 2.7 ** 2.8 ** 2.7 ** 0.97 ** 8.4 ** 8.4 ** 8.4 ** 0.99 **<br />
Slovenia 2.6 -1 2.6 -1 2.6 -1 0.98 -1 8.7 -1 8.7 -1 8.7 -1 1.00 -1<br />
The former Yugoslav Rep. of Macedonia 0.8 0.7 0.8 1.05 8.1 8.0 8.1 1.01<br />
Turkey 0.6 -1 0.7 -1 0.6 -1 0.95 -1 7.8 ** , -1 7.9 ** , -1 7.7 ** , -1 0.97 ** , -1<br />
Ukraine 2.9 3.0 2.9 0.97 9.0 9.0 * 9.0 * 1.00 *<br />
CENTRAL ASIA<br />
Armenia 1.2 1.2 1.3 1.15 7.8 ** 7.7 ** 7.9 ** 1.02 **<br />
Azerbaijan 0.7 * 0.8 * 0.7 * 0.97 * 8.2 ** 8.3 ** 8.1 ** 0.98 **<br />
Georgia 1.7 -2 1.6 ** , -2 1.9 ** , -2 1.23 ** , -2 9.6 9.5 9.6 1.01<br />
Kazakhstan 1.9 +1 1.9 +1 1.9 +1 0.98 +1 9.7 +1 9.7 +1 9.7 +1 1.00 +1<br />
Kyrgyzstan 0.8 0.7 0.8 1.02 8.7 8.7 8.7 0.99<br />
Mongolia 2.2 2.2 2.3 1.03 9.3 ** , -1 9.2 ** , -1 9.4 ** , -1 1.01 ** , -1<br />
Tajikistan 0.3 0.4 0.3 0.84 8.9 9.2 8.6 0.94<br />
Turkmenistan ... ... ... ... ... ... ... ...<br />
Uzbekistan 1.0 +1 1.0 +1 1.0 +1 1.00 +1 8.5 +1 8.6 +1 8.4 +1 0.98 +1<br />
146<br />
EAST ASIA AND THE PACIFIC<br />
Australia 0.8 0.8 0.8 0.98 ... ... ... ...<br />
Brunei Darussalam 1.8 1.8 1.8 1.00 8.9 8.8 8.9 1.01<br />
Cambodia 0.4 0.4 0.4 1.04 8.5 8.6 8.4 0.98<br />
China 1.6 1.6 1.6 1.01 8.3 8.1 8.5 1.04
OPPORTUNITIES LOST: THE IMPACT OF GRADE REPETITION AND EARLY SCHOOL LEAVING<br />
School life expectancy (approximation method) in years<br />
Primary and secondary (ISCED 1-3) Tertiary (ISCED 5-6) Primary to tertiary (ISCED 1-6)<br />
MF M F GPI MF M F GPI MF M F GPI<br />
(9) (10) (11) (12) (13) (14) (15) (16) (17) (18) (19) (20)<br />
ARAB STATES<br />
12.1 -1 12.2 -1 12.0 -1 0.98 -1 1.5 1.3 1.8 1.46 13.6 -1 13.4 -1 13.8 -1 1.03 -1<br />
... ... ... ... ... ... ... ... ... ... ... ...<br />
5.5 ** , +1 5.9 ** , +1 5.1 ** , +1 0.85 ** , +1 0.2 +1 0.3 +1 0.2 +1 0.67 +1 5.7 ** , +1 6.2 ** , +1 5.3 ** , +1 0.84 ** , +1<br />
10.4 ** 10.6 ** 10.2 ** 0.96 ** 1.6 1.7 1.5 0.91 12.1 ** 12.4 ** 11.8 ** 0.95 **<br />
... ... ... ... ... ... ... ... ... ... ... ...<br />
10.8 10.7 10.9 1.02 1.9 1.7 2.0 1.16 12.7 12.4 12.9 1.04<br />
12.3 -2 12.0 -2 12.6 -2 1.05 -2 ... ... ... ... ... ... ... ...<br />
11.2 11.0 11.4 1.04 2.7 2.5 2.9 1.19 13.9 13.5 14.3 1.07<br />
... ... ... ... ... ... ... ... ... ... ... ...<br />
7.9 ** 7.8 ** 7.9 ** 1.01 ** 0.2 0.3 0.1 0.41 8.1 ** 8.1 ** 8.0 ** 0.99 **<br />
... ... ... ... 0.7 ** , -1 0.7 ** , -1 0.6 ** , -1 0.85 ** , -1 ... ... ... ...<br />
12.3 -1 12.5 -1 12.2 -1 0.98 -1 1.2 1.0 1.5 1.54 13.5 -1 13.5 -1 13.6 -1 1.01 -1<br />
10.5 10.3 10.8 1.05 3.0 2.6 3.4 1.29 13.5 12.9 14.1 1.10<br />
11.8 11.4 12.3 1.08 0.5 0.2 1.3 5.24 12.2 11.6 13.6 1.17<br />
12.5 ** 12.6 ** 12.3 ** 0.97 ** 1.8 1.7 2.0 1.20 14.3 ** 14.3 ** 14.3 ** 1.00 **<br />
6.3 -1 6.7 -1 6.0 -1 0.89 -1 ... ... ... ... ... ... ... ...<br />
10.4 ** 10.5 ** 10.4 ** 0.99 ** ... ... ... ... ... ... ... ...<br />
12.8 -1 12.7 ** , -1 12.8 ** , -1 1.01 ** , -1 1.7 -1 1.4 -1 2.1 -1 1.51 -1 14.5 -1 14.1 ** , -1 14.9 ** , -1 1.06 ** , -1<br />
... ... ... ... ... ... ... ... ... ... ... ...<br />
7.9 ** 9.1 ** 6.8 ** 0.74 ** ... ... ... ... ... ... ... ...<br />
CENTRAL AND EASTERN EUROPE<br />
10.5 10.6 10.4 0.98 ... ... ... ... ... ... ... ...<br />
... ... ... ... 4.0 3.3 4.7 1.41 ... ... ... ...<br />
11.6 ** 11.5 ** 11.8 ** 1.02 ** 1.8 1.6 2.0 1.27 13.4 ** 13.1 ** 13.8 ** 1.05 **<br />
11.1 11.3 11.0 0.97 2.8 2.4 3.2 1.31 14.0 13.8 14.2 1.03<br />
11.4 11.2 11.7 1.05 2.7 2.3 3.1 1.34 14.1 13.5 14.8 1.10<br />
12.3 ** , -1 12.3 ** , -1 12.4 ** , -1 1.01 ** , -1 2.9 -1 2.4 -1 3.4 -1 1.39 -1 15.3 ** , -1 14.9 ** , -1 15.9 ** , -1 1.07 ** , -1<br />
12.1 -1 12.0 -1 12.1 -1 1.01 -1 3.3 -1 2.5 -1 4.2 -1 1.69 -1 15.8 -1 14.8 -1 16.9 -1 1.14 -1<br />
11.9 -1 12.0 -1 11.9 -1 0.99 -1 2.9 -1 2.5 -1 3.4 -1 1.36 -1 15.3 -1 14.9 -1 15.6 -1 1.05 -1<br />
11.5 11.6 11.5 0.99 3.2 2.3 4.1 1.75 14.8 13.9 15.6 1.12<br />
11.7 11.7 11.6 0.99 3.9 3.1 4.7 1.52 15.7 15.0 16.5 1.10<br />
12.6 12.6 12.6 1.00 2.4 2.1 2.6 1.24 15.0 14.7 15.2 1.04<br />
11.6 -1 11.7 -1 11.6 -1 0.99 -1 3.5 -1 2.9 -1 4.1 -1 1.43 -1 15.2 -1 14.6 -1 15.8 -1 1.08 -1<br />
9.9 * 9.8 * 9.9 * 1.01 * 2.0 * 1.7 * 2.2 * 1.34 * 11.8 * 11.5 * 12.2 * 1.06 *<br />
11.3 11.4 11.3 0.99 3.0 2.6 3.4 1.34 14.5 14.0 15.0 1.07<br />
10.4 -1 10.5 -1 10.3 -1 0.99 -1 3.8 -1 3.2 -1 4.4 -1 1.35 -1 14.3 -1 13.8 -1 14.8 -1 1.07 -1<br />
11.2 * 11.1 * 11.2 * 1.01 * 2.4 * 2.1 * 2.7 * 1.30 * 13.6 * 13.2 * 14.0 * 1.06 *<br />
12.0 ** 11.9 ** 12.0 ** 1.01 ** 2.7 2.1 3.3 1.55 14.7 ** 14.1 ** 15.3 ** 1.09 **<br />
12.6 -1 12.7 -1 12.6 -1 1.00 -1 4.2 -1 3.4 -1 5.0 -1 1.45 -1 16.9 -1 16.1 -1 17.6 -1 1.09 -1<br />
11.5 11.4 11.5 1.01 1.9 1.8 2.1 1.18 13.4 13.2 13.6 1.03<br />
10.5 ** , -1 10.8 ** , -1 10.2 ** , -1 0.95 ** , -1 2.3 -1 2.6 -1 2.0 -1 0.78 -1 12.9 ** , -1 13.4 ** , -1 12.3 ** , -1 0.92 ** , -1<br />
10.6 10.6 * 10.5 * 0.99 * 3.9 3.5 * 4.3 * 1.24 * 14.8 14.4 * 15.1 * 1.05 *<br />
CENTRAL ASIA<br />
9.5 ** 9.4 ** 9.7 ** 1.03 ** 2.6 2.3 3.0 1.27 12.2 ** 11.7 ** 12.6 ** 1.07 **<br />
10.5 ** 10.6 ** 10.4 ** 0.98 ** 1.0 * 1.0 * 1.0 * 0.98 * 11.7 ** 11.8 ** 11.5 ** 0.98 **<br />
11.7 -1 ... ... ... 1.4 1.3 1.6 1.25 13.2 -1 ... ... ...<br />
11.4 +1 11.5 +1 11.4 +1 0.99 +1 2.1 +1 1.8 +1 2.5 +1 1.43 +1 15.3 +1 14.9 +1 15.6 +1 1.05 +1<br />
10.0 * 10.0 * 9.9 * 0.99 * 2.6 -1 2.3 -1 2.9 -1 1.29 -1 12.6 * , -1 12.3 * , -1 12.9 * , -1 1.05 * , -1<br />
11.2 ** 11.1 ** 11.3 ** 1.02 ** 2.8 2.2 3.4 1.55 14.3 ** 13.6 ** 15.0 ** 1.10 **<br />
10.2 10.7 9.7 0.90 1.1 1.6 0.7 0.41 11.5 12.5 10.6 0.85<br />
... ... ... ... ... ... ... ... ... ... ... ...<br />
11.1 +1 11.3 +1 11.0 +1 0.98 +1 0.5 +1 0.6 +1 0.4 +1 0.64 +1 11.6 +1 11.8 +1 11.4 +1 0.96 +1<br />
EAST ASIA AND THE PACIFIC<br />
14.9 15.1 14.7 0.97 4.0 3.4 4.6 1.33 19.6 19.2 20.0 1.04<br />
14.2 ** 14.0 ** 14.4 ** 1.02 ** 0.8 0.6 1.1 1.76 15.0 ** 14.6 ** 15.4 ** 1.05 **<br />
10.2 ** 10.6 ** 9.9 ** 0.94 ** 0.4 -2 0.6 -2 0.3 -2 0.49 -2 10.5 ** , -2 11.2 ** , -2 9.9 ** , -2 0.89 ** , -2<br />
10.4 10.3 10.6 1.04 1.3 1.2 1.4 1.10 11.7 11.5 12.0 1.04<br />
147
TABLE<br />
12<br />
SCHOOL LIFE EXPECTANCY / ISCED 0-6 / 2010<br />
School life expectancy (approximation method) in years<br />
REGION<br />
Pre-primary (ISCED 0)<br />
Primary and lower secondary (ISCED 1 and 2)<br />
net of repetition<br />
148<br />
Country or territory<br />
MF M F GPI MF M F GPI<br />
(1) (2) (3) (4) (5) (6) (7) (8)<br />
China, Hong Kong SAR ... ... ... ... 9.2 ** 9.0 ** 9.3 ** 1.03 **<br />
China, Macao SAR 2.4 2.5 2.3 0.94 7.7 7.7 7.7 1.01<br />
Cook Islands 1.8 * , +1 1.8 * , +1 1.8 * , +1 1.01 * , +1 10.6 * , +1 10.3 * , +1 10.9 * , +1 1.06 * , +1<br />
Democratic People’s Republic of Korea ... ... ... ... ... ... ... ...<br />
Fiji 0.5 -1 0.5 -1 0.6 -1 1.07 -1 10.2 -1 10.1 -1 10.2 -1 1.01 -1<br />
Indonesia 0.9 0.9 0.9 1.03 9.4 -1 9.4 -1 9.3 -1 0.99 -1<br />
Japan 2.6 ... ... ... ... ... ... ...<br />
Kiribati ... ... ... ... ... ... ... ...<br />
Lao People’s Democratic Republic 0.7 0.6 0.7 1.04 7.5 7.8 7.2 0.92<br />
Malaysia 1.3 ** , -1 1.3 ** , -1 1.4 ** , -1 1.08 ** , -1 ... ... ... ...<br />
Marshall Islands 0.9 +1 0.9 +1 0.9 +1 1.05 +1 8.6 +1 8.7 +1 8.6 +1 0.99 +1<br />
Micronesia (Federated States of) ... ... ... ... ... ... ... ...<br />
Myanmar 0.2 0.2 0.2 1.06 8.7 ** 8.7 ** 8.8 ** 1.01 **<br />
Nauru 2.8 * , -2 2.9 * , -2 2.8 * , -2 0.97 * , -2 ... ... ... ...<br />
New Zealand 1.9 1.8 1.9 1.04 ... ... ... ...<br />
Niue ... ... ... ... ... ... ... ...<br />
Palau ... ... ... ... ... ... ... ...<br />
Papua New Guinea 1.0 -2 1.0 -2 1.0 -2 0.98 -2 ... ... ... ...<br />
Philippines 0.5 -1 0.5 -1 0.5 -1 1.02 -1 8.8 -1 8.7 -1 8.9 -1 1.02 -1<br />
Republic of Korea 3.5 3.5 3.5 1.01 ... ... ... ...<br />
Samoa 0.8 0.7 0.8 1.19 8.5 8.4 8.6 1.02<br />
Singapore ... ... ... ... ... ... ... ...<br />
Solomon Islands 1.5 1.5 1.5 1.03 ... ... ... ...<br />
Thailand 3.0 +1 3.0 +1 3.0 +1 0.99 +1 ... ... ... ...<br />
Timor-Leste ... ... ... ... 7.9 7.9 8.0 1.01<br />
Tokelau ... ... ... ... ... ... ... ...<br />
Tonga ... ... ... ... ... ... ... ...<br />
Tuvalu ... ... ... ... ... ... ... ...<br />
Vanuatu 1.8 1.8 1.8 1.01 8.8 ** 8.8 ** 8.8 ** 1.00 **<br />
Viet Nam 2.5 2.5 2.4 0.94 ... ... ... ...<br />
LATIN AMERICA AND THE CARIBBEAN<br />
Anguilla 1.9 ** , -2 2.0 ** , -2 1.8 ** , -2 0.91 ** , -2 9.0 ** , -2 9.2 ** , -2 8.9 ** , -2 0.97 ** , -2<br />
Antigua and Barbuda 1.5 -2 1.5 -2 1.5 -2 0.99 -2 10.0 * 10.4 * 9.5 * 0.92 *<br />
Argentina 2.2 -1 2.2 -1 2.2 -1 1.02 -1 9.6 -1 9.4 -1 9.7 -1 1.03 -1<br />
Aruba 2.2 2.3 2.2 0.94 8.2 -1 8.2 -1 8.1 -1 0.98 -1<br />
Bahamas ... ... ... ... 9.5 9.3 9.7 1.04<br />
Barbados 2.2 * 2.2 * 2.2 * 1.00 * 9.7 * , -1 9.6 * , -1 9.9 * , -1 1.04 * , -1<br />
Belize 0.9 0.9 0.9 1.06 ... ... ... ...<br />
Bermuda ... ... ... ... ... ... ... ...<br />
Bolivia (Plurinational State of) 0.9 -1 0.9 -1 0.9 -1 1.00 -1 8.3 ** , -2 8.4 ** , -2 8.3 ** , -2 0.99 ** , -2<br />
Brazil ... ... ... ... ... ... ... ...<br />
British Virgin Islands 1.5 ** , -1 1.5 ** , -1 1.4 ** , -1 0.93 ** , -1 9.8 ** 9.9 ** 9.6 ** 0.97 **<br />
Cayman Islands 1.8 -2 1.6 -2 2.0 -2 1.22 -2 7.9 ** , -2 7.9 ** , -2 8.0 ** , -2 1.01 ** , -2<br />
Chile 1.7 -1 1.6 -1 1.7 -1 1.05 -1 8.2 -1 8.4 -1 8.1 -1 0.96 -1<br />
Colombia 1.5 1.5 1.5 1.00 9.8 9.7 9.9 1.02<br />
Costa Rica 1.4 ** 1.4 ** 1.4 ** 1.01 ** 9.2 ** 9.1 ** 9.3 ** 1.02 **<br />
Cuba 3.2 +1 3.2 +1 3.1 +1 1.00 +1 8.9 +1 8.9 +1 8.8 +1 0.99 +1<br />
Dominica 2.2 2.2 2.3 1.02 10.4 10.2 10.6 1.04<br />
Dominican Republic 1.2 1.2 1.1 0.99 7.7 7.9 7.5 0.95<br />
Ecuador 1.1 ** , -2 1.1 ** , -2 1.2 ** , -2 1.05 ** , -2 ... ... ... ...<br />
El Salvador 1.9 1.9 1.9 1.02 8.9 8.9 8.8 0.99<br />
Grenada 2.0 1.9 2.0 1.07 10.2 ** 10.2 ** 10.4 ** 1.02 **<br />
Guatemala 1.4 1.4 1.4 1.02 8.3 8.5 8.1 0.95<br />
Guyana 1.5 1.5 1.6 1.06 7.7 7.4 8.0 1.08<br />
Haiti ... ... ... ... ... ... ... ...<br />
Honduras 1.3 1.3 1.3 1.03 ... ... ... ...<br />
Jamaica 3.4 3.4 3.4 0.99 7.9 8.0 7.8 0.97<br />
Mexico 2.0 2.0 2.1 1.02 10.1 9.9 10.3 1.03
OPPORTUNITIES LOST: THE IMPACT OF GRADE REPETITION AND EARLY SCHOOL LEAVING<br />
School life expectancy (approximation method) in years<br />
Primary and secondary (ISCED 1-3) Tertiary (ISCED 5-6) Primary to tertiary (ISCED 1-6)<br />
MF M F GPI MF M F GPI MF M F GPI<br />
(9) (10) (11) (12) (13) (14) (15) (16) (17) (18) (19) (20)<br />
12.2 ** 12.1 ** 12.4 ** 1.02 ** 2.9 * 2.9 * 3.1 * 1.04 * 15.5 ** 15.3 ** 15.8 ** 1.03 **<br />
10.7 10.9 10.6 0.97 3.2 3.3 3.2 0.96 14.0 14.3 13.8 0.97<br />
12.5 * , +1 11.9 * , +1 13.1 * , +1 1.10 * , +1 . * . * . * . * 12.5 * , +1 11.9 * , +1 13.1 * , +1 1.10 * , +1<br />
... ... ... ... ... ... ... ... ... ... ... ...<br />
12.3 ** , -1 12.1 ** , -1 12.6 ** , -1 1.04 ** , -1 ... ... ... ... ... ... ... ...<br />
11.7 11.6 11.8 1.01 1.2 1.2 1.1 0.89 12.9 12.9 12.9 1.00<br />
12.3 12.3 12.3 1.00 3.0 3.2 2.8 0.89 15.3 15.5 15.1 0.98<br />
12.0 -2 11.6 -2 12.4 -2 1.07 -2 . -2 . -2 . -2 . -2 12.0 -2 11.6 -2 12.4 -2 1.07 -2<br />
9.1 9.6 8.6 0.90 0.9 1.0 0.7 0.74 10.1 10.7 9.4 0.88<br />
... ... ... ... 2.0 -1 1.8 -1 2.3 -1 1.29 -1 ... ... ... ...<br />
12.3 -1 12.2 -1 12.4 -1 1.01 -1 ... ... ... ... ... ... ... ...<br />
... ... ... ... ... ... ... ... ... ... ... ...<br />
9.5 ** 9.4 ** 9.6 ** 1.02 ** ... ... ... ... ... ... ... ...<br />
9.3 * , -2 8.9 * , -2 9.9 * , -2 1.12 * , -2 ... ... ... ... 9.3 ** , -2 8.9 ** , -2 9.9 ** , -2 1.12 ** , -2<br />
14.4 14.2 14.6 1.03 4.3 3.6 5.0 1.38 19.7 18.8 20.5 1.09<br />
... ... ... ... . * , -2 . * , -2 . * , -2 . * , -2 ... ... ... ...<br />
... ... ... ... ... ... ... ... ... ... ... ...<br />
... ... ... ... ... ... ... ... ... ... ... ...<br />
9.9 -1 9.8 -1 9.9 -1 1.01 -1 1.4 -2 1.3 -2 1.6 -2 1.25 -2 11.7 * , -2 11.4 * , -2 12.0 * , -2 1.05 * , -2<br />
12.1 ** 12.2 ** 12.1 ** 0.99 ** 5.0 5.8 4.1 0.71 17.2 ** 18.0 ** 16.2 ** 0.90 **<br />
12.5 12.0 13.0 1.08 ... ... ... ... ... ... ... ...<br />
... ... ... ... ... ... ... ... ... ... ... ...<br />
... ... ... ... . -1 . -1 . -1 . -1 ... ... ... ...<br />
10.0 -1 9.8 -1 10.2 -1 1.03 -1 2.4 +1 2.1 +1 2.7 +1 1.31 +1 12.3 -1 11.9 -1 12.7 -1 1.07 -1<br />
10.9 11.1 10.7 0.97 1.1 -1 1.3 -1 0.9 -1 0.69 -1 11.7 -1 12.2 * , -1 11.2 * , -1 0.92 * , -1<br />
... ... ... ... . * , -1 . * , -1 . * , -1 . * , -1 ... ... ... ...<br />
... ... ... ... ... ... ... ... ... ... ... ...<br />
... ... ... ... . * , -1 . * , -1 . * , -1 . * , -1 ... ... ... ...<br />
11.1 ** 11.2 ** 10.9 ** 0.97 ** ... ... ... ... ... ... ... ...<br />
10.8 10.7 10.8 1.01 1.1 1.1 1.1 1.00 11.9 11.8 11.9 1.01<br />
LATIN AMERICA AND THE CARIBBEAN<br />
10.6 ** , -2 10.8 ** , -2 10.6 ** , -2 0.98 ** , -2 0.2 ** , -2 0.1 ** , -2 0.4 ** , -2 5.01 ** , -2 11.2 ** , -2 11.1 ** , -2 11.4 ** , -2 1.02 ** , -2<br />
12.4 12.7 12.1 0.95 0.8 0.5 1.2 2.44 13.3 13.2 13.3 1.01<br />
12.4 -1 12.1 -1 12.6 -1 1.04 -1 3.7 -1 3.0 -1 4.5 -1 1.50 -1 16.1 -1 15.1 -1 17.1 -1 1.13 -1<br />
11.3 11.3 11.2 0.99 1.6 1.4 1.8 1.29 12.8 12.7 13.0 1.02<br />
12.4 12.2 12.7 1.04 ... ... ... ... ... ... ... ...<br />
12.2 * 11.9 * 12.5 * 1.05 * 3.3 2.0 4.7 2.38 16.3 * 14.7 * 18.1 * 1.23 *<br />
... ... ... ... 1.1 0.8 1.3 1.57 ... ... ... ...<br />
11.1 ** 10.6 ** 11.5 ** 1.09 ** 1.0 0.7 1.4 2.08 12.1 ** 11.3 ** 12.9 ** 1.14 **<br />
11.2 ** , -1 11.3 ** , -1 11.2 ** , -1 0.99 ** , -1 ... ... ... ... ... ... ... ...<br />
... ... ... ... ... ... ... ... ... ... ... ...<br />
12.2 ** 12.3 ** 12.0 ** 0.97 ** 2.8 ** , -1 2.4 ** , -1 3.9 ** , -1 1.64 ** , -1 15.2 ** , -1 14.9 ** , -1 16.3 ** , -1 1.10 ** , -1<br />
10.4 ** , -2 10.2 ** , -2 10.6 ** , -2 1.04 ** , -2 1.3 -2 0.9 -2 1.8 -2 2.11 -2 11.9 ** , -2 11.2 ** , -2 12.6 ** , -2 1.13 ** , -2<br />
11.6 -1 11.7 -1 11.5 -1 0.99 -1 3.1 -1 3.1 -1 3.2 -1 1.05 -1 14.7 -1 14.7 -1 14.7 -1 1.00 -1<br />
11.6 11.4 11.9 1.04 2.0 1.9 2.0 1.09 13.6 13.3 13.9 1.05<br />
11.4 ** 11.3 ** 11.5 ** 1.02 ** ... ... ... ... ... ... ... ...<br />
11.5 +1 11.5 +1 11.4 +1 0.99 +1 4.7 3.6 5.9 1.63 16.2 15.2 17.3 1.14<br />
12.9 12.7 13.1 1.03 0.2 -2 0.1 -2 0.3 -2 3.35 -2 12.7 -2 12.5 -2 12.8 -2 1.02 -2<br />
11.1 11.3 11.0 0.97 ... ... ... ... ... ... ... ...<br />
11.7 -1 11.6 -1 11.9 -1 1.03 -1 2.2 -2 2.1 -2 2.4 -2 1.14 -2 13.7 ** , -2 13.4 ** , -2 13.9 ** , -2 1.03 ** , -2<br />
10.7 10.8 10.5 0.97 1.3 1.3 1.4 1.08 12.0 12.1 11.9 0.98<br />
12.6 ** 12.5 ** 12.8 ** 1.02 ** 2.6 -1 2.2 -1 3.0 -1 1.36 -1 15.8 -1 15.3 -1 16.3 -1 1.06 -1<br />
10.1 10.4 9.8 0.94 ... ... ... ... ... ... ... ...<br />
9.7 9.3 10.0 1.07 0.6 0.3 0.9 2.52 10.3 9.7 10.9 1.12<br />
... ... ... ... ... ... ... ... ... ... ... ...<br />
10.7 ** 10.4 ** 11.1 ** 1.07 ** 1.1 * , -2 0.9 * , -2 1.3 * , -2 1.48 * , -2 11.4 ** , -2 10.8 ** , -2 12.0 ** , -2 1.11 ** , -2<br />
10.0 10.1 10.0 0.99 1.4 0.9 2.0 2.28 13.1 12.8 13.4 1.04<br />
12.3 12.1 12.4 1.02 1.5 1.5 1.4 0.96 13.7 13.6 13.9 1.02<br />
149
TABLE<br />
12<br />
SCHOOL LIFE EXPECTANCY / ISCED 0-6 / 2010<br />
School life expectancy (approximation method) in years<br />
REGION<br />
Pre-primary (ISCED 0)<br />
Primary and lower secondary (ISCED 1 and 2)<br />
net of repetition<br />
150<br />
Country or territory<br />
MF M F GPI MF M F GPI<br />
(1) (2) (3) (4) (5) (6) (7) (8)<br />
Montserrat ... ... ... ... ... ... ... ...<br />
Netherlands Antilles a ... ... ... ... ... ... ... ...<br />
Nicaragua 1.7 1.6 1.7 1.03 8.7 8.6 8.8 1.02<br />
Panama 1.3 1.3 1.3 1.01 8.7 8.7 8.8 1.01<br />
Paraguay 1.1 -1 1.1 -1 1.1 -1 1.01 -1 8.0 -1 8.0 -1 8.0 -1 1.00 -1<br />
Peru 2.4 2.4 2.4 1.00 8.9 8.9 8.9 1.00<br />
Puerto Rico 1.9 1.9 2.0 1.03 ... ... ... ...<br />
Saint Kitts and Nevis 1.8 1.8 1.8 0.96 9.4 * 9.4 * 9.3 * 0.99 *<br />
Saint Lucia 1.2 1.2 1.2 0.96 9.3 9.5 9.2 0.97<br />
Saint Vincent and the Grenadines 1.6 -1 1.6 -1 1.6 -1 1.01 -1 10.5 10.7 10.2 0.95<br />
Suriname 1.7 -1 1.7 -1 1.7 -1 1.01 -1 8.8 ** , -1 8.5 ** , -1 9.0 ** , -1 1.05 ** , -1<br />
Trinidad and Tobago ... ... ... ... 9.5 * 9.5 * 9.5 * 1.00 *<br />
Turks and Caicos Islands ... ... ... ... ... ... ... ...<br />
Uruguay 2.7 -1 2.7 -1 2.7 -1 1.01 -1 9.3 -1 ... ... ...<br />
Venezuela (Bolivarian Republic of) 2.2 2.1 2.3 1.07 8.5 8.4 8.6 1.02<br />
NORTH AMERICA AND WESTERN EUROPE<br />
Andorra 3.0 3.1 3.0 0.96 8.3 8.3 8.3 1.00<br />
Austria 3.0 ** 3.0 ** 3.0 ** 1.00 ** 8.0 ** 8.1 ** 8.0 ** 1.00 **<br />
Belgium 3.5 -1 3.5 -1 3.5 -1 1.00 -1 8.2 -1 8.3 -1 8.2 -1 0.99 -1<br />
Canada 1.4 -2 1.4 -2 1.4 -2 1.00 -2 ... ... ... ...<br />
Cyprus 2.4 * 2.4 * 2.5 * 1.00 * 9.4 * 9.4 * 9.4 * 1.00 *<br />
Denmark 3.8 -1 3.9 -1 3.8 -1 0.99 -1 9.4 -1 9.3 -1 9.4 -1 1.01 -1<br />
Finland 2.7 2.7 2.7 1.00 8.9 8.9 8.9 1.00<br />
France 3.3 3.3 3.2 0.99 ... ... ... ...<br />
Germany 3.4 3.4 3.4 0.98 10.0 ** 10.0 ** 10.0 ** 1.00 **<br />
Gibraltar ... ... ... ... ... ... ... ...<br />
Greece ... ... ... ... ... ... ... ...<br />
Holy See . . . . . . . .<br />
Iceland 2.9 -1 2.9 -1 2.9 -1 1.00 -1 9.9 -1 9.8 -1 9.9 -1 1.00 -1<br />
Ireland 0.9 1.0 0.9 0.98 11.8 11.8 11.8 1.00<br />
Israel 3.2 -1 3.1 -1 3.3 -1 1.05 -1 8.9 -1 8.8 -1 9.0 -1 1.02 -1<br />
Italy 2.9 3.0 2.9 0.97 8.1 8.1 8.1 1.00<br />
Liechtenstein 2.0 * 2.0 * 2.0 * 0.99 * 9.4 * 9.5 * 9.3 * 0.98 *<br />
Luxembourg 2.6 -2 2.6 -2 2.6 -2 0.99 -2 8.7 -2 8.7 -2 8.8 -2 1.02 -2<br />
Malta 2.3 2.4 2.3 0.97 11.0 11.1 10.9 0.98<br />
Monaco ... ... ... ... ... ... ... ...<br />
Netherlands 1.9 1.9 1.9 1.00 10.2 10.3 10.1 0.98<br />
Norway 3.0 3.0 3.0 0.98 9.9 9.9 9.9 1.00<br />
Portugal 2.5 -1 2.5 -1 2.5 -1 1.00 -1 ... ... ... ...<br />
San Marino 2.8 ** 2.9 ** 2.7 ** 0.93 ** 7.7 ** 7.4 ** 8.0 ** 1.08 **<br />
Spain 3.8 3.8 3.8 1.00 10.4 10.4 10.5 1.01<br />
Sweden 3.8 3.8 3.8 1.00 9.0 9.0 9.0 0.99<br />
Switzerland 2.0 2.0 2.0 1.01 9.3 9.3 9.4 1.01<br />
United Kingdom 1.6 -1 1.6 -1 1.6 -1 1.01 -1 ... ... ... ...<br />
United States of America 2.1 2.0 2.1 1.04 ... ... ... ...<br />
SOUTH AND WEST ASIA<br />
Afghanistan ... ... ... ... ... ... ... ...<br />
Bangladesh 0.4 ** 0.4 ** 0.4 ** 0.99 ** ... ... ... ...<br />
Bhutan 0.1 +1 0.1 +1 0.1 +1 1.08 +1 10.5 +1 10.2 +1 10.7 +1 1.05 +1<br />
India 1.6 1.6 1.7 1.04 7.8 -2 7.9 -2 7.7 -2 0.98 -2<br />
Iran (Islamic Republic of) 0.4 0.4 0.4 1.08 8.1 -1 8.1 -1 8.1 -1 1.00 -1<br />
Maldives 3.4 +1 3.4 +1 3.4 +1 1.02 +1 10.7 -2 10.6 -2 10.9 -2 1.03 -2<br />
Nepal ... ... ... ... ... ... ... ...<br />
Pakistan ... ... ... ... 5.8 * 6.4 * 5.2 * 0.81 *<br />
Sri Lanka ... ... ... ... 9.0 9.1 9.0 0.99<br />
SUB-SAHARAN AFRICA<br />
Angola 1.1 * 1.1 * 1.1 * 1.02 * 7.9 -1 8.6 -1 7.2 -1 0.83 -1<br />
Benin 0.4 0.4 0.4 1.04 ... ... ... ...
OPPORTUNITIES LOST: THE IMPACT OF GRADE REPETITION AND EARLY SCHOOL LEAVING<br />
School life expectancy (approximation method) in years<br />
Primary and secondary (ISCED 1-3) Tertiary (ISCED 5-6) Primary to tertiary (ISCED 1-6)<br />
MF M F GPI MF M F GPI MF M F GPI<br />
(9) (10) (11) (12) (13) (14) (15) (16) (17) (18) (19) (20)<br />
... ... ... ... ... ... ... ... ... ... ... ...<br />
... ... ... ... ... ... ... ... ... ... ... ...<br />
10.6 10.5 10.6 1.01 ... ... ... ... ... ... ... ...<br />
10.9 10.9 11.0 1.01 2.2 -1 1.8 -1 2.7 -1 1.53 -1 13.2 -1 12.6 -1 13.7 -1 1.09 -1<br />
10.0 -1 10.1 -1 10.0 -1 1.00 -1 2.1 -1 1.7 -1 2.4 -1 1.41 -1 12.1 -1 11.8 -1 12.4 -1 1.06 -1<br />
11.1 11.1 11.0 0.99 2.1 2.1 2.2 1.09 13.2 13.2 13.3 1.01<br />
10.5 ** 10.3 ** 10.7 ** 1.05 ** 4.3 3.5 5.1 1.48 14.8 ** 13.7 ** 15.9 ** 1.16 **<br />
11.4 * 11.4 * 11.4 * 1.00 * 0.9 -2 0.6 -2 1.2 -2 2.10 -2 12.9 ** , -2 12.4 ** , -2 13.4 ** , -2 1.08 ** , -2<br />
11.4 ** 11.5 ** 11.2 ** 0.97 ** 0.6 0.3 0.8 2.49 12.7 ** 12.4 ** 13.0 ** 1.05 **<br />
12.8 13.0 12.6 0.97 ... ... ... ... ... ... ... ...<br />
12.2 ** , -1 11.8 ** , -1 12.5 ** , -1 1.06 ** , -1 ... ... ... ... ... ... ... ...<br />
11.6 ** , -2 11.6 ** , -2 11.6 ** , -2 1.01 ** , -2 ... ... ... ... ... ... ... ...<br />
... ... ... ... — ** , -2 — ** , -2 — ** , -2 0.90 ** , -2 ... ... ... ...<br />
12.2 -1 ... ... ... 3.3 -1 2.5 -1 4.2 -1 1.70 -1 15.5 -1 ... ... ...<br />
10.3 10.2 10.4 1.02 4.0 -1 ... ... ... 14.4 -1 ... ... ...<br />
NORTH AMERICA AND WESTERN EUROPE<br />
10.3 10.1 10.4 1.03 0.4 -2 0.3 -2 0.4 -2 1.41 -2 11.7 -2 11.1 -2 12.3 -2 1.11 -2<br />
11.8 ** 11.9 ** 11.6 ** 0.97 ** 2.8 -1 2.6 -1 3.1 -1 1.18 -1 15.3 ** , -1 15.1 ** , -1 15.6 ** , -1 1.03 ** , -1<br />
12.9 -1 13.0 -1 12.8 -1 0.98 -1 3.3 -1 2.9 -1 3.7 -1 1.25 -1 16.4 -1 16.1 -1 16.7 -1 1.04 -1<br />
12.0 -2 12.1 -2 11.9 -2 0.99 -2 ... ... ... ... ... ... ... ...<br />
12.3 * 12.3 * 12.3 * 1.00 * 2.6 * 2.8 * 2.5 * 0.88 * 14.9 * 15.1 * 14.7 * 0.98 *<br />
13.2 -1 13.1 -1 13.2 -1 1.01 -1 3.6 -1 3.0 -1 4.2 -1 1.41 -1 16.8 -1 16.1 -1 17.4 -1 1.08 -1<br />
12.4 12.3 12.5 1.02 4.5 4.1 5.0 1.22 16.9 16.4 17.5 1.07<br />
13.4 13.4 13.4 1.00 2.7 -1 2.4 -1 3.1 -1 1.27 -1 16.1 -1 15.8 -1 16.5 -1 1.04 -1<br />
13.2 ** 13.4 ** 12.9 ** 0.97 ** ... ... ... ... ... ... ... ...<br />
... ... ... ... . -2 . -2 . -2 . -2 ... ... ... ...<br />
... ... ... ... ... ... ... ... ... ... ... ...<br />
. . . . ... ... ... ... ... ... ... ...<br />
14.5 -1 14.4 -1 14.6 -1 1.02 -1 3.8 -1 2.6 -1 5.0 -1 1.88 -1 18.3 -1 17.1 -1 19.6 -1 1.15 -1<br />
14.6 14.5 14.7 1.02 2.9 -1 2.7 -1 3.2 -1 1.22 -1 18.3 -1 18.0 -1 18.6 -1 1.03 -1<br />
12.3 -1 12.2 -1 12.4 -1 1.01 -1 3.3 -1 2.9 -1 3.6 -1 1.27 -1 15.7 -1 15.3 -1 16.2 -1 1.06 -1<br />
13.1 13.2 13.0 0.99 3.1 -1 2.5 -1 3.6 -1 1.43 -1 16.2 -1 15.7 -1 16.7 -1 1.06 -1<br />
10.1 * 10.2 * 10.1 * 0.99 * 1.7 * 2.2 * 1.3 * 0.62 * 11.9 * 12.3 * 11.4 * 0.93 *<br />
12.8 -2 12.7 -2 13.0 -2 1.02 -2 0.5 -2 0.5 -2 0.5 -2 0.97 -2 13.5 -2 13.4 -2 13.5 -2 1.01 -2<br />
12.9 13.2 12.6 0.95 1.8 1.5 2.0 1.36 15.1 15.2 14.9 0.98<br />
... ... ... ... . . . . ... ... ... ...<br />
13.8 13.9 13.7 0.99 3.1 -1 2.9 -1 3.2 -1 1.11 -1 16.9 -1 16.8 -1 16.9 -1 1.00 -1<br />
13.7 13.7 13.6 0.99 3.6 2.8 4.4 1.60 17.5 16.8 18.2 1.08<br />
13.2 -1 13.2 -1 13.2 -1 1.00 -1 2.8 -1 2.5 -1 3.0 -1 1.21 -1 16.0 -1 15.8 -1 16.2 -1 1.03 -1<br />
12.5 ** 12.1 ** 12.9 ** 1.06 ** ... ... ... ... 12.5 ** 12.1 ** 12.9 ** 1.06 **<br />
13.5 13.5 13.6 1.00 3.1 -1 2.8 -1 3.5 -1 1.27 -1 16.4 -1 16.0 -1 16.9 -1 1.06 -1<br />
12.0 12.1 12.0 0.99 3.8 3.0 4.6 1.51 16.0 15.2 16.7 1.10<br />
12.9 13.0 12.8 0.98 2.6 2.6 2.6 0.99 15.7 15.8 15.5 0.99<br />
13.5 -1 13.4 -1 13.6 -1 1.01 -1 2.9 -1 2.5 -1 3.3 -1 1.35 -1 16.4 -1 15.9 -1 16.9 -1 1.06 -1<br />
11.9 11.8 11.9 1.00 4.8 4.0 5.6 1.40 16.8 15.9 17.6 1.11<br />
SOUTH AND WEST ASIA<br />
8.6 10.4 6.6 0.63 0.2 -1 0.3 -1 0.1 -1 0.24 -1 8.1 -1 10.1 -1 6.1 -1 0.60 -1<br />
... ... ... ... 0.5 -1 0.7 -1 0.4 -1 0.61 -1 ... ... ... ...<br />
11.9 +1 11.8 +1 12.1 +1 1.02 +1 0.4 +1 0.5 +1 0.4 +1 0.68 +1 12.4 +1 12.3 +1 12.4 +1 1.01 +1<br />
10.0 ** , -2 10.2 ** , -2 9.7 ** , -2 0.95 ** , -2 0.9 1.0 0.7 0.73 10.7 ** , -2 ... ... ...<br />
12.2 12.7 11.8 0.93 2.1 2.1 2.1 1.01 14.4 14.8 13.9 0.94<br />
... ... ... ... 0.6 -2 0.6 -2 0.7 -2 1.08 -2 ... ... ... ...<br />
... ... ... ... ... ... ... ... ... ... ... ...<br />
7.1 * 7.9 * 6.3 * 0.80 * 0.3 * , -2 0.3 * , -2 0.2 * , -2 0.83 * , -2 7.3 ** , -1 8.0 ** , -1 6.5 ** , -1 0.81 ** , -1<br />
... ... ... ... 0.8 0.5 1.0 1.92 ... ... ... ...<br />
SUB-SAHARAN AFRICA<br />
10.0 ** 11.2 ** 8.8 ** 0.78 ** 0.2 0.2 0.2 0.80 10.2 ** 11.5 ** 9.0 ** 0.78 **<br />
... ... ... ... 0.5 -1 0.8 -1 0.3 -1 0.38 -1 ... ... ... ...<br />
151
TABLE<br />
12<br />
SCHOOL LIFE EXPECTANCY / ISCED 0-6 / 2010<br />
School life expectancy (approximation method) in years<br />
REGION<br />
Pre-primary (ISCED 0)<br />
Primary and lower secondary (ISCED 1 and 2)<br />
net of repetition<br />
Country or territory<br />
MF M F GPI MF M F GPI<br />
(1) (2) (3) (4) (5) (6) (7) (8)<br />
Botswana 0.6 -1 0.6 -1 0.6 -1 1.02 -1 ... ... ... ...<br />
Burkina Faso 0.1 +1 0.1 +1 0.1 +1 1.01 +1 5.2 5.5 4.9 0.88<br />
Burundi 0.3 0.3 0.3 1.00 7.3 ** 7.5 ** 7.0 ** 0.94 **<br />
Cameroon 0.6 0.6 0.6 1.02 7.7 -1 8.3 ** , -1 7.2 ** , -1 0.86 ** , -1<br />
Cape Verde 2.1 2.1 2.1 1.00 8.3 8.2 8.4 1.03<br />
Central African Republic 0.2 +1 0.2 +1 0.2 +1 1.02 +1 4.9 -1 5.8 -1 4.0 -1 0.68 -1<br />
Chad 0.1 0.1 0.1 0.91 5.3 6.3 4.2 0.66<br />
Comoros 0.7 -2 0.7 -2 0.6 -2 0.97 -2 ... ... ... ...<br />
Congo 0.4 0.4 0.4 1.07 ... ... ... ...<br />
Côte d’Ivoire 0.1 +1 0.1 +1 0.1 +1 1.00 +1 ... ... ... ...<br />
Democratic Republic of the Congo 0.1 0.1 0.1 1.06 ... ... ... ...<br />
Equatorial Guinea 2.2 -2 1.9 -2 2.5 -2 1.33 -2 ... ... ... ...<br />
Eritrea 0.3 0.3 0.3 0.95 3.1 3.4 2.8 0.83<br />
Ethiopia 0.1 0.1 0.1 0.96 7.7 8.1 7.2 0.88<br />
Gabon 1.3 +1 1.2 +1 1.3 +1 1.04 +1 ... ... ... ...<br />
Gambia 1.2 1.2 1.2 1.04 6.6 ** 6.5 ** 6.7 ** 1.02 **<br />
Ghana 2.1 ** , -1 2.1 ** , -1 2.2 ** , -1 1.04 ** , -1 8.9 +1 9.0 +1 8.8 +1 0.97 +1<br />
Guinea 0.4 0.4 0.4 0.99 6.3 -1 7.1 -1 5.5 -1 0.77 -1<br />
Guinea-Bissau 0.2 0.2 0.2 1.06 ... ... ... ...<br />
Kenya 1.6 -1 1.6 -1 1.6 -1 0.99 -1 ... ... ... ...<br />
Lesotho 1.0 ... ... ... 7.3 ** 6.9 ** 7.7 ** 1.12 **<br />
Liberia ... ... ... ... ... ... ... ...<br />
Madagascar 0.3 0.3 0.3 1.02 8.0 ** , -1 8.0 ** , -1 7.9 ** , -1 0.98 ** , -1<br />
Malawi ... ... ... ... 8.3 ** 8.2 ** 8.3 ** 1.02 **<br />
Mali 0.1 +1 0.1 +1 0.1 +1 1.05 +1 5.3 5.8 4.8 0.83<br />
Mauritius 1.9 1.9 1.9 0.99 8.5 8.4 8.6 1.02<br />
Mozambique ... ... ... ... 8.5 +1 8.9 +1 8.0 +1 0.90 +1<br />
Namibia ... ... ... ... ... ... ... ...<br />
Niger 0.2 +1 0.2 +1 0.2 +1 1.07 +1 4.4 4.9 3.9 0.80<br />
Nigeria 0.4 0.4 0.4 0.99 6.4 ** 6.7 ** 6.1 ** 0.90 **<br />
Rwanda 0.3 +1 0.3 +1 0.4 +1 1.05 +1 8.8 8.7 9.0 1.03<br />
Sao Tome and Principe 1.9 +1 1.8 +1 1.9 +1 1.05 +1 9.2 +1 9.0 +1 9.3 +1 1.04 +1<br />
Senegal 0.4 0.4 0.4 1.12 6.2 -2 6.3 -2 6.2 -2 0.98 -2<br />
Seychelles 2.0 2.1 2.0 0.92 11.0 ** 10.9 ** 11.1 ** 1.01 **<br />
Sierra Leone 0.2 ** , +1 0.2 ** , +1 0.2 ** , +1 1.03 ** , +1 8.0 ** , +1 8.6 ** , +1 7.6 ** , +1 0.88 ** , +1<br />
Somalia ... ... ... ... ... ... ... ...<br />
South Africa 0.7 -1 0.6 -1 0.7 -1 1.00 -1 ... ... ... ...<br />
Swaziland 0.7 0.7 0.7 1.03 8.6 8.7 8.5 0.98<br />
Togo 0.3 0.3 0.3 1.02 8.6 ** ... ... ...<br />
Uganda 0.4 0.4 0.4 1.05 9.4 ** 9.4 ** 9.3 ** 0.99 **<br />
United Republic of Tanzania 0.7 0.7 0.7 1.02 ... ... ... ...<br />
Zambia ... ... ... ... 9.3 9.3 9.2 0.99<br />
Zimbabwe ... ... ... ... ... ... ... ...<br />
REGIONAL AVERAGES<br />
WORLD 1.3 1.3 1.3 1.00 7.9 ** 8.0 ** 7.8 ** 0.97 **<br />
Arab States 0.5 ** 0.5 ** 0.5 ** 0.94 ** 7.7 ** 7.9 ** 7.5 ** 0.94 **<br />
Central and Eastern Europe 2.5 ** 2.5 ** 2.4 ** 0.98 ** … … … …<br />
Central Asia 1.1 1.1 1.1 1.00 8.9 8.9 8.8 0.98<br />
East Asia and the Pacific 1.5 1.5 1.5 1.00 8.6 ** 8.5 8.7 ** 1.03 **<br />
Latin America and the Caribbean 1.9 1.9 1.9 1.01 8.7 ** 8.7 ** 8.7 ** 1.00 **<br />
North America and Western Europe 2.4 2.4 2.4 1.01 ... ... ... ...<br />
South and West Asia 1.3 1.3 1.4 1.02 7.1 ** , -1 7.2 ** , -1 6.9 ** , -1 0.96 ** , -1<br />
Sub-Saharan Africa 0.5 0.5 0.5 1.01 7.2 ** 7.5 ** 6.8 ** 0.91 **<br />
152
OPPORTUNITIES LOST: THE IMPACT OF GRADE REPETITION AND EARLY SCHOOL LEAVING<br />
School life expectancy (approximation method) in years<br />
Primary and secondary (ISCED 1-3) Tertiary (ISCED 5-6) Primary to tertiary (ISCED 1-6)<br />
MF M F GPI MF M F GPI MF M F GPI<br />
(9) (10) (11) (12) (13) (14) (15) (16) (17) (18) (19) (20)<br />
11.7 ** , -1 11.7 ** , -1 11.7 ** , -1 1.00 ** , -1 ... ... ... ... ... ... ... ...<br />
6.6 +1 7.0 +1 6.2 +1 0.88 +1 0.2 +1 0.3 +1 0.1 +1 0.48 +1 6.9 +1 7.4 +1 6.4 +1 0.86 +1<br />
11.2 ** 11.5 ** 10.8 ** 0.94 ** 0.2 0.2 0.1 0.54 11.3 ** 11.8 ** 10.9 ** 0.93 **<br />
10.2 ** 11.0 ** 9.4 ** 0.85 ** 0.7 0.6 0.5 0.81 10.9 ** 11.7 ** 9.9 ** 0.85 **<br />
11.8 11.5 12.0 1.04 0.9 0.8 1.0 1.29 12.7 12.4 13.1 1.06<br />
7.1 ** , +1 8.4 ** , +1 5.8 ** , +1 0.69 ** , +1 0.1 0.2 0.1 0.32 6.8 ** 8.1 ** 5.5 ** 0.68 **<br />
7.3 8.8 5.7 0.64 0.1 ** 0.2 ** 0.03 ** 0.17 ** 7.4 ** 9.1 ** 5.7 ** 0.63 **<br />
... ... ... ... 0.4 0.5 0.3 0.74 ... ... ... ...<br />
... ... ... ... 0.3 ... ... ... ... ... ... ...<br />
... ... ... ... ... ... ... ... ... ... ... ...<br />
7.9 8.9 6.9 0.77 0.3 -1 0.5 -1 0.1 -1 0.31 -1 8.5 ** , -1 9.8 ** , -1 7.2 ** , -1 0.73 ** , -1<br />
... ... ... ... ... ... ... ... ... ... ... ...<br />
4.5 5.0 4.0 0.79 0.1 0.2 0.05 0.33 4.6 5.2 4.0 0.78<br />
8.4 ** 8.9 ** 7.8 ** 0.88 ** 0.3 0.4 0.1 0.36 8.7 ** 9.3 ** 8.0 ** 0.86 **<br />
... ... ... ... ... ... ... ... ... ... ... ...<br />
8.3 ** 8.3 ** 8.2 ** 0.99 ** 0.2 -2 ... ... ... 8.7 ** , -2 ... ... ...<br />
10.8 ** , +1 11.0 ** , +1 10.5 ** , +1 0.96 ** , +1 0.6 +1 0.7 +1 0.5 +1 0.62 +1 11.4 ** , +1 11.8 ** , +1 11.0 ** , +1 0.94 ** , +1<br />
8.4 ** , -1 9.5 ** , -1 7.2 ** , -1 0.75 ** , -1 0.5 -2 0.8 -2 0.3 -2 0.33 -2 8.8 ** , -2 10.2 ** , -2 7.4 ** , -2 0.72 ** , -2<br />
... ... ... ... ... ... ... ... ... ... ... ...<br />
10.8 ** , -1 11.1 ** , -1 10.5 ** , -1 0.95 ** , -1 0.2 -1 0.2 -1 0.2 -1 0.70 -1 11.1 ** , -1 11.4 ** , -1 10.7 ** , -1 0.94 ** , -1<br />
9.6 9.3 9.9 1.06 ... ... ... ... ... ... ... ...<br />
... ... ... ... ... ... ... ... ... ... ... ...<br />
10.2 ** , -1 10.4 ** , -1 10.0 ** , -1 0.96 ** , -1 0.2 0.2 0.2 0.87 10.4 ** , -1 10.7 ** , -1 10.2 ** , -1 0.96 ** , -1<br />
10.3 ** 10.3 ** 10.3 ** 1.01 ** 0.04 ** 0.05 ** 0.03 ** 0.61 ** 10.4 ** 10.4 ** 10.4 ** 1.00 **<br />
7.2 +1 7.9 +1 6.4 +1 0.82 +1 0.3 +1 0.5 +1 0.2 +1 0.46 +1 7.5 +1 8.3 +1 6.6 +1 0.80 +1<br />
12.2 ** 12.2 ** 12.2 ** 1.00 ** 1.2 ** , -2 1.1 ** , -2 1.4 ** , -2 1.24 ** , -2 13.6 ** , -2 13.4 ** , -2 13.8 ** , -2 1.03 ** , -2<br />
9.5 +1 10.0 +1 8.9 +1 0.89 +1 ... ... ... ... ... ... ... ...<br />
... ... ... ... 0.5 -2 0.4 -2 0.6 -2 1.35 -2 ... ... ... ...<br />
4.8 ** 5.4 ** 4.3 ** 0.79 ** 0.1 +1 0.1 +1 0.04 +1 0.38 +1 4.9 ** 5.5 ** 4.3 ** 0.78 **<br />
7.7 ** 8.1 ** 7.2 ** 0.89 ** ... ... ... ... ... ... ... ...<br />
10.7 +1 10.6 +1 10.9 +1 1.03 +1 0.3 0.3 0.2 0.77 10.9 10.9 11.0 1.01<br />
11.2 ** , +1 11.1 ** , +1 11.3 ** , +1 1.02 ** , +1 0.2 0.2 0.2 0.98 10.8 ** 10.8 ** 10.8 ** 1.00 **<br />
7.8 7.8 7.8 0.99 0.4 * 0.5 ** 0.3 ** 0.60 ** 8.2 * 8.3 ** 8.0 ** 0.97 **<br />
13.1 ** 12.8 ** 13.3 ** 1.04 ** . -2 . -2 . -2 . -2 14.3 -2 13.5 ** , -2 15.2 ** , -2 1.12 ** , -2<br />
... ... ... ... ... ... ... ... ... ... ... ...<br />
... ... ... ... ... ... ... ... ... ... ... ...<br />
11.8 ** , -1 11.8 ** , -1 11.8 ** , -1 0.99 ** , -1 ... ... ... ... ... ... ... ...<br />
11.0 11.3 10.6 0.94 ... ... ... ... ... ... ... ...<br />
... ... ... ... ... ... ... ... ... ... ... ...<br />
10.6 ** 10.7 ** 10.5 ** 0.98 ** 0.2 -1 0.2 -1 0.2 -1 0.79 -1 11.1 ** , -1 11.3 ** , -1 10.8 ** , -1 0.96 ** , -1<br />
... ... ... ... 0.1 0.1 0.1 0.82 ... ... ... ...<br />
... ... ... ... ... ... ... ... ... ... ... ...<br />
... ... ... ... 0.3 0.3 0.3 0.80 ... ... ... ...<br />
REGIONAL AVERAGES<br />
10.1 ** 10.3 ** 9.9 ** 0.97 ** 1.4 1.4 1.5 1.07 11.5 ** 11.6 ** 11.3 ** 0.98 **<br />
9.8 ** 10.2 ** 9.4 ** 0.93 ** 1.2 ** 1.2 ** 1.2 ** 1.02 ** 11.0 ** 11.4 ** 10.6 ** 0.93 **<br />
10.8 ** 10.9 ** 10.7 ** 0.98 ** 3.2 ** 2.9 ** 3.6 ** 1.23 ** 14.0 ** 13.8 ** 14.2 ** 1.03 **<br />
10.8 10.9 10.7 0.98 1.2 ** 1.2 ** 1.3 ** 1.07 ** 12.5 ** 12.5 ** 12.4 ** 0.99 **<br />
10.7 10.5 10.8 1.02 1.5 1.4 1.5 1.05 12.2 12.0 12.3 1.03<br />
11.7 ** 11.6 ** 11.8 ** 1.02 ** 2.1 1.8 2.3 1.26 13.7 ** 13.4 ** 14.1 ** 1.05 **<br />
12.5 12.5 12.5 1.00 3.8 ** 3.3 ** 4.3 ** 1.33 ** 16.5 ** 16.0 ** 17.0 ** 1.07 **<br />
9.5 ** 9.7 ** 9.2 ** 0.94 ** 0.8 0.9 0.7 0.75 10.3 ** 10.7 ** 9.9 ** 0.93 **<br />
8.7 9.2 8.2 0.89 0.3 ** 0.4 ** 0.3 ** 0.61 ** 9.1 ** 9.7 ** 8.5 ** 0.88 **<br />
153
TABLE<br />
13<br />
PUBLIC EXPENDITURE ON EDUCATION BY NATURE OF SPENDING / ISCED 1-6 /<br />
Financial year ending in 2010<br />
Total public expenditure per student<br />
Total public expenditure on<br />
education<br />
154<br />
REGION<br />
Country or territory<br />
ARAB STATES<br />
as a % of GDP per capita<br />
in PPP q dollars<br />
as a %<br />
of GDP<br />
as a % of total<br />
government<br />
expenditure<br />
Primary Secondary Tertiary Primary Secondary Tertiary<br />
(ISCED 1) (ISCED 2-3) (ISCED 5-6) (ISCED 1) (ISCED 2-3) (ISCED 5-6)<br />
(1) (2) (3) (4) (5) (6) (7) (8)<br />
Algeria … … … … … … 4.3 -2 20.27 -2<br />
Bahrain … … … … … … 2.9 -2 11.72 -2<br />
Djibouti 24.6 -2 33.1 -2 … 542 -2 729 -2 … … …<br />
Egypt … … … … … … 3.8 -2 11.9 -2<br />
Iraq … … … … … … … …<br />
Jordan 11.9 -2 14.3 -2 … 662 -2 794 -2 … … …<br />
Kuwait 10.0 -2 13.7 -2 … 5,268 -2 7,191 -2 … … …<br />
Lebanon … … 10.0 -1 … … 1,317 -1 1.8 -1 7.2 -1<br />
Libya … … … … … … … …<br />
Mauritania 13.4 31.2 ** 193.5 329 765 ** 4,754 4.3 15.2<br />
Morocco 16.9 -1 … 83.3 -1 771 -1 … 3,794 -1 5.4 -1 25.7 -2<br />
Oman 12.8 -1 14.6 -1 41.6 -1 3,428 -1 3,923 -1 11,155 -1 4.3 -1 …<br />
Palestine … … … … … … … …<br />
Qatar 10.3 -1 11.0 -1 … 8,657 -1 9,198 -1 … 2.4 -2 8.2 -2<br />
Saudi Arabia … … … … … … 5.6 -2 19.3 -2<br />
Sudan (pre-secession) a … … … … … … … …<br />
Syrian Arab Republic 16.8 -1 14.2 -1 … 870 -1 739 -1 … … …<br />
Tunisia 17.3 -2 24.3 -2 46.1 -2 1,536 -2 2,163 -2 4,101 -2 6.3 -2 22.7 -2<br />
United Arab Emirates 6.2 -1 8.6 ** , -1 19.9 -1 3,123 -1 4,288 ** , -1 9,934 -1 1.0 -1 23.4 -1<br />
Yemen … … … … … … 5.2 -2 16.0 -2<br />
CENTRAL AND EASTERN EUROPE<br />
Albania … … … … … … … …<br />
Belarus … … 14.7 -1 … … 1,884 -1 4.5 -1 8.9 -1<br />
Bosnia and Herzegovina … … … … … … … …<br />
Bulgaria 24.4 -2 24.2 -2 24.8 -2 3,390 -2 3,370 -2 3,452 -2 4.4 -2 12.3 -2<br />
Croatia … … 26.0 -1 … … 5,213 -1 4.3 -1 …<br />
Czech Republic 16.4 -1 25.3 -1 26.4 -1 4,071 -1 6,294 -1 6,564 -1 4.5 -1 9.8 -1<br />
Estonia 25.9 -2 29.6 -2 22.1 -2 5,678 -2 6,477 -2 4,841 -2 5.7 -2 14.2 -2<br />
Hungary 22.2 -1 22.8 -1 28.4 -1 4,475 -1 4,589 -1 5,731 -1 5.1 -1 10.0 -1<br />
Latvia 31.4 -1 32.3 -1 14.2 -1 5,070 -1 5,222 -1 2,288 -1 5.6 -1 12.8 -1<br />
Lithuania 19.0 -1 27.6 -1 18.1 -1 3,234 -1 4,712 -1 3,086 -1 5.7 -1 12.9 -1<br />
Montenegro … … … … … … … …<br />
Poland 26.3 -1 24.3 -1 19.0 -1 4,975 -1 4,586 -1 3,595 -1 5.1 -1 11.4 -1<br />
Republic of Moldova 41.4 39.4 44.8 1,289 1,224 1,395 9.1 22.3<br />
Romania … … … … … … … …<br />
Russian Federation … … 14.2 -2 … … 2,889 -2 4.1 -2 11.9 -2<br />
Serbia 61.6 -1 14.4 -1 43.3 -1 6,833 -1 1,599 -1 4,795 -1 5.0 -1 9.5 -1<br />
Slovakia 18.7 -1 18.3 -1 18.6 -1 4,226 -1 4,143 -1 4,211 -1 4.1 -1 9.8 -1<br />
Slovenia … … 24.7 -1 … … 6,703 -1 5.7 -1 11.6 -1<br />
The former Yugoslav Rep. of Macedonia … … … … … … … …<br />
Turkey … … … … … … … …<br />
Ukraine … … … … … … … …<br />
CENTRAL ASIA<br />
Armenia 16.4 17.8 7.5 899 974 407 3.2 13.0 -1<br />
Azerbaijan … … 22.3 -1 … … 2,123 -1 3.2 -1 10.9 -1<br />
Georgia 14.8 -2 15.5 -2 11.4 -2 726 -2 760 -2 559 -2 3.2 * , -1 7.7 * , -1<br />
Kazakhstan … … 10.2 -1 … … 1,162 -1 3.1 -1 …<br />
Kyrgyzstan … … 17.8 -1 … … 406 -1 6.2 -1 24.7 -2<br />
Mongolia 14.6 18.1 6.0 588 731 242 5.4 14.6 -1<br />
Tajikistan … 20.4 -1 21.2 -1 … 427 -1 443 -1 4.0 14.7<br />
Turkmenistan … … … … … … … …<br />
Uzbekistan … … … … … … … …<br />
EAST ASIA AND THE PACIFIC<br />
Australia 20.2 -1 18.8 -1 20.7 -1 7,980 -1 7,403 -1 8,145 -1 5.1 -1 12.9 -2<br />
Brunei Darussalam 5.1 7.8 32.0 2,558 3,893 15,986 2.0 13.7 +1<br />
Cambodia 6.8 6.8 ** … 149 150 ** … 2.6 …<br />
China … … … … … … … …
OPPORTUNITIES LOST: THE IMPACT OF GRADE REPETITION AND EARLY SCHOOL LEAVING<br />
<strong>Education</strong>al expenditure by nature of spending as a percentage of total educational expenditure in public institutions<br />
Primary, secondary and post-secondary non-tertiary (ISCED 1-4) Tertiary (ISCED 5-6)<br />
Salaries, all staff Other current Total current Capital Salaries, all staff Other current Total current Capital<br />
(9) (10) (11) (12) (13) (14) (15) (16)<br />
… … … … … … … …<br />
… … … … … … … …<br />
… … … … … … … …<br />
… … … … … … … …<br />
… … … … … … … …<br />
82.4 -2 4.8 -2 87.1 -2 12.9 -2 … … … …<br />
… … … … … … … …<br />
ARAB STATES<br />
… … … … 97.1 -2 0.4 -2 97.4 -2 2.6 -2<br />
… … … … … … … …<br />
… … … … … … … …<br />
72.3 ** , -1 14.1 ** , -1 86.4 ** , -1 13.6 ** , -1 62.6 23.5 86.1 13.9<br />
90.7 -2 0.3 -2 91.1 -2 8.9 -2 … … … …<br />
… … … … … … … …<br />
… … … … … … … …<br />
… … … … … … … …<br />
… … … … … … … …<br />
… … … … … … … …<br />
… … … … … … 82.4 -2 17.6 -2<br />
82.6 -1 13.5 -1 96.1 -1 3.9 -1 … … … …<br />
… … … … … … … …<br />
CENTRAL AND EASTERN EUROPE<br />
… … … … … … … …<br />
… … … … 73.1 -1 21.0 -1 94.2 -1 5.8 -1<br />
… … … … … … … …<br />
68.9 -2 17.5 -2 86.5 -2 13.5 -2 43.5 -2 40.8 -2 84.3 -2 15.7 -2<br />
… … … … 53.7 -1 29.1 -1 82.8 -1 17.2 -1<br />
55.5 -1 33.8 -1 89.3 -1 10.7 -1 45.4 -1 44.0 -1 89.3 -1 10.7 -1<br />
… … … … … … … …<br />
71.7 -1 22.4 -1 94.2 -1 5.8 -1 52.0 -1 32.1 -1 84.1 -1 15.9 -1<br />
70.2 -1 18.1 -1 88.3 -1 11.7 -1 76.6 -1 19.7 -1 96.2 -1 3.8 -1<br />
84.0 -1 13.1 -1 97.1 -1 2.9 -1 67.1 -1 24.3 -1 91.4 -1 8.6 -1<br />
… … … … … … … …<br />
62.3 -2 30.8 -2 93.1 -2 6.9 -2 67.1 -1 19.8 -1 86.9 -1 13.1 -1<br />
66.5 25.7 92.2 7.8 59.8 33.8 93.7 6.3<br />
… … … … … … … …<br />
… … … … … … … …<br />
80.6 -1 17.0 -1 97.6 -1 2.4 -1 65.7 -1 30.8 -1 96.6 -1 3.4 -1<br />
60.7 -1 34.5 -1 95.2 -1 4.8 -1 50.7 -1 40.0 -1 90.7 -1 9.3 -1<br />
… … … … 60.8 -1 27.1 -1 87.8 -1 12.2 -1<br />
… … … … … … … …<br />
… … … … … … … …<br />
… … … … … … … …<br />
… … … … … … … …<br />
CENTRAL ASIA<br />
… … … … 59.5 -1 38.9 -1 98.5 -1 1.5 -1<br />
… … … … … … … …<br />
… … … … 44.5 -1 44.9 -1 89.4 -1 10.6 -1<br />
… … … … 69.8 -1 20.1 -1 89.9 -1 10.1 -1<br />
… … … … … … … …<br />
… … … … … … … …<br />
… … … … … … … …<br />
… … … … … … … …<br />
EAST ASIA AND THE PACIFIC<br />
64.4 -1 20.8 -1 85.2 -1 14.8 -1 53.6 -1 33.4 -1 86.9 -1 13.1 -1<br />
… … … … … … … …<br />
… … … … … … … …<br />
… … … … … … … …<br />
155
TABLE<br />
13<br />
PUBLIC EXPENDITURE ON EDUCATION BY NATURE OF SPENDING / ISCED 1-6 /<br />
Financial year ending in 2010<br />
Total public expenditure per student<br />
Total public expenditure on<br />
education<br />
156<br />
REGION<br />
Country or territory<br />
as a % of GDP per capita<br />
in PPP q dollars<br />
as a %<br />
of GDP<br />
as a % of total<br />
government<br />
expenditure<br />
Primary Secondary Tertiary Primary Secondary Tertiary<br />
(ISCED 1) (ISCED 2-3) (ISCED 5-6) (ISCED 1) (ISCED 2-3) (ISCED 5-6)<br />
(1) (2) (3) (4) (5) (6) (7) (8)<br />
China, Hong Kong SAR 15.1 18.0 26.8 6,571 7,825 11,676 3.6 20.2<br />
China, Macao SAR … … 15.8 -1 … … 8,066 -1 2.6 -1 13.0 -1<br />
Cook Islands … … … … … … … …<br />
Democratic People’s Republic of Korea … … … … … … … …<br />
Fiji … … … … … … 4.5 -1 14.7 -1<br />
Indonesia 10.6 8.8 23.1 457 380 1,001 3.0 17.1<br />
Japan 23.7 24.3 25.3 7,605 7,798 8,097 3.8 9.4 -2<br />
Kiribati … … … … … … … …<br />
Lao People’s Democratic Republic … … … … … … 3.3 13.2<br />
Malaysia 14.6 -1 20.2 -1 60.7 -1 2,025 -1 2,802 -1 8,411 -1 5.8 -1 18.9 -1<br />
Marshall Islands … … … … … … … …<br />
Micronesia (Federated States of) … … … … … … … …<br />
Myanmar … … … … … … … …<br />
Nauru … … … … … … … …<br />
New Zealand 21.9 23.6 31.4 6,423 6,918 9,209 7.2 16.1 -2<br />
Niue … … … … … … … …<br />
Palau … … … … … … … …<br />
Papua New Guinea … … … … … … … …<br />
Philippines 9.0 -2 9.1 -2 … 330 -2 335 -2 … 2.7 -1 15.0 -1<br />
Republic of Korea 23.1 -1 23.6 -1 13.0 -1 6,269 -1 6,413 -1 3,545 -1 5.0 -1 15.8 -2<br />
Samoa … … … … … … 5.3 -2 13.4 -2<br />
Singapore 11.5 17.5 28.7 5,879 8,948 14,676 3.3 10.3<br />
Solomon Islands … … … … … … 6.1 -2 …<br />
Thailand 24.4 -1 9.3 -1 22.7 -1 1,928 -1 734 -1 1,794 -1 3.8 22.3<br />
Timor-Leste … … 83.9 -1 … … 735 -1 14.0 11.7<br />
Tokelau … … … … … … … …<br />
Tonga … … … … … … … …<br />
Tuvalu … … … … … … … …<br />
Vanuatu 17.0 -1 20.1 -1 … 744 -1 883 -1 … 5.2 -1 23.7 -1<br />
Viet Nam 19.4 -2 17.0 -2 60.6 -2 549 -2 481 -2 1,719 -2 5.3 -2 19.8 -2<br />
LATIN AMERICA AND THE CARIBBEAN<br />
Anguilla … … … … … … 3.5 -2 10.7 -2<br />
Antigua and Barbuda 8.0 -1 12.2 -1 15.3 -1 1,751 -1 2,683 -1 3,364 -1 2.5 -1 9.8 -1<br />
Argentina 16.8 -1 27.1 -1 19.1 -1 2,472 -1 3,972 -1 2,798 -1 6.0 -1 14.0 -1<br />
Aruba 15.3 -1 21.5 -1 39.4 -1 … … … 5.9 -1 20.5 -1<br />
Bahamas … … … … … … … …<br />
Barbados … 26.4 -1 37.9 -1 … 5,322 -1 7,650 -1 6.7 -1 14.3 -1<br />
Belize 17.0 -1 24.9 -1 31.0 -1 1,151 -1 1,683 -1 2,095 -1 6.1 -1 18.7 -2<br />
Bermuda 11.7 17.5 27.5 … … … 2.6 13.4<br />
Bolivia (Plurinational State of) … … … … … … … …<br />
Brazil 20.5 -1 20.9 -1 28.9 -1 2,139 -1 2,178 -1 3,015 -1 5.7 -1 16.8 -1<br />
British Virgin Islands 10.4 -1 21.9 -1 … … … … 4.3 13.6<br />
Cayman Islands … … … … … … … …<br />
Chile 17.4 -1 17.7 -1 13.7 -1 2,484 -1 2,537 -1 1,959 -1 4.5 -1 …<br />
Colombia 15.7 15.2 29.3 1,483 1,439 2,771 4.8 14.9 -2<br />
Costa Rica 14.6 -1 14.4 -1 … 1,633 -1 1,612 -1 … 6.3 -1 23.1 -1<br />
Cuba 49.3 52.1 63.0 … … … 12.9 18.3<br />
Dominica 15.1 15.3 … 1,844 1,864 … 3.6 9.3<br />
Dominican Republic 7.5 6.7 … 704 630 … … …<br />
Ecuador … … … … … … … …<br />
El Salvador 8.8 -2 9.4 -2 … 586 -2 626 -2 … 3.2 …<br />
Grenada … … … … … … … …<br />
Guatemala 10.4 -2 6.2 -2 … 494 -2 293 -2 … 3.2 -2 …<br />
Guyana 8.2 11.6 18.7 282 399 642 3.7 16.7<br />
Haiti … … … … … … … …<br />
Honduras 18.7 * … … 735 * … … … …<br />
Jamaica 19.9 22.6 50.2 1,527 1,736 3,853 6.1 11.5<br />
Mexico 14.4 -1 15.6 -1 43.8 -1 2,002 -1 2,166 -1 6,075 -1 5.3 -1 …
OPPORTUNITIES LOST: THE IMPACT OF GRADE REPETITION AND EARLY SCHOOL LEAVING<br />
<strong>Education</strong>al expenditure by nature of spending as a percentage of total educational expenditure in public institutions<br />
Primary, secondary and post-secondary non-tertiary (ISCED 1-4) Tertiary (ISCED 5-6)<br />
Salaries, all staff Other current Total current Capital Salaries, all staff Other current Total current Capital<br />
(9) (10) (11) (12) (13) (14) (15) (16)<br />
… … 90.0 10.0 … … 80.5 19.5<br />
… … … … 56.1 -1 33.3 -1 89.4 -1 10.6 -1<br />
… … … … … … … …<br />
… … … … … … … …<br />
… … … … … … … …<br />
62.2 28.1 90.3 9.7 … … 72.9 27.1<br />
… … … … 44.6 36.6 81.1 18.9<br />
… … … … … … … …<br />
… … … … … … … …<br />
80.0 ** , -1 12.5 -1 92.5 -1 7.5 -1 50.0 -1 20.6 -1 70.6 -1 29.4 -1<br />
… … … … … … … …<br />
… … … … … … … …<br />
… … … … … … … …<br />
… … … … … … … …<br />
… … … … … … … …<br />
… … … … … … … …<br />
… … … … … … … …<br />
… … … … … … … …<br />
74.8 -1 17.4 -1 92.2 -1 7.8 -1 66.9 -1 20.6 -1 87.5 -1 12.5 -1<br />
58.8 -1 24.4 -1 83.2 -1 16.8 -1 43.3 -1 37.9 -1 81.2 -1 18.8 -1<br />
… … … … … … … …<br />
… … 88.9 11.1 … … 93.3 6.7<br />
… … … … … … … …<br />
… … … … … … 89.2 10.8<br />
… … … … … … 100.0 —<br />
… … … … … … … …<br />
… … … … … … … …<br />
… … … … … … … …<br />
87.3 -2 11.3 -2 98.6 -2 1.4 -2 . . . .<br />
… … … … … … … …<br />
LATIN AMERICA AND THE CARIBBEAN<br />
… … … … 3.2 * , -2 — * , -2 3.2 * , -2 96.8 * , -2<br />
… … … … 77.7 -1 20.4 -1 98.0 -1 2.0 -1<br />
86.7 -1 8.7 -1 95.4 -1 4.6 -1 86.5 -1 12.1 -1 98.6 -1 1.4 -1<br />
… … … … … … … …<br />
… … … … … … … …<br />
… … … … 90.5 -1 8.4 -1 98.9 -1 1.1 -1<br />
… … … … … … … …<br />
… … … … … … … …<br />
… … … … … … … …<br />
70.9 -1 23.7 -1 94.6 -1 5.4 -1 69.4 -1 17.0 -1 86.4 -1 13.6 -1<br />
… … … … … … … …<br />
… … … … … … … …<br />
85.5 -1 12.3 -1 97.8 -1 2.2 -1 61.9 -1 33.1 -1 94.9 -1 5.1 -1<br />
89.7 8.9 98.6 1.4 46.1 3.6 49.8 50.2<br />
86.8 -1 13.2 -1 100.0 -1 — -1 … … … …<br />
72.8 26.1 99.0 1.0 34.9 64.3 99.2 0.8<br />
79.4 -1 20.1 -1 99.5 -1 0.5 -1 . . . .<br />
72.0 16.0 88.0 12.0 … … … …<br />
… … … … … … … …<br />
70.6 20.2 90.8 9.2 … … … …<br />
… … … … … … … …<br />
73.9 -2 10.7 -2 84.5 -2 15.5 -2 … … 95.7 -2 4.3 -2<br />
… … 92.8 7.2 … … 94.1 5.9<br />
… … … … … … … …<br />
… … … … … … … …<br />
84.0 -2 5.5 -2 89.5 -2 10.5 -2 … … … …<br />
88.9 -1 8.0 -1 96.9 -1 3.1 -1 71.2 -1 22.3 -1 93.6 -1 6.4 -1<br />
157
TABLE<br />
13<br />
PUBLIC EXPENDITURE ON EDUCATION BY NATURE OF SPENDING / ISCED 1-6 /<br />
Financial year ending in 2010<br />
Total public expenditure per student<br />
Total public expenditure on<br />
education<br />
REGION<br />
Country or territory<br />
as a % of GDP per capita<br />
in PPP q dollars<br />
as a %<br />
of GDP<br />
as a % of total<br />
government<br />
expenditure<br />
Primary Secondary Tertiary Primary Secondary Tertiary<br />
(ISCED 1) (ISCED 2-3) (ISCED 5-6) (ISCED 1) (ISCED 2-3) (ISCED 5-6)<br />
(1) (2) (3) (4) (5) (6) (7) (8)<br />
158<br />
Montserrat … … … … … … 5.8 -1 8.4 -1<br />
Netherlands Antilles a … … … … … … … …<br />
Nicaragua … … … … … … … …<br />
Panama … … … … … … 3.8 -2 …<br />
Paraguay … … … … … … … …<br />
Peru 8.3 10.1 9.0 790 962 854 2.7 17.1<br />
Puerto Rico … … … … … … … …<br />
Saint Kitts and Nevis … … … … … … … …<br />
Saint Lucia 16.5 21.7 * … 1,739 2,280 * … 4.4 * 10.9 *<br />
Saint Vincent and the Grenadines 15.4 17.0 … 1,701 1,884 … 4.9 10.2<br />
Suriname … … … … … … … …<br />
Trinidad and Tobago 14.9 -1 … … 3,820 -1 … … … …<br />
Turks and Caicos Islands … … … … … … … …<br />
Uruguay … … … … … … … …<br />
Venezuela (Bolivarian Republic of) … … … … … … … …<br />
NORTH AMERICA AND WESTERN EUROPE<br />
Andorra 16.5 12.9 … … … … 2.9 …<br />
Austria 24.1 -2 27.4 -2 43.5 -2 9,590 -2 10,891 -2 17,321 -2 5.5 -2 11.2 -2<br />
Belgium 22.4 -2 36.5 -2 36.6 -2 8,272 -2 13,496 -2 13,534 -2 6.4 -2 12.9 -2<br />
Canada … … … … … … 4.8 -2 …<br />
Cyprus 31.5 -1 40.7 -1 52.8 -1 9,684 -1 12,515 -1 16,231 -1 7.9 -1 17.3 -1<br />
Denmark 28.9 -1 32.9 -1 56.8 -1 11,052 -1 12,605 -1 21,741 -1 8.7 -1 15.1 -1<br />
Finland 20.5 -1 36.1 -1 38.9 -1 7,311 -1 12,873 -1 13,877 -1 6.8 -1 12.1 -1<br />
France 18.4 -1 29.3 -1 39.8 -1 6,198 -1 9,890 -1 13,409 -1 5.9 -1 10.4 -1<br />
Germany 15.6 -2 21.8 -2 … 5,805 -2 8,102 -2 … 4.6 -2 10.4 -2<br />
Gibraltar … … … … … … … …<br />
Greece … … … … … … … …<br />
Holy See . . … . . … . .<br />
Iceland 27.2 -1 22.7 -1 30.0 -1 9,995 -1 8,341 -1 11,034 -1 7.8 -1 15.3 -1<br />
Ireland 18.6 -2 27.5 -2 32.7 -2 7,934 -2 11,762 -2 13,998 -2 5.7 -2 13.3 -2<br />
Israel 21.2 -1 16.9 -1 22.1 -1 5,835 -1 4,651 -1 6,074 -1 5.8 -1 13.6 -1<br />
Italy 25.5 -1 26.5 -1 25.5 -1 8,275 -1 8,586 -1 8,276 -1 4.7 -1 9.1 -1<br />
Liechtenstein 10.8 -2 18.9 -2 … … … … 2.1 -2 …<br />
Luxembourg 14.8 -2 21.5 -2 … 13,175 -2 19,166 -2 … … …<br />
Malta 20.5 -2 33.3 -2 44.4 -2 5,237 -2 8,499 -2 11,330 -2 5.8 -2 13.3 -2<br />
Monaco 3.5 -1 5.5 -1 . … … . 1.2 -1 6.4<br />
Netherlands 18.9 -1 27.3 -1 43.6 -1 7,777 -1 11,210 -1 17,897 -1 5.9 -1 11.5 -1<br />
Norway 21.6 -1 29.2 -1 49.1 -1 11,802 -1 15,969 -1 26,826 -1 7.3 -1 15.7 -1<br />
Portugal 22.4 -1 38.9 -1 30.6 -1 5,578 -1 9,712 -1 7,628 -1 5.8 -1 11.6 -1<br />
San Marino … … … … … … … …<br />
Spain 21.6 -1 28.0 -1 29.0 -1 6,977 -1 9,055 -1 9,383 -1 5.0 -1 10.8 -1<br />
Sweden 28.5 -1 33.2 -1 45.1 -1 10,584 -1 12,334 -1 16,759 -1 7.3 -1 13.2 -1<br />
Switzerland 20.5 -2 31.1 -2 43.8 -2 9,449 -2 14,297 -2 20,179 -2 5.4 -2 16.7 -2<br />
United Kingdom 24.3 -1 31.1 -1 20.6 -1 8,735 -1 11,168 -1 7,375 -1 5.6 -1 11.3 -1<br />
United States of America 22.4 -1 25.2 -1 19.4 -1 10,547 -1 11,844 -1 9,144 -1 5.4 -1 13.1 -1<br />
SOUTH AND WEST ASIA<br />
Afghanistan … … … … … … … …<br />
Bangladesh 8.8 -1 12.0 -1 27.7 -1 129 -1 176 -1 408 -1 2.2 -1 14.1 -1<br />
Bhutan 7.9 27.4 … 395 1,370 … 4.0 9.4<br />
India … … … … … … … …<br />
Iran (Islamic Republic of) 14.1 20.7 19.2 1,631 2,391 2,224 4.7 19.8<br />
Maldives 18.7 -2 … — -2 1,549 -2 … — -2 8.7 -1 16.0 -1<br />
Nepal 17.8 -1 … 55.8 -1 197 -1 … 619 -1 4.7 20.2<br />
Pakistan … … … … … … 2.4 9.9<br />
Sri Lanka 7.4 -1 … … 350 -1 … … 2.1 -1 8.1 -1<br />
SUB-SAHARAN AFRICA<br />
Angola … … … … … … 3.4 8.5<br />
Benin 13.0 -1 … 87.2 -1 204 -1 … 1,371 -1 4.5 -1 18.2 -1
OPPORTUNITIES LOST: THE IMPACT OF GRADE REPETITION AND EARLY SCHOOL LEAVING<br />
<strong>Education</strong>al expenditure by nature of spending as a percentage of total educational expenditure in public institutions<br />
Primary, secondary and post-secondary non-tertiary (ISCED 1-4) Tertiary (ISCED 5-6)<br />
Salaries, all staff Other current Total current Capital Salaries, all staff Other current Total current Capital<br />
(9) (10) (11) (12) (13) (14) (15) (16)<br />
… … … … … … … …<br />
… … … … … … … …<br />
… … … … … … … …<br />
… … … … … … … …<br />
… … … … … … … …<br />
65.5 13.5 78.9 21.1 66.1 16.1 82.2 17.8<br />
… … … … … … … …<br />
… … … … … … … …<br />
60.3 -2 23.7 -2 84.0 -2 16.0 -2 … … … …<br />
94.3 5.7 100.0 — . . . .<br />
… … … … … … … …<br />
… … … … … … … …<br />
… … … … … … … …<br />
… … … … … … … …<br />
… … … … … … … …<br />
NORTH AMERICA AND WESTERN EUROPE<br />
49.3 48.6 97.8 2.2 59.4 35.2 94.6 5.4<br />
76.1 -2 21.9 -2 98.0 -2 2.0 -2 59.1 -2 34.6 -2 93.7 -2 6.3 -2<br />
… … … … 77.0 -2 19.9 -2 96.9 -2 3.1 -2<br />
… … … … 58.4 -2 32.1 -2 90.5 -2 9.5 -2<br />
79.6 -1 10.0 -1 89.7 -1 10.3 -1 55.4 -1 24.1 -1 79.5 -1 20.5 -1<br />
75.2 -1 17.4 -1 92.7 -1 7.3 -1 78.0 -2 17.4 -2 95.5 -2 4.5 -2<br />
59.5 -1 33.0 -1 92.5 -1 7.5 -1 58.9 -1 37.2 -1 96.1 -1 3.9 -1<br />
72.9 -1 16.2 -1 89.1 -1 10.9 -1 70.2 -1 20.9 -1 91.1 -1 8.9 -1<br />
77.5 -2 15.7 -2 93.2 -2 6.8 -2 59.0 -2 31.1 -2 90.1 -2 9.9 -2<br />
… … … … … … … …<br />
… … … … … … … …<br />
. . . . … … … …<br />
69.2 -1 22.0 -1 91.3 -1 8.7 -1 79.4 -1 20.5 -1 99.9 -1 0.1 -1<br />
74.9 -2 16.0 -2 90.9 -2 9.1 -2 66.9 -2 23.8 -2 90.7 -2 9.3 -2<br />
75.7 -1 15.0 -1 90.7 -1 9.3 -1 61.2 -1 25.4 -1 86.6 -1 13.4 -1<br />
77.3 -1 18.5 -1 95.7 -1 4.3 -1 60.6 -1 30.5 -1 91.0 -1 9.0 -1<br />
71.8 -2 28.2 -2 100.0 -2 — -2 … … … …<br />
… … … … … … … …<br />
77.1 -2 14.7 -2 91.8 -2 8.2 -2 50.5 -2 43.0 -2 93.5 -2 6.5 -2<br />
92.8 6.0 98.8 1.2 . . . .<br />
71.0 -1 15.5 -1 86.5 -1 13.5 -1 62.1 -1 29.3 -1 91.4 -1 8.6 -1<br />
66.4 -1 19.2 -1 85.6 -1 14.4 -1 63.9 -1 30.2 -1 94.1 -1 5.9 -1<br />
86.0 -1 6.8 -1 92.8 -1 7.2 -1 70.2 -1 24.5 -1 94.8 -1 5.2 -1<br />
… … … … … … … …<br />
75.7 -1 15.5 -1 91.1 -1 8.9 -1 62.8 -1 18.4 -1 81.2 -1 18.8 -1<br />
63.0 -1 29.9 -1 92.8 -1 7.2 -1 60.7 -1 35.8 -1 96.5 -1 3.5 -1<br />
… … … … 68.2 -2 22.9 -2 91.1 -2 8.9 -2<br />
69.7 -1 20.0 -1 89.7 -1 10.3 -1 . . . .<br />
72.2 -1 16.5 -1 88.6 -1 11.4 -1 56.5 -1 36.6 -1 93.1 -1 6.9 -1<br />
SOUTH AND WEST ASIA<br />
… … … … … … … …<br />
54.3 -1 23.7 -1 77.9 -1 22.1 -1 78.4 8.7 87.1 12.9<br />
… … … … … … … …<br />
… … … … … … … …<br />
… … … … … … … …<br />
… … … … … … … …<br />
… … … … … … … …<br />
… … … … … … … …<br />
75.8 -1 13.9 -1 89.7 -1 10.3 -1 … … … …<br />
SUB-SAHARAN AFRICA<br />
… … … … … … … …<br />
83.9 -1 12.2 -1 96.1 -1 3.9 -1 48.6 -1 35.4 -1 84.0 -1 16.0 -1<br />
159
TABLE<br />
13<br />
PUBLIC EXPENDITURE ON EDUCATION BY NATURE OF SPENDING / ISCED 1-6 /<br />
Financial year ending in 2010<br />
Total public expenditure per student<br />
Total public expenditure on<br />
education<br />
REGION<br />
Country or territory<br />
as a % of GDP per capita<br />
in PPP q dollars<br />
as a %<br />
of GDP<br />
as a % of total<br />
government<br />
expenditure<br />
Primary Secondary Tertiary Primary Secondary Tertiary<br />
(ISCED 1) (ISCED 2-3) (ISCED 5-6) (ISCED 1) (ISCED 2-3) (ISCED 5-6)<br />
(1) (2) (3) (4) (5) (6) (7) (8)<br />
Botswana 8.3 -1 27.6 ** , -1 … 1,136 -1 3,758 ** , -1 … 7.8 -1 16.2 -1<br />
Burkina Faso 19.5 22.1 243.2 244 278 3,054 4.0 20.8<br />
Burundi 19.0 64.1 477.4 78 262 1,950 9.2 25.1<br />
Cameroon 6.6 28.0 ** 28.0 152 643 ** 643 3.5 17.9<br />
Cape Verde 16.9 -1 15.3 -1 46.5 -1 621 -1 562 -1 1,709 -1 5.6 14.4<br />
Central African Republic 4.4 14.5 96.0 35 115 757 1.2 12.0<br />
Chad 9.3 19.9 279.1 ** 128 273 3,824 ** 2.8 10.1<br />
Comoros 29.5 -2 … … 319 -2 … … 7.6 -2 …<br />
Congo 11.1 … 134.2 469 … 5,695 6.2 …<br />
Côte d’Ivoire … … … … … … 4.6 -2 24.6 -2<br />
Democratic Republic of the Congo 5.2 16.0 … 18 55 … 2.5 8.9<br />
Equatorial Guinea … … … … … … … …<br />
Eritrea … … … … … … … …<br />
Ethiopia 18.2 9.8 31.0 174 94 297 4.7 25.4<br />
Gabon … … … … … … … …<br />
Gambia 24.6 16.2 ** … 347 229 ** … 5.0 22.8<br />
Ghana 11.4 27.2 171.7 187 447 2,823 5.5 24.4<br />
Guinea 7.0 -2 6.1 -2 100.0 -2 76 -2 67 -2 1,092 -2 2.4 -2 19.2 -2<br />
Guinea-Bissau … … … … … … … …<br />
Kenya … … … … … … 6.7 17.2<br />
Lesotho 24.5 -2 55.1 ** , -2 … 337 -2 758 ** , -2 … 13.0 -2 23.7 -2<br />
Liberia … … … … … … 2.8 -2 12.1 -2<br />
Madagascar 7.8 -1 11.5 ** , -1 144.8 -1 76 -1 112 ** , -1 1,410 -1 3.2 -1 13.4 -2<br />
Malawi 6.8 23.3 1,937.6 57 196 16,334 5.7 +1 14.7 +1<br />
Mali 15.0 -1 37.5 -1 135.3 -1 156 -1 391 -1 1,410 -1 4.5 22.0<br />
Mauritius 9.0 -1 14.3 ** , -1 … 1,128 -1 1,795 ** , -1 … 3.1 -1 11.4 -1<br />
Mozambique … … … … … … … …<br />
Namibia 17.8 … … 1,110 … … 8.1 22.4 -2<br />
Niger 21.1 41.9 438.8 153 305 3,194 3.8 16.9<br />
Nigeria … … … … … … … …<br />
Rwanda 7.3 +1 31.0 +1 … 84 +1 361 +1 … 4.7 +1 16.9 +1<br />
Sao Tome and Principe … … … … … … … …<br />
Senegal 16.4 28.0 186.9 317 541 3,616 5.6 24.0 -1<br />
Seychelles … … … … … … … …<br />
Sierra Leone … … … … … … 4.3 -1 18.1 -1<br />
Somalia … … … … … … … …<br />
South Africa 17.6 19.8 … 1,817 2,046 … 6.0 19.2<br />
Swaziland 15.8 33.1 … 925 1,940 … 7.4 16.0<br />
Togo 10.8 … … 108 … … 4.5 17.6 -1<br />
Uganda 7.2 -1 20.5 -1 104.3 -1 84 -1 240 -1 1,223 -1 3.2 -1 15.0 -1<br />
United Republic of Tanzania 21.5 -2 … … 262 -2 … … 6.2 18.3<br />
Zambia … … … … … … 1.3 -2 …<br />
Zimbabwe … … 75.4 … … … 2.5 8.3<br />
160
OPPORTUNITIES LOST: THE IMPACT OF GRADE REPETITION AND EARLY SCHOOL LEAVING<br />
<strong>Education</strong>al expenditure by nature of spending as a percentage of total educational expenditure in public institutions<br />
Primary, secondary and post-secondary non-tertiary (ISCED 1-4) Tertiary (ISCED 5-6)<br />
Salaries, all staff Other current Total current Capital Salaries, all staff Other current Total current Capital<br />
(9) (10) (11) (12) (13) (14) (15) (16)<br />
70.3 -1 19.3 -1 89.6 -1 10.4 -1 … … 92.3 -1 7.7 -1<br />
85.4 13.3 98.7 1.3 … … … …<br />
71.9 18.0 89.9 10.1 56.6 40.5 97.1 2.9<br />
… … … … 64.3 5.4 69.7 30.3<br />
81.9 -1 6.3 -1 88.2 -1 11.8 -1 72.8 -1 2.0 -1 74.8 -1 25.2 -1<br />
… … 99.2 0.8 93.0 2.9 95.8 4.2<br />
… … 68.6 31.4 … … … …<br />
… … … … … … … …<br />
… … … … … … 65.3 34.7<br />
… … … … … … … …<br />
85.0 2.6 87.5 12.5 94.5 0.2 94.7 5.3<br />
… … … … … … … …<br />
… … … … … … … …<br />
… … … … … … … …<br />
… … … … … … … …<br />
… … … … … … 85.0 15.0<br />
71.2 13.4 84.6 15.4 49.8 17.3 67.1 32.9<br />
44.6 -2 8.2 -2 52.8 -2 47.2 -2 38.7 -2 58.0 -2 96.7 -2 3.3 -2<br />
… … … … … … … …<br />
… … … … … … … …<br />
61.3 ** , -2 37.4 ** , -2 98.7 ** , -2 1.3 ** , -2 … … 96.2 ** , -2 3.8 ** , -2<br />
… … … … … … … …<br />
70.0 -2 22.7 -2 89.9 -2 10.1 -2 … … 88.1 -2 11.9 -2<br />
77.4 +1 22.0 +1 99.3 +1 0.7 +1 … … 99.2 +1 0.8 +1<br />
65.4 -1 9.8 -1 75.2 -1 24.8 -1 55.6 -1 29.9 -1 85.6 -1 14.4 -1<br />
… … … … … … … …<br />
… … … … … … … …<br />
74.3 ** , -2 23.1 ** , -2 97.3 ** , -2 2.7 ** , -2 83.4 14.4 97.8 2.2<br />
80.2 10.2 90.3 9.7 38.3 51.5 89.8 10.2<br />
… … … … … … … …<br />
53.2 +1 32.7 +1 85.9 +1 14.1 +1 73.7 +1 17.2 +1 90.8 +1 9.2 +1<br />
… … … … … … … …<br />
52.2 38.5 90.7 9.3 74.7 * 19.8 94.4 5.6<br />
… … … … … … … …<br />
86.9 ** , -2 13.1 ** , -2 100.0 ** , -2 — ** , -2 … … 74.8 ** , -2 25.2 ** , -2<br />
… … … … … … … …<br />
81.5 -1 14.5 -1 96.0 -1 4.0 -1 … … 99.8 0.2<br />
… … … … … … … …<br />
81.2 7.3 88.5 11.5 60.5 37.1 97.6 2.4<br />
71.5 -1 19.4 -1 90.9 -1 9.1 -1 … … 94.4 -1 5.6 -1<br />
… … … … … … … …<br />
… … … … … … … …<br />
… … … … … … … …<br />
161
TABLE<br />
14<br />
ADULT AND YOUTH LITERACY / 2005-2010<br />
Adults (15 years and older)<br />
Youth (15 to 24 years)<br />
REGION<br />
Country or territory<br />
ARAB STATES<br />
Reference<br />
year<br />
Literacy rate Illiterate population Literacy rate Illiterate population<br />
MF<br />
MF<br />
MF M F GPI (000) % F MF M F GPI (000) % F<br />
(1) (2) (3) (4) (5) (6) (7) (8) (9) (10) (11) (12)<br />
Algeria f 2006 72.6 81.3 63.9 0.79 6,472 65.7 91.8 94.4 89.1 0.94 611 65.0<br />
Bahrain 2010 91.9 92.8 90.2 0.97 82 42.0 100.0 100.0 100.0 1.00 — .<br />
Djibouti … … … … … … … ... ... ... … … ...<br />
Egypt f 2010 72.0 80.3 63.5 0.79 15,631 65.1 87.5 90.6 84.3 0.93 2,004 61.7<br />
Iraq 2010 78.2 86.0 70.6 0.82 3,930 68.4 82.6 84.5 80.5 0.95 1,081 54.4<br />
Jordan f 2010 92.6 95.8 89.2 0.93 287 70.6 98.8 98.8 98.8 1.00 16 48.2<br />
Kuwait f 2008 93.9 95.0 91.8 0.97 118 49.6 98.6 98.6 98.7 1.00 6 40.9<br />
Lebanon f 2007 89.6 93.4 86.0 0.92 319 69.6 98.7 98.4 99.1 1.01 10 35.9<br />
Libya 2010 89.2 95.6 82.7 0.86 477 79.5 99.9 99.9 99.8 1.00 1 71.8<br />
Mauritania 2010 58.0 64.9 51.2 0.79 873 58.3 68.3 71.3 65.3 0.92 219 53.9<br />
Morocco f 2009 56.1 68.9 43.9 0.64 9,967 65.9 79.5 86.7 72.1 0.83 1,296 67.8<br />
Oman f 2008 86.6 90.0 80.9 0.90 257 56.1 97.6 97.6 97.6 1.00 15 43.0<br />
Palestine f 2010 94.9 97.6 92.2 0.94 118 76.4 99.2 99.2 99.3 1.00 7 47.0<br />
Qatar f 2010 96.3 96.5 95.4 0.99 57 25.4 96.8 96.3 98.3 1.02 8 14.0<br />
Saudi Arabia 2010 86.6 90.4 81.3 0.90 2,571 59.2 97.8 98.9 96.8 0.98 108 73.4<br />
Sudan (pre-secession) a,i 2010 71.1 80.1 62.0 0.77 7,551 65.7 86.7 89.6 83.6 0.93 1,143 60.4<br />
Syrian Arab Republic 2010 83.4 89.9 76.9 0.86 2,132 69.5 94.9 96.1 93.6 0.97 211 60.3<br />
Tunisia f 2008 77.6 86.4 71.0 0.82 1,661 68.3 96.8 98.1 95.8 0.98 62 68.7<br />
United Arab Emirates f 2005 90.0 89.5 91.5 1.02 327 23.6 95.0 93.6 97.0 1.04 34 24.1<br />
Yemen 2010 63.9 81.2 46.8 0.58 4,841 74.0 85.2 96.0 74.1 0.77 787 86.2<br />
CENTRAL AND EASTERN EUROPE<br />
Albania f 2008 95.9 97.3 94.7 0.97 98 66.9 98.8 98.5 99.1 1.01 7 36.7<br />
Belarus f 2009 99.6 99.8 99.5 1.00 31 71.8 99.8 99.8 99.8 1.00 3 42.2<br />
Bosnia and Herzegovina 2010 97.9 99.4 96.5 0.97 68 87.1 99.7 99.7 99.7 1.00 2 46.8<br />
Bulgaria f 2011 98.4 98.7 98.0 0.99 106 63.7 97.9 98.1 97.7 1.00 18 53.6<br />
Croatia 2010 98.8 99.5 98.2 0.99 44 79.6 99.6 99.6 99.7 1.00 2 46.0<br />
Czech Republic … … … … … … … ... ... ... … … ...<br />
Estonia 2010 99.8 99.8 99.8 1.00 2 49.1 99.8 99.7 99.8 1.00 0.4 36.8<br />
Hungary 2010 99.0 99.2 98.9 1.00 81 59.8 98.9 98.8 99.0 1.00 14 43.1<br />
Latvia 2010 99.8 99.8 99.8 1.00 4 52.1 99.7 99.7 99.7 1.00 1 41.9<br />
Lithuania 2010 99.7 99.7 99.7 1.00 8 51.3 99.8 99.8 99.8 1.00 1 47.8<br />
Montenegro 2010 98.4 99.4 97.4 0.98 8 81.4 99.3 99.4 99.3 1.00 1 50.3<br />
Poland 2010 99.5 99.7 99.4 1.00 157 67.9 99.8 99.8 99.9 1.00 9 33.2<br />
Republic of Moldova 2010 98.5 99.1 98.1 0.99 44 69.9 99.5 99.3 99.6 1.00 3 34.0<br />
Romania 2010 97.7 98.3 97.1 0.99 424 65.4 97.3 97.2 97.4 1.00 78 46.4<br />
Russian Federation 2010 99.6 99.7 99.5 1.00 515 68.6 99.7 99.6 99.7 1.00 65 38.9<br />
Serbia 2010 97.9 99.2 96.7 0.97 170 81.0 99.3 99.3 99.3 1.00 10 50.3<br />
Slovakia … … … … … … … ... ... ... … … ...<br />
Slovenia 2010 99.7 99.7 99.7 1.00 5 55.7 99.8 99.8 99.9 1.00 0.4 33.8<br />
The former Yugoslav Rep. of Macedonia 2010 97.3 98.7 95.9 0.97 46 76.2 98.7 98.8 98.5 1.00 4 54.9<br />
Turkey f 2009 90.8 96.4 85.3 0.89 4,839 80.5 97.8 99.0 96.6 0.98 282 77.3<br />
Ukraine 2010 99.7 99.8 99.6 1.00 114 67.5 99.8 99.7 99.8 1.00 14 40.4<br />
CENTRAL ASIA<br />
Armenia 2010 99.6 99.7 99.4 1.00 11 70.6 99.8 99.7 99.8 1.00 1 36.0<br />
Azerbaijan f 2009 99.8 99.8 99.7 1.00 17 68.4 100.0 100.0 99.9 1.00 1 54.4<br />
Georgia 2010 99.7 99.8 99.7 1.00 10 64.2 99.8 99.8 99.9 1.00 1 37.3<br />
Kazakhstan 2010 99.7 99.8 99.6 1.00 37 69.5 99.8 99.8 99.9 1.00 6 37.9<br />
Kyrgyzstan f 2009 99.2 99.5 99.0 0.99 28 69.0 99.8 99.7 99.8 1.00 3 40.2<br />
Mongolia 2010 97.4 96.9 97.9 1.01 52 41.9 95.8 94.4 97.4 1.03 25 31.6<br />
Tajikistan 2010 99.7 99.8 99.6 1.00 13 68.8 99.9 99.9 99.9 1.00 2 45.7<br />
Turkmenistan 2010 99.6 99.7 99.5 1.00 15 67.3 99.8 99.8 99.9 1.00 2 33.4<br />
Uzbekistan 2010 99.4 99.6 99.2 1.00 119 69.3 99.9 99.9 100.0 1.00 4 10.7<br />
EAST ASIA AND THE PACIFIC<br />
Australia … … … … … … … ... ... ... … … ...<br />
Brunei Darussalam 2010 95.2 96.8 93.6 0.97 14 66.7 99.7 99.8 99.7 1.00 0.2 54.9<br />
Cambodia f 2009 73.9 82.8 65.9 0.80 2,449 68.3 87.1 88.4 85.9 0.97 410 54.3<br />
China 2010 94.3 97.1 91.3 0.94 61,882 73.8 99.4 99.5 99.3 1.00 1,356 54.1<br />
162
OPPORTUNITIES LOST: THE IMPACT OF GRADE REPETITION AND EARLY SCHOOL LEAVING<br />
Adults (15 years and older)<br />
Youth (15 to 24 years)<br />
REGION<br />
Country or territory<br />
Reference<br />
year<br />
Literacy rate Illiterate population Literacy rate Illiterate population<br />
MF<br />
MF<br />
MF M F GPI (000) % F MF M F GPI (000) % F<br />
(1) (2) (3) (4) (5) (6) (7) (8) (9) (10) (11) (12)<br />
China, Hong Kong SAR … … … … … … … ... ... ... … … ...<br />
China, Macao SAR f 2006 93.5 96.5 90.7 0.94 27 74.3 99.6 99.6 99.7 1.00 0.3 42.9<br />
Cook Islands … … … … … … … ... ... ... … … ...<br />
Democratic People’s Republic of Korea f 2008 100.0 100.0 100.0 1.00 0.3 71.1 100.0 100.0 100.0 1.00 — .<br />
Fiji … … … … … … … ... ... ... … … ...<br />
Indonesia f 2009 92.6 95.6 89.7 0.94 12,709 70.8 99.5 99.6 99.4 1.00 228 56.7<br />
Japan … … … … … … … ... ... ... … … ...<br />
Kiribati … … … … … … … ... ... ... … … ...<br />
Lao People’s Democratic Republic f 2005 72.7 82.5 63.2 0.77 958 68.5 83.9 89.2 78.7 0.88 196 66.0<br />
Malaysia f 2010 93.1 95.4 90.7 0.95 1,363 66.6 98.4 98.4 98.5 1.00 81 47.9<br />
Marshall Islands … … … … … … … ... ... ... … … ...<br />
Micronesia (Federated States of) … … … … … … … ... ... ... … … ...<br />
Myanmar 2010 92.3 94.8 89.9 0.95 2,748 67.2 95.8 96.1 95.5 0.99 374 53.7<br />
Nauru … … … … … … … ... ... ... … … ...<br />
New Zealand … … … … … … … ... ... ... … … ...<br />
Niue … … … … … … … ... ... ... … … ...<br />
Palau … … … … … … … ... ... ... … … ...<br />
Papua New Guinea 2010 60.6 63.9 57.3 0.90 1,646 53.7 68.4 65.1 71.9 1.11 412 43.2<br />
Philippines f 2008 95.4 95.0 95.8 1.01 2,635 45.9 97.8 97.0 98.5 1.02 406 32.7<br />
Republic of Korea … … … … … … … ... ... ... … … ...<br />
Samoa 2010 98.8 99.0 98.6 1.00 1 57.9 99.5 99.4 99.6 1.00 0.2 39.1<br />
Singapore f 2010 95.9 98.0 93.8 0.96 172 75.9 99.8 99.7 99.8 1.00 2 45.4<br />
Solomon Islands … … … … … … … ... ... ... … … ...<br />
Thailand f 2005 93.5 95.6 91.5 0.96 3,361 67.1 98.1 98.2 97.9 1.00 208 53.4<br />
Timor-Leste f 2010 58.3 63.6 53.0 0.83 252 55.6 79.5 80.5 78.6 0.98 47 51.1<br />
Tokelau … … … … … … … ... ... ... … … ...<br />
Tonga f 2006 99.0 99.0 99.1 1.00 1 47.7 99.4 99.3 99.6 1.00 0.1 37.7<br />
Tuvalu … … … … … … … ... ... ... … … ...<br />
Vanuatu 2010 82.6 84.3 80.8 0.96 26 54.3 94.3 94.1 94.4 1.00 3 47.0<br />
Viet Nam 2010 93.2 95.3 91.1 0.96 4,579 66.5 96.9 97.4 96.5 0.99 549 56.2<br />
LATIN AMERICA AND THE CARIBBEAN<br />
Anguilla … … … … … … … ... ... ... … … ...<br />
Antigua and Barbuda h 2010 99.0 98.4 99.4 1.01 1 28.9 ... ... ... … … ...<br />
Argentina 2010 97.8 97.8 97.8 1.00 668 51.1 99.2 99.0 99.4 1.00 55 37.7<br />
Aruba f 2010 96.8 96.9 96.7 1.00 3 55.0 99.1 99.0 99.3 1.00 0.1 40.1<br />
Bahamas … … … … … … … ... ... ... … … ...<br />
Barbados … … … … … … … ... ... ... … … ...<br />
Belize … … … … … … … ... ... ... … … ...<br />
Bermuda … … … … … … … ... ... ... … … ...<br />
Bolivia f 2009 91.2 95.8 86.8 0.91 543 76.4 99.4 99.7 99.1 0.99 12 74.4<br />
Brazil f 2009 90.3 90.2 90.4 1.00 13,899 50.8 98.1 97.4 98.7 1.01 655 33.4<br />
British Virgin Islands … … … … … … … ... ... ... … … ...<br />
Cayman Islands f 2007 98.9 98.7 99.0 1.00 1 44.2 98.9 99.1 98.6 0.99 0.1 61.6<br />
Chile f 2009 98.6 98.6 98.5 1.00 191 53.0 98.9 98.9 98.9 1.00 33 48.5<br />
Colombia f 2010 93.4 93.3 93.5 1.00 2,187 50.7 98.1 97.7 98.5 1.01 161 38.4<br />
Costa Rica 2010 96.2 95.9 96.4 1.00 134 46.6 98.2 97.8 98.7 1.01 16 36.7<br />
Cuba 2010 99.8 99.8 99.8 1.00 16 52.1 100.0 100.0 100.0 1.00 0.2 54.2<br />
Dominica … … … … … … … ... ... ... … … ...<br />
Dominican Republic f 2010 89.5 89.4 89.7 1.00 716 49.4 96.8 95.8 97.9 1.02 59 33.1<br />
Ecuador f 2010 91.9 93.3 90.5 0.97 818 59.1 98.7 98.5 98.9 1.00 36 42.1<br />
El Salvador f 2010 84.5 87.1 82.3 0.94 653 61.8 96.0 95.7 96.4 1.01 53 45.6<br />
Grenada … … … … … … … ... ... ... … … ...<br />
Guatemala f 2010 75.2 80.6 70.3 0.87 2,089 63.1 87.0 89.0 84.9 0.95 380 58.4<br />
Guyana … … … … … … … ... ... ... … … ...<br />
Haiti j 2006 48.7 53.4 44.6 0.84 3,028 55.4 72.3 74.4 70.5 0.95 570 53.5<br />
Honduras f 2010 84.8 84.8 84.7 1.00 733 50.7 95.2 94.4 95.9 1.02 78 42.2<br />
Jamaica 2010 86.6 81.6 91.4 1.12 260 32.9 95.4 92.5 98.4 1.06 23 17.5<br />
Mexico f 2010 93.1 94.4 91.9 0.97 5,561 60.5 98.4 98.4 98.5 1.00 325 48.6<br />
163
TABLE<br />
14<br />
ADULT AND YOUTH LITERACY / 2005-2010<br />
Adults (15 years and older)<br />
Youth (15 to 24 years)<br />
REGION<br />
Country or territory<br />
Reference<br />
year<br />
Literacy rate Illiterate population Literacy rate Illiterate population<br />
MF<br />
MF<br />
MF M F GPI (000) % F MF M F GPI (000) % F<br />
(1) (2) (3) (4) (5) (6) (7) (8) (9) (10) (11) (12)<br />
Montserrat … … … … … … … ... ... ... … … ...<br />
Netherlands Antilles a 2010 96.5 96.5 96.4 1.00 6 54.8 98.4 98.4 98.4 1.00 0.4 50.3<br />
Nicaragua f 2005 78.0 78.1 77.9 1.00 743 51.3 87.0 85.2 88.8 1.04 153 42.9<br />
Panama f 2010 94.1 94.7 93.5 0.99 147 55.1 97.6 97.9 97.3 0.99 14 55.4<br />
Paraguay f 2010 93.9 94.8 92.9 0.98 263 57.5 98.6 98.5 98.7 1.00 18 45.2<br />
Peru f 2007 89.6 94.9 84.6 0.89 1,991 75.1 97.4 98.0 96.7 0.99 143 61.8<br />
Puerto Rico 2010 90.4 89.8 91.0 1.01 284 49.9 86.9 86.4 87.3 1.01 76 47.8<br />
Saint Kitts and Nevis … … … … … … … ... ... ... … … ...<br />
Saint Lucia … … … … … … … ... ... ... … … ...<br />
Saint Vincent and the Grenadines … … … … … … … ... ... ... … … ...<br />
Suriname f 2010 94.7 95.4 94.0 0.99 20 56.6 98.4 98.0 98.8 1.01 1 36.6<br />
Trinidad and Tobago 2010 98.8 99.2 98.4 0.99 13 68.2 99.6 99.5 99.6 1.00 1 48.6<br />
Turks and Caicos Islands … … … … … … … ... ... ... … … ...<br />
Uruguay f 2010 98.1 97.6 98.5 1.01 50 41.1 98.8 98.4 99.2 1.01 6 31.3<br />
Venezuela f 2009 95.5 95.7 95.4 1.00 898 52.0 98.5 98.3 98.8 1.01 79 40.1<br />
NORTH AMERICA AND WESTERN EUROPE<br />
Andorra … … … … … … … ... ... ... … … ...<br />
Austria … … … … … … … ... ... ... … … ...<br />
Belgium … … … … … … … ... ... ... … … ...<br />
Canada … … … … … … … ... ... ... … … ...<br />
Cyprus 2010 98.3 99.2 97.3 0.98 16 76.4 99.9 99.9 99.9 1.00 0.2 34.5<br />
Denmark … … … … … … … ... ... ... … … ...<br />
Finland … … … … … … … ... ... ... … … ...<br />
France … … … … … … … ... ... ... … … ...<br />
Germany … … … … … … … ... ... ... … … ...<br />
Gibraltar … … … … … … … ... ... ... … … ...<br />
Greece 2010 97.2 98.3 96.1 0.98 273 70.5 99.4 99.4 99.3 1.00 8 53.1<br />
Holy See … … … … … … … ... ... ... … … ...<br />
Iceland … … … … … … … ... ... ... … … ...<br />
Ireland … … … … … … … ... ... ... … … ...<br />
Israel … … … … … … … ... ... ... … … ...<br />
Italy 2010 98.9 99.2 98.7 0.99 555 63.7 99.9 99.9 99.9 1.00 6 46.6<br />
Liechtenstein … … … … … … … ... ... ... … … ...<br />
Luxembourg … … … … … … … ... ... ... … … ...<br />
Malta f 2005 92.4 91.2 93.5 1.03 26 43.2 98.3 97.5 99.1 1.02 1 25.0<br />
Monaco … … … … … … … ... ... ... … … ...<br />
Netherlands … … … … … … … ... ... ... … … ...<br />
Norway … … … … … … … ... ... ... … … ...<br />
Portugal 2010 95.2 96.9 93.6 0.97 437 68.9 99.7 99.7 99.8 1.00 3 42.9<br />
San Marino … … … … … … … ... ... ... … … ...<br />
Spain f,g 2010 97.7 98.5 97.0 0.98 882 67.9 99.6 99.5 99.7 1.00 19 37.7<br />
Sweden … … … … … … … ... ... ... … … ...<br />
Switzerland … … … … … … … ... ... ... … … ...<br />
United Kingdom … … … … … … … ... ... ... … … ...<br />
United States … … … … … … … ... ... ... … … ...<br />
SOUTH AND WEST ASIA<br />
Afghanistan … … … … … … … ... ... ... … … ...<br />
Bangladesh 2010 56.8 61.3 52.2 0.85 44,149 54.8 77.0 75.5 78.5 1.04 6,951 45.8<br />
Bhutan f 2005 52.8 65.0 38.7 0.59 206 60.3 74.4 80.0 68.0 0.85 38 58.5<br />
India f 2006 62.8 75.2 50.8 0.68 287,355 65.1 81.1 88.4 74.4 0.84 41,275 67.1<br />
Iran, Islamic Republic of f 2008 85.0 89.3 80.7 0.90 8,256 63.7 98.7 98.8 98.5 1.00 235 54.3<br />
Maldives f 2006 98.4 98.4 98.4 1.00 3 48.9 99.3 99.2 99.4 1.00 1 45.5<br />
Nepal 2010 60.3 73.0 48.3 0.66 7,587 66.9 83.1 87.6 78.4 0.89 1,048 62.4<br />
Pakistan f 2009 54.9 68.6 40.3 0.59 49,507 64.9 70.7 79.1 61.5 0.78 10,820 64.1<br />
Sri Lanka f 2010 91.2 92.6 90.0 0.97 1,373 58.6 98.2 97.7 98.6 1.01 61 37.2<br />
SUB-SAHARAN AFRICA<br />
Angola 2010 70.1 82.7 58.1 0.70 3,044 71.7 73.1 80.5 65.8 0.82 1,016 64.0<br />
Benin 2010 42.4 55.2 30.3 0.55 2,872 62.2 55.0 65.6 44.6 0.68 785 62.1<br />
164
OPPORTUNITIES LOST: THE IMPACT OF GRADE REPETITION AND EARLY SCHOOL LEAVING<br />
Adults (15 years and older)<br />
Youth (15 to 24 years)<br />
REGION<br />
Country or territory<br />
Reference<br />
year<br />
Literacy rate Illiterate population Literacy rate Illiterate population<br />
MF<br />
MF<br />
MF M F GPI (000) % F MF M F GPI (000) % F<br />
(1) (2) (3) (4) (5) (6) (7) (8) (9) (10) (11) (12)<br />
Botswana 2010 84.5 84.0 84.9 1.01 210 48.2 95.3 93.6 96.9 1.04 21 32.0<br />
Burkina Faso f 2007 28.7 36.7 21.6 0.59 5,806 56.9 39.3 46.7 33.1 0.71 1,838 55.0<br />
Burundi 2010 67.2 72.9 61.8 0.85 1,710 60.0 77.6 77.6 77.6 1.00 427 50.2<br />
Cameroon f 2007 70.7 78.9 63.0 0.80 3,134 64.1 83.1 89.4 77.5 0.87 632 67.8<br />
Cape Verde 2010 84.3 89.3 79.4 0.89 53 66.5 98.3 97.5 99.1 1.02 2 24.7<br />
Central African Republic 2010 56.0 69.3 43.2 0.62 1,155 65.9 65.2 72.3 58.2 0.80 317 60.6<br />
Chad 2010 34.5 45.0 24.2 0.54 4,014 58.6 47.0 53.5 40.6 0.76 1,174 56.0<br />
Comoros 2010 74.9 80.2 69.7 0.87 106 60.5 85.6 85.9 85.3 0.99 19 50.6<br />
Congo f 2005 … … … … … … 80.5 86.8 78.0 0.90 123 62.2<br />
Côte d’Ivoire 2010 56.2 65.2 46.6 0.72 5,110 59.1 67.0 72.2 61.9 0.86 1,320 57.8<br />
Democratic Republic of the Congo 2010 66.8 76.9 57.0 0.74 11,765 65.7 65.0 68.3 61.8 0.90 4,665 54.5<br />
Equatorial Guinea 2010 93.9 97.1 90.6 0.93 26 75.0 98.0 97.7 98.3 1.01 3 42.3<br />
Eritrea 2010 67.8 78.7 57.5 0.73 989 68.0 89.3 92.0 86.7 0.94 113 62.7<br />
Ethiopia f 2007 39.0 49.1 28.9 0.59 26,847 58.9 55.0 63.0 47.0 0.75 7,090 58.9<br />
Gabon 2010 88.4 91.9 84.9 0.92 113 65.1 97.7 98.7 96.8 0.98 7 70.3<br />
Gambia 2010 50.0 60.0 40.4 0.67 485 61.2 66.7 71.9 61.7 0.86 118 58.4<br />
Ghana 2010 67.3 73.2 61.2 0.84 4,903 58.5 80.8 81.7 79.9 0.98 934 51.2<br />
Guinea 2010 41.0 52.0 30.0 0.58 3,360 59.1 63.4 69.6 57.0 0.82 725 57.9<br />
Guinea-Bissau 2010 54.2 68.2 40.6 0.60 407 65.9 72.1 78.9 65.3 0.83 84 62.2<br />
Kenya 2010 87.4 90.6 84.2 0.93 2,942 63.1 92.8 91.7 93.9 1.02 608 42.3<br />
Lesotho 2010 89.6 83.3 95.6 1.15 141 21.9 91.9 85.8 98.1 1.14 41 11.6<br />
Liberia 2010 60.8 64.8 56.8 0.88 885 55.3 76.5 71.0 82.1 1.16 183 37.8<br />
Madagascar j 2009 64.5 67.4 61.6 0.91 4,039 54.5 64.9 65.9 64.0 0.97 1,384 51.5<br />
Malawi 2010 74.8 81.1 68.5 0.84 2,037 62.9 87.1 87.2 87.0 1.00 392 50.2<br />
Mali f 2010 31.1 43.4 20.3 0.47 5,554 59.4 44.3 56.4 33.9 0.60 1,657 59.4<br />
Mauritius 2010 88.5 90.9 86.2 0.95 117 61.3 96.7 95.7 97.7 1.02 7 34.2<br />
Mozambique 2010 56.1 70.8 42.8 0.61 5,740 68.4 71.8 78.5 65.1 0.83 1,299 62.0<br />
Namibia 2010 88.8 89.0 88.5 0.99 163 52.0 93.1 91.1 95.1 1.04 33 35.6<br />
Niger f 2005 28.7 42.9 15.1 0.35 4,731 60.6 36.5 52.4 23.2 0.44 1,440 64.4<br />
Nigeria 2010 61.3 72.1 50.4 0.70 35,025 63.8 72.1 78.0 66.1 0.85 8,617 59.7<br />
Rwanda 2010 71.1 74.8 67.5 0.90 1,764 57.8 77.5 77.1 77.8 1.01 498 49.7<br />
Sao Tome and Principe 2010 89.2 93.9 84.7 0.90 11 72.2 95.3 94.7 95.9 1.01 2 42.9<br />
Senegal f 2009 49.7 61.8 38.7 0.63 3,400 62.7 65.0 74.2 56.2 0.76 874 62.7<br />
Seychelles h 2010 91.8 91.4 92.3 1.01 5 46.1 99.1 98.8 99.4 1.01 0.1 29.8<br />
Sierra Leone 2010 42.1 53.6 31.4 0.59 1,936 61.2 59.4 69.1 50.1 0.73 461 62.9<br />
Somalia … … … … … … … ... ... ... … … ...<br />
South Africa f 2007 88.7 90.7 87.0 0.96 3,754 59.2 97.6 97.0 98.1 1.01 243 39.0<br />
Swaziland 2010 87.4 88.1 86.8 0.99 92 54.1 93.6 92.1 95.1 1.03 19 37.7<br />
Togo f 2009 57.1 71.2 43.6 0.61 1,515 66.9 81.7 87.6 74.6 0.85 232 67.5<br />
Uganda f 2010 73.2 82.6 64.6 0.78 4,560 67.4 87.4 89.6 85.5 0.95 837 58.7<br />
United Republic of Tanzania 2010 73.2 79.0 67.5 0.85 6,642 61.1 77.3 78.2 76.5 0.98 2,013 51.8<br />
Zambia 2010 71.2 80.7 61.7 0.77 2,021 66.5 74.4 81.7 67.1 0.82 668 64.2<br />
Zimbabwe 2010 92.2 94.7 89.9 0.95 597 66.7 99.0 98.5 99.6 1.01 31 22.9<br />
REGIONAL AVERAGES<br />
WORLD 84.1 88.6 79.7 0.90 775,408 64.1 89.6 92.2 87.1 0.95 122,236 60.7<br />
Arab States 74.7 83.3 65.7 0.79 50,286 65.2 89.1 92.4 85.6 0.93 6,499 63.4<br />
Central and Eastern Europe 97.9 99.0 97.0 0.98 6,794 79.9 99.1 99.3 98.9 1.00 520 66.0<br />
Central Asia 99.5 99.6 99.4 1.00 302 66.7 99.7 99.6 99.8 1.00 45 39.0<br />
East Asia and the Pacific 94.2 96.7 91.6 0.95 99,524 70.7 98.8 98.9 98.7 1.00 4,406 52.5<br />
Latin America and the Caribbean 91.4 92.1 90.7 0.98 36,089 55.8 97.2 97.0 97.4 1.00 2,977 45.0<br />
North America and Western Europe … … … … … … ... ... ... … … ...<br />
South and West Asia 62.7 74.0 51.8 0.70 406,419 63.5 80.5 86.6 74.7 0.86 62,275 63.5<br />
Sub-Saharan Africa 62.6 71.0 54.2 0.76 169,313 62.5 71.8 76.4 66.8 0.87 45,251 58.5<br />
165
TABLE<br />
15<br />
EDUCATIONAL ATTAINMENT OF THE POPULATION AGED 25 YEARS AND OLDER /<br />
ISCED 0-6 / Latest year available<br />
REGION<br />
Country or territory<br />
ARAB STATES<br />
Reference<br />
year<br />
Population<br />
(25 years and older) (000)<br />
No schooling (%) Incomplete primary (%) Primary (ISCED 1) (%)<br />
MF M F MF M F MF M F MF M F<br />
(1) (2) (3) (4) (5) (6) (7) (8) (9) (10) (11) (12)<br />
Algeria 2006 16,189 8,066 8,124 35.5 25.7 45.5 17.8 19.5 16.0 22.4 27.2 17.5<br />
Bahrain 2001 354 217 137 12.9 6.4 24.5 6.8 5.5 9.2 12.0 13.5 9.3<br />
Djibouti … … … … … … … … … … … … …<br />
Egypt … … … … … … … … … … … … …<br />
Iraq … … … … … … … … … … … … …<br />
Jordan 2010 2,534 1,305 1,230 10.1 5.1 15.4 4.7 4.6 4.9 11.0 11.8 10.2<br />
Kuwait 2008 1,478 954 524 7.1 5.6 10.3 37.3 40.8 30.0 6.6 7.0 6.0<br />
Lebanon 2007 2,286 1,081 1,205 21.5 17.4 25.2 — — — 24.1 26.9 21.5<br />
Libya … … … … … … … … … … … … …<br />
Mauritania … … … … … … … … … … … … …<br />
Morocco … … … … … … … … … … … … …<br />
Oman 2008 1,259 773 485 17.8 12.4 28.9 15.7 16.2 14.8 12.4 14.0 9.0<br />
Palestine 2011 1,518 762 756 7.1 3.0 11.2 2.1 1.7 2.4 36.6 37.9 35.3<br />
Qatar 2011 1,358 1,097 261 3.9 3.6 5.3 25.1 25.9 21.6 18.4 20.4 10.5<br />
Saudi Arabia 2004 10,900 6,662 4,239 22.2 15.6 32.5 13.6 14.5 12.2 15.4 17.4 12.3<br />
Sudan (pre-secession) a … … … … … … … … … … … … …<br />
Syrian Arab Republic 2009 8,428 4,173 4,255 20.9 11.6 30.8 11.6 12.2 10.9 33.4 37.3 29.4<br />
Tunisia 2010 6,028 2,972 3,056 26.8 16.3 36.8 x(10) x(11) x(12) 33.8 37.4 30.3<br />
United Arab Emirates 2005 2,594 1,966 628 11.2 11.3 10.9 14.3 15.5 10.8 11.8 13.1 7.5<br />
Yemen … … … … … … … … … … … … …<br />
CENTRAL AND EASTERN EUROPE<br />
Albania 2011 1,914 935 979 3.8 2.4 5.2 0.3 0.3 0.3 10.6 8.8 12.2<br />
Belarus 2009 6,739 2,998 3,740 0.9 0.4 1.3 x(4) x(5) x(6) 6.9 4.4 8.9<br />
Bosnia and Herzegovina 2010 2,677 1,251 1,426 9.9 3.7 15.5 17.0 12.5 21.2 16.2 13.7 18.4<br />
Bulgaria 2010 5,564 2,631 2,933 x(10) x(11) x(12) x(10) x(11) x(12) 6.8 5.1 8.3<br />
Croatia 2001 3,115 1,460 1,655 3.3 1.3 5.0 5.1 3.2 6.8 13.1 9.7 16.1<br />
Czech Republic 2011 7,737 3,733 4,004 0.1 0.2 0.1 x(4) x(5) x(6) — — 0.1<br />
Estonia k 2011 957 421 536 x(13) x(14) x(15) x(13) x(14) x(15) x(13) x(14) x(15)<br />
Hungary k 2011 7,280 3,357 3,923 — — — — — — 1.8 1.3 2.2<br />
Latvia 2011 1,626 717 908 x(25) x(26) x(27) x(25) x(26) x(27) 0.9 1.0 0.8<br />
Lithuania 2011 2,328 1,036 1,292 — — — 1.4 0.9 1.9 6.9 4.6 8.8<br />
Montenegro 2006 400 191 208 x(10) x(11) x(12) x(10) x(11) x(12) 1.8 1.2 2.5<br />
Poland 2011 27,364 12,876 14,488 0.3 0.2 0.4 1.1 0.6 1.6 16.9 14.2 19.2<br />
Republic of Moldova 2010 2,334 1,071 1,263 1.1 0.7 1.5 x(4) x(5) x(6) 5.1 3.6 6.4<br />
Romania 2010 15,333 7,275 8,058 1.8 1.2 2.4 . . . 10.9 7.9 13.6<br />
Russian Federation 2010 100,895 44,651 56,244 x(7) x(8) x(9) 0.6 0.4 0.8 5.5 4.0 6.8<br />
Serbia 2011 6,800 3,300 3,500 3.3 1.0 5.3 x(10) x(11) x(12) 10.3 6.9 13.3<br />
Slovakia 2001 3,433 1,619 1,814 0.4 0.3 0.4 — — — — — —<br />
Slovenia 2011 1,524 733 790 — — — 0.6 0.4 0.7 3.4 2.2 4.6<br />
The former Yugoslav Rep. of Macedonia 2002 1,262 621 641 4.9 2.4 7.5 16.5 12.3 20.5 30.8 29.7 31.8<br />
Turkey 2009 39,715 19,486 20,229 10.7 4.2 17.1 5.7 4.5 6.9 43.7 43.1 44.3<br />
Ukraine 2001 32,872 14,468 18,404 x(7) x(8) x(9) 2.8 1.3 4.0 8.6 6.4 10.4<br />
CENTRAL ASIA<br />
Armenia 2001 1,750 775 975 0.7 0.4 1.0 1.4 1.0 1.7 6.8 6.3 7.3<br />
Azerbaijan 2009 5,183 2,447 2,736 1.6 0.9 2.3 — — — 2.9 1.7 4.0<br />
Georgia 2002 2,945 1,335 1,610 0.4 0.2 0.5 1.3 0.9 1.7 7.2 6.1 8.0<br />
Kazakhstan 2007 8,729 3,966 4,764 — — — . . . 0.6 0.5 0.7<br />
Kyrgyzstan 2009 2,484 1,190 1,294 1.0 0.6 1.4 1.1 0.7 1.4 2.3 1.8 2.7<br />
Mongolia 2000 1,054 512 542 5.5 4.2 6.8 — — — 14.3 13.0 15.4<br />
Tajikistan 2000 2,334 1,150 1,184 0.8 0.4 1.1 2.1 1.3 2.9 4.7 3.4 6.1<br />
Turkmenistan … … … … … … … … … … … … …<br />
Uzbekistan … … … … … … … … … … … … …<br />
EAST ASIA AND THE PACIFIC<br />
Australia 2011 15,151 7,439 7,712 — — — — — — 6.4 6.5 6.3<br />
Brunei Darussalam … … … … … … … … … … … … …<br />
Cambodia 2009 6,229 2,895 3,334 28.3 17.5 37.3 36.0 34.4 37.3 20.1 25.7 15.4<br />
China 2010 855,066 434,413 420,652 6.6 3.5 9.8 x(4) x(5) x(6) 28.1 24.7 31.6<br />
166
OPPORTUNITIES LOST: THE IMPACT OF GRADE REPETITION AND EARLY SCHOOL LEAVING<br />
Lower secondary (ISCED 2)<br />
(%)<br />
Upper secondary (ISCED 3)<br />
(%)<br />
Post-secondary non-tertiary<br />
(ISCED 4) (%)<br />
Tertiary (ISCED 5-6) (%) Unknown (%)<br />
MF M F MF M F MF M F MF M F MF M F<br />
(13) (14) (15) (16) (17) (18) (19) (20) (21) (22) (23) (24) (25) (26) (27)<br />
ARAB STATES<br />
16.5 18.7 14.2 7.6 8.6 6.6 x(16) x(17) x(18) x(16) x(17) x(18) 0.2 0.4 0.1<br />
18.7 23.0 11.0 38.4 40.9 34.0 x(16) x(17) x(18) 11.2 10.8 11.9 — — —<br />
… … … … … … … … … … … … … … …<br />
… … … … … … … … … … … … … … …<br />
… … … … … … … … … … … … … … …<br />
32.8 35.9 29.4 14.2 14.1 14.4 10.9 9.2 12.8 16.2 19.2 12.9 — — —<br />
22.4 22.7 21.5 13.4 13.0 14.0 4.9 4.1 6.5 8.3 6.7 11.6 — — —<br />
21.3 22.1 20.6 17.5 16.8 18.2 . . . 15.3 16.5 14.2 0.3 0.3 0.2<br />
… … … … … … … … … … … … … … …<br />
… … … … … … … … … … … … … … …<br />
… … … … … … … … … … … … … … …<br />
12.5 14.7 8.0 21.5 21.3 21.9 5.9 5.8 6.0 14.0 15.3 11.3 0.2 0.2 0.1<br />
17.9 18.0 17.8 12.8 12.9 12.7 . . . 23.6 26.6 20.5 — — —<br />
11.5 12.1 8.9 19.0 19.1 18.6 3.3 3.1 4.3 18.8 15.9 30.8 — — —<br />
14.6 17.1 10.7 14.7 15.9 12.8 4.6 4.6 4.6 14.9 15.0 14.8 — — —<br />
… … … … … … … … … … … … … … …<br />
12.2 14.1 10.1 9.5 10.3 8.6 6.2 6.6 5.8 6.2 7.9 4.5 — — —<br />
x(16) x(17) x(18) 26.8 31.8 22.0 . . . 12.5 14.2 10.8 0.2 0.2 0.2<br />
15.6 17.1 11.0 24.5 23.2 28.7 4.6 4.2 6.1 18.0 15.7 25.1 — — —<br />
… … … … … … … … … … … … … … …<br />
CENTRAL AND EASTERN EUROPE<br />
41.5 39.7 43.2 31.3 35.7 27.1 10.5 11.0 10.0 1.5 1.4 1.5 0.5 0.6 0.5<br />
6.8 6.9 6.8 20.9 23.9 18.5 11.4 14.6 8.8 50.2 46.8 52.9 2.8 2.9 2.7<br />
25.8 35.4 16.9 21.9 24.0 19.9 3.5 4.2 2.9 5.7 6.4 5.1 — — —<br />
23.6 23.4 23.8 48.9 54.0 44.3 x(16) x(17) x(18) 20.7 17.5 23.6 — — —<br />
18.7 15.6 21.3 45.4 54.5 37.4 . . . 13.9 15.2 12.8 0.5 0.5 0.5<br />
11.4 5.8 16.6 70.2 74.9 65.9 1.7 1.2 2.1 16.5 17.9 15.2 — — —<br />
13.4 15.7 11.5 51.0 56.6 46.3 x(16) x(17) x(18) 35.5 27.7 42.2 — — —<br />
21.5 17.9 24.9 55.0 60.5 50.0 1.6 1.8 1.5 20.0 18.5 21.4 — — —<br />
14.0 16.7 11.7 50.6 55.5 46.5 8.3 6.4 9.9 25.9 20.1 30.7 0.3 0.3 0.3<br />
10.0 9.6 10.2 32.0 40.2 25.4 20.4 19.2 21.3 29.3 25.4 32.4 — — —<br />
20.7 17.5 23.6 58.2 64.6 52.6 3.1 1.6 4.5 16.1 15.1 16.9 — — —<br />
0.1 0.1 0.1 57.1 64.2 50.9 3.3 1.8 4.5 21.1 18.8 23.2 . . .<br />
19.4 18.1 20.4 42.7 50.3 36.3 14.7 11.7 17.3 17.0 15.6 18.1 — — —<br />
23.2 20.2 26.1 48.1 54.0 42.8 4.1 4.4 3.8 11.9 12.4 11.3 — — —<br />
8.9 9.3 8.5 16.5 18.5 14.9 40.4 40.8 40.1 25.1 23.9 26.0 3.0 3.0 2.9<br />
22.0 19.1 24.7 48.1 55.4 41.6 . . . 16.3 17.5 15.2 . . .<br />
57.1 58.3 56.0 28.8 25.6 31.7 0.7 0.8 0.6 11.7 13.5 10.0 1.4 1.4 1.3<br />
17.6 13.3 21.6 56.2 64.4 48.5 . . . 22.2 19.7 24.6 — — —<br />
x(16) x(17) x(18) 35.6 41.8 29.4 — — — 12.2 13.8 10.7 — — —<br />
8.3 10.5 6.1 16.1 19.6 12.6 . . . 10.1 12.3 8.0 5.4 5.8 5.1<br />
14.2 13.9 14.4 36.0 42.2 31.1 x(16) x(17) x(18) 38.0 35.8 39.7 0.4 0.4 0.4<br />
CENTRAL ASIA<br />
9.5 10.2 8.9 39.5 40.6 38.5 21.8 20.2 23.1 20.4 21.4 19.5 — — —<br />
6.9 5.2 8.4 58.8 57.6 59.8 4.8 7.2 2.6 25.1 27.4 22.9 — — —<br />
7.4 7.4 7.5 35.3 37.1 33.8 22.5 21.5 23.3 25.8 26.7 25.1 0.1 0.1 0.1<br />
3.0 3.2 2.8 39.7 43.7 35.6 31.1 29.3 32.9 25.5 23.1 27.9 . . .<br />
7.4 7.4 7.4 60.9 65.7 56.6 9.4 6.8 11.7 17.9 16.9 18.8 — — —<br />
26.8 32.0 22.0 22.8 22.1 23.4 18.3 15.9 20.6 12.2 12.8 11.7 — — —<br />
13.5 10.5 16.3 59.1 57.8 60.4 9.2 11.5 7.0 10.6 15.2 6.2 — — —<br />
… … … … … … … … … … … … … … …<br />
… … … … … … … … … … … … … … …<br />
EAST ASIA AND THE PACIFIC<br />
19.5 18.0 21.1 31.4 36.7 26.1 4.3 4.2 4.5 38.4 34.6 42.1 — — —<br />
… … … … … … … … … … … … … … …<br />
9.2 12.4 6.5 4.2 6.4 2.4 2.0 3.3 1.0 x(19) x(20) x(21) 0.1 0.2 0.1<br />
43.0 46.5 39.5 13.5 15.4 11.6 5.2 5.9 4.6 3.6 4.1 3.0 — — —<br />
167
TABLE<br />
15<br />
EDUCATIONAL ATTAINMENT OF THE POPULATION AGED 25 YEARS AND OLDER /<br />
ISCED 0-6 / Latest year available<br />
REGION<br />
Country or territory<br />
Reference<br />
year<br />
Population<br />
(25 years and older) (000)<br />
No schooling (%) Incomplete primary (%) Primary (ISCED 1) (%)<br />
MF M F MF M F MF M F MF M F<br />
(1) (2) (3) (4) (5) (6) (7) (8) (9) (10) (11) (12)<br />
China, Hong Kong SAR 2010 5,330 2,448 2,882 6.3 3.4 8.7 — — — 19.8 18.9 20.5<br />
China, Macao SAR 2006 333 157 176 6.2 3.1 9.0 10.7 10.1 11.3 22.5 22.9 22.2<br />
Cook Islands … … … … … … … … … … … … …<br />
Democratic People’s Republic of Korea … … … … … … … … … … … … …<br />
Fiji 2007 428 216 212 — — — 16.5 16.7 16.3 21.6 22.5 20.6<br />
Indonesia 2009 129,128 63,427 65,702 9.5 5.4 13.3 17.7 16.6 18.7 30.6 30.6 30.6<br />
Japan 2010 97,043 46,539 50,503 0.1 0.1 0.1 x(25) x(26) x(27) x(13) x(14) x(15)<br />
Kiribati … … … … … … … … … … … … …<br />
Lao People’s Democratic Republic … … … … … … … … … … … … …<br />
Malaysia 2010 14,682 7,378 7,304 8.8 5.6 12.0 — — — 23.0 23.0 23.0<br />
Marshall Islands … … … … … … … … … … … … …<br />
Micronesia (Federated States of) … … … … … … … … … … … … …<br />
Myanmar … … … … … … … … … … … … …<br />
Nauru … … … … … … … … … … … … …<br />
New Zealand 2011 2,872 1,378 1,494 x(13) x(14) x(15) x(13) x(14) x(15) x(13) x(14) x(15)<br />
Niue … … … … … … … … … … … … …<br />
Palau … … … … … … … … … … … … …<br />
Papua New Guinea … … … … … … … … … … … … …<br />
Philippines 2008 39,559 19,409 20,150 3.4 3.2 3.5 x(10) x(11) x(12) 31.7 33.0 30.5<br />
Republic of Korea 2010 33,749 16,458 17,291 4.7 1.9 7.4 1.0 0.6 1.4 11.4 8.5 14.2<br />
Samoa 2001 73 38 36 1.0 1.3 0.6 2.6 2.5 2.8 32.8 34.7 30.7<br />
Singapore 2011 3,609 1,798 1,810 x(7) x(8) x(9) 16.3 12.6 19.7 7.0 6.8 7.1<br />
Solomon Islands … … …. … … … … … … … … … …<br />
Thailand 2006 41,799 20,072 21,727 6.1 3.9 8.1 42.3 40.0 44.3 18.9 19.8 18.0<br />
Timor-Leste … … … … … … … … … … … … …<br />
Tokelau … … … … … … … … … … … … …<br />
Tonga 2006 44 21 23 1.4 1.3 1.4 x(10) x(11) x(12) 28.9 27.6 30.2<br />
Tuvalu … … … … … … … … … … … … …<br />
Vanuatu … … … … … … … … … … … … …<br />
Viet Nam … … … … … … … … … … … … …<br />
LATIN AMERICA AND THE CARIBBEAN<br />
Anguilla 2001 6 3 3 2.0 1.9 2.2 2.3 2.8 1.7 37.4 40.5 34.5<br />
Antigua and Barbuda … … … … … … … … … … … … …<br />
Argentina 2003 21,171 10,059 11,111 1.1 0.8 1.3 8.9 8.6 9.3 33.5 33.9 33.1<br />
Aruba … … … … … … … … … … … … …<br />
Bahamas 2000 159 75 84 1.4 1.7 1.1 0.1 0.1 0.1 8.3 9.9 7.1<br />
Barbados 2000 170 82 88 — — — 13.6 13.6 13.6 8.3 8.9 7.7<br />
Belize … … … … … … … … … … … … …<br />
Bermuda 2010 45 21 23 x(10) x(11) x(12) x(10) x(11) x(12) 21.7 25.1 18.6<br />
Bolivia 2009 4,253 2,063 2,190 13.5 7.1 19.4 34.7 34.9 34.5 4.7 5.2 4.3<br />
Brazil 2010 111,795 53,686 58,110 x(10) x(11) x(12) x(10) x(11) x(12) 49.3 50.8 47.8<br />
British Virgin Islands … … … … … … … … … … … … …<br />
Cayman Islands 2008 39 19 20 0.6 0.4 0.7 0.6 0.5 0.6 7.4 7.1 7.6<br />
Chile 2010 10,378 5,037 5,341 2.9 2.7 3.2 12.3 11.7 12.9 9.6 8.9 10.3<br />
Colombia 2011 25,086 11,970 13,116 7.9 8.0 7.8 x(10) x(11) x(12) 35.7 36.3 35.2<br />
Costa Rica 2011 2,694 1,355 1,339 5.5 5.7 5.2 17.5 17.0 17.9 34.5 35.1 34.1<br />
Cuba 2002 7,336 3,650 3,686 0.2 0.2 0.2 13.8 12.4 15.2 17.2 15.6 18.7<br />
Dominica 2001 38 19 20 3.6 3.8 3.3 6.9 7.7 6.1 62.5 65.1 60.0<br />
Dominican Republic 2011 5,090 2,526 2,564 10.8 10.8 10.8 25.1 25.8 24.4 10.2 10.5 10.0<br />
Ecuador 2010 7,369 3,634 3,735 10.6 8.8 12.3 17.5 17.5 17.5 32.1 34.3 30.1<br />
El Salvador 2010 2,874 1,262 1,612 4.2 3.8 4.6 38.8 35.9 41.2 15.2 15.5 15.0<br />
Grenada … …. …. … … … … … … … … … …<br />
Guatemala 2006 4,825 2,240 2,585 38.9 30.8 45.5 31.3 35.0 28.4 15.0 16.8 13.5<br />
Guyana 2002 343 171 172 7.5 6.7 8.2 25.0 26.2 24.0 36.3 38.1 34.6<br />
Haiti … … … … … … … … … … … … …<br />
Honduras 2011 3,299 1,612 1,687 18.7 18.5 18.8 28.3 29.3 27.5 25.1 24.9 25.3<br />
Jamaica … … … … … … … … … … … … …<br />
Mexico 2010 59,643 28,829 30,813 9.3 8.0 10.5 15.8 15.5 16.1 18.3 17.6 19.0<br />
168
OPPORTUNITIES LOST: THE IMPACT OF GRADE REPETITION AND EARLY SCHOOL LEAVING<br />
Lower secondary (ISCED 2)<br />
(%)<br />
Upper secondary (ISCED 3)<br />
(%)<br />
Post-secondary non-tertiary<br />
(ISCED 4) (%)<br />
Tertiary (ISCED 5-6) (%) Unknown (%)<br />
MF M F MF M F MF M F MF M F MF M F<br />
(13) (14) (15) (16) (17) (18) (19) (20) (21) (22) (23) (24) (25) (26) (27)<br />
16.9 18.7 15.4 34.1 33.1 34.8 5.8 6.3 5.3 17.2 19.6 15.2 — — —<br />
24.9 25.8 24.0 21.4 22.9 19.9 1.7 1.5 1.9 12.6 13.6 11.6 — — —<br />
… … … … … … … … … … … … … … …<br />
… … … … … … … … … … … … … … …<br />
20.1 20.0 20.2 22.5 21.3 23.6 3.5 3.7 3.2 11.8 13.0 10.6 4.1 2.7 5.6<br />
14.4 15.4 13.6 20.3 24.0 16.9 . . . 7.5 8.1 6.9 — — —<br />
16.7 15.3 17.9 39.9 38.3 41.4 x(16) x(17) x(18) 29.9 32.2 27.8 13.4 14.1 12.9<br />
… … … … … … … … … … … … … … …<br />
… … … … … … … … … … … … … … …<br />
17.3 19.2 15.4 34.5 35.0 34.0 x(22) x(23) x(24) 16.4 17.0 15.7 . . .<br />
… … … … … … … … … … … … … … …<br />
… … … … … … … … … … … … … … …<br />
… … … … … … … … … … … … … … …<br />
… … … … … … … … … … … … … … …<br />
29.5 27.5 31.4 20.6 19.0 22.1 10.3 18.2 3.0 34.8 30.7 38.5 4.8 4.7 5.0<br />
… … … … … … … … … … … … … … …<br />
… … … … … … … … … … … … … … …<br />
… … … … … … … … … … … … … … …<br />
x(16) x(17) x(18) 35.1 35.3 34.9 5.5 6.0 5.0 24.2 22.4 25.9 0.1 0.1 0.1<br />
10.2 9.5 10.8 37.4 38.8 36.1 . . . 35.3 40.8 30.1 — — —<br />
x(10) x(11) x(12) 49.7 46.3 53.4 8.5 9.3 7.6 3.9 4.4 3.3 1.5 1.5 1.5<br />
10.1 10.8 9.5 19.6 18.1 21.1 8.9 10.2 7.6 38.1 41.4 35.0 — — —<br />
… … … … … … … … … … … … … … …<br />
9.7 11.7 7.9 9.6 11.4 8.0 — — — 12.8 12.4 13.2 0.5 0.6 0.5<br />
… … … … … … … … … … … … … … …<br />
… … … … … … … … … … … … … … …<br />
46.1 45.8 46.3 11.2 11.2 11.2 x(22) x(23) x(24) 12.1 13.6 10.6 0.4 0.5 0.3<br />
… … … … … … … … … … … … … … …<br />
… … … … … … … … … … … … … … …<br />
… … … … … … … … … … … … … … …<br />
LATIN AMERICA AND THE CARIBBEAN<br />
10.9 10.6 11.2 26.4 24.5 28.2 x(16) x(17) x(18) 17.1 15.9 18.3 4.0 3.9 4.0<br />
… … … … … … … … … … … … … … …<br />
14.2 16.2 12.3 28.4 28.3 28.5 . . . 13.7 12.0 15.3 0.2 0.2 0.2<br />
… … … … … … … … … … … … … … …<br />
19.1 21.8 16.9 51.5 48.1 54.2 18.7 17.4 19.8 0.3 0.4 0.3 0.5 0.6 0.4<br />
53.8 54.5 53.2 8.5 8.7 8.3 14.6 13.2 15.9 1.1 1.0 1.1 0.2 0.2 0.1<br />
… … … … … … … … … … … … … … …<br />
x(10) x(11) x(12) 26.5 26.4 26.6 21.5 20.5 22.4 26.7 24.4 28.8 3.6 3.6 3.6<br />
8.5 9.9 7.2 15.6 18.1 13.4 — — — 22.7 24.6 21.0 0.2 0.2 0.2<br />
14.7 14.9 14.4 24.6 24.1 25.0 . . . 11.3 9.9 12.5 0.3 0.3 0.3<br />
… … … … … … … … … … … … … … …<br />
13.9 15.8 12.1 31.7 32.5 30.9 7.5 8.2 6.7 37.1 33.8 40.4 1.4 1.7 1.0<br />
22.1 22.8 21.5 34.7 35.4 33.9 . . . 18.0 18.2 17.9 0.4 0.4 0.4<br />
14.5 14.1 14.7 22.1 22.3 21.9 . . . 19.7 19.2 20.2 — — 0.1<br />
7.4 7.5 7.3 16.1 15.9 16.2 — — — 18.8 18.4 19.2 0.2 0.3 0.2<br />
28.4 31.2 25.7 31.0 31.4 30.6 — — — 9.4 9.2 9.5 — — —<br />
15.7 12.0 19.4 5.7 5.9 5.5 x(16) x(17) x(18) 5.0 5.2 4.8 0.5 0.1 0.8<br />
22.1 23.8 20.5 21.4 20.3 22.5 . . . 10.3 8.7 11.7 — — —<br />
6.8 6.5 7.1 20.6 20.9 20.4 0.8 0.7 0.8 11.6 11.3 11.8 . . .<br />
15.0 16.9 13.4 19.9 20.3 19.5 — — — 6.8 7.5 6.1 0.1 0.1 0.1<br />
… … … … … … … … … … … … … … …<br />
4.2 5.2 3.3 7.2 7.5 6.9 . . . 3.4 4.7 2.4 — — —<br />
— — — 28.9 26.9 30.8 2.1 1.8 2.3 0.2 0.3 0.1 — — —<br />
… … … … … … … … … … … … … … …<br />
8.4 8.1 8.6 11.1 10.2 11.9 2.9 3.0 2.9 5.1 5.4 4.9 0.4 0.6 0.2<br />
… … … … … … … … … … … … … … …<br />
23.7 24.5 22.9 14.8 15.1 14.6 . . . 17.6 18.9 16.4 0.5 0.5 0.5<br />
169
TABLE<br />
15<br />
EDUCATIONAL ATTAINMENT OF THE POPULATION AGED 25 YEARS AND OLDER /<br />
ISCED 0-6 / Latest year available<br />
REGION<br />
Country or territory<br />
Reference<br />
year<br />
Population<br />
(25 years and older) (000)<br />
No schooling (%) Incomplete primary (%) Primary (ISCED 1) (%)<br />
MF M F MF M F MF M F MF M F<br />
(1) (2) (3) (4) (5) (6) (7) (8) (9) (10) (11) (12)<br />
Montserrat … … … … … … … … … … … … …<br />
Netherlands Antilles a … … … … … … … … … … … … …<br />
Nicaragua … … … … … … … … … … … … …<br />
Panama 2010 1,889 941 948 7.3 6.7 8.0 9.9 10.4 9.4 21.0 22.6 19.5<br />
Paraguay 2008 2,807 1,407 1,400 4.5 3.3 5.6 28.5 27.4 29.5 28.2 28.4 28.0<br />
Peru 2010 14,816 7,324 7,492 6.8 2.7 10.9 15.1 12.9 17.2 18.9 19.1 18.6<br />
Puerto Rico 2008 2,364 1,094 1,270 x(13) x(14) x(15) x(13) x(14) x(15) x(13) x(14) x(15)<br />
Saint Kitts and Nevis … … … … … … … … … … … … …<br />
Saint Lucia … … … … … … … … … … … … …<br />
Saint Vincent and the Grenadines … … … … … … … … … … … … …<br />
Suriname 2004 254 126 128 10.8 8.0 13.4 — — — 31.8 34.2 29.6<br />
Trinidad and Tobago 2009 810 382 429 1.3 0.7 1.9 4.0 3.1 4.9 34.8 36.3 33.3<br />
Turks and Caicos Islands … … … … … … … … … … … … …<br />
Uruguay 2010 2,095 976 1,118 1.6 1.4 1.8 12.7 13.1 12.5 36.1 37.3 35.2<br />
Venezuela 2009 14,647 7,244 7,403 6.6 6.5 6.8 10.6 11.6 9.6 28.9 30.9 27.0<br />
NORTH AMERICA AND WESTERN EUROPE<br />
Andorra 2006 59 31 28 6.9 5.7 8.3 x(4) x(5) x(6) 42.6 44.4 40.6<br />
Austria 2010 6,131 2,937 3,194 x(13) x(14) x(15) x(13) x(14) x(15) x(13) x(14) x(15)<br />
Belgium 2010 7,647 3,688 3,959 x(7) x(8) x(9) 7.3 6.0 8.6 13.0 11.6 14.3<br />
Canada 2006 22,544 11,000 11,544 x(13) x(14) x(15) x(13) x(14) x(15) x(13) x(14) x(15)<br />
Cyprus 2010 729 368 362 0.9 0.3 1.4 6.0 3.8 8.1 17.3 16.3 18.3<br />
Denmark k 2011 3,877 1,895 1,982 x(25) x(26) x(27) x(25) x(26) x(27) x(25) x(26) x(27)<br />
Finland 2009 3,791 1,828 1,963 x(13) x(14) x(15) x(13) x(14) x(15) x(13) x(14) x(15)<br />
France 2010 43,490 20,686 22,805 . . . 1.6 1.4 1.7 19.2 16.3 21.9<br />
Germany 2010 62,008 29,972 32,036 . . . . . . 3.5 3.1 3.9<br />
Gibraltar … … … … … … … … … … … … …<br />
Greece 2010 8,513 4,152 4,361 2.8 1.7 3.8 3.8 2.7 4.9 30.2 28.6 31.7<br />
Holy See … … … … … … … … … … … … …<br />
Iceland 2005 188 94 94 x(10) x(11) x(12) x(10) x(11) x(12) 4.0 3.2 4.7<br />
Ireland 2010 2,941 1,452 1,489 x(10) x(11) x(12) x(10) x(11) x(12) 18.4 18.9 17.9<br />
Israel 2010 4,277 2,053 2,225 3.0 1.6 4.3 2.3 2.1 2.6 9.4 9.4 9.5<br />
Italy 2010 45,992 22,137 23,855 6.3 4.0 8.4 x(4) x(5) x(6) 19.9 17.0 22.5<br />
Liechtenstein … … … … … … … … … … … … …<br />
Luxembourg k 2010 358 175 182 x(13) x(14) x(15) x(13) x(14) x(15) x(13) x(14) x(15)<br />
Malta 2011 298 146 152 1.9 1.5 2.4 . . . 28.3 23.5 33.0<br />
Monaco … … … … … … … … … … … … …<br />
Netherlands 2010 11,662 5,707 5,955 — — — 1.7 1.6 1.8 8.7 7.0 10.4<br />
Norway 2010 3,334 1,650 1,684 x(25) x(26) x(27) — — — 0.3 0.3 0.3<br />
Portugal 2010 7,901 3,751 4,150 11.8 8.0 15.2 . . . 46.3 49.7 43.3<br />
San Marino … … … … … … … … … … … … …<br />
Spain g 2010 34,435 16,770 17,664 2.5 1.6 3.3 9.3 7.9 10.6 20.8 19.7 21.9<br />
Sweden 2010 6,570 3,229 3,341 x(25) x(26) x(27) x(10) x(11) x(12) 12.7 12.1 13.3<br />
Switzerland 2010 5,581 2,699 2,882 x(10) x(11) x(12) x(10) x(11) x(12) 4.2 3.4 4.9<br />
United Kingdom 2010 43,106 20,802 22,303 0.2 0.1 0.3 — — — — — —<br />
United States of America 2010 204,738 99,006 105,733 0.4 0.3 0.4 0.9 1.0 0.9 3.9 4.1 3.8<br />
SOUTH AND WEST ASIA<br />
Afghanistan … … … … … … … … … … … … …<br />
Bangladesh 2001 55,663 28,670 26,993 51.0 45.4 56.6 1.8 1.7 1.9 20.5 21.6 19.5<br />
Bhutan 2005 287 155 133 12.9 13.1 12.5 39.3 39.6 38.4 13.4 12.8 15.1<br />
India … … … … … … … … … … … … …<br />
Iran (Islamic Republic of) 2010 40,749 20,591 20,158 x(10) x(11) x(12) x(10) x(11) x(12) 37.5 35.3 40.0<br />
Maldives 2006 130 65 65 26.9 26.2 27.6 30.6 27.1 34.1 21.7 23.4 19.9<br />
Nepal … … … … … … … … … … … … …<br />
Pakistan 2009 72,642 36,853 35,789 52.5 37.2 69.0 2.6 3.3 1.8 12.8 15.8 9.4<br />
Sri Lanka 2009 12,204 5,911 6,293 5.4 3.1 7.4 x(10) x(11) x(12) 20.6 21.4 19.9<br />
SUB-SAHARAN AFRICA<br />
Angola … … … … … … … … … … … … …<br />
Benin 2002 2,452 1,151 1,301 69.6 57.1 80.3 x(10) x(11) x(12) 16.0 21.6 11.3<br />
170
OPPORTUNITIES LOST: THE IMPACT OF GRADE REPETITION AND EARLY SCHOOL LEAVING<br />
Lower secondary (ISCED 2)<br />
(%)<br />
Upper secondary (ISCED 3)<br />
(%)<br />
Post-secondary non-tertiary<br />
(ISCED 4) (%)<br />
Tertiary (ISCED 5-6) (%) Unknown (%)<br />
MF M F MF M F MF M F MF M F MF M F<br />
(13) (14) (15) (16) (17) (18) (19) (20) (21) (22) (23) (24) (25) (26) (27)<br />
… … … … … … … … … … … … … … …<br />
… … … … … … … … … … … … … … …<br />
… … … … … … … … … … … … … … …<br />
9.2 9.9 8.4 20.1 20.4 19.9 1.4 1.4 1.4 21.3 18.3 24.3 9.7 10.4 9.1<br />
10.2 12.0 8.4 18.2 19.7 16.7 . . . 10.4 9.1 11.7 — — 0.1<br />
6.2 6.9 5.6 32.0 36.4 27.7 — — — 20.9 21.8 19.9 0.1 0.1 0.1<br />
22.3 23.4 21.3 34.9 37.9 32.3 21.6 21.1 22.2 21.2 17.6 24.2 — — —<br />
… … … … … … … … … … … … … … …<br />
… … … … … … … … … … … … … … …<br />
… … … … … … … … … … … … … … …<br />
36.2 38.6 34.0 4.1 4.6 3.7 — — — 3.4 4.0 2.8 13.7 10.7 16.5<br />
2.9 2.7 3.1 12.7 10.9 14.5 34.1 36.7 31.6 9.6 8.9 10.2 0.5 0.5 0.5<br />
… … … … … … … … … … … … … … …<br />
22.3 24.0 20.9 12.5 11.5 13.3 5.3 5.3 5.3 9.4 7.4 11.2 — — —<br />
10.8 11.5 10.1 27.0 26.0 28.0 . . . 15.9 13.3 18.4 0.2 0.2 0.1<br />
NORTH AMERICA AND WESTERN EUROPE<br />
x(16) x(17) x(18) 19.3 20.0 18.5 12.3 12.4 12.3 17.8 16.9 18.7 1.1 0.7 1.6<br />
23.4 15.5 30.8 50.4 55.7 45.5 8.6 7.9 9.4 17.5 20.9 14.4 — — —<br />
17.9 18.5 17.3 30.0 32.1 28.1 1.7 1.8 1.6 30.0 29.9 30.1 — — —<br />
20.6 20.3 20.9 23.4 21.8 24.9 12.1 16.1 8.4 43.9 41.8 45.8 . . .<br />
10.4 10.9 9.9 32.9 36.5 29.5 1.7 0.9 2.4 30.9 31.3 30.4 — — —<br />
24.2 22.8 25.5 41.5 45.2 37.9 x(25) x(26) x(27) 30.7 28.7 32.6 3.6 3.3 3.9<br />
30.4 30.4 30.3 38.0 40.9 35.3 x(16) x(17) x(18) 31.6 28.6 34.4 — — —<br />
17.3 16.8 17.8 37.4 41.3 33.9 0.1 0.1 0.1 24.4 24.2 24.7 — — —<br />
15.4 9.5 20.9 50.8 52.2 49.5 6.0 5.5 6.4 24.2 29.6 19.2 0.1 0.1 0.2<br />
… … … … … … … … … … … … … … …<br />
9.5 11.0 8.1 26.8 28.3 25.4 6.8 6.3 7.3 20.0 21.5 18.7 — — —<br />
… … … … … … … … … … … … … … …<br />
33.4 28.4 38.5 28.3 34.6 22.0 2.0 3.3 0.6 27.6 25.3 29.9 4.7 5.2 4.3<br />
14.1 15.2 12.9 21.7 21.2 22.2 10.8 11.7 10.0 32.2 29.9 34.3 2.9 3.1 2.7<br />
7.5 9.4 5.7 34.2 36.8 31.8 . . . 43.1 40.3 45.6 0.5 0.4 0.5<br />
28.3 32.0 25.0 32.7 34.8 30.8 0.7 0.5 0.8 12.1 11.8 12.5 — — —<br />
… … … … … … … … … … … … … … …<br />
24.5 20.1 28.8 x(19) x(20) x(21) 42.4 42.5 42.2 33.2 37.4 29.0 — — —<br />
42.4 43.5 41.2 7.5 7.4 7.5 6.4 9.1 3.8 13.5 14.9 12.1 — — —<br />
… … … … … … … … … … … … … … …<br />
22.6 19.7 25.3 34.3 35.6 33.1 3.3 3.6 3.1 28.6 31.7 25.6 0.8 0.8 0.7<br />
22.9 21.4 24.3 38.8 40.6 37.0 2.9 3.8 1.9 29.4 27.4 31.3 5.8 6.5 5.2<br />
16.0 17.9 14.2 12.7 13.2 12.3 0.5 0.5 0.5 12.7 10.7 14.5 — — —<br />
… … … … … … … … … … … … … … …<br />
23.1 25.1 21.3 18.6 19.4 17.7 — — — 25.7 26.2 25.2 — — —<br />
9.3 10.3 8.3 43.1 45.0 41.2 5.1 6.2 4.0 28.1 24.5 31.7 1.7 1.8 1.6<br />
13.3 8.9 17.3 44.1 40.8 47.1 4.9 5.0 4.9 33.0 41.3 25.3 0.5 0.5 0.5<br />
13.4 11.5 15.2 52.6 54.8 50.5 0.1 0.1 0.1 33.7 33.5 33.9 — — —<br />
7.6 8.0 7.3 48.0 48.3 47.8 x(16) x(17) x(18) 39.1 38.3 39.9 — — —<br />
SOUTH AND WEST ASIA<br />
… … … … … … … … … … … … … … …<br />
9.6 10.5 8.7 12.9 15.9 9.9 — — — 4.2 4.9 3.5 — — —<br />
15.8 15.1 17.7 5.6 5.7 5.1 4.1 4.4 3.0 8.9 9.2 8.1 — — —<br />
… … … … … … … … … … … … … … …<br />
20.0 21.9 17.8 24.0 23.3 24.7 x(22) x(23) x(24) 18.5 19.4 17.5 — — —<br />
10.0 10.6 9.4 1.0 1.3 0.7 2.3 2.5 2.0 1.6 2.1 1.1 5.9 6.7 5.1<br />
… … … … … … … … … … … … … … …<br />
8.9 12.3 5.2 16.6 22.6 10.1 — — — 6.7 8.7 4.5 — — —<br />
44.4 46.5 42.5 x(19) x(20) x(21) 15.5 15.7 15.4 14.1 13.3 14.8 . . .<br />
SUB—SAHARAN AFRICA<br />
… … … … … … … … … … … … … … …<br />
x(16) x(17) x(18) 12.2 17.5 7.6 … … … 2.2 3.8 0.8 — — —<br />
171
TABLE<br />
15<br />
EDUCATIONAL ATTAINMENT OF THE POPULATION AGED 25 YEARS AND OLDER /<br />
ISCED 0-6 / Latest year available<br />
REGION<br />
Country or territory<br />
Reference<br />
year<br />
Population<br />
(25 years and older) (000)<br />
No schooling (%) Incomplete primary (%) Primary (ISCED 1) (%)<br />
MF M F MF M F MF M F MF M F<br />
(1) (2) (3) (4) (5) (6) (7) (8) (9) (10) (11) (12)<br />
Botswana … … … … … … … … … … … … …<br />
Burkina Faso 2007 5,101 2,399 2,702 90.0 84.7 94.7 4.9 7.2 2.7 3.1 4.8 1.6<br />
Burundi … … … … … … … … … … … … …<br />
Cameroon … … … … … … … … … … … … …<br />
Cape Verde … … … … … … … … … … … … …<br />
Central African Republic … … … … … … … … … … … … …<br />
Chad 2004 3,267 1,590 1,677 77.7 68.9 85.4 13.6 16.5 11.1 3.0 4.4 1.8<br />
Comoros … … … … … … … … … … … … …<br />
Congo … … … … … … … … … … … … …<br />
Côte d’Ivoire … … … … … … … … … … … … …<br />
Democratic Republic of the Congo … … … … … … … … … … … … …<br />
Equatorial Guinea … … … … … … … … … … … … …<br />
Eritrea … … … … … … … … … … … … …<br />
Ethiopia 2007 28,181 13,814 14,368 71.8 60.7 82.8 1.0 1.2 0.8 17.8 24.9 10.7<br />
Gabon … … … … … … … … … … … … …<br />
Gambia … … … … … … … … … … … … …<br />
Ghana … … … … … … … … … … … … …<br />
Guinea … … … … … … … … … … … … …<br />
Guinea-Bissau … … … … … … … … … … … … …<br />
Kenya 2010 14,862 7,348 7,514 21.1 18.8 24.9 18.0 12.0 27.6 17.5 15.0 21.5<br />
Lesotho 2008 815 380 435 15.7 24.7 7.6 43.4 41.3 45.3 20.1 14.3 25.3<br />
Liberia … … … … … … … … … … … … …<br />
Madagascar … … … … … … … … … … … … …<br />
Malawi 1998 3,681 1,779 1,902 42.9 30.2 55.3 37.3 41.1 33.6 11.2 15.8 6.8<br />
Mali 2006 4,440 2,107 2,332 81.4 81.1 81.6 x(4) x(5) x(6) 8.3 9.6 7.1<br />
Mauritius 2000 666 326 341 12.2 6.7 17.5 38.3 37.7 39.0 10.0 10.3 9.7<br />
Mozambique … … … … … … … … … … … … …<br />
Namibia 2001 766 368 399 22.9 21.8 23.8 25.6 25.7 25.4 20.9 20.0 21.6<br />
Niger … … … … … … … … … … … … …<br />
Nigeria … … … … … … … … … … … … …<br />
Rwanda … … … … … … … … … … … … …<br />
Sao Tome and Principe … … … … … … … … … … … … …<br />
Senegal 2006 3,889 1,871 2,018 75.2 68.3 80.9 12.9 14.7 11.4 3.3 4.4 2.4<br />
Seychelles 2002 45 22 23 5.6 5.6 5.6 — — — 23.5 22.3 24.7<br />
Sierra Leone … … … … … … … … … … … … …<br />
Somalia … … … … … … … … … … … … …<br />
South Africa 2011 25,370 12,399 12,971 7.7 6.2 9.0 12.9 13.1 12.8 5.9 5.7 6.1<br />
Swaziland … … … … … … … … … … … … …<br />
Togo 2009 2,311 1,130 1,181 49.7 34.0 63.2 x(10) x(11) x(12) 23.1 26.2 20.5<br />
Uganda 2010 10,518 5,216 5,302 x(7) x(8) x(9) 55.6 49.2 63.4 2.6 16.8 13.6<br />
United Republic of Tanzania 2002 12,551 6,135 6,416 34.9 24.3 44.7 16.2 19.1 13.6 42.9 48.7 37.6<br />
Zambia … … … … … … … … … … … … …<br />
Zimbabwe 2002 4,421 2,160 2,261 13.2 8.1 17.8 21.6 17.9 25.0 19.1 18.3 19.9<br />
172
OPPORTUNITIES LOST: THE IMPACT OF GRADE REPETITION AND EARLY SCHOOL LEAVING<br />
Lower secondary (ISCED 2)<br />
(%)<br />
Upper secondary (ISCED 3)<br />
(%)<br />
Post-secondary non-tertiary<br />
(ISCED 4) (%)<br />
Tertiary (ISCED 5-6) (%) Unknown (%)<br />
MF M F MF M F MF M F MF M F MF M F<br />
(13) (14) (15) (16) (17) (18) (19) (20) (21) (22) (23) (24) (25) (26) (27)<br />
… … … … … … … … … … … … … … …<br />
1.5 2.4 0.8 0.2 0.4 0.1 0.1 0.1 0.1 0.2 0.3 — — — —<br />
… … … … … … … … … … … … … … …<br />
… … … … … … … … … … … … … … …<br />
… … … … … … … … … … … … … … …<br />
… … … … … … … … … … … … … … …<br />
x(16) x(17) x(18) 2.3 4.1 0.7 . . . 3.2 5.8 0.9 0.2 0.3 0.1<br />
… … … … … … … … … … … … … … …<br />
… … … … … … … … … … … … … … …<br />
… … … … … … … … … … … … … … …<br />
… … … … … … … … … … … … … … …<br />
… … … … … … … … … … … … … … …<br />
… … … … … … … … … … … … … … …<br />
0.2 0.3 0.1 4.5 5.9 3.1 1.8 2.5 1.2 0.5 0.8 0.2 2.4 3.7 1.0<br />
… … … … … … … … … … … … … … …<br />
… … … … … … … … … … … … … … …<br />
… … … … … … … … … … … … … … …<br />
… … … … … … … … … … … … … … …<br />
… … … … … … … … … … … … … … …<br />
5.6 4.5 7.5 30.0 41.7 11.2 6.3 6.1 6.7 — — — 1.4 1.9 0.6<br />
7.1 6.4 7.7 8.5 8.3 8.6 3.5 3.1 3.8 1.9 1.9 1.9 — — —<br />
… … … … … … … … … … … … … … …<br />
… … … … … … … … … … … … … … …<br />
3.4 4.8 2.0 4.7 7.4 2.1 — — — 0.5 0.7 0.3 — — —<br />
4.8 4.7 5.0 3.6 3.4 3.8 . . . 1.9 1.2 2.6 — — —<br />
18.6 21.0 16.3 12.4 14.0 10.9 5.2 5.9 4.6 2.6 3.8 1.5 0.5 0.6 0.5<br />
… … … … … … … … … … … … … … …<br />
10.6 10.6 10.7 11.7 12.6 10.9 3.1 3.2 3.0 2.2 2.5 2.0 3.0 3.5 2.6<br />
… … … … … … … … … … … … … … …<br />
… … … … … … … … … … … … … … …<br />
… … … … … … … … … … … … … … …<br />
… … … … … … … … … … … … … … …<br />
2.6 3.6 1.8 1.7 2.3 1.1 2.4 3.7 1.4 0.8 1.4 0.3 1.2 1.6 0.8<br />
22.6 21.2 24.0 x(19) x(20) x(21) 36.8 36.5 37.1 7.4 8.9 5.9 4.1 5.4 2.8<br />
… … … … … … … … … … … … … … …<br />
… … … … … … … … … … … … … … …<br />
13.9 14.2 13.7 45.7 46.3 45.2 6.5 6.4 6.6 6.1 6.6 5.6 1.2 1.5 1.0<br />
… … … … … … … … … … … … … … …<br />
18.0 24.0 12.8 5.9 10.4 2.1 0.3 0.4 0.2 2.6 4.5 1.0 0.4 0.5 0.2<br />
18.1 20.8 14.9 2.5 3.2 1.6 5.2 5.8 4.5 2.9 3.8 1.9 0.3 0.4 0.1<br />
4.4 5.6 3.2 0.7 1.1 0.3 x(16) x(17) x(18) 0.9 1.2 0.7 — — —<br />
… … … … … … … … … … … … … … …<br />
35.6 40.9 30.8 1.3 2.0 0.6 7.5 10.5 4.8 1.5 2.3 0.9 0.1 0.2 0.1<br />
173
TABLE<br />
16<br />
PRIMARY AND SECONDARY EDUCATION / ISCED 1, 2 and 3 / Distribution of students by<br />
type of institution / 2010 (WEI and UOE countries)<br />
Type of institution by ISCED level<br />
Mode of study<br />
REGION<br />
Primary (ISCED 1) Lower secondary (ISCED 2) Upper secondary (ISCED 3)<br />
Primary and secondary<br />
(ISCED 1-3)<br />
Country or territory<br />
ARAB STATES<br />
Public<br />
Governmentdependent<br />
private<br />
Independent<br />
private Public<br />
Governmentdependent<br />
private<br />
Independent<br />
private Public<br />
Governmentdependent<br />
private<br />
Independent<br />
private Full-time Part-time<br />
(1) (2) (3) (4) (5) (6) (7) (8) (9) (10) (11)<br />
Egypt … … … … … … … … … … …<br />
Jordan 66.9 . 33.1 78.9 . 21.1 88.1 . 11.9 100.0 .<br />
Tunisia 98.2 -1 . -1 1.8 -1 98.3 -1 . -1 1.7 -1 92.9 -1 . -1 7.2 -1 100.0 -1 . -1<br />
CENTRAL AND EASTERN EUROPE<br />
Bulgaria 99.2 . 0.8 97.7 . 2.3 97.4 . 2.6 96.0 4.0<br />
Croatia 99.7 . 0.3 99.7 . 0.3 96.3 . 3.7 96.4 3.6<br />
Czech Republic 98.5 1.5 . 97.3 2.7 . 85.6 14.4 . 99.9 0.1<br />
Estonia 96.0 -1 . -1 4.0 -1 96.9 -1 . -1 3.1 -1 96.2 -1 . -1 3.8 -1 95.8 -1 4.1 -1<br />
Hungary 91.7 -1 8.3 -1 . -1 90.9 -1 9.1 -1 . -1 80.2 -1 19.8 -1 . -1 95.7 -1 4.3 -1<br />
Latvia 98.9 . 1.1 99.3 . 0.7 98.3 . 1.7 95.0 5.0<br />
Lithuania 99.2 . 0.8 98.8 . 1.2 99.2 . 0.8 97.5 2.5<br />
Poland 97.4 -1 0.7 -1 1.9 -1 96.2 -1 1.1 -1 2.7 -1 86.9 -1 1.3 -1 11.9 -1 94.9 -1 5.1 -1<br />
Romania 99.7 . 0.3 99.8 . 0.2 96.7 . 3.3 96.4 3.6<br />
Russian Federation 99.4 -1 . -1 0.6 -1 99.5 -1 . -1 0.5 -1 98.8 -1 . -1 1.2 -1 99.9 -1 0.1 -1<br />
Slovakia 94.0 6.0 — 93.6 6.4 — 85.9 14.1 — 98.8 1.2<br />
Slovenia 99.6 0.4 — 99.9 0.1 — 96.6 2.1 1.4 94.3 5.7<br />
The former Yugoslav Rep. of Macedonia 100.0 . . 100.0 . . 97.8 0.7 1.5 99.9 0.1<br />
Turkey 97.9 -2 . -2 2.1 -2 97.9 -2 . -2 2.1 -2 97.1 -2 . -2 2.9 -2 64.9 -2 35.1 -2<br />
EAST ASIA AND THE PACIFIC<br />
Australia 69.1 30.9 . 65.5 34.5 . 68.3 31.5 0.2 83.6 16.4<br />
China 95.1 4.9 — 92.1 7.9 — 89.1 10.9 — 97.9 2.1<br />
Indonesia 83.2 . 16.8 63.7 . 36.3 50.2 . 49.8 100.0 .<br />
Japan 98.9 . 1.1 92.8 . 7.2 69.0 . 31.0 98.7 1.3<br />
Malaysia 99.1 -1 . -1 0.9 -1 97.0 -1 . -1 3.0 -1 96.7 -1 . -1 3.3 -1 100.0 -1 - -1<br />
New Zealand 87.7 10.2 2.1 82.8 12.3 4.9 78.4 16.7 4.9 90.6 9.4<br />
Philippines 91.9 -1 . -1 8.1 -1 80.6 -1 . -1 19.4 -1 78.6 -1 . -1 21.4 -1 100.0 -1 . -1<br />
Republic of Korea 98.6 . 1.4 81.8 18.2 . 54.8 45.2 . 100.0 .<br />
Thailand 81.1 +1 18.9 +1 — +1 86.9 +1 13.1 +1 — +1 79.5 +1 20.5 +1 — +1 100.0 +1 . +1<br />
LATIN AMERICA AND THE CARIBBEAN<br />
Argentina 76.4 -1 18.1 -1 5.6 -1 77.4 -1 17.0 -1 5.7 -1 70.1 -1 21.4 -1 8.6 -1 100.0 -1 . -1<br />
Brazil 86.7 . 13.3 89.3 . 10.7 85.0 . 15.0 100.0 —<br />
Chile 42.2 -1 51.8 -1 6.0 -1 47.1 -1 46.9 -1 6.0 -1 41.5 -1 51.9 -1 6.6 -1 100.0 -1 . -1<br />
Jamaica 89.1 0.6 10.3 94.4 . 5.6 94.3 . 5.7 100.0 .<br />
Mexico 91.8 . 8.2 88.5 . 11.5 82.3 . 17.7 100.0 .<br />
Paraguay 82.3 -1 10.7 -1 7.0 -1 80.3 -1 11.6 -1 8.1 -1 73.8 -1 7.0 -1 19.2 -1 100.0 -1 . -1<br />
Peru 77.9 4.2 17.9 74.7 5.8 19.5 73.3 5.6 21.1 100.0 .<br />
Uruguay 84.5 -1 . -1 15.5 -1 85.7 -1 . -1 14.3 -1 88.6 -1 . -1 11.4 100.0 -1 . -1<br />
NORTH AMERICA AND WESTERN EUROPE<br />
Austria 94.3 5.7 — 91.0 9.0 — 89.3 10.7 — 100.0 —<br />
Belgium 46.2 53.8 . 40.2 59.8 . 43.3 56.7 . 79.5 20.5<br />
Canada 94.0 -1 6.0 -1 x(2) 91.4 -1 8.6 -1 x(4) 94.2 -1 5.8 -1 x(7) 100.0 -1 . -1<br />
Cyprus 92.4 . 7.6 82.2 . 17.8 82.9 . 17.1 99.2 0.8<br />
Denmark 86.5 -1 13.2 -1 0.3 -1 74.2 -1 25.1 -1 0.8 -1 97.8 -1 2.1 -1 0.1 -1 97.4 -1 2.6 -1<br />
Finland 98.5 1.5 . 95.5 4.5 . 83.9 16.1 . 100.0 .<br />
France 85.2 14.3 0.5 78.2 21.5 0.3 68.4 30.6 0.9 100.0 —<br />
Germany 95.9 4.1 — 90.8 9.2 — 92.7 7.3 — 99.6 0.4<br />
Greece ... ... ... ... ... ... ... ... ... ... ...<br />
Iceland 98.0 2.0 — 99.2 0.8 — 79.1 20.2 0.7 89.5 10.5<br />
Ireland 99.3 . 0.7 100.0 . . 98.5 . 1.5 99.9 0.1<br />
Israel 100.0 -1 . -1 . -1 100.0 -1 . -1 . -1 100.0 -1 . -1 . -1 100.0 -1 . -1<br />
Italy 93.2 . 6.8 95.9 . 4.1 89.0 5.9 5.1 99.0 1.0<br />
Liechtenstein 95.7 . 4.3 93.6 . 6.4 98.7 1.3 . 100.0 .<br />
Luxembourg 92.2 -2 0.5 -2 7.3 -2 80.4 -2 11.2 -2 8.4 -2 84.2 -2 7.3 -2 8.5 -2 99.9 -2 0.1 -2<br />
Malta 59.5 27.7 12.8 62.3 29.1 8.6 92.0 6.5 1.5 100.0 —<br />
Netherlands … . ... … . ... … . ... 99.0 1.0<br />
174
OPPORTUNITIES LOST: THE IMPACT OF GRADE REPETITION AND EARLY SCHOOL LEAVING<br />
REGION<br />
Type of institution by ISCED level<br />
Primary (ISCED 1) Lower secondary (ISCED 2) Upper secondary (ISCED 3)<br />
Mode of study<br />
Primary and secondary<br />
(ISCED 1-3)<br />
Country or territory<br />
Norway 97.7 2.3 — 96.8 3.2 — 88.4 11.6 — 98.5 1.5<br />
Portugal 88.1 -1 3.2 -1 8.7 -1 81.2 -1 5.1 -1 13.7 -1 75.8 -1 4.0 -1 20.2 -1 100.0 -1 . -1<br />
Spain 68.2 28.0 3.8 69.0 27.9 3.2 78.0 12.2 9.7 91.8 8.2<br />
Sweden 91.9 8.1 — 88.5 11.5 — 84.3 15.7 — 84.6 15.4<br />
Switzerland 95.4 1.5 3.1 92.0 3.0 5.0 93.2 2.9 3.9 99.8 0.2<br />
United Kingdom 95.0 0.2 4.9 78.5 15.6 5.8 54.0 40.2 5.8 96.8 3.2<br />
United States of America 91.1 . 8.9 91.6 . 8.4 91.6 . 8.4 100.0 .<br />
SOUTH AND WEST ASIA<br />
India … … … … … … … … … … …<br />
Sri Lanka 97.2 2.8 — 94.9 5.1 — 92.2 7.8 — … …<br />
TABLE<br />
17<br />
TERTIARY EDUCATION / ISCED 5 and 6 / Distribution of students by type of institution /<br />
2010 (WEI and UOE countries)<br />
Type of institution by ISCED level<br />
Mode of study<br />
REGION<br />
Tertiary (ISCED 5B) Tertiary (ISCED 5A and 6) Total tertiary (ISCED 5-6) Tertiary (ISCED 5B)<br />
Tertiary<br />
(ISCED 5A and 6)<br />
Country or territory<br />
ARAB STATES<br />
Public<br />
Governmentdependent<br />
private<br />
Independent<br />
private Public<br />
Governmentdependent<br />
private<br />
Independent<br />
private Public<br />
Governmentdependent<br />
private<br />
Independent<br />
private Full-time Part-time<br />
(1) (2) (3) (4) (5) (6) (7) (8) (9) (10) (11)<br />
Governmentdependent<br />
Independent<br />
Governmentdependent<br />
Independent<br />
Governmentdependent<br />
Independent<br />
Public private private Public private private Public private private Full-time Part-time Full-time Part-time<br />
(1) (2) (3) (4) (5) (6) (7) (8) (9) (10) (11) (12) (13)<br />
Egypt 76.6 — 23.4 81.1 — 18.9 81.1 — 18.9 100.0 . 100.0 .<br />
Jordan 54.7 -1 . -1 45.3 -1 68.6 -1 . -1 31.4 -1 67.0 -1 . -1 33.0 -1 100.0 -1 . -1 100.0 -1 . -1<br />
Tunisia x(7) -1 . -1 x(9) -1 x(7) -1 . -1 x(9) -1 97.5 -1 . -1 2.5 -1 100.0 -1 . -1 100.0 -1 . -1<br />
CENTRAL AND EASTERN EUROPE<br />
Bulgaria 30.5 . 69.5 83.4 . 16.6 78.0 . 22.0 43.2 56.8 69.6 30.4<br />
Croatia 79.8 . 20.2 99.8 . 0.2 93.5 . 6.5 … … 81.4 18.6<br />
Czech Republic 69.6 28.4 2.1 86.0 . 14.0 84.8 2.1 13.1 90.5 9.5 97.4 2.6<br />
Estonia 48.9 18.2 33.0 0.3 92.0 7.7 16.2 67.9 16.0 89.7 10.3 86.8 13.2<br />
Hungary 54.2 -1 45.8 -1 . -1 86.4 -1 13.6 -1 . -1 83.7 -1 16.3 -1 . -1 72.2 -1 27.8 -1 63.0 -1 37.0 -1<br />
Latvia 37.6 20.0 42.5 - 71.4 28.6 6.2 62.9 30.9 44.5 54.5 66.8 33.2<br />
Lithuania 72.4 . 27.6 94.5 . 5.5 88.2 . 11.8 47.1 52.9 61.9 38.1<br />
Poland 74.9 -1 . -1 25.1 -1 66.6 -1 . -1 33.4 -1 66.6 -1 . -1 33.4 -1 70.4 -1 29.6 -1 44.7 -1 55.3 -1<br />
Romania 100.0 . . 62.5 . 37.5 62.5 . 37.5 100.0 . 75.9 24.1<br />
Russian Federation 95.2 -1 . -1 4.8 -1 83.1 -1 . -1 16.9 -1 85.2 -1 . -1 ... 69.9 -1 30.1 -1 50.8 -1 49.2 -1<br />
Slovakia 81.0 19.0 — 83.6 — 16.4 83.5 0.2 16.3 78.0 22.0 64.4 35.6<br />
Slovenia 78.2 5.0 16.8 89.2 6.4 4.5 86.6 6.0 7.4 53.9 46.1 75.0 25.0<br />
The former Yugoslav Rep. of Macedonia 90.3 . 9.7 78.4 . 21.6 78.8 . 21.2 55.3 44.7 80.7 19.3<br />
Turkey 96.7 . 3.3 94.1 . 5.9 94.8 . 5.2 100.0 — 100.0 —<br />
EAST ASIA AND THE PACIFIC<br />
Australia 76.1 13.1 10.9 95.9 . 4.1 92.5 2.3 5.3 47.3 52.7 70.8 29.2<br />
China — — — — — — — — — 70.1 29.9 76.4 23.6<br />
Indonesia 50.4 . 49.6 39.4 . 60.6 41.8 . 58.2 100.0 . 100.0 .<br />
Japan 8.0 . 92.0 24.6 . 75.4 21.4 . 78.6 97.0 3.0 90.8 9.2<br />
Malaysia 56.5 -1 . -1 43.5 -1 61.7 -1 . -1 38.3 -1 59.4 -1 . -1 40.6 -1 97.5 -1 2.5 -1 100 -1 — -1<br />
New Zealand 62.7 35.0 2.3 96.7 3.0 0.3 88.1 11.1 0.8 36.0 64.0 59.9 40.1<br />
Philippines 40.8 -2 . -2 59.2 -2 33.3 -2 . -2 66.7 -2 34.1 -2 . -2 65.9 -2 100.0 -2 . -2 100.0 -2 . -2<br />
Republic of Korea 2.8 . 97.2 24.4 . 75.6 19.3 . 80.7 ... ... ... ...<br />
Thailand 64.0 +1 . +1 36.0 +1 84.9 +1 . +1 15.1 +1 81.7 +1 . +1 18.3 +1 ... ... ... ...<br />
LATIN AMERICA AND THE CARIBBEAN<br />
Argentina 59.1 -1 16.9 -1 24.0 -1 79.1 -1 . -1 20.9 -1 72.7 -1 5.5 -1 21.9 -1 94.0 -1 6.0 -1 53.2 -1 46.8 -1<br />
Brazil 14.8 . 85.2 29.0 . 71.0 27.3 . 72.7 … … … ...<br />
Chile 5.6 2.7 91.7 27.5 21.5 50.9 18.1 13.4 68.5 … … … ...<br />
Jamaica 100.0 . . — . 100.0 4.0 . 96.0 100.0 . 100.0 .<br />
175
TABLE<br />
17<br />
continued…<br />
Type of institution by ISCED level<br />
Mode of study<br />
REGION<br />
Tertiary (ISCED 5B) Tertiary (ISCED 5A and 6) Total tertiary (ISCED 5-6) Tertiary (ISCED 5B)<br />
Tertiary<br />
(ISCED 5A and 6)<br />
Country or territory<br />
Mexico 95.3 . 4.7 66.7 . 33.3 67.7 . 32.3 100 . 100 .<br />
Paraguay 59.9 -1 . -1 40.1 -1 ... . -1 ... ... . -1 ... 100 -1 . -1 ... ...<br />
Peru 32.4 0.5 67.1 ... ... ... ... ... ... … … … ...<br />
Uruguay 93.6 -1 . -1 6.4 -1 86.2 -1 . -1 13.8 -1 87.0 -1 . -1 13.0 -1 100 -1 . -1 ... …<br />
NORTH AMERICA AND WESTERN EUROPE<br />
Austria 70.2 29.8 — 85.3 14.7 — 83.7 16.3 — … … … ...<br />
Belgium 43.0 57.0 — 44.0 56.0 — 43.5 56.5 — 63.1 36.9 84.1 15.9<br />
Canada … ... ... ... ... ... ... ... ... 76.0 -1 24.0 -1 82.1 -1 17.9 -1<br />
Cyprus 6.6 . 93.4 44.5 . 55.5 29.9 . 70.1 91.9 8.1 92.5 7.5<br />
Denmark 98.9 -1 0.5 -1 0.6 -1 98.2 -1 1.8 -1 0.0 -1 98.3 -1 1.6 -1 0.1 -1 62.8 -1 37.2 -1 90.7 -1 9.3 -1<br />
Finland 100 — . 81.2 18.8 . 81.2 18.8 . 100 . 55.7 44.3<br />
France 69.7 9.9 20.4 83.9 0.8 15.3 80.3 3.1 16.6 … … … ...<br />
Germany 57.2 42.8 — ... ... ... ... ... ... 87.4 12.6 ... ...<br />
Greece ... ... ... ... ... ... ... ... ... ... ... ... ...<br />
Iceland 31.6 68.4 — 81.2 18.8 — 80.3 19.7 — 45.1 54.9 71.1 28.9<br />
Ireland 97.0 . 3.0 95.1 . 4.9 95.5 . 4.5 71.3 28.7 87.3 12.7<br />
Israel 33.6 -1 66.4 -1 . -1 9.3 -1 77.4 -1 13.3 -1 13.8 -1 75.4 -1 10.8 -1 100 -1 . -1 81.6 -1 18.4 -1<br />
Italy 85.4 . 14.6 91.5 . 8.5 91.5 . 8.5 100 . 100 .<br />
Liechtenstein . . . . 93.8 6.2 . 93.8 6.2 ... ... 74.8 25.2<br />
Luxembourg ... ... ... ... ... ... ... ... ... ... ... ... ...<br />
Malta 100 . . 100 . . 100 . . 90.7 9.3 77.7 22.3<br />
Netherlands 100 -1 . -1 — -1 100 -1 . -1 — -1 100 -1 . -1 — -1 34.5 -1 65.5 -1 85.6 -1 14.4 -1<br />
Norway 42.4 28.7 28.9 86.0 4.5 9.5 85.8 4.6 9.6 46.0 54.0 71.3 28.7<br />
Portugal 79.6 . 20.4 76.6 . 23.4 76.6 . 23.4 100 — 100 —<br />
Spain 79.9 14.2 5.9 86.1 — 13.9 85.2 2.1 12.7 94.9 5.1 75.8 24.2<br />
Sweden 57.9 42.1 — 93.4 6.6 — 91.3 8.7 — 90.0 10.0 48.2 51.8<br />
Switzerland 34.5 33.5 32.0 95.3 3.1 1.6 82.6 9.4 8.0 25.7 74.3 88.5 11.5<br />
United Kingdom . 100 — . 100 — . 100 — 26.4 73.6 75.5 24.5<br />
United States of America 78.2 . 21.8 70.9 . 29.1 72.5 . 27.5 48.2 51.8 66.3 33.7<br />
SOUTH AND WEST ASIA<br />
India ... ... ... ... ... ... ... ... ... ... ... ... ...<br />
Sri Lanka 100 — . 100 — . 100 — . 66.8 33.2 37.4 62.6<br />
TABLE<br />
18<br />
REGION<br />
Country or territory<br />
ARAB STATES<br />
PRIMARY AND LOWER SECONDARY EDUCATION / ISCED 1 and 2 / Average class size<br />
by type of institution / 2010 (WEI and UOE countries)<br />
Primary education (ISCED 1)<br />
Lower secondary education (ISCED 2),<br />
general programmes<br />
Governmentdependent<br />
Independent<br />
Governmentdependent<br />
Independent<br />
Governmentdependent<br />
Independent<br />
Public private private Public private private Public private private Full-time Part-time Full-time Part-time<br />
(1) (2) (3) (4) (5) (6) (7) (8) (9) (10) (11) (12) (13)<br />
Public<br />
Governmentdependent<br />
private<br />
Independent<br />
private<br />
Total public<br />
and private Public<br />
Governmentdependent<br />
private<br />
Independent<br />
private<br />
Total public<br />
and private<br />
(1) (2) (3) (4) (5) (6) (7) (8)<br />
Egypt 39.8 39.2 31.9 39.1 35.8 37.1 29.3 35.4<br />
Jordan 26.1 . 25.2 25.8 30.3 . 26.6 29.4<br />
Tunisia 22.2 -1 . -1 22.1 -1 22.2 -1 28.6 -1 . -1 19.1 -1 28.4 -1<br />
CENTRAL AND EASTERN EUROPE<br />
Bulgaria 21.0 . 14.2 21.0 22.3 . 13.0 22.2<br />
Croatia 18.0 -1 . -1 10.7 -1 18.0 -1 22.0 -1 . -1 12.1 -1 21.9 -1<br />
Czech Republic 19.9 15.9 . 19.9 21.5 18.9 . 21.4<br />
Estonia 17.9 . 16.0 17.9 18.7 . 14.4 18.5<br />
Hungary 20.8 -1 19.2 -1 . -1 20.7 -1 21.9 -1 20.6 -1 . -1 21.7 -1<br />
Latvia 16.1 . 8.1 15.9 16.9 . 7.4 16.8<br />
Lithuania 15.4 . 11.8 15.3 20.4 . 18.7 20.4<br />
176
OPPORTUNITIES LOST: THE IMPACT OF GRADE REPETITION AND EARLY SCHOOL LEAVING<br />
REGION<br />
Primary education (ISCED 1)<br />
Lower secondary education (ISCED 2),<br />
general programmes<br />
Country or territory<br />
Public<br />
Governmentdependent<br />
private<br />
Independent<br />
private<br />
Total public<br />
and private Public<br />
Governmentdependent<br />
private<br />
Independent<br />
private<br />
Total public<br />
and private<br />
(1) (2) (3) (4) (5) (6) (7) (8)<br />
Poland 19.0 -1 11.5 -1 12.1 -1 18.7 -1 23.5 -1 24.4 -1 16.2 -1 23.3 -1<br />
Romania 18.5 . 13.6 18.4 20.4 . 14.1 20.3<br />
Russian Federation 16.2 -1 . -1 10.9 -1 16.2 -1 18.0 -1 . -1 10.1 -1 17.9 -1<br />
Slovakia 17.9 16.8 . 17.8 20.6 19.5 . 20.5<br />
Slovenia 18.4 20.4 . 18.4 19.6 20.3 . 19.6<br />
The former Yugoslav Rep. of Macedonia 19.4 . . 19.4 19.9 . . 19.9<br />
Turkey 26.3 . 19.4 26.1 26.3 . 19.4 26.1<br />
EAST ASIA AND THE PACIFIC<br />
Australia 23.2 24.9 . 23.7 22.8 25.3 . 23.7<br />
China 37.1 42.8 - 37.4 54.0 51.9 - 53.8<br />
Indonesia 27.2 . 22.9 26.4 36.5 . 32.5 34.9<br />
Japan 27.9 . 31.4 28.0 32.8 . 34.9 32.9<br />
Malaysia 29.9 -1 . -1 ... ... 34.0 -1 . -1 ... ...<br />
New Zealand ... ... ... ... ... ... ... ...<br />
Philippines 42.4 -1 . -1 33.1 -1 41.5 -1 43.7 -1 . -1 48.6 -1 44.7 -1<br />
Republic of Korea 27.4 . 30.2 27.5 34.9 33.8 . 34.7<br />
Thailand 18.7 +1 28.9 +1 — +1 20.0 +1 33.7 +1 34.7 +1 — +1 33.8 +1<br />
LATIN AMERICA AND THE CARIBBEAN<br />
Argentina 25.1 -1 29.7 -1 24.1 -1 25.8 -1 28.3 -1 30.0 -1 26.7 -1 28.5 -1<br />
Brazil 26.2 . 17.6 24.6 29.7 . 25.0 29.0<br />
Chile 27.1 32.5 23.7 29.3 28.3 31.9 24.7 29.5<br />
Jamaica ... ... ... ... ... ... ... ...<br />
Mexico 19.9 . 19.9 19.9 28.0 . 24.1 27.6<br />
Paraguay 18.9 -1 22.5 -1 19.2 -1 19.2 -1 20.2 -1 25.2 -1 19.5 -1 20.6 -1<br />
Peru 14.2 24.8 15.0 14.6 27.2 29.2 20.3 25.7<br />
Uruguay 24.7 -1 . -1 ... … 30.4 -1 . -1 25.1 -1 29.3 -1<br />
NORTH AMERICA AND WESTERN EUROPE<br />
Austria 18.4 20.0 x(2) 18.4 21.9 22.8 x(6) 22.0<br />
Belgium ... ... ... ... ... ... ... ...<br />
Canada ... ... ... ... ... ... ... ...<br />
Cyprus 17.4 . 17.7 17.5 21.4 . 19.8 21.1<br />
Denmark 20.0 -1 16.3 -1 . -1 19.4 -1 20.5 -1 17.3 -1 . -1 19.9 -1<br />
Finland 19.4 17.7 . 19.4 20.2 21.7 . 20.3<br />
France 22.6 22.9 x(2) 22.7 24.3 25.5 13.4 24.5<br />
Germany 21.5 21.9 x(2) 21.5 24.7 25.2 x(6) 24.7<br />
Greece ... ... ... ... ... ... ... ...<br />
Iceland 18.1 13.1 . 18.0 19.9 12.9 . 19.8<br />
Ireland 24.1 . ... ... ... . ... ...<br />
Israel 27.4 -1 . -1 . -1 27.4 -1 32.2 -1 . -1 . -1 32.2 -1<br />
Italy 18.8 . 20.2 18.8 21.3 . 22.4 21.3<br />
Liechtenstein 16.3 . 8.9 15.8 16.2 . 14.1 16.0<br />
Luxembourg 15.3 -1 19.7 -1 19.4 -1 15.6 -1 19.1 -1 21.0 -1 21.1 -1 19.5 -1<br />
Malta 18.1 25.8 20.5 18.7 20.4 24.7 19.1 20.2<br />
Netherlands 22.4 -2 . -2 ... ... ... . -2 ... ...<br />
Norway ... ... ... ... ... ... ... ...<br />
Portugal 20.1 23.5 19.3 20.1 22.1 23.4 21.5 22.1<br />
Spain 19.8 -1 24.5 -1 24.5 -1 21.1 -1 23.5 -1 26.0 -1 24.2 -1 24.3 -1<br />
Sweden ... ... ... ... ... ... ... ...<br />
Switzerland 19.1 ... ... ... 18.5 ... ... ...<br />
United Kingdom 25.8 19.1 11.7 24.4 21.1 18.9 9.6 19.4<br />
United States of America 20.3 . 17.7 20.0 23.7 . 19.4 23.3<br />
SOUTH AND WEST ASIA<br />
India ... ... ... ... ... ... ... ...<br />
Sri Lanka 25.7 31.3 ... … 27.0 15.2 ... …<br />
177
TABLE<br />
19<br />
INTENDED INSTRUCTION TIME (HOURS PER YEAR) FOR STUDENTS (9 TO 14 YEARS)<br />
IN PUBLIC INSTITUTIONS / 2010 (WEI and UOE countries)<br />
REGION Age Total for<br />
ages<br />
9-11<br />
Country or territory<br />
ARAB STATES<br />
Total for<br />
ages<br />
12-14<br />
Duration per<br />
session<br />
(in minutes)<br />
9 10 11 12 13 14<br />
(1) (2) (3) (4) (5) (6) (7) (8) (9)<br />
Egypt 1,145 1,145 1,145 1,019 1,019 1,019 3,435 3,056 45<br />
Jordan 1,080 1,080 1,080 1,148 1,215 1,181 3,240 3,544 45<br />
Tunisia 800 -2 960 -2 992 -2 992 -2 992 -2 992 -2 2,752 -2 2,976 -2 60 -2<br />
CENTRAL AND EASTERN EUROPE<br />
Bulgaria ... ... ... ... ... ... ... ... ...<br />
Croatia ... ... ... ... ... ... ... ... ...<br />
Czech Republic 706 706 706 862 862 862 2,117 2,587 …<br />
Estonia 683 683 683 802 802 802 2,048 2,406 …<br />
Hungary 724 724 724 885 885 885 2,171 2,656 …<br />
Latvia ... ... ... ... ... ... ... ... ...<br />
Lithuania ... ... ... ... ... ... ... ... ...<br />
Poland 763 763 763 820 820 820 2,289 2,460 …<br />
Romania ... ... ... ... ... ... ... ... ...<br />
Russian Federation 737 737 737 879 879 879 2,212 2,636 …<br />
Slovakia 794 794 794 851 851 851 2,381 2,552 …<br />
Slovenia 721 721 721 817 817 817 2,164 2,451 …<br />
The former Yugoslav Rep. of Macedonia ... ... ... ... ... ... ... ... ...<br />
Turkey 864 864 864 864 864 864 2,592 2,592 …<br />
EAST ASIA AND THE PACIFIC<br />
Australia 984 984 984 997 997 997 2,951 2,990 …<br />
China ... ... ... ... ... ... ... ... ...<br />
Indonesia 457 635 635 635 725 725 1,727 2,085 32<br />
Japan 800 800 800 877 877 877 2,401 2,631 …<br />
Malaysia 964 -1 964 -1 964 -1 1,230 -1 1,230 -1 1,230 -1 2,891 -1 3,690 -1 40 -1<br />
New Zealand ... ... ... ... ... ... ... ... ...<br />
Philippines ... ... ... ... ... ... ... ... 50<br />
Republic of Korea 703 703 703 859 859 859 2,108 2,576 …<br />
Thailand 800-1,000 800-1,000 800-1,000 1,000-1,200 1,000-1,200 1,000-1,200 2,400-3,000 3,000-3,600 50<br />
LATIN AMERICA AND THE CARIBBEAN<br />
Argentina 720 -1 720 -1 720 -1 896 -1 896 -1 896 -1 2,160 -1 2,688 -1 120 -1<br />
Brazil ... ... ... ... ... ... ... ... ...<br />
Chile 1,083 1,083 1,083 1,083 1,083 1,083 3,249 3,249 …<br />
Jamaica 950 950 950 950 950 950 2,850 2,850 40<br />
Mexico 800 800 800 1,167 1,167 1,167 2,400 3,500 …<br />
Paraguay 773 -1 773 -1 773 -1 1,039 -1 1,039 -1 1,039 -1 2,318 -1 3,116 -1 40 -1<br />
Peru 900 900 900 1,050 1,050 1,050 2,700 3,150 45<br />
Uruguay ... ... ... 1,368 -2 1,368 -2 1,404 -2 … 4,140 -2 60 -2<br />
NORTH AMERICA AND WESTERN EUROPE<br />
Austria 811 811 811 959 959 959 2,433 2,876 …<br />
Belgium, Flemish community 835 835 835 960 960 960 2,506 2,880 …<br />
Belgium, French community 930 930 930 1,020 1,020 … 2,790 … …<br />
Canada 921 921 921 922 922 922 2,763 2,766 …<br />
Cyprus ... ... ... ... ... ... ... ... ...<br />
Denmark 813 813 813 900 900 900 2,438 2,700 …<br />
Finland 683 683 683 829 829 829 2,049 2,487 …<br />
France 847 847 847 1,065 1,065 1,065 2,542 3,195 …<br />
Germany 793 793 793 887 887 887 2,379 2,660 …<br />
Greece 812 812 812 796 796 796 2,436 2,387 …<br />
Iceland 889 889 889 969 969 969 2,667 2,907 …<br />
Ireland 915 915 915 929 929 929 2,745 2,787 …<br />
Israel 990 990 990 981 981 981 2,970 2,943 …<br />
Italy 924 924 924 1,023 1,023 1,023 2,772 3,069 …<br />
Liechtenstein ... ... ... ... ... ... ... ... ...<br />
Luxembourg 924 924 924 908 908 908 2,772 2,724 …<br />
Malta ... ... ... ... ... ... ... ... ...<br />
Netherlands 940 940 940 1,000 1,000 1,000 2,820 3,000 …<br />
Norway 773 773 773 836 836 836 2,318 2,508 …<br />
178
OPPORTUNITIES LOST: THE IMPACT OF GRADE REPETITION AND EARLY SCHOOL LEAVING<br />
REGION Age Total for<br />
ages<br />
9-11<br />
Country or territory<br />
Total for<br />
ages<br />
12-14<br />
Duration per<br />
session<br />
(in minutes)<br />
9 10 11 12 13 14<br />
(1) (2) (3) (4) (5) (6) (7) (8) (9)<br />
Portugal 888 888 888 934 934 934 2,664 2,803 …<br />
Spain 875 875 875 1,050 1,050 1,050 2,625 3,150 …<br />
Sweden 741 741 741 741 741 741 2,222 2,222 …<br />
Switzerland ... ... ... ... ... ... ... ... ...<br />
United Kingdom, England 899 899 899 925 925 925 2,698 2,774 …<br />
United Kingdom, Scotland . . . . . . . . .<br />
United States of America ... ... ... ... ... ... ... ... ...<br />
SOUTH AND WEST ASIA<br />
India ... ... ... ... ... ... ... ... ...<br />
Sri Lanka 1,094 1,077 1,077 1,077 1,077 1,077 3,249 3,232 40<br />
TABLE<br />
20<br />
REGION Teaching hours per year Teaching weeks per year<br />
Country or territory<br />
ARAB STATES<br />
PRIMARY AND SECONDARY EDUCATION / ISCED 1, 2 and 3 / Organization of teachers’<br />
instructional time in public institutions / 2010 (WEI and UOE countries)<br />
Primary<br />
(ISCED 1)<br />
Lower secondary<br />
(ISCED 2)<br />
Upper secondary<br />
(ISCED 3), general<br />
programmes<br />
Primary<br />
(ISCED 1)<br />
Lower secondary<br />
(ISCED 2)<br />
Upper secondary<br />
(ISCED 3), general<br />
programmes<br />
(1) (2) (3) (4) (5) (6)<br />
Egypt 764 573 573 34 34 34<br />
Jordan 792 -2 792 -2 792 -2 39 -2 39 -2 39 -2<br />
Tunisia 662 -1 493 -1 493 -1 32 -1 30 -1 30 -1<br />
CENTRAL AND EASTERN EUROPE<br />
Bulgaria ... ... ... ... ... ...<br />
Croatia ... ... ... ... ... ...<br />
Czech Republic 862 647 617 41 41 41<br />
Estonia 630 630 578 39 39 39<br />
Hungary 604 604 604 37 37 37<br />
Latvia ... ... ... ... ... ...<br />
Lithuania ... ... ... ... ... ...<br />
Poland 502 497 494 38 38 37<br />
Romania ... ... ... ... ... ...<br />
Russian Federation 615 507 507 34 35 35<br />
Slovakia 841 652 624 38 38 38<br />
Slovenia 690 690 633 40 40 40<br />
The former Yugoslav Rep. of Macedonia ... ... ... ... ... ...<br />
Turkey 621 621 551 37 37 37<br />
EAST ASIA AND THE PACIFIC<br />
Australia 868 819 803 40 40 40<br />
China ... ... ... ... ... ...<br />
Indonesia 1,255 734 734 44 44 44<br />
Japan 707 602 500 40 40 40<br />
Malaysia 744 -1 744 -1 744 -1 39 -1 39 -1 39 -1<br />
New Zealand 930 845 760 39 38 38<br />
Philippines 1,176 1,176 1,176 40 40 40<br />
Republic of Korea 807 627 616 40 40 40<br />
Thailand 740 925 1,110 40 40 40<br />
LATIN AMERICA AND THE CARIBBEAN<br />
Argentina 680 -1 1,368 -1 1,368 -1 36 -1 36 -1 36 -1<br />
Brazil 800 800 800 40 40 40<br />
Chile 1,087 1,087 1,087 38 38 38<br />
Jamaica 950 950 950 52 52 52<br />
Mexico 800 1,047 843 42 42 36<br />
Paraguay 736 -1 819 -1 920 -1 38 -1 38 -1 38 -1<br />
Peru 869 1,013 1,013 40 40 40<br />
Uruguay 632 -2 612 -2 409 -2 37 -2 36 -2 36 -2<br />
179
TABLE<br />
20<br />
continued…<br />
REGION Teaching hours per year Teaching weeks per year<br />
Country or territory<br />
NORTH AMERICA AND WESTERN EUROPE<br />
Primary<br />
(ISCED 1)<br />
Lower secondary<br />
(ISCED 2)<br />
Upper secondary<br />
(ISCED 3), general<br />
programmes<br />
Primary<br />
(ISCED 1)<br />
Lower secondary<br />
(ISCED 2)<br />
Upper secondary<br />
(ISCED 3), general<br />
programmes<br />
(1) (2) (3) (4) (5) (6)<br />
Austria 779 607 589 38 38 38<br />
Belgium, Flemish community 761 675 630 37 37 37<br />
Belgium, French community 732 671 610 38 38 38<br />
Canada 799 740 744 37 37 37<br />
Cyprus ... ... ... ... ... ...<br />
Denmark 650 650 377 42 42 42<br />
Finland 680 595 553 38 38 38<br />
France 918 646 632 35 35 35<br />
Germany 805 756 713 40 40 40<br />
Greece 589 415 415 36 31 31<br />
Iceland 624 624 544 37 37 35<br />
Ireland 915 735 735 37 33 33<br />
Israel 820 598 521 38 37 37<br />
Italy 770 630 630 39 39 39<br />
Liechtenstein ... ... ... ... ... ...<br />
Luxembourg 739 634 634 36 36 36<br />
Malta ... ... ... ... ... ...<br />
Netherlands 930 750 750 40 … …<br />
Norway 741 654 523 38 38 38<br />
Portugal 865 761 761 37 37 37<br />
Spain 880 713 693 37 37 36<br />
Sweden . . . . . .<br />
Switzerland ... ... ... ... ... ...<br />
United Kingdom, England 684 703 703 38 38 38<br />
United Kingdom, Scotland 855 855 855 38 38 38<br />
United States of America 1,097 1,068 1,051 36 36 36<br />
SOUTH AND WEST ASIA<br />
India ... ... ... ... ... ...<br />
Sri Lanka 1,009 1,164 1,164 40 40 40<br />
TABLE<br />
21<br />
REGION<br />
Country or territory<br />
ARAB STATES<br />
PRIMARY AND SECONDARY EDUCATION / ISCED 1, 2 and 3 / Teachers’ annual salaries p<br />
in public institutions (in PPP q dollars) / 2010 (WEI and UOE countries)<br />
Primary (ISCED 1) Lower secondary (ISCED 2)<br />
Upper secondary (ISCED 3),<br />
general programmes<br />
Starting<br />
salary<br />
Salary after<br />
15 years of<br />
experience<br />
Salary at top<br />
of scale<br />
Starting<br />
salary<br />
Salary after<br />
15 years of<br />
experience<br />
Salary at top<br />
of scale<br />
Starting<br />
salary<br />
Salary after<br />
15 years of<br />
experience<br />
Salary at top<br />
of scale<br />
(1) (2) (3) (4) (5) (6) (7) (8) (9)<br />
Egypt 2,266 -2 3,674 -2 8,647 -2 2,266 -2 3,674 -2 8,647 -2 2,266 -2 3,674 -2 8,647 -2<br />
Jordan 5,285 9,416 19,420 5,285 9,416 19,420 5,285 9,416 19,420<br />
Tunisia 7,853 10,994 … 11,779 14,920 … 11,779 14,920 …<br />
CENTRAL AND EASTERN EUROPE<br />
Bulgaria … … … … … … … … …<br />
Croatia … … … … … … … … …<br />
Czech Republic 15,036 19,949 22,276 14,916 20,217 22,522 15,533 21,449 24,117<br />
Estonia 11,876 12,576 17,357 11,876 12,576 17,357 11,876 12,576 17,357<br />
Hungary 10,701 13,228 17,644 10,701 13,228 17,644 11,755 15,616 22,963<br />
Latvia … … … … … … … … …<br />
Lithuania … … … … … … … … …<br />
Poland 9,526 15,186 15,824 10,725 17,300 18,030 12,119 19,791 20,629<br />
Romania … … … … … … … … …<br />
180
OPPORTUNITIES LOST: THE IMPACT OF GRADE REPETITION AND EARLY SCHOOL LEAVING<br />
REGION<br />
Primary (ISCED 1) Lower secondary (ISCED 2)<br />
Upper secondary (ISCED 3),<br />
general programmes<br />
Country or territory<br />
Starting<br />
salary<br />
Salary after<br />
15 years of<br />
experience<br />
Salary at top<br />
of scale<br />
Starting<br />
salary<br />
Salary after<br />
15 years of<br />
experience<br />
Salary at top<br />
of scale<br />
Starting<br />
salary<br />
Salary after<br />
15 years of<br />
experience<br />
Salary at top<br />
of scale<br />
(1) (2) (3) (4) (5) (6) (7) (8) (9)<br />
Russian Federation … … … … … … … … …<br />
Slovakia 11,028 12,688 13,680 11,028 12,688 13,680 11,028 12,698 13,680<br />
Slovenia 26,690 32,436 34,074 26,690 32,436 34,074 26,690 32,436 34,074<br />
The former Yugoslav Rep. of Macedonia … … … … … … … … …<br />
Turkey 23,130 24,761 26,587 23,130 24,761 26,587 23,780 25,411 27,237<br />
EAST ASIA AND THE PACIFIC<br />
Australia 34,193 47,445 47,445 34,321 47,445 47,445 34,321 47,445 47,445<br />
China … … … … … … … … …<br />
Indonesia 1,666 -1 2,108 -1 2,402 -1 1,775 -1 2,402 -1 2,609 -1 2,056 -1 2,660 -1 2,898 -1<br />
Japan 25,454 44,788 56,543 25,454 44,788 56,543 25,454 44,788 58,075<br />
Malaysia 7,892 -2 16,323 -2 27,896 -2 7,892 -2 20,965 -2 29,339 -2 16,746 -2 20,965 -2 30,417 -2<br />
New Zealand 27,719 41,009 41,009 28,127 42,062 42,062 28,535 43,116 43,116<br />
Philippines 6,148 6,972 7,074 6,148 6,972 7,074 6,148 6,972 7,074<br />
Republic of Korea 26,776 46,338 74,149 26,670 46,232 74,043 26,670 46,232 74,043<br />
Thailand 5,272 11,182 18,957 5,272 11,182 18,957 5,272 11,182 18,957<br />
LATIN AMERICA AND THE CARIBBEAN<br />
Argentina 13,768 17,041 20,657 11,231 14,852 18,015 11,231 14,852 18,015<br />
Brazil … … … … … … … … …<br />
Chile 17,820 23,411 30,866 17,820 23,411 30,866 17,941 24,820 32,665<br />
Jamaica 13,026 -1 15,786 -1 15,786 -1 13,026 -1 15,786 -1 15,786 -1 13,026 -1 15,786 -1 15,786 -1<br />
Mexico 14,302 18,621 30,602 18,446 23,854 39,085 … … …<br />
Paraguay 6,011 6,011 6,011 8,945 8,945 8,945 8,922 8,922 8,922<br />
Peru 7,146 7,146 7,146 7,049 7,049 7,049 7,049 7,049 7,049<br />
Uruguay … 635 -1 930 -1 … 629 -1 952 -1 … 652 -1 979 -1<br />
NORTH AMERICA AND WESTERN EUROPE<br />
Austria 30,812 40,818 60,973 32,236 44,179 63,361 32,680 45,425 66,487<br />
Belgium, Flemish community 31,193 44,076 53,949 31,193 44,076 53,949 38,939 56,638 68,278<br />
Belgium, French community 30,202 42,792 52,509 30,202 42,792 52,509 37,736 55,157 66,613<br />
Canada 34,443 54,978 54,978 34,443 54,978 54,978 34,588 55,191 55,191<br />
Cyprus … … … … … … … … …<br />
Denmark 43,393 50,253 50,253 43,393 50,253 50,253 44,640 58,256 58,256<br />
Finland 29,029 37,455 39,702 31,351 40,451 42,879 32,276 42,809 45,377<br />
France 24,334 32,733 48,296 27,184 35,583 51,301 27,420 35,819 51,560<br />
Germany 46,456 55,771 61,209 51,058 61,784 68,592 53,963 66,895 76,433<br />
Greece 26,583 32,387 38,934 26,583 32,387 38,934 26,583 32,387 38,934<br />
Iceland 24,822 27,930 29,123 24,822 27,930 29,123 22,850 28,103 29,399<br />
Ireland 32,601 53,677 60,758 32,601 53,677 60,758 32,601 53,677 60,758<br />
Israel 17,646 25,181 36,137 17,646 23,047 33,230 13,995 21,009 31,543<br />
Italy 27,015 32,658 39,762 29,122 35,583 43,666 29,122 36,582 45,653<br />
Liechtenstein … … … … … … … … …<br />
Luxembourg 65,171 95,043 114,988 73,777 101,775 128,181 73,777 101,775 128,181<br />
Malta … … … … … … … … …<br />
Netherlands 36,861 50,621 53,654 38,001 61,704 66,403 38,001 61,704 66,403<br />
Norway 32,629 35,991 40,405 32,629 35,991 40,405 35,991 38,817 42,766<br />
Portugal 30,825 37,542 54,158 30,825 37,542 54,158 30,825 37,542 54,158<br />
Spain 37,137 42,846 51,822 41,518 47,816 58,065 42,325 48,818 59,269<br />
Sweden 28,937 33,374 38,696 29,245 34,481 38,951 30,650 36,429 41,675<br />
Switzerland 45,226 … 70,784 51,240 … 79,603 59,107 … 90,374<br />
United Kingdom, England 30,204 44,145 44,145 30,204 44,145 44,145 30,204 44,145 44,145<br />
United Kingdom, Scotland 30,207 48,188 48,188 30,207 48,188 48,188 30,207 48,188 48,188<br />
United States of America 36,858 45,226 52,137 36,772 45,049 55,259 37,267 48,446 55,199<br />
SOUTH AND WEST ASIA<br />
India … … … … … … … … …<br />
Sri Lanka 3,784 -1 4,169 -1 4,201 -1 3,784 -1 4,169 -1 4,201 -1 3,970 -1 4,419 -1 4,451 -1<br />
181
TABLE<br />
22<br />
REGION<br />
PRIMARY AND SECONDARY EDUCATION / ISCED 1, 2 and 3 / Teachers’ annual salaries p<br />
in public institutions as a percentage of GDP per capita / 2010 (WEI and UOE countries)<br />
Primary (ISCED 1) Lower secondary (ISCED 2)<br />
Upper secondary (ISCED 3),<br />
general programmes<br />
182<br />
Country or territory<br />
ARAB STATES<br />
Starting<br />
salary<br />
Salary after<br />
15 years of<br />
experience<br />
Salary at top<br />
of scale<br />
Starting<br />
salary<br />
Salary after<br />
15 years of<br />
experience<br />
Salary at top<br />
of scale<br />
Starting<br />
salary<br />
Salary after<br />
15 years of<br />
experience<br />
Salary at top<br />
of scale<br />
(1) (2) (3) (4) (5) (6) (7) (8) (9)<br />
Egypt 40.0 -2 64.9 -2 152.6 -2 40.0 -2 64.9 -2 152.6 -2 40.0 -2 64.9 -2 152.6 -2<br />
Jordan 91.9 163.8 337.8 91.9 163.8 337.8 91.9 163.8 337.8<br />
Tunisia 82.2 115.1 … 123.3 156.2 … 123.3 156.2 …<br />
CENTRAL AND EASTERN EUROPE<br />
Bulgaria … … … … … … … … …<br />
Croatia … … … … … … … … …<br />
Czech Republic 61.3 81.4 90.9 60.8 82.5 91.9 63.4 87.5 98.4<br />
Estonia 57.5 60.9 84.0 57.5 60.9 84.0 57.5 60.9 84.0<br />
Hungary 52.1 64.4 85.9 52.1 64.4 85.9 57.2 76.0 111.8<br />
Latvia … … … … … … … … …<br />
Lithuania … … … … … … … … …<br />
Poland 47.9 76.4 79.6 53.9 87.0 90.7 60.9 99.5 103.7<br />
Romania … … … … … … … … …<br />
Russian Federation … … … … … … … … …<br />
Slovakia 47.3 54.4 58.7 47.3 54.4 58.7 47.3 54.5 58.7<br />
Slovenia 99.1 120.5 126.6 99.1 120.5 126.6 99.1 120.5 126.6<br />
The former Yugoslav Rep. of Macedonia … … … … … … … … …<br />
Turkey 147.4 157.8 169.5 147.4 157.8 169.5 151.6 162.0 173.6<br />
EAST ASIA AND THE PACIFIC<br />
Australia 89.6 124.3 124.3 89.9 124.3 124.3 89.9 124.3 124.3<br />
China … … … … … … … … …<br />
Indonesia 40.8 -1 51.6 -1 58.8 -1 43.5 -1 58.8 -1 63.9 -1 50.3 -1 65.1 -1 70.9 -1<br />
Japan 75.5 132.8 167.6 75.5 132.8 167.6 75.5 132.8 172.2<br />
Malaysia 56.1 -2 116.1 -2 198.5 -2 56.1 -2 149.2 -2 208.7 -2 119.1 -2 149.2 -2 216.4 -2<br />
New Zealand 93.9 138.8 138.8 95.2 142.4 142.4 96.6 146.0 146.0<br />
Philippines 154.9 175.7 178.2 154.9 175.7 178.2 154.9 175.7 178.2<br />
Republic of Korea 92.0 159.2 254.8 91.6 158.9 254.4 91.6 158.9 254.4<br />
Thailand 61.6 130.7 221.6 61.6 130.7 221.6 61.6 130.7 221.6<br />
LATIN AMERICA AND THE CARIBBEAN<br />
Argentina 86.0 106.4 129.0 70.1 92.8 112.5 70.1 92.8 112.5<br />
Brazil … … … … … … … … …<br />
Chile 112.9 148.4 195.6 112.9 148.4 195.6 113.7 157.3 207.0<br />
Jamaica 169.7 -1 205.7 -1 205.7 -1 169.7 -1 205.7 -1 205.7 -1 169.7 -1 205.7 -1 205.7 -1<br />
Mexico 98.2 127.9 210.1 126.7 163.8 268.4 … … …<br />
Paraguay 116.0 116.0 116.0 172.6 172.6 172.6 172.2 172.2 172.2<br />
Peru 74.9 74.9 74.9 73.9 73.9 73.9 73.9 73.9 73.9<br />
Uruguay … 4.9 -1 7.2 -1 … 4.9 -1 7.4 -1 … 5.0 -1 7.6 -1<br />
NORTH AMERICA AND WESTERN EUROPE<br />
Austria 77.0 102.0 152.4 80.6 110.4 158.4 81.7 113.5 166.2<br />
Belgium, Flemish community 82.9 117.1 143.4 82.9 117.1 143.4 103.5 150.5 181.4<br />
Belgium, French community 80.3 113.7 139.5 80.3 113.7 139.5 100.3 146.6 177.0<br />
Canada 88.2 140.8 140.8 88.2 140.8 140.8 88.6 141.3 141.3<br />
Cyprus … … … … … … … … …<br />
Denmark 108.0 125.1 125.1 108.0 125.1 125.1 111.1 145.1 145.1<br />
Finland 79.6 102.7 108.9 86.0 110.9 117.6 88.5 117.4 124.4<br />
France 71.3 95.9 141.5 79.7 104.3 150.3 80.4 105.0 151.1<br />
Germany 124.2 149.1 163.7 136.5 165.2 183.4 144.3 178.9 204.4<br />
Greece 93.6 114.0 137.1 93.6 114.0 137.1 93.6 114.0 137.1<br />
Iceland 69.6 78.4 81.7 69.6 78.4 81.7 64.1 78.8 82.5<br />
Ireland 80.6 132.7 150.2 80.6 132.7 150.2 80.6 132.7 150.2<br />
Israel 61.8 88.1 126.5 61.8 80.7 116.3 49.0 73.5 110.4<br />
Italy 84.5 102.2 124.4 91.1 111.4 136.7 91.1 114.5 142.9<br />
Liechtenstein … … … … … … … … …<br />
Luxembourg 75.7 110.4 133.5 85.7 118.2 148.8 85.7 118.2 148.8<br />
Malta … … … … … … … … …<br />
Netherlands 87.4 120.1 127.2 90.1 146.3 157.5 90.1 146.3 157.5<br />
Norway 57.0 62.9 70.6 57.0 62.9 70.6 62.9 67.8 74.7
OPPORTUNITIES LOST: THE IMPACT OF GRADE REPETITION AND EARLY SCHOOL LEAVING<br />
REGION<br />
Primary (ISCED 1) Lower secondary (ISCED 2)<br />
Upper secondary (ISCED 3),<br />
general programmes<br />
Country or territory<br />
Starting<br />
salary<br />
Salary after<br />
15 years of<br />
experience<br />
Salary at top<br />
of scale<br />
Starting<br />
salary<br />
Salary after<br />
15 years of<br />
experience<br />
Salary at top<br />
of scale<br />
Starting<br />
salary<br />
Salary after<br />
15 years of<br />
experience<br />
Salary at top<br />
of scale<br />
(1) (2) (3) (4) (5) (6) (7) (8) (9)<br />
Portugal 121.3 147.7 213.1 121.3 147.7 213.1 121.3 147.7 213.1<br />
Spain 115.2 132.9 160.8 128.8 148.4 180.2 131.3 151.5 183.9<br />
Sweden 74.2 85.5 99.2 74.9 88.4 99.8 78.5 93.3 106.8<br />
Switzerland 97.5 … 152.6 110.5 … 171.6 127.4 … 194.8<br />
United Kingdom, England 84.6 123.7 123.7 84.6 123.7 123.7 84.6 123.7 123.7<br />
United Kingdom, Scotland 84.6 135.0 135.0 84.6 135.0 135.0 84.6 135.0 135.0<br />
United States of America 78.2 95.9 110.6 78.0 95.5 117.2 79.0 102.7 117.1<br />
SOUTH AND WEST ASIA<br />
India … … … … … … … … …<br />
Sri Lanka 74.5 -1 82.1 -1 82.7 -1 74.5 -1 82.1 -1 82.7 -1 78.2 -1 87.0 -1 87.7 -1<br />
183
TABLE<br />
23<br />
TREND DATA / Key indicators / Selected years<br />
Primary education<br />
REGION<br />
Net intake rate (adjusted)<br />
Gross enrolment ratio<br />
Net enrolment rate<br />
(adjusted)<br />
Number of out-of-school children<br />
of primary school age (000)<br />
Survival rate to the<br />
last grade<br />
Country or territory<br />
ARAB STATES<br />
1999 to 2004 to<br />
2000 2005 2010 2000 2005 2010 2000 2005 2010 2000 2005 2010 2000 2005<br />
(1) (2) (3) (4) (5) (6) (7) (8) (9) (10) (11) (12) (13) (14)<br />
Algeria 95 97 99 108 109 110 93 ** 97 ** 97 313 ** 116 ** 82 91 93<br />
Bahrain 97 95 ... 107 108 ... 98 ** 98 ... 1 ** 2 ... 90 98<br />
Djibouti 24 35 43 +1 32 41 59 +1 27 ** 35 45 ** , -1 87 ** 81 56 ** , -1 ... ...<br />
Egypt 88 ** 94 ** 94 ** , -1 98 ** 101 101 93 ** 97 ** 96 ** 606 ** 267 ** 368 ** ... ...<br />
Iraq 88 86 -1 ... 95 102 -1 ... 87 91 -1 ... 482 385 -1 ... 49 ** 67 ** , -1<br />
Jordan 99 93 93 98 105 92 95 99 91 40 6 83 96 95<br />
Kuwait 93 ** 99 99 -2 103 113 ... 96 ** 99 98 -2 6 ** 2 4 -2 94 94 +1<br />
Lebanon 88 ** , -1 82 +1 96 112 ** , -1 99 +1 105 94 ** , -1 88 +1 93 22 ** , -1 58 +1 30 ... ...<br />
Libya ... ... ... 120 ** 109 ... ... ... ... ... ... ... ... ...<br />
Mauritania 29 ** 41 37 84 94 102 61 ** 73 74 ** 164 ** 125 134 ** ... 39<br />
Morocco 63 87 92 +1 92 107 114 +1 76 ** 88 ** 96 +1 942 ** 461 ** 134 +1 75 73<br />
Oman 84 ... 95 -1 91 ... 105 -1 82 ... 98 -1 61 ... 5 -1 92 ...<br />
Palestine 91 77 89 98 88 91 93 84 ** 89 28 71 ** 48 99 97<br />
Qatar 88 ** ... 80 101 110 103 96 ** 97 +1 96 2 ** 2 +1 3 ... 85 +1<br />
Saudi Arabia ... 50 * 63 -1 ... 95 * 106 ... 82 * 90 -1 ... 595 * 318 -1 ... ...<br />
Sudan (pre-secession) a 26 ... ... 48 55 73 -1 43 ** ... ... 3,059 ** ... ... 77 ** ...<br />
Syrian Arab Republic 98 94 99 -1 109 118 118 97 99 99 -1 79 24 19 -1 87 94<br />
Tunisia 99 99 100 -1 115 112 109 -1 96 ** 100 ** 99 -1 43 ** 5 ** 5 -1 87 94<br />
United Arab Emirates 81 96 ... 90 106 ... 81 97 ... 58 7 ... 89 95<br />
Yemen 30 -1 59 57 75 ** 89 87 66 ** , +1 77 78 1,147 ** , +1 853 857 ... 59<br />
CENTRAL AND EASTERN EUROPE<br />
Albania 89 85 -1 66 110 105 -1 87 99 93 ** , -1 80 2 16 ** , -1 52 90 ** 90 -1<br />
Belarus 82 ** , +1 74 -1 ... 110 95 100 94 ** , +1 90 92 28 ** , +1 39 29 99 99 *<br />
Bosnia and Herzegovina ... ... 82 ... ... 112 ... ... 87 ... ... 20 ... ...<br />
Bulgaria 94 90 94 105 102 103 98 94 100 7 17 1 93 92<br />
Croatia 89 99 90 93 99 93 92 99 96 16 2 7 99 99 +1<br />
Czech Republic 78 ** , -1 ... ... 103 97 106 -1 96 ** , -1 ... ... 26 ** , -1 ... ... 98 98<br />
Estonia 97 ... ... 101 102 99 -1 99 97 96 -1 1 2 3 -1 98 99<br />
Hungary 90 91 96 -1 102 98 102 -1 97 97 98 -1 12 15 8 -1 96 98<br />
Latvia 94 ** , -1 ... 91 98 96 101 94 ** , -1 ... 96 9 ** , -1 ... 5 97 98<br />
Lithuania 93 90 91 104 95 96 98 91 96 4 15 5 99 98<br />
Montenegro ... ... ... ... 116 107 ... 98 83 ... 1 6 ... ...<br />
Poland 97 95 97 -1 99 97 97 -1 97 96 96 -1 85 118 94 -1 98 99<br />
Republic of Moldova ... 82 * 89 * 101 * 98 * 94 * 93 * 93 * 90 * 19 * 12 * 15 * 90 ** , +1 91<br />
Romania 88 93 87 97 110 96 93 99 88 89 9 109 96 95<br />
Russian Federation ... 93 +1 89 -1 103 97 99 -1 ... 94 +1 96 -1 ... 310 +1 221 -1 95 ...<br />
Serbia ... 100 * 89 * 106 ** 103 * 96 * ... 100 ** 95 * ... 1 ** 16 * ... ...<br />
Slovakia ... ... 50 99 96 101 ... ... ... ... ... ... 97 97<br />
Slovenia 92 95 95 -1 97 98 98 -1 95 97 97 -1 4 3 3 -1 100 ...<br />
The former Yugoslav Rep. of Macedonia 93 92 94 101 95 90 98 95 98 3 6 2 97 98<br />
Turkey 87 91 85 -1 101 102 102 -1 96 97 97 -1 261 224 162 -1 ... 97<br />
Ukraine ... 71 75 108 108 99 ... 91 91 ... 165 138 97 * 98 * , +1<br />
CENTRAL ASIA<br />
Armenia 86 ** , +1 82 ... 99 95 103 93 ** , +1 88 ... 12 ** , +1 16 ... ... 99<br />
Azerbaijan 85 ** 64 * 69 * 97 * 96 * 94 * 88 ** 84 * 85 ** 85 ** 95 * 78 ** 96 98<br />
Georgia ... ... 97 -2 97 95 109 ... 90 ** 100 -1 ... 34 ** - -1 99 86<br />
Kazakhstan 92 ** 96 99 +1 96 104 111 +1 94 ** 99 100 +1 75 ** 15 4 +1 95 ** , +1 99<br />
Kyrgyzstan 88 91 97 96 99 100 92 ** 95 95 37 ** 20 18 95 * 97<br />
Mongolia 92 85 93 98 96 122 92 91 99 ** 21 24 2 ** 87 91 -1<br />
Tajikistan 90 95 96 97 101 102 96 98 98 28 17 15 96 ** 98 **<br />
Turkmenistan ... ... ... ... ... ... ... ... ... ... ... ... ... ...<br />
Uzbekistan ... ... 90 +1 99 98 95 +1 ... ... 93 +1 ... ... 148 +1 100 ** 99<br />
EAST ASIA AND THE PACIFIC<br />
Australia 66 72 82 101 102 105 95 ** 95 ** 97 102 ** 91 ** 54 ... ...<br />
Brunei Darussalam ... 85 77 114 117 108 ... ... ... ... ... ... ... 97<br />
Cambodia 77 90 +1 90 106 130 127 92 95 +1 96 179 91 +1 73 55 +1 57<br />
China ... ... ... 114 +1 110 +1 111 ... ... ... ... ... ... ... ...<br />
184
OPPORTUNITIES LOST: THE IMPACT OF GRADE REPETITION AND EARLY SCHOOL LEAVING<br />
Survival<br />
rate to the<br />
last grade<br />
Primary education<br />
Gross intake ratio to<br />
the last grade<br />
Effective transition rate from<br />
primary to secondary<br />
(general programmes)<br />
Secondary education<br />
Gross enrolment ratio for<br />
secondary education<br />
(all programmes)<br />
Adult literacy rate s<br />
Public expenditure on<br />
education as a % of GDP<br />
2009 to<br />
1999 to 2004 to 2009 to<br />
2010 2000 2005 2010 2000 2005 2010 2000 2005 2010 1990 2000 2010 2000 2005 2010<br />
(15) (16) (17) (18) (19) (20) (21) (22) (23) (24) (25) (26) (27) (28) (29) (30)<br />
ARAB STATES<br />
95 82 94 96 97 ** 94 96 -1 ... 83 ** 95 -1 50 70 73 ... ... 4.3 -2<br />
... 93 107 ... 100 ** 99 100 -1 99 108 ... 84 87 92 ... 3 +1 2.9 -2<br />
64 ** , -1 28 31 36 ** , -1 64 91 89 ** , -1 14 23 36 +1 ... ... … 10 8 ...<br />
... 94 ** 97 101 93 ** 94 ** , -1 ... 83 ** 85 ** , -1 72 44 56 72 ... 5 3.8 -2<br />
... 56 79 -1 ... 77 ** 72 ** , -1 ... 38 48 -1 ... ... 74 78 ... ... ...<br />
... 94 105 90 99 99 100 ** , -2 84 86 87 ... 90 93 5 -1 ... ...<br />
96 103 115 ... 99 97 100 108 111 ... 74 78 94 7 ** , +1 5 ...<br />
92 -1 102 ** , -1 85 +1 87 98 ** , -1 ... 97 77 ** , -1 84 +1 81 ... ... 90 2 3 1.8 -1<br />
... ... ... ... ... ... ... ... 104 ... 77 86 89 3 -1 ... ...<br />
71 46 +1 44 75 ... 54 ... 18 23 24 ** ... 51 58 3 +1 3 +1 4.3<br />
91 57 80 85 88 86 89 38 50 ** ... 42 52 56 6 5 +1 5.4 -1<br />
... 78 ... 101 -1 100 ... ... 75 ... 100 -1 ... 81 87 3 4 4.3 -1<br />
... 98 93 95 99 99 ** 97 81 92 86 ... 92 95 ... ... ...<br />
94 -2 93 ** , -1 92 ** 100 -1 ... 98 ** 100 -1 88 ... 94 76 89 96 ... 2 ** , -1 2.4 -2<br />
93 * , -2 ... 90 * 93 ... ... 99 ** , -1 ... 90 * 101 71 83 87 6 6 5.6 -2<br />
91 -2 37 ... 58 -1 88 ** ... 98 ** , -1 25 32 39 -1 ... 61 71 ... ... ...<br />
95 93 108 104 71 98 98 45 69 72 ... 81 83 ... 5 +1 ...<br />
95 -1 88 102 91 -1 90 95 94 -1 76 ** 85 90 -1 59 74 78 6 ** 6 6.3 -2<br />
... 86 100 ... 99 99 98 85 91 ... 71 ... 90 1 * 1 ** 1.0 -1<br />
... 56 ** 61 63 91 ** 87 ... 43 ** 46 44 ** 37 55 64 10 ... 5.2 -2<br />
CENTRAL AND EASTERN EUROPE<br />
95 102 98 -1 86 94 ** 99 ** , -1 98 72 79 -1 89 ... 99 96 ... ... ...<br />
100 100 96 103 100 100 * 99 87 95 ... 98 100 100 6 6 4.5 -1<br />
99 ... ... 92 ... ... 84 ... ... 91 ... 97 98 ... ... ...<br />
97 97 99 106 99 +1 98 99 93 89 89 ... 98 98 3 +1 4 4.4 -2<br />
99 93 95 93 100 100 +1 100 85 93 96 97 98 99 ... 4 -1 4.3 -1<br />
100 -1 99 97 101 -1 100 100 100 -1 87 94 90 -1 ... ... … 4 4 4.5 -1<br />
98 -1 92 106 98 -1 100 100 99 -1 94 99 104 -1 100 100 100 5 5 5.7 -2<br />
98 -1 97 94 98 -1 99 100 100 -1 95 97 98 -1 99 99 99 5 5 5.1 -1<br />
95 92 95 92 99 99 99 91 98 95 99 100 100 5 5 +1 5.6 -1<br />
98 97 92 99 100 99 99 98 101 99 98 100 100 6 +1 5 5.7 -1<br />
... ... ... ... ... ... ... ... 89 104 ... ... 98 ... ... ...<br />
98 -1 95 97 95 -1 100 +1 100 99 -1 101 100 97 -1 99 99 100 5 5 5.1 -1<br />
95 98 * 99 * 92 * 100 ** 99 98 -1 82 * 88 * 88 * 96 97 99 4 7 9.1<br />
97 95 106 92 99 +1 100 99 82 84 97 97 97 98 3 3 ...<br />
96 -1 91 ... 98 -1 100 ... 100 -1 92 -1 83 89 -1 98 99 100 3 4 4.1 -2<br />
… ... ... 96 * ... ... 98 90 ** 89 * 91 * ... 96 98 ... ... 5.0 -1<br />
98 94 90 99 99 +1 100 99 85 91 90 ... ... … 4 4 4.1 -1<br />
100 -1 96 112 -1 95 -1 97 ... 99 -1 101 96 97 -1 100 100 100 6 +1 6 5.7 -1<br />
... 100 95 92 -1 99 100 99 -1 84 84 84 94 96 97 ... ... ...<br />
92 -1 ... 99 99 -1 ... 98 98 -1 71 82 78 -1 79 87 91 3 3 +1 ...<br />
98 91 117 98 100 * 100 * , +1 100 * 99 92 96 ... 99 100 4 6 ...<br />
CENTRAL ASIA<br />
... ... 92 ... ... 100 ... 90 88 92 99 99 100 3 3 3.2<br />
96 90 * 93 * 90 * 98 99 99 75 * 84 * 85 * ... 99 100 4 3 3.2 -1<br />
96 98 85 116 99 98 100 79 82 86 -1 ... 100 100 2 2 3.2 * , -1<br />
100 +1 93 ** 106 116 +1 99 ** , +1 100 100 +1 94 95 100 +1 98 100 100 3 2 3.1 -1<br />
98 93 98 97 99 * 99 99 84 87 84 * ... 99 99 4 5 6.2 -1<br />
94 86 96 109 95 97 +1 ... 65 89 89 ... 98 97 6 4 -1 5.4<br />
99 93 103 104 98 ** 98 99 74 82 87 98 99 100 2 4 4.0<br />
... ... ... ... ... ... ... ... ... ... ... 99 100 ... ... ...<br />
98 +1 95 97 93 +1 100 100 99 +1 88 101 106 +1 ... 99 99 ... ... ...<br />
EAST ASIA AND THE PACIFIC<br />
... ... ... ... ... ... ... 162 128 131 ... ... … 5 5 5.1 -1<br />
96 120 114 118 ... 97 100 89 100 110 88 93 95 4 ... 2.0<br />
54 -2 52 +1 86 87 79 +1 84 83 17 35 ** 46 ** ... 74 74 2 2 -1 2.6<br />
... ... ... ... ... ... ... 62 73 +1 81 78 91 94 2 -1 ... ...<br />
185
TABLE<br />
23<br />
TREND DATA / Key indicators / Selected years<br />
Primary education<br />
REGION<br />
Net intake rate (adjusted)<br />
Gross enrolment ratio<br />
Net enrolment rate<br />
(adjusted)<br />
Number of out-of-school children<br />
of primary school age (000)<br />
Survival rate to the<br />
last grade<br />
186<br />
Country or territory<br />
1999 to 2004 to<br />
2000 2005 2010 2000 2005 2010 2000 2005 2010 2000 2005 2010 2000 2005<br />
(1) (2) (3) (4) (5) (6) (7) (8) (9) (10) (11) (12) (13) (14)<br />
China, Hong Kong SAR 92 * , +1 89 * 96 * , -1 98 99 102 93 * , +1 96 * 98 * 35 * , +1 18 * 5 * ... 99<br />
China, Macao SAR 68 73 … 103 104 94 86 89 83 6 4 5 ... ...<br />
Cook Islands 96 ** ... 96 * 105 * 112 * 111 * , +1 94 ** ... 98 * 0.1 ** ... — * ... ...<br />
Democratic People’s Rep. of Korea ... ... ... ... ... ... ... ... ... ... ... ... ... ...<br />
Fiji 89 ** 94 +1 90 -1 101 113 +1 105 -1 95 ** 99 +1 99 -1 6 ** 1 +1 1 -1 82 93 -1<br />
Indonesia 97 ** 98 ** 98 106 ** 112 118 94 ** 95 ** 99 1,599 ** 1,277 ** 236 ... 83 **<br />
Japan 100 100 100 101 102 103 100 100 100 3 2 2 ... ...<br />
Kiribati 97 ... ... 109 115 113 -1 99 ... ... 0.1 ... ... ... 79 -1<br />
Lao People’s Democratic Republic 69 76 96 110 114 126 78 83 97 166 135 23 55 63<br />
Malaysia 100 90 ... 98 96 ... 98 96 ... 67 137 ... ... 89 +1<br />
Marshall Islands ... ... 99 +1 96 ** 116 102 +1 ... ... 99 +1 ... ... 0.1 +1 ... ...<br />
Micronesia (Federated States of) ... ... ... ... 112 ... ... ... ... ... ... ... ... ...<br />
Myanmar ... ... ... 105 112 126 ... ... ... ... ... ... 55 +1 69 -1<br />
Nauru ... ... ... 99 * 125 * 93 * , -2 ... ... ... ... ... ... ... ...<br />
New Zealand 94 97 97 99 100 101 99 ** 99 ** 99 4 ** 3 ** 2 ... ...<br />
Niue ... ... ... 118 * 112 * ... 99 * , -1 ... ... — * , -1 ... ... ... ...<br />
Palau 96 ** ... ... 113 * 103 * , -1 ... 96 ** ... ... 0.1 ** ... ... ... ...<br />
Papua New Guinea ... ... ... 71 58 60 -2 ... ... ... ... ... ... ... ...<br />
Philippines 49 +1 49 52 -1 110 107 106 -1 91 +1 90 89 -1 1,101 +1 1,243 1,460 -1 70 -1 72<br />
Republic of Korea 94 94 96 102 102 106 100 99 99 ** 10 25 35 ** 99 98<br />
Samoa 78 +1 86 ** , -1 81 99 108 -1 108 92 ... 95 2 ... 1 90 * ...<br />
Singapore ... ... ... ... ... ... ... ... ... ... ... ... ... ...<br />
Solomon Islands ... 36 ... 87 103 ... ... 77 ** ... ... 17 ** ... ... ...<br />
Thailand ... 81 +1 … 97 98 91 -1 ... 94 +1 90 -1 ... 387 +1 611 -1 ... ...<br />
Timor-Leste ... 53 ** 77 125 +1 97 117 ... 67 ** 86 ... 61 ** 28 ... ...<br />
Tokelau ... ... ... 105 * ... ... ... ... ... ... ... ... ... ...<br />
Tonga 95 +1 50 ... 109 112 ... 99 ** , +1 99 ... 0.1 ** , +1 0.2 ... ... 90 +1<br />
Tuvalu ... ... ... 105 * 100 * ... ... ... ... ... ... ... ... ...<br />
Vanuatu 67 ** 71 ... 120 118 117 99 ** 99 ... 0.2 ** 0.4 ... 69 ...<br />
Viet Nam 94 88 ... 108 99 106 97 ** 92 98 281 ** 660 121 83 92 ** , +1<br />
LATIN AMERICA AND THE CARIBBEAN<br />
Anguilla ... ... 88 ** , -2 111 ** 91 ** ... 99 ** , +1 92 ** 93 ** , -2 — ** , +1 0.1 ** 0.1 ** , -2 ... ...<br />
Antigua and Barbuda ... ... 72 124 ... 102 ... ... 88 ... ... 1 ... ...<br />
Argentina 99 98 98 -2 114 113 118 -1 99 -1 99 ... 24 -1 36 ... 89 87<br />
Aruba 98 95 97 111 111 114 99 97 100 0.1 0.2 — 96 94<br />
Bahamas 77 ** 80 80 94 ** 106 114 87 ** 96 98 4 ** 1 1 ... 81 +1<br />
Barbados 75 82 -1 ... 102 97 120 * 95 91 95 * , -2 1 2 1 * , -2 91 96 -1<br />
Belize 82 94 +1 98 108 114 121 90 ** 95 ** 97 4 ** 2 ** 1 74 91 +1<br />
Bermuda ... 97 88 101 +1 99 92 ... 98 ** 95 ** ... 0.1 ** 0.2 ** ... 89<br />
Bolivia (Plurinational State of) 75 78 +1 ... 115 109 +1 105 -1 96 ** 97 +1 ... 49 ** 47 +1 ... 80 82 ** , -1<br />
Brazil 80 83 ... 151 137 ... 92 96 ... 1,011 595 ... 80 ** , +1 76<br />
British Virgin Islands ... 78 ** , -1 78 * 110 * 111 * 100 * 98 ** 98 ** 90 * 0.1 ** 0.1 ** 0.3 * ... ...<br />
Cayman Islands 88 72 ... 111 83 90 -2 96 78 ... 0.1 1 ... ... ...<br />
Chile ... ... 84 -1 100 104 106 -1 ... ... 94 -1 ... ... 94 -1 98 97 -1<br />
Colombia 81 ** 82 78 119 120 115 97 ** 96 ** 92 139 ** 162 ** 374 67 81<br />
Costa Rica ... ... ... 110 112 110 ... ... ... ... ... ... 89 84<br />
Cuba 93 100 94 +1 101 99 101 +1 98 95 98 +1 19 43 13 +1 95 97<br />
Dominica 95 97 ... 120 100 112 98 96 ** 98 -1 0.2 0.4 ** 0.1 -1 ... 81 -1<br />
Dominican Republic 65 68 81 114 106 108 85 84 93 181 189 85 71 ...<br />
Ecuador 98 94 89 -1 116 117 114 -1 100 99 98 -1 8 11 27 -1 75 76 **<br />
El Salvador 73 +1 77 70 105 113 114 86 +1 95 ** 95 128 +1 45 ** 38 62 ** 66 **<br />
Grenada 54 ** 90 ** 93 -1 91 108 ** 103 83 ** 99 ** 97 -1 3 ** 0.1 ** 0.3 -1 ... ...<br />
Guatemala 80 88 90 104 113 116 87 ** 95 ** 99 245 ** 101 ** 32 50 +1 63<br />
Guyana ... ... 80 105 105 85 ... ... 84 ... ... 19 65 +1 ...<br />
Haiti ... ... ... ... ... ... ... ... ... ... ... ... ... ...<br />
Honduras 88 64 70 107 113 116 89 92 ** 96 ** 115 85 ** 47 ** ... 54<br />
Jamaica 87 76 ** 79 97 93 89 94 ** 89 ** 82 21 ** 39 ** 59 ... ...<br />
Mexico 98 99 99 110 110 114 99 ** 100 100 74 ** 59 58 87 92
OPPORTUNITIES LOST: THE IMPACT OF GRADE REPETITION AND EARLY SCHOOL LEAVING<br />
Survival<br />
rate to the<br />
last grade<br />
Primary education<br />
Gross intake ratio to<br />
the last grade<br />
Effective transition rate from<br />
primary to secondary<br />
(general programmes)<br />
Secondary education<br />
Gross enrolment ratio for<br />
secondary education<br />
(all programmes)<br />
Adult literacy rate s<br />
Public expenditure on<br />
education as a % of GDP<br />
2009 to<br />
1999 to 2004 to 2009 to<br />
2010 2000 2005 2010 2000 2005 2010 2000 2005 2010 1990 2000 2010 2000 2005 2010<br />
(15) (16) (17) (18) (19) (20) (21) (22) (23) (24) (25) (26) (27) (28) (29) (30)<br />
100 -2 97 +1 99 96 * , -1 ... 100 100 * , -1 77 +1 82 83 ... ... … 4 +1 4 3.6<br />
98 -1 99 96 97 92 96 100 83 96 92 ... 91 93 4 2 2.6 -1<br />
... 88 * , -1 ... 110 * , +1 91 -1 ... 99 +1 77 * 80 * 82 * , +1 ... ... … ... ... ...<br />
... ... ... ... ... ... ... ... ... ... ... ... 100 ... ... ...<br />
91 -1 95 111 +1 105 -1 100 99 -1 96 -1 78 91 +1 86 -1 ... ... … 6 5 4.5 -1<br />
80 -2 93 +1 96 ** 105 -1 ... 79 ** 92 -1 53 ** 61 77 82 90 93 2 ** , +1 3 ** 3.0<br />
100 ... ... 102 ... ... ... 102 101 102 ... ... … 4 4 3.8<br />
... 99 117 112 -2 ... ... ... 64 88 86 -2 ... … … 11 ... ...<br />
67 -2 69 72 87 76 82 82 -2 35 45 47 ... 69 73 2 2 3.3<br />
98 -1 95 -1 99 ... 99 100 ** 100 -1 66 70 68 -1 83 89 93 6 5 +1 5.8 -1<br />
83 -1 93 -1 110 97 +1 ... ... 91 -1 68 -1 76 99 -1 ... ... … 15 ** 12 ** , -1 ...<br />
... ... ... ... ... ... ... ... 83 ... ... ... … 7 ** ... ...<br />
75 81 95 +1 104 68 74 ** , +1 77 40 47 54 ... 90 92 1 ... ...<br />
... 87 * , +1 ... ... ... ... ... 47 * 47 * 63 * , -2 ... ... … ... ... ...<br />
... ... ... ... ... ... ... 111 120 119 ... ... … 7 +1 6 7.2<br />
... 105 * , +1 115 * , -1 ... 91 -1 ... ... 97 ** 105 * ... ... ... … ... ... ...<br />
... 99 * 104 * , -1 ... ... ... ... 86 * 94 ** ... ... ... … 10 ** ... ...<br />
... 55 ... ... ... ... ... ... ... ... ... 57 61 ... ... ...<br />
76 -1 101 +1 94 92 -1 97 -1 92 99 -1 75 +1 84 85 -1 94 93 95 3 2 2.7 -1<br />
99 104 99 101 100 99 100 -1 99 98 97 ... ... … 4 +1 4 5.0 -1<br />
... 94 100 ** , -1 101 93 * 97 ** , -1 100 78 84 ** 85 98 99 99 4 ... 5.3 -2<br />
99 -1 ... ... ... ... ... 91 -1 ... ... ... 89 93 96 3 ... 3.3<br />
... ... ... ... ... ... ... 21 31 ... ... 77 … 2 ** , -1 ... 6.1 -2<br />
... 88 ** , -1 ... ... ... ... ... 62 +1 71 79 +1 ... 93 94 5 4 3.8<br />
67 ... ... 65 ... ... 90 34 ** , +1 55 56 ... 38 58 ... ... 14.0<br />
... 108 * ... ... 92 +1 ... ... 92 * ... ... ... ... … ... ... ...<br />
... 107 +1 109 ... 99 +1 94 +1 ... 106 101 +1 ... ... 99 99 5 4 -1 ...<br />
... 110 ** 106 * ... 61 ** , +1 ... ... 80 * , +1 ... ... ... ... … ... ... ...<br />
71 -1 92 91 -1 83 53 ** 59 ** , -1 89 35 42 -1 55 68 78 83 7 ... 5.2 -1<br />
... 98 93 ... 93 ** 93 ** , +1 ... 64 77 77 88 90 93 ... ... 5.3 -2<br />
LATIN AMERICA AND THE CARIBBEAN<br />
... 92 ** 78 ** 79 ** , -2 100 ** 98 95 107 ** 87 ** ... ... ... … ... ... 3.5 -2<br />
... ... ... 100 ... ... 90 79 ... 105 ... 99 99 3 -1 ... 2.5 -1<br />
94 -1 99 98 106 -1 ... ... 99 -1 87 85 89 -1 96 97 98 5 ** 5 +1 6.0 -1<br />
91 -1 98 88 91 100 99 99 -1 97 95 90 ... 97 97 5 ... 5.9 -1<br />
89 82 -1 102 97 ... 98 ** 99 82 ** 90 96 ... ... … 3 ** ... ...<br />
... 99 91 101 * 99 99 99 * , -1 105 107 101 * ... ... … 6 7 6.7 -1<br />
90 94 94 105 94 98 96 65 75 -1 ... 70 ... … 5 5 -1 6.1 -1<br />
... 97 +1 95 100 ... 98 ... 79 +1 81 79 ... ... … ... 2 2.6<br />
84 -2 99 102 +1 99 -2 93 93 ** , -1 96 -2 80 ** 82 +1 80 -1 80 87 91 5 6 +1 ...<br />
... 108 106 ... 98 +1 96 ... 104 106 ... ... 89 90 4 5 5.7 -1<br />
... 108 ** 99 * 99 * 97 ** 94 86 98 ** 104 * 102 * ... ... … ... ... 4.3<br />
... 109 87 86 -2 99 * 99 97 -2 103 83 83 -2 ... ... 99 ... ... ...<br />
... 98 95 -1 ... 99 99 -1 93 ** , -2 83 91 88 -1 94 96 99 4 3 4.5 -1<br />
85 95 104 114 95 100 98 72 83 96 81 93 93 3 4 4.8<br />
89 87 94 96 85 97 92 61 81 100 ... 95 96 4 5 +1 6.3 -1<br />
95 +1 96 92 99 +1 97 99 99 +1 83 91 90 +1 ... 100 100 8 11 12.9<br />
88 119 ** 102 84 98 ** 99 98 105 108 98 ... ... … 5 ** , -1 ... 3.6<br />
... 78 84 +1 92 91 92 ** , -1 91 59 70 76 ... 87 90 2 ** ... ...<br />
... 99 106 ... 69 * 79 ** ... 57 64 75 ** , -2 88 91 92 1 ... ...<br />
86 83 ** 85 96 90 ** 96 ** 98 54 62 65 74 80 84 3 3 3.2<br />
... 71 ** 115 ** 112 ** ... ... 88 -1 ... 107 * 108 ... ... … ... ... ...<br />
65 -2 58 74 84 96 93 ** 93 -2 38 51 59 64 69 75 ... 3 +1 3.2 -2<br />
83 -1 103 105 83 69 ... 95 98 +1 94 91 ... ... … 8 ** 8 3.7<br />
... ... ... ... ... ... ... ... ... ... ... 59 49 ... ... ...<br />
76 -2 ... 82 99 ... 75 ... ... ... 73 ... 80 85 ... ... ...<br />
95 88 86 ** 73 98 +1 99 ** 99 87 93 93 ... 80 87 5 5 6.1<br />
94 99 100 105 91 +1 94 95 73 82 89 88 91 93 5 5 5.3 -1<br />
187
TABLE<br />
23<br />
TREND DATA / Key indicators / Selected years<br />
Primary education<br />
REGION<br />
Net intake rate (adjusted)<br />
Gross enrolment ratio<br />
Net enrolment rate<br />
(adjusted)<br />
Number of out-of-school children<br />
of primary school age (000)<br />
Survival rate to the<br />
last grade<br />
188<br />
Country or territory<br />
1999 to 2004 to<br />
2000 2005 2010 2000 2005 2010 2000 2005 2010 2000 2005 2010 2000 2005<br />
(1) (2) (3) (4) (5) (6) (7) (8) (9) (10) (11) (12) (13) (14)<br />
Montserrat 49 ** , +1 89 * ... 116 116 * ... 99 ** , +1 98 * ... — ** , +1 — * ... ... ...<br />
Netherlands Antilles a ... ... ... 133 ... ... ... ... ... ... ... ... 82 ** ...<br />
Nicaragua 85 92 74 102 113 118 83 95 94 139 46 48 46 51<br />
Panama 92 90 87 109 111 108 99 ** 99 99 5 ** 4 5 90 82<br />
Paraguay 80 75 73 -1 120 ** 111 100 -1 98 95 86 -1 17 41 123 -1 73 ** 84<br />
Peru 100 93 96 123 115 108 100 100 98 1 14 66 83 ...<br />
Puerto Rico ... ... 80 ... ... 93 ... ... 86 ** ... ... 46 ** ... ...<br />
Saint Kitts and Nevis ... 86 ** 75 111 100 93 98 +1 97 ** 86 * 0.1 +1 0.2 ** 1 * ... ...<br />
Saint Lucia 90 ** 85 85 103 102 94 97 ** 92 90 ** 1 ** 2 2 ** ... 94<br />
Saint Vincent and the Grenadines 96 ** 96 96 118 118 105 98 ** 98 98 0.3 ** 0.3 0.2 ... ...<br />
Suriname ... 91 90 -1 118 +1 114 113 -1 92 ** , +1 91 ** 91 ** , -1 4 ** , +1 5 ** 6 ** , -1 ... ...<br />
Trinidad and Tobago 90 83 * 88 100 97 * 105 93 ** 91 * 97 11 ** 12 * 3 ... 83 *<br />
Turks and Caicos Islands ... 74 ** , -1 ... ... 90 ** ... ... 81 ** ... ... 0.5 ** ... ... ...<br />
Uruguay ... 77 83 -1 109 114 113 -1 ... 98 ** 99 -1 ... 8 ** 2 -1 87 +1 94<br />
Venezuela (Bolivarian Republic of) 79 71 90 101 105 103 89 93 95 352 236 171 88 89<br />
NORTH AMERICA AND WESTERN EUROPE<br />
Andorra ... 46 39 ... 86 84 ... 82 79 ... 1 1 ... ...<br />
Austria ... ... ... 104 102 99 ... ... ... ... ... ... 97 -1 97<br />
Belgium 95 94 93 -1 109 105 105 -1 99 ** 99 99 -1 6 ** 7 7 -1 ... 94 +1<br />
Canada 98 ... ... 100 97 99 -2 100 ... ... 5 ... ... 99 ...<br />
Cyprus 98 * 97 * 95 * 97 * 101 * 106 * 98 * 100 * 99 * 1 * 0.2 * 0.5 * 95 98<br />
Denmark 90 83 82 -1 101 99 99 -1 98 96 96 -1 7 17 17 -1 100 91<br />
Finland 99 94 95 101 99 99 100 98 98 1 10 8 99 99<br />
France 97 98 98 105 110 110 100 99 99 12 26 31 98 ...<br />
Germany 96 ** 97 ** 96 ** 105 104 102 100 ** 100 ** 100 ** 4 ** 6 ** 7 ** 99 99<br />
Gibraltar ... ... ... ... ... ... ... ... ... ... ... ... ... ...<br />
Greece 95 97 ... 96 101 ... 98 99 ... 15 5 ... ... 98<br />
Holy See . . . . . . . . . . . . . .<br />
Iceland 98 97 97 -1 102 98 99 -1 99 98 99 -1 0.3 1 0.2 -1 98 -1 98<br />
Ireland 97 99 100 102 103 108 100 100 100 1 1 1 ... ...<br />
Israel 89 86 82 -1 106 104 103 -1 98 98 97 -1 14 17 23 -1 ... 99<br />
Italy 98 98 97 103 101 102 100 99 99 7 19 25 ... 100<br />
Liechtenstein ... 98 * , +1 98 * ... 108 * , +1 105 * ... 99 ** , +1 99 * ... — ** , +1 — * ... ...<br />
Luxembourg 94 93 92 -2 100 101 100 -2 97 98 97 -2 1 1 1 -2 ... ...<br />
Malta 71 71 73 101 99 101 94 90 94 2 3 2 98 +1 ...<br />
Monaco ... ... ... ... ... ... ... ... ... ... ... ... ... ...<br />
Netherlands 98 99 98 109 106 108 99 98 100 7 26 0.3 98 ...<br />
Norway 98 97 99 101 99 99 100 99 99 1 6 4 100 100<br />
Portugal 96 97 96 -1 122 115 114 -1 97 99 99 -1 20 5 4 -1 ... ...<br />
San Marino ... ... 89 ** ... ... 94 ** ... ... 92 * , -1 ... ... 0.1 * , -1 ... ...<br />
Spain 100 99 98 106 103 106 100 100 100 1 8 6 ... 99 +1<br />
Sweden 97 92 98 110 96 101 99 96 99 4 30 4 98 99<br />
Switzerland 97 97 99 106 102 103 99 98 99 4 10 4 ... ...<br />
United Kingdom 100 100 99 -1 101 106 106 -1 100 100 100 -1 2 1 8 -1 ... ...<br />
United States of America 85 80 80 102 101 102 97 95 96 730 1,157 1,023 ... ...<br />
SOUTH AND WEST ASIA<br />
Afghanistan ... ... ... 19 90 97 ... ... ... ... ... ... ... ...<br />
Bangladesh ... ... ... ... ... ... ... ... ... ... ... ... ... ...<br />
Bhutan 27 40 64 +1 77 96 111 +1 59 74 ** 89 +1 46 27 ** 11 +1 82 84 +1<br />
India 93 * 99 ... 94 112 116 -2 83 ** 94 ** 98 ** , -2 20,008 ** 6,854 ** 2,278 ** , -2 62 66 +1<br />
Iran (Islamic Republic of) 46 99 ** ... 101 101 114 86 ** 97 ** ... 1,182 ** 206 ** ... 97 +1 ...<br />
Maldives 94 85 +1 78 -1 131 121 109 +1 99 ** 98 97 +1 1 ** 1 1 +1 ... ...<br />
Nepal 64 ** ... ... 118 ... ... 71 ** ... ... 927 ** ... ... 59 62 **<br />
Pakistan 66 ** , +1 69 * , +1 80 * 70 * 84 95 58 ** , +1 65 ** 74 * 8,399 ** , +1 7,158 ** 5,125 * ... 70<br />
Sri Lanka 96 +1 99 ** 89 108 +1 104 ** 99 100 +1 100 ** 94 3 +1 2 ** 102 ... 93 ** , +1<br />
SUB-SAHARAN AFRICA<br />
Angola ... ... 69 * ... ... 124 ... ... 86 ** ... ... 493 ** ... ...<br />
Benin ... 74 97 86 105 126 ... 88 ** 94 ... 150 ** 88 76 +1 64 -1
OPPORTUNITIES LOST: THE IMPACT OF GRADE REPETITION AND EARLY SCHOOL LEAVING<br />
Survival<br />
rate to the<br />
last grade<br />
Primary education<br />
Gross intake ratio to<br />
the last grade<br />
Effective transition rate from<br />
primary to secondary<br />
(general programmes)<br />
Secondary education<br />
Gross enrolment ratio for<br />
secondary education<br />
(all programmes)<br />
Adult literacy rate s<br />
Public expenditure on<br />
education as a % of GDP<br />
2009 to<br />
1999 to 2004 to 2009 to<br />
2010 2000 2005 2010 2000 2005 2010 2000 2005 2010 1990 2000 2010 2000 2005 2010<br />
(15) (16) (17) (18) (19) (20) (21) (22) (23) (24) (25) (26) (27) (28) (29) (30)<br />
... 105 ** 111 * ... 96 100 ... 144 116 * ... ... ... … ... ... 5.8 -1<br />
... 108 ** ... ... ... ... ... 84 ... ... 95 ... 96 ... ... ...<br />
48 -2 66 75 81 99 97 97 -2 53 67 69 ... 77 78 4 ... ...<br />
94 94 96 97 62 ** 65 99 67 70 74 89 92 94 5 4 ** , -1 3.8 -2<br />
78 -1 92 ** 95 94 -1 95 ** 90 90 -1 61 67 67 -1 90 ... 94 5 4 -1 ...<br />
90 103 102 +1 100 97 ... 97 86 85 91 87 88 90 3 +1 3 2.7<br />
... ... ... ... ... ... ... ... ... … 90 91 90 ... ... ...<br />
74 101 109 89 91 +1 100 ** 97 * 97 87 ** 97 ... ... … 5 4 ...<br />
92 95 ** 99 90 71 ** 73 ** 97 73 78 96 ... ... … 7 ** 5 4.4 *<br />
... 90 ** , +1 102 ** 94 ... 99 96 82 ** 89 107 ... ... … 8 6 4.9<br />
90 -1 98 ** , +1 84 86 -1 ... ... 56 -1 73 +1 70 75 -1 ... 90 95 ... ... ...<br />
89 * 87 90 * 91 92 96 * 94 * 76 ** 80 * , -1 90 ** , -2 97 98 99 4 ** ... ...<br />
... ... 92 ** ... 67 92 ... ... 86 ** ... ... ... … ... ... ...<br />
95 -1 97 96 106 -1 87 82 82 -1 98 101 90 -1 95 97 98 2 3 ...<br />
92 83 92 94 96 100 98 60 74 83 90 93 96 ... 4 +1 ...<br />
NORTH AMERICA AND WESTERN EUROPE<br />
... ... 101 -1 ... ... ... ... ... 90 87 ... ... … ... 2 2.9<br />
97 101 -1 99 98 94 -1 100 100 98 100 99 ... ... … 6 5 5.5 -2<br />
93 -1 ... 90 +1 90 -1 ... 99 +1 99 -1 145 112 111 -1 ... ... … 6 +1 6 6.4 -2<br />
... 98 96 +1 ... ... ... ... 102 101 101 -2 ... ... … 6 5 4.8 -2<br />
95 -2 98 * 100 * 103 * 100 100 100 93 * 97 * 99 * 94 97 98 5 7 7.9 -1<br />
99 -1 100 100 97 -1 100 100 100 -1 127 124 117 -1 ... ... … 8 8 8.7 -1<br />
100 96 100 98 100 100 100 125 112 108 ... ... … 6 6 6.8 -1<br />
... 97 ... ... ... ... ... 108 113 113 ... ... … 6 6 5.9 -1<br />
96 102 99 101 100 100 99 98 101 103 ... ... … ... 4 +1 4.6 -2<br />
... ... ... ... ... ... ... ... ... ... ... ... … ... ... ...<br />
... ... 100 ... ... 99 ... 89 102 ... 93 96 97 3 4 ...<br />
. . . . . . . . . . ... ... … . . .<br />
... 98 100 99 -1 100 99 100 -1 107 109 107 -1 ... ... … 7 8 7.8 -1<br />
... 95 95 103 ... ... ... 105 111 121 ... ... … 4 5 5.7 -2<br />
99 -1 ... 104 103 -1 ... 100 100 -1 103 105 102 -1 ... ... … 6 6 5.8 -1<br />
100 102 98 103 97 100 100 93 99 100 ... 98 99 4 4 4.7 -1<br />
... ... 102 * , +1 111 * ... 99 98 ... 68 * , +1 69 * ... ... … ... 2 +1 2.1 -2<br />
... ... ... ... ... ... ... 97 95 98 -2 ... ... … 4 +1 ... ...<br />
... 100 95 97 98 99 98 85 98 101 88 88 92 ... 5 -1 5.8 -2<br />
... ... ... ... ... ... ... ... ... ... ... ... … 1 1 -1 1.2 -1<br />
... 98 ... ... ... ... ... 123 119 121 ... ... … 5 5 5.9 -1<br />
99 98 100 99 100 100 100 116 114 111 ... ... … 7 7 7.3 -1<br />
... ... ... ... ... ... ... 105 97 107 -1 88 ... 95 5 5 5.8 -1<br />
... ... ... 101 ** ... ... 100 ... ... 97 ** ... ... … ... ... ...<br />
99 -1 ... 98 +1 103 ... ... 99 111 119 125 96 ... 98 4 4 5.0 -1<br />
99 100 100 97 100 100 100 152 104 99 ... ... … 7 7 7.3 -1<br />
... 96 97 96 100 100 100 95 95 95 ... ... … 5 6 5.4 -2<br />
... ... ... ... ... ... ... 102 105 102 -1 ... ... … 5 5 5.6 -1<br />
... 99 ** 99 ** 104 ** ... ... ... 93 97 96 ... ... … 6 +1 5 5.4 -1<br />
SOUTH AND WEST ASIA<br />
... ... 34 ... ... ... ... 11 +1 17 46 ... ... … ... ... ...<br />
66 * ... ... ... ... ... 94 * 48 46 51 35 47 57 2 2 +1 2.2 -1<br />
91 +1 51 65 95 +1 93 97 +1 100 +1 41 45 70 +1 ... ... 53 6 7 4.0<br />
... 71 86 96 -2 93 89 85 -2 45 54 63 48 61 63 4 3 ...<br />
94 -1 93 106 104 -1 92 +1 91 97 -1 80 76 91 66 77 85 4 5 4.7<br />
... ... 140 118 +1 ... 92 96 -1 53 71 ** , -1 ... 96 96 98 ... 6 8.7 -1<br />
62 -2 66 ... ... 80 86 ** , -1 88 -2 35 46 ... 33 49 60 3 ** 3 4.7<br />
62 ... 61 67 ... 72 77 ... 29 ** 34 ... 43 55 2 2 2.4<br />
... 107 +1 105 ** 101 ... 98 ** 97 ... 87 ** , -1 ... ... 91 91 ... ... 2.1 -1<br />
SUB-SAHARAN AFRICA<br />
32 * ... ... 47 * ... ... 41 -1 15 16 ** , +1 31 ... 67 70 3 3 3.4<br />
... 40 ** 54 -1 63 ** , -1 99 ** , +1 ... ... 23 37 ** ... 27 35 42 3 4 4.5 -1<br />
189
TABLE<br />
23<br />
TREND DATA / Key indicators / Selected years<br />
Primary education<br />
REGION<br />
Net intake rate (adjusted)<br />
Gross enrolment ratio<br />
Net enrolment rate<br />
(adjusted)<br />
Number of out-of-school children<br />
of primary school age (000)<br />
Survival rate to the<br />
last grade<br />
Country or territory<br />
1999 to 2004 to<br />
2000 2005 2010 2000 2005 2010 2000 2005 2010 2000 2005 2010 2000 2005<br />
(1) (2) (3) (4) (5) (6) (7) (8) (9) (10) (11) (12) (13) (14)<br />
Botswana 25 32 47 -1 104 107 110 -1 81 85 87 ** , -1 59 47 38 ** , -1 82 84 **<br />
Burkina Faso 35 59 29 +1 42 55 79 +1 35 44 63 +1 1,320 1,291 1,022 +1 61 69<br />
Burundi 39 56 ... 63 88 156 45 ** 63 ** ... 619 ** 434 ** ... 54 +1 63<br />
Cameroon ... ... 92 -1 87 109 120 ... ... 94 ** ... ... 179 ** ... ...<br />
Cape Verde 74 82 92 124 116 110 99 ** 97 93 0.5 ** 2 4 ... 88 +1<br />
Central African Republic ... 36 52 +1 78 * , +1 66 94 +1 ... 49 69 +1 ... 318 214 +1 ... ...<br />
Chad 36 ... ... 68 79 93 55 ... ... 613 ... ... 48 26<br />
Comoros 32 * ... ... 112 113 ** 104 -2 73 * ... ... 22 * ... ... ... 74 **<br />
Congo ... 58 79 * 87 111 115 ... 53 91 * ... 253 56 * ... ...<br />
Côte d’Ivoire 55 ... 45 -1 74 74 +1 88 +1 57 ** ... 61 -1 1,129 ** ... 1,161 -1 63 ...<br />
Democratic Republic of the Congo 28 -1 ... ... 48 -1 ... 94 33 ** , -1 ... ... 5,598 ** , -1 ... ... ... ...<br />
Equatorial Guinea 83 ** ... 45 108 100 87 72 ** ... 56 19 ** ... 43 ... ...<br />
Eritrea 26 41 32 57 67 45 38 50 35 321 284 418 94 79<br />
Ethiopia 26 61 82 55 81 102 40 63 82 6,343 4,613 2,390 51 62<br />
Gabon ... ... ... 136 ** 132 ** , -1 182 +1 ... ... ... ... ... ... ... ...<br />
Gambia 55 53 57 84 86 83 68 69 69 ** 66 74 85 ** 66 ** 63<br />
Ghana 43 40 46 -1 85 90 107 +1 65 ** 67 ** 84 +1 1,052 ** 1,058 ** 567 +1 59 +1 ...<br />
Guinea 34 49 71 60 85 94 47 ** 69 77 704 ** 440 355 ... 71<br />
Guinea-Bissau 40 ... 57 79 120 123 51 ** ... 75 93 ** ... 57 ... ...<br />
Kenya 35 39 40 ** , -1 95 107 113 -1 66 ** 76 84 ** , -1 1,814 ** 1,361 1,010 ** , -1 ... 73 * , -1<br />
Lesotho 61 52 64 111 111 103 76 73 74 88 101 99 59 61<br />
Liberia 14 -1 ... ... 112 ... 96 -2 46 ** , -1 ... ... 226 ** , -1 ... ... ... ...<br />
Madagascar 56 ... ... 103 142 149 67 ... ... 705 ... ... 52 43<br />
Malawi 77 -1 90 92 -1 139 128 135 99 -1 98 97 -1 17 -1 53 62 -1 36 34<br />
Mali 37 ** , -1 54 67 +1 55 71 82 +1 42 ** , -1 54 ** 67 +1 1,038 ** , -1 965 ** 850 +1 65 ** 80<br />
Mauritius 61 +1 81 82 101 100 99 93 93 93 10 9 8 98 96<br />
Mozambique 29 53 68 +1 75 101 111 +1 56 76 90 +1 1,498 938 482 +1 29 46<br />
Namibia 78 75 72 -1 115 109 107 -1 90 88 86 -1 35 43 52 -1 82 76<br />
Niger 31 47 81 +1 33 49 71 +1 27 42 62 +1 1,295 1,249 1,012 +1 69 +1 69 -1<br />
Nigeria 40 41 ** 58 ** 98 102 83 65 67 ** 58 ** 6,941 7,133 ** 10,542 ** ... 73<br />
Rwanda 85 ** , +1 97 ** ... 104 134 142 +1 76 ** , +1 82 ** 99 337 ** , +1 252 ** 20 31 +1 31 -1<br />
Sao Tome and Principe 87 -1 98 97 +1 126 ** , +1 127 134 +1 89 ** , -1 99 99 2 ** , -1 0.2 0.4 ... 69<br />
Senegal 59 ** 78 83 71 83 87 60 ** 76 ** 78 627 ** 423 ** 429 63 +1 64<br />
Seychelles 65 +1 75 ... 112 111 117 92 +1 95 ... 1 +1 0.4 ... 96 85 -1<br />
Sierra Leone ... ... ... 70 ... 125 +1 ... ... ... ... ... ... ... ...<br />
Somalia ... ... ... ... ... ... ... ... ... ... ... ... ... ...<br />
South Africa 92 90 ** 86 ** , -1 106 105 102 -1 94 ** 93 ** 90 ** , -1 425 ** 478 ** 679 ** , -1 57 77 -1<br />
Swaziland 51 56 84 95 103 116 72 76 86 63 51 30 65 71<br />
Togo 73 80 87 -2 118 117 140 89 93 94 -2 87 63 51 -2 46 69<br />
Uganda ... ... 73 131 123 121 ... ... 91 ... ... 623 38 +1 25 **<br />
United Republic of Tanzania 29 ** 88 85 -2 68 105 102 53 ** 91 98 -2 3,011 ** 649 137 -2 74 +1 81<br />
Zambia 50 58 61 84 119 115 71 ** 96 ** 93 ** 550 ** 79 ** 184 ** 66 75 +1<br />
Zimbabwe ... ... ... ... ... ... ... ... ... ... ... ... ... ...<br />
REGIONAL AVERAGES<br />
WORLD 81 85 85 ** 99 105 106 85 89 91 ** 102,089 72,617 60,735 ** ... ...<br />
Arab States 71 75 76 ** 90 95 98 79 85 88 ** 8,087 6,206 5,036 ** ... ...<br />
Central and Eastern Europe 88 ** 88 86 ** 102 100 100 ** 94 ** 95 95 ** 1,345 ** 1,139 931 ** ... ...<br />
Central Asia 89 ** 88 ** 90 98 99 101 94 ** 94 ** 94 381 ** 351 ** 317 ... ...<br />
East Asia and the Pacific 94 ** 93 ** 93 ** 110 ** 110 ** 110 95 ** 95 ** 96 ** 9,537 ** 8,781 ** 6,584 ** ... ...<br />
Latin America and the Caribbean 86 86 86 ** 120 117 114 94 96 95 ** 3,404 2,552 2,698 ** ... ...<br />
North America and Western Europe 91 89 89 103 102 103 98 97 97 880 1,476 1,267 ... ...<br />
South and West Asia 85 93 93 ** 90 106 106 ** 78 89 93 ** 37,833 19,412 13,261 ** ... ...<br />
Sub-Saharan Africa 45 57 65 ** 83 96 101 61 72 77 ** 40,622 32,699 30,641 ** ... ...<br />
190
OPPORTUNITIES LOST: THE IMPACT OF GRADE REPETITION AND EARLY SCHOOL LEAVING<br />
Survival<br />
rate to the<br />
last grade<br />
Primary education<br />
Gross intake ratio to<br />
the last grade<br />
Effective transition rate from<br />
primary to secondary<br />
(general programmes)<br />
Secondary education<br />
Gross enrolment ratio for<br />
secondary education<br />
(all programmes)<br />
Adult literacy rate s<br />
Public expenditure on<br />
education as a % of GDP<br />
2009 to<br />
1999 to 2004 to 2009 to<br />
2010 2000 2005 2010 2000 2005 2010 2000 2005 2010 1990 2000 2010 2000 2005 2010<br />
(15) (16) (17) (18) (19) (20) (21) (22) (23) (24) (25) (26) (27) (28) (29) (30)<br />
93 ** , -1 89 94 ** 97 ** , -1 96 ** 99 ** ... 75 ** 77 82 ** , -1 69 81 84 ... 10 7.8 -1<br />
64 24 30 45 61 67 75 10 13 23 +1 14 22 29 ... 4 4.0<br />
56 26 37 56 ... 58 70 11 ** , +1 14 ** 25 37 59 67 3 5 9.2<br />
66 51 53 ** 79 31 ** 45 ** , +1 51 -1 28 28 42 ** ... 68 71 2 3 3.5<br />
86 -2 107 87 99 ... 86 96 68 +1 71 88 63 80 84 ... 7 +1 5.6<br />
46 +1 ... 27 43 +1 ... 76 59 12 ** , +1 ... 18 +1 34 51 56 2 2 1.2<br />
28 23 32 35 66 67 ** 91 11 16 ** 25 11 28 34 3 2 2.8<br />
... 50 -1 68 ** 75 -2 ... 86 ** ... 29 ** 46 ** ... ... 68 75 ... ... 7.6 -2<br />
70 ** , -2 57 +1 71 71 ... 70 ** 76 36 45 ** , -1 ... ... ... … ... 2 6.2<br />
61 -1 43 46 +1 59 +1 62 ... 69 -1 24 ** ... ... 34 49 56 4 4 4.6 -2<br />
55 32 -1 ... 59 ... ... 89 * , -2 19 -1 ... 38 ... 67 67 ... ... 2.5<br />
62 55 -1 47 52 ... ... ... 31 ... ... ... 88 94 1 ... ...<br />
69 36 51 40 98 94 90 25 30 32 ... 53 68 3 ** 2 +1 ...<br />
47 23 43 72 92 99 93 14 25 36 27 36 39 4 6 +1 4.7<br />
... ... ... ... ... ... ... 48 ** ... ... 72 84 88 4 ** ... ...<br />
… 67 ** 67 71 ** 69 ** 87 83 ** ... ... 54 ** ... 37 50 3 ** 2 ** , -1 5.0<br />
72 -1 71 75 94 +1 97 97 96 -1 41 47 ** 58 +1 ... 58 67 5 +1 5 5.5<br />
66 32 58 64 78 83 77 19 ** , +1 31 ** 38 ** , -1 ... 30 41 2 2 2.4 -2<br />
... 30 ... 68 88 ** ... ... 19 34 ... ... 41 54 5 -1 ... ...<br />
... ... 91 ** ... ... ... ... 39 48 ** 60 -1 ... 82 87 5 7 6.7<br />
69 60 60 70 64 74 86 ** 30 37 46 ... 86 90 12 15 13.0 -2<br />
46 -2 ... ... 62 -2 ... ... 66 -2 35 ... ... 43 55 61 ... ... 2.8 -2<br />
35 37 59 72 66 73 73 ... 22 ** 31 ** , -1 ... 71 64 3 4 3.2 -1<br />
53 65 58 67 84 82 90 32 28 32 49 64 75 5 ... 5.7 +1<br />
75 +1 29 41 55 +1 76 ** 81 86 17 ** 24 39 +1 ... 24 31 4 4 4.5<br />
98 96 96 96 78 82 85 75 83 ** 89 ** 80 84 89 4 4 3.1 -1<br />
… 16 42 56 +1 60 59 59 +1 6 13 26 +1 ... 48 56 4 -1 5 ...<br />
83 -1 91 85 84 -1 98 ** 90 +1 94 -1 60 63 ... 76 85 89 8 6 +1 8.1<br />
69 +1 19 29 46 +1 48 74 72 +1 7 ** 10 13 ... 9 29 3 3 +1 3.8<br />
80 ... 83 74 ... ... ... 24 34 44 55 55 61 ... ... ...<br />
37 23 40 -1 70 ... ... 77 11 16 36 +1 58 65 71 4 3 4.7 +1<br />
68 ** , -1 46 -1 74 115 +1 ... 79 97 +1 ... 46 59 +1 73 85 89 ... ... ...<br />
60 40 54 59 48 65 ** 79 16 23 37 27 39 50 3 5 5.6<br />
... 107 127 133 95 100 98 105 116 119 88 92 92 5 -1 5 +1 ...<br />
... ... ... 74 +1 ... ... ... 28 +1 ... ... ... 35 42 5 ** 4 ** 4.3 -1<br />
... ... ... ... ... ... ... ... ... ... ... ... … ... ... ...<br />
... 86 99 -1 ... 97 95 -1 ... 85 92 94 -1 ... 82 89 6 5 6.0<br />
84 61 65 77 84 95 98 42 47 58 67 82 87 6 7 7.4<br />
59 69 76 74 79 80 85 34 47 ... ... 53 57 4 3 4.5<br />
32 60 +1 57 ** 57 44 +1 42 ** 64 16 19 ** 28 ** 56 68 73 2 ** 5 ** , -1 3.2 -1<br />
81 55 +1 55 90 20 ** , +1 33 ** 41 ** ... ... ... 59 69 73 ... ... 6.2<br />
53 -1 63 87 103 50 65 74 ... ... ... 65 69 71 2 2 1.3 -2<br />
... ... ... ... ... ... ... ... ... ... 84 ... 92 ... ... 2.5<br />
REGIONAL AVERAGES<br />
... 82 ** 86 90 ** ... ... ... 60 65 70 76 82 84 ... ... ...<br />
... 74 83 84 ... ... ... 61 68 69 ** 55 68 75 ... ... ...<br />
... 93 98 98 ** ... ... ... 89 87 88 ** 96 97 98 ... ... ...<br />
... 93 98 99 ... ... ... 84 93 95 98** 99 99 ... ... ...<br />
... 97 ** 97 ** 98 * ... ... ... 63 71 ** 80 82 92 94 ... ... ...<br />
... 97 98 102 ** ... ... ... 83 88 90 86** 90 91 ... ... ...<br />
... 99 98 101 ... ... ... 100 102 102 … … … ... ... ...<br />
... 68 80 88 ** ... ... ... 46 51 59 47 59 63 ... ... ...<br />
... 54 ** 62 71 ... ... ... 25 31 40 53** 57 63 ... ... ...<br />
191
Chronic inefficiencies in primary education systems are preventing many countries from offering real<br />
learning opportunities to all pupils. The <strong>2012</strong> edition of the <strong>Global</strong> <strong>Education</strong> <strong>Digest</strong> examines two<br />
persistent obstacles to universal primary education: high rates of grade repetition and early school leaving.<br />
<strong>Global</strong>ly about 32.2 million pupils repeated a grade in primary education in 2010 compared to 34.7 million<br />
in 2000, according to the <strong>Digest</strong>. So the good news is that over the past decade the number of repeaters<br />
has decreased even though enrolment in primary education has increased. However, the situation is<br />
problematic in many countries, where students can spend years repeating grades before dropping out of<br />
school. About 31.2 million children left school in 2010 before reaching the last grade of primary education.<br />
Early school leaving remains a major policy concern, especially in sub-Saharan Africa, South and West<br />
Asia, and Latin America and the Caribbean.<br />
The <strong>Digest</strong> presents data to identify which children are most likely to repeat a grade or leave school<br />
early and when. In sub-Saharan Africa, for example, about one in six pupils leave school before reaching<br />
Grade 2. The report examines the gender and ages of these children, while highlighting the extent to<br />
which household wealth and location shape a child’s educational progression.<br />
The <strong>Digest</strong> also explores policy o ptions, notably concerning automatic promotion and repetition<br />
practices. To better inform this debate, the report presents the most recent results of learning<br />
assessments among primary pupils before examining the economic costs associated with high rates of<br />
grade repetition and dropout.<br />
The UNESCO Institute for Statistics (UIS) is the statistical office of the United Nations <strong>Education</strong>al,<br />
Scientific and Cultural Organization (UNESCO). It is also the UN depository for cross-nationally<br />
comparable statistics in the fields of education, science and technology, culture, and communications.<br />
Please consult our website (www.uis.unesco.org) to access<br />
the UIS Data Centre and other publications.<br />
To order the interactive database on CD-ROM, please<br />
contact: uis.publications@unesco.org<br />
ISBN 978-92-9189-120-7<br />
9 789291 891207