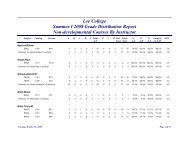
2009 Graduation Report.xlsx - Lee College
2009 Graduation Report.xlsx - Lee College
2009 Graduation Report.xlsx - Lee College

Create successful ePaper yourself
Turn your PDF publications into a flip-book with our unique Google optimized e-Paper software.
LEE<br />
COLLEGE<br />
Office of Institutional Research<br />
Graduate <strong>Report</strong><br />
2008-<strong>2009</strong> Graduates<br />
Prepared:<br />
April 2010
<strong>Lee</strong> <strong>College</strong><br />
Graduate <strong>Report</strong><br />
2008-<strong>2009</strong> Graduates<br />
April 2010<br />
The data in this report pertain to students who earned certificates or degrees during the<br />
academic year 2008-<strong>2009</strong>. The data which underlie this report are taken from the official<br />
Texas Higher Education Coordinating Board reports. The data pertaining to enrollment<br />
headcounts and educational objectives are derived from the CBM001, and the data pertaining<br />
to certificates and degrees awarded are from the CBM009.<br />
The analysis presented in the report includes comparisons of the number of certificates<br />
and degrees awarded during the 2008-<strong>2009</strong> academic year with the number of students<br />
enrolled Fall 2008 and the number of students seeking certificates and degrees during Fall<br />
2008.<br />
Data are presented for <strong>Lee</strong> <strong>College</strong> totals, Baytown campus totals, and Huntsville campus<br />
totals only.<br />
Highlights of the report:<br />
6.4% more degrees and certificates were awarded to <strong>Lee</strong> <strong>College</strong> students than the previous<br />
academic year (compared to enrollment).<br />
For the Baytown campus, the ratio of awards to enrollment was up 7.3% from the previous<br />
year.<br />
The ratio of awards to enrollment increased 5.0% from the previous year for the Huntsville<br />
campus students.<br />
The percentage of <strong>Lee</strong> <strong>College</strong> students seeking certificates was 20.3%, while 15.9%<br />
earned a certificate.<br />
68.5% of <strong>Lee</strong> <strong>College</strong> students declared that they were seeking a degree, and 10.8% earned<br />
one.<br />
The top three areas for degree/certificate awards at the Baytown campus were Liberal Arts<br />
and Sciences/Liberal Studies, Drafting & Design Technology/Technician General, and Nursing<br />
– Registered Nurse Training.<br />
Truck and Bus Driver/Commercial Vehicle Operation, Culinary Arts/Chef Training, and Applied<br />
Horticulture/Horticultural Operations, General were the top three award areas at the<br />
Huntsville campus.<br />
1,568 degrees and certificates were awarded to 1,292 students.
<strong>Lee</strong> <strong>College</strong> Graduate <strong>Report</strong><br />
2008-<strong>2009</strong><br />
Table of Contents<br />
Historical Summary Student Degrees and Certificates Awarded<br />
Table 1a <strong>Lee</strong> <strong>College</strong> Total - Awards Received From 2004 - <strong>2009</strong> 2<br />
Chart 1 <strong>Lee</strong> <strong>College</strong> Total - Percent of Students Who Received Awards From 2004 - <strong>2009</strong><br />
Table 1b Baytown Campus - Awards Received From 2004 - <strong>2009</strong> 3<br />
Chart 2 Baytown Campus - Percent of Students Who Received Awards From 2004 - <strong>2009</strong><br />
Table 1c Huntsville Campus - Awards Received From 2004 - <strong>2009</strong> 4<br />
Chart 3 Huntsville Campus - Percent of Student Who Received Awards From 2004 - <strong>2009</strong><br />
Table 1d Baytown vs. Huntsville - Awards Received From 2004 - <strong>2009</strong> 5<br />
Chart 4 Baytown vs. Huntsville - Percent of Students Who Received Awards From 2004 - <strong>2009</strong><br />
Students Seeking vs. Earning Certificates<br />
Table 2a <strong>Lee</strong> <strong>College</strong> Total - By Ethnicity & Gender 6<br />
Chart 5 <strong>Lee</strong> <strong>College</strong> Total - As a Percent of Enrollment By Ethnicity & Total<br />
Table 2b Baytown Campus - By Ethnicity & Gender 7<br />
Chart 6 Baytown Campus - As a Percent of Enrollment By Ethnicity & Total<br />
Table 2c Huntsville Campus - By Ethnicity 8<br />
Chart 7 Huntsville Campus - As a Percent of Enrollment By Ethnicity & Total<br />
Students Seeking vs. Earning Degrees<br />
Table 3a <strong>Lee</strong> <strong>College</strong> Total - By Ethnicity & Gender/Type of Degrees Earned by Ethnicity & Gender 9<br />
Chart 8 <strong>Lee</strong> <strong>College</strong> Total - As a Percent of Enrollment by Ethnicity & Total 10<br />
Chart 9 <strong>Lee</strong> <strong>College</strong> Total - By Type of Degrees Earned<br />
Table 3b Baytown Campus - By Ethnicity & Gender/Type of Degrees Earned by Ethnicity & Gender 11<br />
Chart 10 Baytown Campus - As a Percent of Enrollment by Ethnicity & Total 12<br />
Chart 11 Baytown Campus - By Type of Degrees Earned<br />
Table 3c Huntsville Campus - By Ethnicity/Types of Degrees Earned by Ethnicity 13<br />
Chart 12 Huntsville Campus - As a Percent of Enrollment by Ethnicity & Total 14<br />
Chart 13 Huntsville Campus - By Type of Degrees Earned<br />
Number of Awards Earned<br />
Table 4a <strong>Lee</strong> <strong>College</strong> Total - By Number of Graduates 15<br />
Table 4b <strong>Lee</strong> <strong>College</strong> Total - By CIP Code 17<br />
Table 4c Baytown Campus - By Number of Graduates 19<br />
Table 4d Baytown Campus - By CIP Code 21<br />
Table 4e Huntsville Campus - By Number of Graduates 23<br />
Table 4f Huntsville Campus - By CIP Code 24<br />
<strong>Lee</strong> <strong>College</strong> Office of Institutional Research 1 of 24
Degrees and Certificates Awarded<br />
Historical Summary - <strong>Lee</strong> <strong>College</strong> Total<br />
Table 1a<br />
Year<br />
Fall 2008<br />
Enrollment<br />
(Unduplicated)<br />
# of Students Who<br />
Received Degrees or<br />
Certificates<br />
% of Students Who<br />
Received Degrees or<br />
Certificates<br />
2004-05 5,914 1,219 20.61%<br />
2005-06 4,743 984 20.75%<br />
2006-07 5,348 1,116 20.87%<br />
2007-08 5,815 1,214 20.88%<br />
2008-09 5,868 1,292 22.02%<br />
Note: This table represents an UNDUPLICATED count of students who received awards. Some<br />
students received multiple awards. Fall 2008 Enrollment includes flexible entry.<br />
% of Students Who Received Degrees or Certificates<br />
<strong>Lee</strong> <strong>College</strong> Total<br />
Chart 1<br />
22.50%<br />
22.00%<br />
21.50%<br />
21.00%<br />
20.50%<br />
20.00%<br />
19.50%<br />
2004-05 2005-06 2006-07 2007-08 2008-09<br />
<strong>Lee</strong> <strong>College</strong> Office of Institutional Research 2 of 24
Degrees and Certificates Awarded<br />
Historical Summary - Baytown Campus<br />
Table 1b<br />
Year<br />
Fall 2008<br />
Enrollment<br />
(Unduplicated)<br />
# of Students Who<br />
Received Degrees or<br />
Certificates<br />
% of Students Who<br />
Received Degrees or<br />
Certificates<br />
2004-05 4,857 683 14.06%<br />
2005-06 4,560 599 13.14%<br />
2006-07 4,796 678 14.14%<br />
2007-08 5,041 771 15.29%<br />
2008-09 5,167 827 16.01%<br />
Note: This table represents an UNDUPLICATED count of students who received awards. Some<br />
students received multiple awards. Fall 2008 Enrollment includes flexible entry.<br />
% of Students Who Received Degrees or Certificates<br />
Baytown Campus<br />
Chart 2<br />
18.00%<br />
16.00%<br />
14.00%<br />
12.00%<br />
10.00%<br />
08.00%<br />
06.00%<br />
04.00%<br />
02.00%<br />
00.00%<br />
2004-05 2005-06 2006-07 2007-08 2008-09<br />
<strong>Lee</strong> <strong>College</strong> Office of Institutional Research 3 of 24
Degrees and Certificates Awarded<br />
Historical Summary - Huntsville Campus<br />
Table 1c<br />
Year<br />
Fall 2008<br />
Enrollment<br />
(Unduplicated)<br />
# of Students Who<br />
Received Degrees or<br />
Certificates<br />
% of Students Who<br />
Received Degrees or<br />
Certificates<br />
2004-05 1,057 536 50.71%<br />
2005-06 183 385 210.38%<br />
2006-07 552 438 79.35%<br />
2007-08 774 443 57.24%<br />
2008-09 701 465 66.33%<br />
Note: This table represents an UNDUPLICATED count of students who received awards. Some<br />
students received multiple awards. Fall 2008 Enrollment includes flexible entry.<br />
% of Students Who Received Degrees or Certificates<br />
Huntsville Campus<br />
Chart 3<br />
250.00%<br />
200.00%<br />
150.00%<br />
100.00%<br />
50.00%<br />
00.00%<br />
2004-05 2005-06 2006-07 2007-08 2008-09<br />
<strong>Lee</strong> <strong>College</strong> Office of Institutional Research 4 of 24
Degrees and Certificates Awarded<br />
Historical Summary<br />
Baytown vs. Huntsville<br />
Table 1d<br />
Year Baytown % Hunt %<br />
2004-05 14.06% 50.71%<br />
2005-06 13.14% 210.38%<br />
2006-07 14.14% 79.35%<br />
2007-08 15.29% 57.24%<br />
2008-09 16.01% 63.33%<br />
Note: This table represents an UNDUPLICATED count of students who received<br />
awards. Some students received multiple awards.<br />
% of Students Who Received Degrees or Certificates<br />
Baytown vs. Huntsville<br />
Chart 4<br />
250.00%<br />
200.00%<br />
150.00%<br />
Baytown %<br />
Hunt %<br />
100.00%<br />
50.00%<br />
00.00%<br />
2004-05 2005-06 2006-07 2007-08 2008-09<br />
<strong>Lee</strong> <strong>College</strong> Office of Institutional Research 5 of 24
Students Seeking vs. Earning Certificates<br />
2008-09 <strong>Lee</strong> <strong>College</strong> Total<br />
Table 2a<br />
Enrolled<br />
Fall 2008 Seeking Certificate*<br />
# of Certificates<br />
Earned**<br />
Ethnicity Headcount Number % Seeking Number % Earned<br />
American Indian 27 5 18.5% 5 18.5%<br />
Asian 94 9 9.6% 9 9.6%<br />
Black 1,023 237 23.2% 209 20.4%<br />
Hispanic 1,655 431 26.0% 262 15.8%<br />
International 66 4 6.1% 10 15.2%<br />
Other 76 13 17.1% 9 11.8%<br />
White 2,927 494 16.9% 428 14.6%<br />
Total 5,868 1,193 20.3% 932 15.9%<br />
Male 2,930 811 27.7% 662 22.6%<br />
Female 2,938 382 13.0% 270 9.2%<br />
Total 5,868 1,193 20.3% 932 15.9%<br />
*Seeking Certificate reflects an UNDUPLICATED count from CBM001.<br />
**# of Certificates Earned reflects a DUPLICATED count from CBM009<br />
30.0%<br />
Students Seeking vs. Earning Certificate as % of Enrollment<br />
<strong>Lee</strong> <strong>College</strong> Total<br />
Chart 5<br />
25.0%<br />
20.0%<br />
15.0%<br />
% Seeking<br />
% Earned<br />
10.0%<br />
5.0%<br />
0.0%<br />
<strong>Lee</strong> <strong>College</strong> Office of Institutional Research 6 of 24
Students Seeking vs. Earning Certificates<br />
2008-09 Baytown Campus<br />
Table 2b<br />
Enrolled<br />
Fall 2008 Seeking Certificate<br />
# of Certificates<br />
Earned<br />
Ethnicity Headcount Number % Seeking Number % Earned<br />
American Indian 20 3 15.0% 2 10.0%<br />
Asian 87 9 10.3% 8 9.2%<br />
Black 829 181 21.8% 62 7.5%<br />
Hispanic 1,489 384 25.8% 174 11.7%<br />
International 66 4 6.1% 10 15.2%<br />
Other 72 13 18.1% 9 12.5%<br />
White 2,604 435 16.7% 272 10.4%<br />
Total 5,167 1,029 19.9% 537 10.4%<br />
Male 2,229 647 29.0% 267 12.0%<br />
Female 2,938 382 13.0% 270 9.2%<br />
Total 5,167 1,029 19.9% 537 10.4%<br />
*Seeking Certificate reflects an UNDUPLICATED count from CBM001.<br />
**# of Certificates Earned reflects a DUPLICATED count from CBM009<br />
Students Seeking vs. Earning Certificate as % of Enrollment<br />
Baytown Campus<br />
Chart 6<br />
30.0%<br />
25.0%<br />
20.0%<br />
15.0%<br />
% Seeking<br />
% Earned<br />
10.0%<br />
5.0%<br />
0.0%<br />
<strong>Lee</strong> <strong>College</strong> Office of Institutional Research 7 of 24
Students Seeking vs. Earning Certificates<br />
2008-09 Huntsville Campus<br />
Table 2c<br />
Enrolled<br />
Fall 2008 Seeking Certificate # of Certificates Earned<br />
Ethnicity Headcount Number % Seeking Number % Earned<br />
American Indian 7 2 28.6% 3 42.9%<br />
Asian 7 - 0.0% 1 14.3%<br />
Black 194 56 28.9% 147 75.8%<br />
Hispanic 166 47 28.3% 88 53.0%<br />
Other 4 - 0.0% - 0.0%<br />
White 323 59 18.3% 156 48.3%<br />
Total 701 164 23.4% 395 56.3%<br />
*Seeking Certificate reflects an UNDUPLICATED count from CBM001.<br />
**# of Certificates Earned reflects a DUPLICATED count from CBM009<br />
Students Seeking vs. Earning Certificate as % of Enrollment<br />
Huntsville Campus<br />
Chart 7<br />
80.0%<br />
70.0%<br />
60.0%<br />
50.0%<br />
40.0%<br />
% Seeking<br />
% Earned<br />
30.0%<br />
20.0%<br />
10.0%<br />
0.0%<br />
<strong>Lee</strong> <strong>College</strong> Office of Institutional Research 8 of 24
Students Seeking vs. Earning Degrees<br />
2008-09 <strong>Lee</strong> <strong>College</strong> Total<br />
Table 3a<br />
Enrolled Fall<br />
2008<br />
Seeking Degree* # of Degrees Earned**<br />
Ethnicity Headcount Number % Seeking Number % Earned<br />
American Indian 94 18 19.1% 2 2.1%<br />
Asian 27 67 248.1% 8 29.6%<br />
Black 1,023 726 71.0% 122 11.9%<br />
Hispanic 1,655 1,066 64.4% 147 8.9%<br />
International 66 60 90.9% 10 15.2%<br />
Other 76 53 69.7% 3 3.9%<br />
White 2,927 2,028 69.3% 344 11.8%<br />
Total 5,868 4,018 68.5% 636 10.8%<br />
Male 2,930 1,765 60.2% 338 11.5%<br />
Female 2,938 2,253 76.7% 298 10.1%<br />
Total 5,868 4,018 68.5% 636 10.8%<br />
*Seeking Degree reflects an UNDUPLICATED count from CBM001.<br />
**# of Degree Earned reflects a DUPLICATED count from CBM009<br />
Types of Degrees Earned<br />
<strong>Lee</strong> <strong>College</strong> Total<br />
Ethnicity AA AAS AAT AS Total<br />
American Indian - 1 - 1 2<br />
Asian - 6 1 1 8<br />
Black 21 67 - 34 122<br />
Hispanic 19 90 2 36 147<br />
International 2 3 1 4 10<br />
Other - 3 - - 3<br />
White 61 164 17 102 344<br />
Total 103 334 21 178 636<br />
Male 64 176 1 97 338<br />
Female 39 158 20 81 298<br />
Total 103 334 21 178 636<br />
<strong>Lee</strong> <strong>College</strong> Office of Institutional Research 9 of 24
Students Seeking vs. Earning Degree as % of Enrollment<br />
<strong>Lee</strong> <strong>College</strong> Total<br />
Chart 8<br />
250.0%<br />
200.0%<br />
1254<br />
1008<br />
150.0%<br />
100.0%<br />
% Seeking<br />
% Earned<br />
50.0%<br />
0.0%<br />
AS<br />
28.0%<br />
Type of Degrees Earned<br />
<strong>Lee</strong> <strong>College</strong> Total<br />
Chart 9<br />
AA<br />
16.2%<br />
AAT<br />
3.3%<br />
AAS<br />
52.5%<br />
<strong>Lee</strong> <strong>College</strong> Office of Institutional Research 10 of 24
Students Seeking vs. Earning Degrees<br />
2008-09 Baytown Campus<br />
Table 3b<br />
Enrolled Fall<br />
2008<br />
Seeking Degree* # of Degrees Earned**<br />
Ethnicity Headcount Number % Seeking Number % Earned<br />
American Indian 20 14 70.0% 2 10.0%<br />
Asian 87 62 71.3% 8 9.2%<br />
Black 829 611 73.7% 86 10.4%<br />
Hispanic 1,489 967 64.9% 127 8.5%<br />
International 66 60 90.9% 10 15.2%<br />
Other 72 51 70.8% 3 4.2%<br />
White 2,604 1,812 69.6% 253 9.7%<br />
Total 5,167 3,577 69.2% 489 9.5%<br />
Male 2,229 1,324 59.4% 191 8.6%<br />
Female 2,938 2,253 76.7% 298 10.1%<br />
Total 5,167 3,577 69.2% 489 9.5%<br />
*Seeking Degree reflects an UNDUPLICATED count from CBM001.<br />
**# of Degree Earned reflects a DUPLICATED count from CBM009<br />
Type of Degrees Earned<br />
Baytown Campus<br />
Ethnicity AA AAS AAT AS Total<br />
American Indian - 1 - 1 2<br />
Asian - 6 1 1 8<br />
Black 9 55 - 22 86<br />
Hispanic 11 84 2 30 127<br />
International 2 3 1 4 10<br />
Other - 3 - - 3<br />
White 30 134 17 72 253<br />
Total 52 286 21 130 489<br />
Male 13 128 1 49 191<br />
Female 39 158 20 81 298<br />
Total 52 286 21 130 489<br />
<strong>Lee</strong> <strong>College</strong> Office of Institutional Research 11 of 24
Students Seeking vs. Earning Degree as % of Enrollment<br />
Baytown Only<br />
Chart 10<br />
100.0%<br />
90.0%<br />
80.0%<br />
70.0%<br />
60.0%<br />
50.0%<br />
40.0%<br />
30.0%<br />
20.0%<br />
10.0%<br />
0.0%<br />
1254<br />
1008<br />
% Seeking<br />
% Earned<br />
AS<br />
26.6%<br />
Type of Degrees Earned<br />
Baytown Only<br />
Chart 11<br />
AA<br />
10.6%<br />
AAT<br />
4.3%<br />
AAS<br />
58.5%<br />
<strong>Lee</strong> <strong>College</strong> Office of Institutional Research 12 of 24
Students Seeking vs. Earning Degrees<br />
2008-09 Huntsville Campus<br />
Table 3c<br />
Enrolled<br />
Fall 2008 Seeking Degree* # of Degrees Earned**<br />
Ethnicity Headcount Number % Seeking Number % Earned<br />
American Indian 7 4 57.1% - 0.0%<br />
Asian 7 5 71.4% - 0.0%<br />
Black 194 115 59.3% 36 18.6%<br />
Hispanic 166 99 59.6% 20 12.0%<br />
Other 4 2 50.0% - 0.0%<br />
White 323 216 66.9% 91 28.2%<br />
Total 701 441 62.9% 147 21.0%<br />
*Seeking Degree reflects an UNDUPLICATED count from CBM001.<br />
**# of Degree Earned reflects a DUPLICATED count from CBM009<br />
Type of Degrees Earned<br />
Huntsville Campus<br />
Ethnicity AA AAS AS Total<br />
American Indian - - - -<br />
Asian - - - -<br />
Black 12 12 12 36<br />
Hispanic 8 6 6 20<br />
Other - - - -<br />
White 31 30 30 91<br />
Total 51 48 48 147<br />
<strong>Lee</strong> <strong>College</strong> Office of Institutional Research 13 of 24
Students Seeking vs. Earning Degree as % of Enrollment<br />
Huntsville Campus<br />
Chart 12<br />
80.0%<br />
70.0%<br />
60.0%<br />
1254<br />
1008<br />
50.0%<br />
40.0%<br />
% Seeking<br />
% Earned<br />
30.0%<br />
20.0%<br />
10.0%<br />
0.0%<br />
Type of Degrees Earned<br />
Huntsville Campus<br />
Chart 13<br />
AS<br />
32.7%<br />
AA<br />
34.7%<br />
AAS<br />
32.7%<br />
<strong>Lee</strong> <strong>College</strong> Office of Institutional Research 14 of 24
Awards Earned<br />
<strong>Lee</strong> <strong>College</strong> Total by Number of Awards<br />
Table 4a<br />
CIP Code Award # Grads % Grads<br />
24010100 Liberal Arts and Sciences/Liberal Studies 189 12.1%<br />
15130100 Drafting and Design Technology/Technician, General 140 8.9%<br />
52040100 Administrative Assistant and Secretarial Science, General 87 5.5%<br />
41030100 Chemical Technology/Technician 83 5.3%<br />
49020500 Truck and Bus Driver/Commercial Vehicle Operation 83 5.3%<br />
12050300 Culinary Arts/Chef Training 70 4.5%<br />
15040400 Instrumentation Technology/Technician 60 3.8%<br />
24010300 Humanities/Humanistic Studies 60 3.8%<br />
01060100 Applied Horticulture/Horticultural Operations, General 58 3.7%<br />
48050800 Welding Technology/Welder 43 2.7%<br />
26010100 Biology/Biological Sciences, General 38 2.4%<br />
48070300 Cabinetmaking and Millwork/Millwright 34 2.2%<br />
11100200 System, Networking, and LAN/WAN Management/Manager 31 2.0%<br />
47060400 Automobile/Automotive Mechanics Technology/Technician 30 1.9%<br />
47020100 Heating, Air Conditioning, Ventilation and Refrigeration Maintenance<br />
29 1.8%<br />
Technology/Technician (HAC, HACR, HVAC, HVACR)<br />
15030500 Telecommunications Technology/Technician 24 1.5%<br />
11080100 Web Page, Digital/Multimedia and Information Resources Design 22 1.4%<br />
11030100 Data Processing and Data Processing Technology/Technician 21 1.3%<br />
43010400 Criminal Justice/Safety Studies 19 1.2%<br />
15070100 Occupational Safety and Health Technology/Technician 17 1.1%<br />
46030200 Electrician 17 1.1%<br />
13121000 Early Childhood Education and Teaching 16 1.0%<br />
46050200 Pipefitting/Pipefitter and Sprinkler Fitter 16 1.0%<br />
48050100 Machine Tool Technology/Machinist 15 1.0%<br />
51070700 Health Information/Medical Records Technology/Technician 15 1.0%<br />
15120200 Computer Technology/Computer Systems Technology 14 0.9%<br />
51071300 Medical Insurance Coding Specialist/Coder 13 0.8%<br />
11010100 Computer and Information Sciences, General 10 0.6%<br />
23010100 English Language and Literature, General 10 0.6%<br />
45010100 Social Sciences, General 10 0.6%<br />
13120600 Teacher Education, Multiple Levels 9 0.6%<br />
22030200 Legal Assistant/Paralegal 9 0.6%<br />
27010100 Mathematics, General 8 0.5%<br />
52030200 Accounting Technology/Technician and Bookkeeping 8 0.5%<br />
15030300 Electrical, Electronic and Communications Engineering Technology/Technician 6 0.4%<br />
10030400 Animation, Interactive Technology, Video Graphics and Special Effects 5 0.3%<br />
12041300 Cosmetology, Barber/Styling, and Nail Instructor 5 0.3%<br />
13131400 Physical Education Teaching and Coaching 5 0.3%<br />
44070100 Social Work 5 0.3%<br />
13120300 Junior High/Intermediate/Middle School Education and Teaching 4 0.3%<br />
50070100 Art/Art Studies, General 4 0.3%<br />
12040100 Cosmetology/Cosmetologist, General 3 0.2%<br />
45070200 Cartography 3 0.2%<br />
<strong>Lee</strong> <strong>College</strong> Office of Institutional Research 15 of 24
Awards Earned<br />
<strong>Lee</strong> <strong>College</strong> Total by Number of Awards<br />
Table 4a<br />
CIP Code Award # Grads % Grads<br />
15100100 Construction Engineering Technology/Technician 2 0.1%<br />
16010100 Foreign Languages and Literatures, General 2 0.1%<br />
51070800 Medical Transcription/Transcriptionist 2 0.1%<br />
04020100 Architecture 1 0.1%<br />
04040100 Environmental Design/Architecture 1 0.1%<br />
10010500 Communications Technology/Technician 1 0.1%<br />
10020300 Recording Arts Technology/Technician 1 0.1%<br />
10030300 Prepress/Desktop Publishing and Digital Imaging Design 1 0.1%<br />
11020100 Computer Programming/Programmer, General 1 0.1%<br />
11070100 Computer Science 1 0.1%<br />
13120500 Secondary Education and Teaching 1 0.1%<br />
47060500 Diesel Mechanics Technology/Technician 1 0.1%<br />
49010200 Airline/Commercial/Professional Pilot and Flight Crew 1 0.1%<br />
50090100 Music, General 1 0.1%<br />
51150100 Substance Abuse/Addiction Counseling 5 0.3%<br />
51160100 Nursing - Registered Nurse Training (RN, ASN, BSN, MSN) 87 5.5%<br />
51161300 Licensed Practical /Vocational Nurse Training (LPN, LVN, Cert, Dipl, AAS) 15 1.0%<br />
52020100 Business Administration and Management, General 96 6.1%<br />
Total 1,568 100.0%<br />
<strong>Lee</strong> <strong>College</strong> Office of Institutional Research 16 of 24
Awards Earned<br />
<strong>Lee</strong> <strong>College</strong> Total by CIP Code<br />
Table 4b<br />
CIP Code Award # Grads % Grads<br />
01060100 Applied Horticulture/Horticultural Operations, General 58 3.7%<br />
04020100 Architecture 1 0.1%<br />
04040100 Environmental Design/Architecture 1 0.1%<br />
10010500 Communications Technology/Technician 1 0.1%<br />
10020300 Recording Arts Technology/Technician 1 0.1%<br />
10030300 Prepress/Desktop Publishing and Digital Imaging Design 1 0.1%<br />
10030400 Animation, Interactive Technology, Video Graphics and Special Effects 5 0.3%<br />
11010100 Computer and Information Sciences, General 10 0.6%<br />
11020100 Computer Programming/Programmer, General 1 0.1%<br />
11030100 Data Processing and Data Processing Technology/Technician 21 1.3%<br />
11070100 Computer Science 1 0.1%<br />
11080100 Web Page, Digital/Multimedia and Information Resources Design 22 1.4%<br />
11100200 System, Networking, and LAN/WAN Management/Manager 31 2.0%<br />
12040100 Cosmetology/Cosmetologist, General 3 0.2%<br />
12041300 Cosmetology, Barber/Styling, and Nail Instructor 5 0.3%<br />
12050300 Culinary Arts/Chef Training 70 4.5%<br />
13120300 Junior High/Intermediate/Middle School Education and Teaching 4 0.3%<br />
13120500 Secondary Education and Teaching 1 0.1%<br />
13120600 Teacher Education, Multiple Levels 9 0.6%<br />
13121000 Early Childhood Education and Teaching 16 1.0%<br />
13131400 Physical Education Teaching and Coaching 5 0.3%<br />
15030300 Electrical, Electronic and Communications Engineering Technology/Technician 6 0.4%<br />
15030500 Telecommunications Technology/Technician 24 1.5%<br />
15040400 Instrumentation Technology/Technician 60 3.8%<br />
15070100 Occupational Safety and Health Technology/Technician 17 1.1%<br />
15100100 Construction Engineering Technology/Technician 2 0.1%<br />
15120200 Computer Technology/Computer Systems Technology 14 0.9%<br />
15130100 Drafting and Design Technology/Technician, General 140 8.9%<br />
16010100 Foreign Languages and Literatures, General 2 0.1%<br />
22030200 Legal Assistant/Paralegal 9 0.6%<br />
23010100 English Language and Literature, General 10 0.6%<br />
24010100 Liberal Arts and Sciences/Liberal Studies 189 12.1%<br />
24010300 Humanities/Humanistic Studies 60 3.8%<br />
26010100 Biology/Biological Sciences, General 38 2.4%<br />
27010100 Mathematics, General 8 0.5%<br />
41030100 Chemical Technology/Technician 83 5.3%<br />
43010400 Criminal Justice/Safety Studies 19 1.2%<br />
44070100 Social Work 5 0.3%<br />
45010100 Social Sciences, General 10 0.6%<br />
45070200 Cartography 3 0.2%<br />
46030200 Electrician 17 1.1%<br />
46050200 Pipefitting/Pipefitter and Sprinkler Fitter 16 1.0%<br />
47020100 Heating, Air Conditioning, Ventilation and Refrigeration Maintenance<br />
Technology/Technician (HAC, HACR, HVAC, HVACR)<br />
29 1.8%<br />
<strong>Lee</strong> <strong>College</strong> Office of Institutional Research 17 of 24
Awards Earned<br />
<strong>Lee</strong> <strong>College</strong> Total by CIP Code<br />
Table 4b<br />
CIP Code Award # Grads % Grads<br />
47060400 Automobile/Automotive Mechanics Technology/Technician 30 1.9%<br />
47060500 Diesel Mechanics Technology/Technician 1 0.1%<br />
48050100 Machine Tool Technology/Machinist 15 1.0%<br />
48050800 Welding Technology/Welder 43 2.7%<br />
48070300 Cabinetmaking and Millwork/Millwright 34 2.2%<br />
49010200 Airline/Commercial/Professional Pilot and Flight Crew 1 0.1%<br />
49020500 Truck and Bus Driver/Commercial Vehicle Operation 83 5.3%<br />
50070100 Art/Art Studies, General 4 0.3%<br />
50090100 Music, General 1 0.1%<br />
51070700 Health Information/Medical Records Technology/Technician 15 1.0%<br />
51070800 Medical Transcription/Transcriptionist 2 0.1%<br />
51071300 Medical Insurance Coding Specialist/Coder 13 0.8%<br />
51150100 Substance Abuse/Addiction Counseling 5 0.3%<br />
51160100 Nursing - Registered Nurse Training (RN, ASN, BSN, MSN) 87 5.5%<br />
51161300 Licensed Practical /Vocational Nurse Training (LPN, LVN, Cert, Dipl, AAS) 15 1.0%<br />
52020100 Business Administration and Management, General 96 6.1%<br />
52030200 Accounting Technology/Technician and Bookkeeping 8 0.5%<br />
52040100 Administrative Assistant and Secretarial Science, General 87 5.5%<br />
Total 1,568 100.0%<br />
<strong>Lee</strong> <strong>College</strong> Office of Institutional Research 18 of 24
Awards Earned<br />
Baytown Campus by Number of Awards<br />
Table 4c<br />
CIP Code Award Label # Grads % Grads<br />
24010100 Liberal Arts and Sciences/Liberal Studies 189 18.4%<br />
15130100 Drafting and Design Technology/Technician, General 140 13.6%<br />
51160100 Nursing - Registered Nurse Training (RN, ASN, BSN, MSN) 87 8.5%<br />
52040100 Administrative Assistant and Secretarial Science, General 87 8.5%<br />
41030100 Chemical Technology/Technician 83 8.1%<br />
15040400 Instrumentation Technology/Technician 60 5.8%<br />
52020100 Business Administration and Management, General 48 4.7%<br />
26010100 Biology/Biological Sciences, General 38 3.7%<br />
43010400 Criminal Justice/Safety Studies 19 1.9%<br />
15070100 Occupational Safety and Health Technology/Technician 17 1.7%<br />
46030200 Electrician 17 1.7%<br />
13121000 Early Childhood Education and Teaching 16 1.6%<br />
46050200 Pipefitting/Pipefitter and Sprinkler Fitter 16 1.6%<br />
48050100 Machine Tool Technology/Machinist 15 1.5%<br />
51070700 Health Information/Medical Records Technology/Technician 15 1.5%<br />
51161300 Licensed Practical /Vocational Nurse Training (LPN, LVN, Cert, Dipl, AAS) 15 1.5%<br />
15120200 Computer Technology/Computer Systems Technology 14 1.4%<br />
51071300 Medical Insurance Coding Specialist/Coder 13 1.3%<br />
11010100 Computer and Information Sciences, General 10 1.0%<br />
23010100 English Language and Literature, General 10 1.0%<br />
45010100 Social Sciences, General 10 1.0%<br />
48050800 Welding Technology/Welder 10 1.0%<br />
13120600 Teacher Education, Multiple Levels 9 0.9%<br />
22030200 Legal Assistant/Paralegal 9 0.9%<br />
24010300 Humanities/Humanistic Studies 9 0.9%<br />
27010100 Mathematics, General 8 0.8%<br />
52030200 Accounting Technology/Technician and Bookkeeping 8 0.8%<br />
10030400 Animation, Interactive Technology, Video Graphics and Special Effects 5 0.5%<br />
12041300 Cosmetology, Barber/Styling, and Nail Instructor 5 0.5%<br />
13131400 Physical Education Teaching and Coaching 5 0.5%<br />
44070100 Social Work 5 0.5%<br />
51150100 Substance Abuse/Addiction Counseling 5 0.5%<br />
13120300 Junior High/Intermediate/Middle School Education and Teaching 4 0.4%<br />
50070100 Art/Art Studies, General 4 0.4%<br />
12040100 Cosmetology/Cosmetologist, General 3 0.3%<br />
45070200 Cartography 3 0.3%<br />
15100100 Construction Engineering Technology/Technician 2 0.2%<br />
16010100 Foreign Languages and Literatures, General 2 0.2%<br />
51070800 Medical Transcription/Transcriptionist 2 0.2%<br />
<strong>Lee</strong> <strong>College</strong> Office of Institutional Research 19 of 24
Awards Earned<br />
Baytown Campus by Number of Awards<br />
Table 4c<br />
CIP Code Award Label # Grads % Grads<br />
04020100 Architecture (BArch, BA/BS, MArch, MA/MS, PhD) 1 0.1%<br />
04040100 Environmental Design/Architecture 1 0.1%<br />
10010500 Communications Technology/Technician 1 0.1%<br />
10020300 Recording Arts Technology/Technician 1 0.1%<br />
10030300 Prepress/Desktop Publishing and Digital Imaging Design 1 0.1%<br />
11070100 Computer Science 1 0.1%<br />
13120500 Secondary Education and Teaching 1 0.1%<br />
49010200 Airline/Commercial/Professional Pilot and Flight Crew 1 0.1%<br />
50090100 Music, General 1 0.1%<br />
Total 1,026 100.0%<br />
<strong>Lee</strong> <strong>College</strong> Office of Institutional Research 20 of 24
Awards Earned<br />
Baytown Campus by CIP Code<br />
Table 4d<br />
CIP Code Award Label # Grads % Grads<br />
04020100 Architecture (BArch, BA/BS, MArch, MA/MS, PhD) 1 0.1%<br />
04040100 Environmental Design/Architecture 1 0.1%<br />
10010500 Communications Technology/Technician 1 0.1%<br />
10020300 Recording Arts Technology/Technician 1 0.1%<br />
10030300 Prepress/Desktop Publishing and Digital Imaging Design 1 0.1%<br />
10030400 Animation, Interactive Technology, Video Graphics and Special Effects 5 0.5%<br />
11010100 Computer and Information Sciences, General 10 1.0%<br />
11070100 Computer Science 1 0.1%<br />
12040100 Cosmetology/Cosmetologist, General 3 0.3%<br />
12041300 Cosmetology, Barber/Styling, and Nail Instructor 5 0.5%<br />
13120300 Junior High/Intermediate/Middle School Education and Teaching 4 0.4%<br />
13120500 Secondary Education and Teaching 1 0.1%<br />
13120600 Teacher Education, Multiple Levels 9 0.9%<br />
13121000 Early Childhood Education and Teaching 16 1.6%<br />
13131400 Physical Education Teaching and Coaching 5 0.5%<br />
15040400 Instrumentation Technology/Technician 60 5.8%<br />
15070100 Occupational Safety and Health Technology/Technician 17 1.7%<br />
15100100 Construction Engineering Technology/Technician 2 0.2%<br />
15120200 Computer Technology/Computer Systems Technology 14 1.4%<br />
15130100 Drafting and Design Technology/Technician, General 140 13.6%<br />
16010100 Foreign Languages and Literatures, General 2 0.2%<br />
22030200 Legal Assistant/Paralegal 9 0.9%<br />
23010100 English Language and Literature, General 10 1.0%<br />
24010100 Liberal Arts and Sciences/Liberal Studies 189 18.4%<br />
24010300 Humanities/Humanistic Studies 9 0.9%<br />
26010100 Biology/Biological Sciences, General 38 3.7%<br />
27010100 Mathematics, General 8 0.8%<br />
41030100 Chemical Technology/Technician 83 8.1%<br />
43010400 Criminal Justice/Safety Studies 19 1.9%<br />
44070100 Social Work 5 0.5%<br />
45010100 Social Sciences, General 10 1.0%<br />
45070200 Cartography 3 0.3%<br />
46030200 Electrician 17 1.7%<br />
46050200 Pipefitting/Pipefitter and Sprinkler Fitter 16 1.6%<br />
48050100 Machine Tool Technology/Machinist 15 1.5%<br />
48050800 Welding Technology/Welder 10 1.0%<br />
49010200 Airline/Commercial/Professional Pilot and Flight Crew 1 0.1%<br />
50070100 Art/Art Studies, General 4 0.4%<br />
50090100 Music, General 1 0.1%<br />
51070700 Health Information/Medical Records Technology/Technician 15 1.5%<br />
<strong>Lee</strong> <strong>College</strong> Office of Institutional Research 21 of 24
Awards Earned<br />
Baytown Campus by CIP Code<br />
Table 4d<br />
CIP Code Award Label # Grads % Grads<br />
51070800 Medical Transcription/Transcriptionist 2 0.2%<br />
51071300 Medical Insurance Coding Specialist/Coder 13 1.3%<br />
51150100 Substance Abuse/Addiction Counseling 5 0.5%<br />
51160100 Nursing - Registered Nurse Training (RN, ASN, BSN, MSN) 87 8.5%<br />
51161300 Licensed Practical /Vocational Nurse Training (LPN, LVN, Cert, Dipl, AAS) 15 1.5%<br />
52020100 Business Administration and Management, General 48 4.7%<br />
52030200 Accounting Technology/Technician and Bookkeeping 8 0.8%<br />
52040100 Administrative Assistant and Secretarial Science, General 87 8.5%<br />
Total 1,026 100.0%<br />
<strong>Lee</strong> <strong>College</strong> Office of Institutional Research 22 of 24
Awards Earned<br />
Huntsville Campus by Number of Awards<br />
Table 4e<br />
CIP Code Award Label # Grads % Grads<br />
49020500 Truck and Bus Driver/Commercial Vehicle Operation 83 15.3%<br />
12050300 Culinary Arts/Chef Training 70 12.9%<br />
01060100 Applied Horticulture/Horticultural Operations, General 58 10.7%<br />
24010300 Humanities/Humanistic Studies 51 9.4%<br />
52020100 Business Administration and Management, General 48 8.9%<br />
48070300 Cabinetmaking and Millwork/Millwright 34 6.3%<br />
48050800 Welding Technology/Welder 33 6.1%<br />
11100200 System, Networking, and LAN/WAN Management/Manager 31 5.7%<br />
47060400 Automobile/Automotive Mechanics Technology/Technician 30 5.5%<br />
47020100 Heating, Air Conditioning, Ventilation and Refrigeration Maintenance<br />
29 5.4%<br />
Technology/Technician (HAC, HACR, HVAC, HVACR)<br />
15030500 Telecommunications Technology/Technician 24 4.4%<br />
11080100 Web Page, Digital/Multimedia and Information Resources Design 22 4.1%<br />
11030100 Data Processing and Data Processing Technology/Technician 21 3.9%<br />
15030300 Electrical, Electronic and Communications Engineering<br />
6 1.1%<br />
Technology/Technician<br />
11020100 Computer Programming/Programmer, General 1 0.2%<br />
47060500 Diesel Mechanics Technology/Technician 1 0.2%<br />
Total 542 100.0%<br />
<strong>Lee</strong> <strong>College</strong> Office of Institutional Research 23 of 24
Awards Earned<br />
Huntsville Campus by CIP Code<br />
Table 4f<br />
CIP Code Award Label # Grads % Grads<br />
01060100 Applied Horticulture/Horticultural Operations, General 58 10.7%<br />
11020100 Computer Programming/Programmer, General 1 0.2%<br />
11030100 Data Processing and Data Processing Technology/Technician 21 3.9%<br />
11080100 Web Page, Digital/Multimedia and Information Resources Design 22 4.1%<br />
11100200 System, Networking, and LAN/WAN Management/Manager 31 5.7%<br />
12050300 Culinary Arts/Chef Training 70 12.9%<br />
15030300 Electrical, Electronic and Communications Engineering<br />
6 1.1%<br />
Technology/Technician<br />
15030500 Telecommunications Technology/Technician 24 4.4%<br />
24010300 Humanities/Humanistic Studies 51 9.4%<br />
47020100 Heating, Air Conditioning, Ventilation and Refrigeration Maintenance<br />
29 5.4%<br />
Technology/Technician (HAC, HACR, HVAC, HVACR)<br />
47060400 Automobile/Automotive Mechanics Technology/Technician 30 5.5%<br />
47060500 Diesel Mechanics Technology/Technician 1 0.2%<br />
48050800 Welding Technology/Welder 33 6.1%<br />
48070300 Cabinetmaking and Millwork/Millwright 34 6.3%<br />
49020500 Truck and Bus Driver/Commercial Vehicle Operation 83 15.3%<br />
52020100 Business Administration and Management, General 48 8.9%<br />
Total 542 100.0%<br />
<strong>Lee</strong> <strong>College</strong> Office of Institutional Research 24 of 24